Abstract
The integrity of coral reef ecosystems worldwide rests on a fine-tuned symbiotic interaction between an invertebrate and a dinoflagellate microalga from the family Symbiodiniaceae. Recent advances in bottom-up shotgun proteomic approaches and the availability of vast amounts of genetic information about Symbiodiniaceae have provided a unique opportunity to better understand the molecular mechanisms underpinning the interactions of coral-Symbiodiniaceae. However, the resilience of this dinoflagellate cell wall, as well as the presence of polyanionic and phenolics cell wall components, requires the optimization of sample preparation techniques for successful implementation of bottom-up proteomics. Therefore, in this study we compare three different workflows—filter-aided sample preparation (FASP), single-pot solid-phase-enhanced sample preparation (SP3), and stop-and-go-extraction tips (STAGETips, ST)—to develop a high-throughput proteotyping protocol for Symbiodiniaceae algal research. We used the model isolate Symbiodinium tridacnidorum. We show that SP3 outperformed ST and FASP with regard to robustness, digestion efficiency, and contaminant removal, which led to the highest number of total (3799) and unique proteins detected from 23,593 peptides. Most of these proteins were detected with ≥2 unique peptides (73%), zero missed tryptic peptide cleavages (91%), and hydrophilic peptides (>70%). To demonstrate the functionality of this optimized SP3 sample preparation workflow, we examined the proteome of S. tridacnidorum to better understand the molecular mechanism of peridinin-chlorophyll-protein complex (PCP, light harvesting protein) accumulation under low light (LL, 30 μmol photon m−2 s−1). Cells exposed to LL for 7 days upregulated various light harvesting complex (LHCs) proteins through the mevalonate-independent pathway; proteins of this pathway were at 2- to 6-fold higher levels than the control of 120 μmol photon m−2 s−1. Potentially, LHCs which were maintained in an active phosphorylated state by serine/threonine-protein kinase were also upregulated to 10-fold over control. Collectively, our results show that the SP3 method is an efficient high-throughput proteotyping tool for Symbiodiniaceae algal research.
1. Introduction
Invertebrate-microalgal symbiosis, and notably the association of corals (cnidarians) with endosymbiotic microalgae (Family Symbiodiniaceae), thrive throughout temperate to tropical marine ecosystems [1]. This symbiosis is sustained through metabolic resource exchange between the partners. The stability of this symbiosis rests on metabolic “compatibility” relative to external resource provisioning (light, nutrients); however, this symbiosis often breaks down (“dysbiosis”) under unfavorable environmental perturbations or stress [2]. Despite intensive efforts for several decades to understand the nature with which this symbiosis functions effectively [2,3], the underlying regulatory mechanisms still remain largely unknown. Moreover, free-living Symbiodinium dinoflagellates thriving in both the water column and benthic sediments experiences considerable variation in irradiance due to changes in weather conditions as well as physical mixing and sediment re-suspension. The increasing influx of genomic and transcriptomic resources for corals [4,5,6,7,8,9] and Symbiodinium [10,11,12] has shifted the “molecular horizon” and now provides unprecedented opportunities to investigate invertebrate–microalgal symbiosis, which may in turn uncover diagnostic tools for more targeted management of this vulnerable ecosystem [13]. However, considering the low transcriptomic changes observed in Symbiodinium to environmental cues found in earlier reports [4,12,13], little is known about the molecular mechanisms of abiotic stress tolerance/acclimation in Symbiodinium. This paucity of a transcriptional response from Symbiodinium in response to stress suggests that post-transcriptional regulatory mechanisms, including translational regulation and post-translational modifications, could drive molecular stress responses in Symbiodinium. When transcript abundances are not always a good proxy for protein abundance, the translated proteins by a cell are directly responsible for the resulting phenotype, and thereby serve as the ultimate effectors of the variations manifested within genomes and/or transcriptomes [14,15]. Therefore, proteomics studies allow for a more realistic picture of the functional cellular response of an organism to environmental stress.
To date, the proteomics insights into cnidarian–microalgal symbiosis have largely stemmed from proteomes of the host invertebrate [16,17] but not the microalgal symbiont. Early investigations of immunoblot analysis of Rubisco, thylakoid D1 protein, and heat shock proteins (HSP) like 75 kDa protein in Symbiodinium sp. isolated from thermally and light-stressed corals, have shown their involvement in environmental stress [18,19,20]. Such proteomic analysis in Symbiodiniaceae has to date mostly relied on two-dimensional gel-based approaches [19,20,21,22]. These approaches are time-consuming, manually intensive, and subject to variations in peptide extraction efficiencies. Additionally, variations amongst replicate gels, a limited molecular weight range, as well as protein co-migration continued to pose technical challenges of all gel-based proteomic approaches. Moreover, the resilient algal cell wall and large amount of polyanionic compounds and secondary metabolites including phenolics, terpenes, and pigments are the major challenges for successful implementation with all proteomic approaches [23].
Given the inherent limitations of gel-based proteomic tools [19,20,21,22], peptide-centric “shotgun” LC/MS proteomics has become a high-throughput tool in tandem mass spectrometry [24]. However, such advancements also pose challenges in sample preparation (including cell lysis, protein solubilization, protein and peptides clean-up, and fractionation). Therefore, a dedicated sample preparation strategy is essential for a robust and sensitive quantitative, bottom-up shotgun proteomics workflow, prior to LC-MS analysis. Sample processing steps include protein extraction, solubilization, denaturation, enzymatic digestion into peptides followed by their purification, fractionation, and separation [24]. These steps employ a diverse array of salts, solvents, surfactants, and chaotropes that affect peptide chromatography, ionization, and ultimately the performance of mass spectrometers [25,26,27]. Removal of all these interfering contaminants is crucial to avoid signal interference during MS analysis.
Recent advances in mass spectrometry (MS) technology have enhanced the proteome characterization capacity across a range of organisms and experimental settings, which has delivered answers to key biological questions. For example, shotgun proteomic workflows in plant and animal proteomics have greatly benefited from innovative support-aided sample preparation workflows such as filter-aided sample preparation (FASP), single-pot solid-phase-enhanced sample preparation (SP3), and stop-and-go-extraction tips (STAGETips; ST) [25,28,29,30,31,32,33,34,35]. These methods have shown high efficiency at micro to nanoscale levels, reproducibility, low cost, and excellent proteome coverage; however, they differ from others in regard to proteome coverage, accuracy, and reproducibility [25]. Moreover, each workflow exhibited some inadequacies related to reagent compatibility, sample loading requirements, number of steps involved, consumable costs, as well as throughput [25,32]. Therefore, developing a specific sample preparation procedure with minimal sample handling steps that is low cost, robust, reproducible, and compatible with different buffers and surfactants, as well as offering a high recovery of peptides, still remains a challenge. Previous studies with animal- and plant-based systems have either modified and/or combined these protocols to build an optimal sample processing workflow suitable to their test organism [28,29,30,31,32,33,34,35].
Here, we explore how recently introduced peptide purification and fractionation approaches, which have rapidly gained widespread popularity in plant- and animal-based systems, can be potentially applied to Symbiodiniaceae algal research. In particular, we evaluate the performance of three support-aided workflows—FASP, SP3 and ST—using a model isolate Symbiodinium tridacnidorum. We hypothesized that one of the methods will outperform the others and potentially be implemented as a practical, sensitive, cost-effective, and high-throughput workflow for Symbiodiniaceae proteomics. We further validate the successful application of the best performing method to understand the molecular mechanism of peridinin-chlorophyll-protein complex (PCP) accumulation observed under low light exposure with Symbiodinium tridacnidorum. PCP is the major light harvesting complex (LHC) in photosynthetic dinoflagellates and its inhibition in Symbiodinium strains under light and thermal stress, suggesting a connection between Symbiodinium PCP and coral bleaching [2].
2. Materials and Methods
2.1. Symbiodinium Culture and Maintenance
Symbiodinium tridacnidorum (ITS2-type A3, CS73) cultures procured at UTS algal culture repository (three biological replicates) were maintained in 100 mL of IMK media using conical flasks under a white fluorescent lamp at an intensity of 120 μmol photon m−2 s−1 (control) within a climate-controlled incubator at 25 °C for 12:12 h light and dark condition, as described previously [36]. The light intensity in the incubator was measured using a light meter (Licor Li-250, LI-COR Biosciences, Lincoln, NE, USA) and a 4Pi sensor (LI-COR Biosciences, Lincoln, NE, USA). The cell density was estimated spectrophotometrically by measuring the optical density at 680 nm (OD680) as well as using a hemocytometer. Algae were inoculated at an initial cell density of 2 × 10⁵ cells/mL and grown in the conditions described above until the end of the exponential growth phase. To establish an optimal sample preparation method for proteomic studies, S. tridacnidorum cultures grown under control light conditions and harvested in late exponential phase were examined using FASP, SP3, and ST based workflows.
2.2. Sample Preparation Workflows for Proteome Profiling
2.2.1. Protein Extraction, Purification, Alkylation-Reduction, and Quantification
Cultures in late exponential phase (100 mL, three biological replicates for each sample preparation workflow) were centrifuged at 8000× g for 10 min at 4 °C. The supernatant was decanted, and cell pellets were re-suspended in 400 µL of buffer containing 8 M Urea, 100 mM triethylammonium bicarbonate (TEAB) (pH 8.5), 1% Triton X-100, 10 mM dithiothreitol (DTT), and protease inhibitor cocktail (Pierce™, Thermo Fisher, Waltham, MA, USA). Using an ultra-sonication probe (Q55 Sonicator, Thomas Scientific, Swedesboro, NJ, USA), cell lysis was performed using cycles lasting 25 s, repeated 5 times with 25 s off-time between sonication cycle, while remaining on ice to avoid excess heating during sonication. Subsequently, samples were centrifuged at 15,000× g for 15 min at 4 °C. Proteins in the supernatant were precipitated in 100% acetone at −20 °C for 3–5 h. Proteins precipitates were re-suspended in a buffer containing 8 M Urea and 100 mM TEAB (pH 8.5), alkylated, and reduced using 10 mM tris(2-carboxyethyl) phosphine (TCEP) and 40 mM chloroacetamide (CAA) at room temperature for 30 min according to Goodman et al. [37]. Protein concentration was determined by SDS-PAGE and densitometry using bovine serum albumin as a standard [38]. An aliquot of 25 μg of protein was used for all subsequent steps.
2.2.2. FASP, SP3, and STAGETips Based Clean-Up, Digestion, and Fractionation
Filter-aided sample preparation (FASP): Alkylated and reduced protein solution (25 µg) was processed through FASP Nanosep® filters (Pall Corporation, Melbourne, Australia, 10 kDa molecular weight cut off). FASP filters were activated with 100 μL of 100 mM TEAB and centrifuged for 15 min at 13,000× g. Protein samples were subsequently loaded onto activated FASP filters and centrifuged at 15,000× g for 45 min following Sielaff et al. [25]. The filters were washed twice each time, first with buffer containing 8 M urea to remove detergents and later with 100 mM TEAB buffer to remove excess urea by centrifuging filters at 12,000× g for 20 min each time. Later, proteins were digested overnight at 37 °C using trypsin (Sigma-Aldrich, St. Louis, MO, USA; reconstituted in 50 mM acetic acid) at an enzyme-to-protein ratio of 1:25 (w/w). Peptides were recovered from the membrane by centrifuging for 20 min at 12,000× g. Peptides were eluted again using 100 μL of water for a second elution. Eluted peptides were pooled and vacuum dried.
Single-pot solid-phase-enhanced sample preparation (SP3). SP3 digest was performed according to Hughes et al. [30] with minor modifications. Briefly, alkylated and reduced protein (25 µg) in 48 µL was mixed with 2 µL of the SP3 bead mix without acidification. SP3 beads were prepared by mixing hydrophilic and hydrophobic Sera-Mag Speed-Beads (GE Healthcare (Chicago, IL, USA)) in a ratio of 1:1 (v/v), reconstituted in water at a concentration of 20 µg bead/µL, and stored at 4 °C. Afterwards, ethanol was added to a final concentration of 50% (v/v) to induce the binding of proteins to the beads. Samples were incubated on a vortex mixer (at slowest speed) for 10 min at room temperature. Subsequently, beads were immobilized by incubation on a magnetic rack for 2 min until beads had migrated to the tube wall. The supernatant was discarded, and the beads were rinsed with 180 µL of 80% (v/v) ethanol, once the tubes were removed from magnetic rack. Tubes were incubated again on the magnetic rack for 5 min, with periodic mixing to enhance surfactant removal. The ethanol washing step was repeated twice to ensure maximal removal of surfactants followed by incubating tubes on the magnetic rack for 1 min. Later, beads were re-suspended in 100 µL of 200 mM ammonium bicarbonate supplemented with trypsin at an enzyme-to-protein ratio of 1:25 (w/w). Trypsin digestion was carried out for an overnight followed by centrifugation at 20,000× g for 1 min. Samples tubes were placed back on the magnetic rack until the beads settled onto the tube wall. Supernatant containing peptides was transferred to a fresh tube and vacuum dried.
Stop-and-go-extraction tips (STAGETips, ST): Columns were manually prepared using Empore SDB-RPS (styrenedivinylbenzene reverse phase sulfonate) with an ordinary pipette tip according to Rappsilber et al. [39]. These SDB-RPS based tips were used for peptide desalting/clean up. For peptides desalting, the trypsin peptides were first acidified with 0.1% trifluoroacetic acid (TFA) (final concentration) and pipetted into the top of a STAGETip column. Columns were centrifuged at 5000 rpm for 1 min followed by washing first with 20 µL of isopropanol+1%TFA and again with 1% TFA followed by centrifugation at 5000 rpm for 1 min each time. Peptides were eluted using 5% ammonium hydroxide and 80% acetonitrile and finally vacuum dried.
Protein/peptide recovery analysis: Purified peptides obtained from each workflow were quantified to assess their recovery percentage while comparing their concentration with the initial protein concentration passed through each workflow using quantitative colorimetric peptide assay kit (Pierce™, ThermoFisher, Waltham, MA, USA).
High-pH Reversed-Phase (HPRP) Fractionation: Dried peptides obtained from all of the tested workflows were re-suspended in a buffer containing 2% acetonitrile and 0.2% trifluoracetic acid, and fractionated (total five fractions) using Pierce™ High pH Reversed-Phase Peptide Fractionation Kit (Thermo Scientific™, Waltham, MA, USA).
2.3. Implementation of Outperformed SP3 Workflow in S. tridacnidorum Exposed to Low Light Conditions
After screening these workflows, the optimal proteomic method of SP3 was used to investigate the molecular mechanism of peridinin-chlorophyll-protein complex (PCP) accumulation in S. tridacnidorum exposed to low light conditions. A total of six cultures were grown under control light conditions (120 μmol photon m−2 s−1) in laboratory conditions as stated earlier at a cell density (2 × 10⁵ cells/mL) until late exponential phase. Subsequently, a set of three cultures was shifted to low light conditions (LL, 30 μmol photon m−2 s−1) for 7 days. Photosynthetic performance (Fv/Fm) was determined using a Phyto-PAM Phytoplankton Analyzer (Walz, Germany), where 2 mL of the culture was dark-acclimated for 15–20 min before taking a measurement. Samples from both control and low light treatments collected after 7 days (post late exponential phase) were processed for proteome analysis following the SP3 workflow.
2.4. LC-MS Analysis of Peptides
Using an LC-MS (Acquity M-class system, Waters, Milford, MA, USA), fractions obtained in each workflow were loaded at 15 µL/min onto a nanoEase C18 trapping column (Waters, Milford, MA, USA) with 2% acetonitrile and 0.1% formic acid for 3 min. The peptides were eluted from the trapping column onto a PicoFrit column (75 µm ID × 250 mm; New Objective, Woburn, MA, USA) packed with C18AQ resin (3 µm; Michrom Bioresources, Auburn, CA, USA). Repeated injections of standard samples (six bovine tryptic digest equal molar mix, New England Biolabs, USA) were used to monitor the instrument stability. Peptides were eluted from the column and into the source of a mass spectrometer (Q Exactive Plus, Thermo Scientific) using the following program: 5–30% MS buffer B (98% acetonitrile + 0.2% formic acid) over 90 min, 30–80% MS buffer B over 3 min, 80% MS buffer B for 2 min, 80–5% for 3 min. The eluting peptides were ionized at 2000 V. A data dependent MS/MS (dd-MS2) experiment was performed, with a survey scan of 350–1500 Da performed at 70,000 resolution for peptides of charge state 2+ or higher with an automatic gain control (AGC) target of 3 × 10⁶ and maximum injection time of 50 ms. The top 12 peptides with high AGC value were fragmented in the higher-energy collisional dissociation (HCD) cell using an isolation window of 1.4 m/z and an AGC target of 1 ×10⁵ and maximum injection time of 100 ms. Fragments were scanned in the Orbitrap analyzer at 17,500 resolution and the product ion fragment masses measured over a mass range of 100–2000 Da. The mass of the precursor peptide was then excluded for 30 s.
3. Statistical Analysis
For proteomic analysis, the resulting raw MS files from each analysis were searched against a customized proteomic database that combines the proteomic datasets of Symbiodinium microadriacticum downloaded from Uniprot (https://www.uniprot.org/proteomes/UP000186817, accessed on 15 January 2021) and proteomic datasets for Symbiodiniaceae algae including Fugacium kawagutii, Breviolum minutum, Symbiodinium sp., and Cladocopium sp. (http://sampgr.org.cn/, accessed on 15 January 2021) using PEAKS Studio v8.5 (Bioinformatics Solutions, Waterloo, ON, USA) for protein identification. MS raw data files of each fraction obtained in a workflow were processed in PEAKS Studio v8.5 individually and also in combination. The search parameters were set as follows: tolerance of one missed cleavage of trypsin, oxidation (M) for methionine as the variable modifications, and carbamidomethyl (C) for cysteine as fixed modifications. Three missed cleavage sites were allowed, with a parent and fragment mass error tolerance of 20 ppm and 0.1 Da, respectively. The charge states of peptides were set to +2 and +3. The threshold selection for random protein sequences was a PEAKS probability-based ion score greater than 15 and false-discovery rate of 0.1%. Automated variance stabilization, normalization, isotopic correction, and median correction were selected as pre-setting parameters in PEAKS studio v8.5 software and to perform PEAKS ANOVA between replicate conditions to determine significance and fold change (>2-folds). A protein with at least one unique peptide was considered for protein identification, protein quantification, and regulation analysis.
Functional descriptions of differentially expressed proteins were retrieved using Blast2GO (ver. 5.2, BioBam Bioinformatics Solutions, Valencia, Spain). The gene ontology (GO) classification was done using UniProt-GOA database and InterProScan software (European Bioinformatics Institute, Cambridgeshire, United Kingdom). Physiochemical properties of proteins and peptides including isoelectric point (pI), protein molecular weight (MW), and protein grand average of hydropathy (GRAVY) scores were calculated using the ProtParam tool from ExPASy [40] using R-script that was developed in-house.
For chlorophyll (Chl a) fluorescence and growth measurements, one-way ANOVA analysis at p < 0.01 and 0.05 was performed using IBM-SPSS Statistics 19 software, and the values were represented as the mean of three biological replicates with standard deviation (n = 3 ± S.D.).
4. Results and Discussion
To minimize the sample handling and keep the experimental parameters constant between the workflows of each technique, (1) proteins were extracted in a urea-based lysis buffer using an ultrasonic probe, (2) samples were alkylated and reduced outside the filters or paramagnetic beads, and (3) an aliquot of 25 µg protein was tested for each workflow followed by fractionation using high pH reversed-phase peptide fractionation column.
4.1. Sample Processing Timing Workflow for Protein Sample Preparation Methods
In the present study, proteins that were common in all three biological replicates of each workflow were used for statistical and proteomic analysis. Both SP3 and ST workflows resulted in >89% identification match amongst the biological replicates; however, FASP exhibited ~78% protein match (data not shown), confirming the high reproducibility of the other workflows.
Figure 1 shows the experimental time required to complete each workflow, wherein ST was the quickest, followed by SP3 and FASP. In each workflow, three steps including protein extraction and precipitation, alkylation and reduction, and digestion were the major time-consuming steps representing >70% of the total protocol time for each workflow. FASP appeared to be the longest workflow, requiring nearly 16 h, with extended protein desalting and peptide recovery steps (3 h) compared to 30 min in SP3 and 20 min in ST. Compared to FASP and ST, the SP3 workflow required longer time (20 min) in column preparations and activation for hydrophilic and hydrophobic beads, followed by ethanol equilibration to induce protein binding with beads.
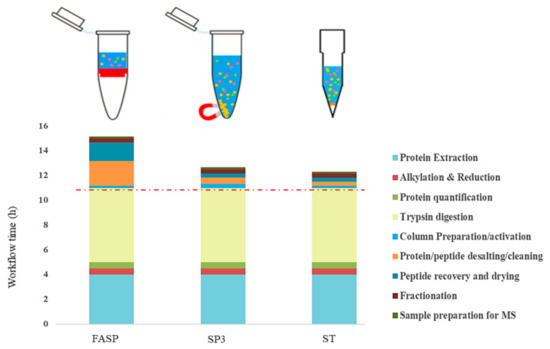
Figure 1.
Schematic description of the workflow timing for filter-aided sample preparation (FASP), single-pot solid- phase-enhanced sample preparation (SP3), and stop-and-go-extraction tips (STAGETips, ST) based protein sample preparation methods.
FASP has shown to be a lengthy preparation process, due to repetitive centrifugation steps which involved about 20 min per cycle to pass 200 μL of solution through a 10–30 kDa MWCO membrane at high ultra-centrifugal speed, then draining off interfering substances, and finally recovery of peptides after digestion [33]. Therefore, to shorten the FASP processing time in this study, we alkylated and reduced the proteins outside of the filters to remove some of the centrifugation steps. Further, in this step, we replaced iodoacetamide (IAA) and dithiothreitol (DTT) with tris(2-carboxyethyl) phosphine (TCEP) and chloroacetamide (CAA), respectively, for the alkylation reduction of proteins. By combining the alkylation and reduction steps using TCEP and CAA, we could further shorten this process from 90 to 30 min and prevented over-alkylation and modification of undesired amino acid residues [37]. Similar approaches of performing alkylation and reduction steps prior to protein loading onto FASP filters was performed recently with mammalian neuroblastoma cell line proteomics using a detergent-free filter-based protein digestion (FPD) strategy [41].
New innovations designed to shorten the original FASP processing time have recently been developed and tested in mammalian cells proteomics. These innovations include suspension trapping (S-Trap; [42]), enhanced FASP (eFASP; [43]), and modified FASP (mFASP; [44]) methods. These methods are developed by either replacing membrane filters with a stack of quartz fibers or using commercial detergent removal spin column (DRSC) or replacing urea with sodium deoxycholate (SDC). Such modifications have considerably reduced the centrifugation time and also enhanced the trypsin digestion. Recently, Li et al. [45] successfully implemented mFASP methodology with the microalgae Chlamydomonas reinhardtii by replacing urea with SDC. Therefore, these modified FASPs protocols individually or in combination should be tested in marine microalgal species in the future.
Tryptic digestion of proteins is a fundamental step for bottom-up proteomics sample preparation. Protein digestion efficiency depends on the type of enzymes, protein-to-enzyme ratio, temperature, and incubation time. Based on our previous experience [38], we incubated the protein lysate overnight at 37 °C at an enzyme-to-protein ratio of 1:25 in all the workflows tested. In the present study, these conditions appeared to be optimal in all the workflows, as >86% peptides were detected with zero missed cleavages. However, studies have demonstrated that the cleavage time can be reduced by accelerating the enzyme activity using microwave irradiations [46]. Increasing protein concentration or the trypsin-to-protein ratios, as well as adding LysC during digestion, has been found to reduce the missed cleavage sites and enhance digestion efficiency [47]. Overall, in the present study both SP3 and ST were found to be quicker in terms of workflow processing time. Recently, exclusion of the reduction/alkylation steps and reducing protein fixation incubation on paramagnetic beads to 2 min with the SP3 based sample preparation method was found to shorten the workflow time without impacting the digest quality [48,49].
4.2. Differences in Protein and Peptides Identified, Their Quality Parameters, and Gene Ontology Analysis in Different Protein Sample Preparation Workflows
Among the three tested workflows, substantial differences were observed in proteins and peptide detection, protein sequence match (PSM), and unique peptide numbers in each sample preparation technique. We were able to detect between 1552 to 3799 proteins encoding from 1302 to 3191 annotated genes and with peptide detection rates ranging from 5413 to 23,593 amongst different sample preparation techniques (Figure 2A,B). The total PSM number among the techniques ranged from 7153 to more than 98,000 (Supplementary Figure S1). The PSM score distribution in both SP3 and ST illustrated the data was of high quality and, so, yielding confidence in our inference, compared to FASP, with very few decoy matches in the high score region. Additionally, the majority of the PSM were found to be of high scoring points as they were centered on the mass error of zero (Supplementary Figure S1).
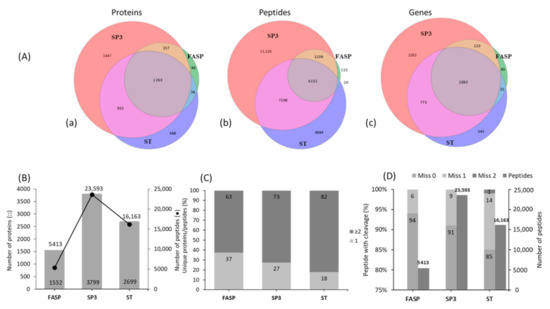
Figure 2.
Comparison of protein and peptides numbers identified in filter-aided sample preparation (FASP), single-pot solid-phase-enhanced sample preparation (SP3), and stop-and-go-extraction tips (STAGETips, ST) based protein sample preparation workflows. (A) Venn diagram showing the overlap of proteins (a), peptides (b), and annotated genes (c); total number of identified proteins and peptides (B); Percentage of unique peptides among proteins identified with 1 and ≥2 unique peptides (C); Percentage of identified peptides containing zero, one, and two missed tryptic cleavages (D) for each workflow combined from three biological replicates (n = 3).
SP3 outperformed FASP and ST with 1.5- to 4.5-fold (p < 0.05) higher proteins and peptides detected. FASP was least effective for protein and peptide detection numbers and followed a trend where SP3 > ST > FASP. A greater proportion of identified proteins were found to be overlapping (28%) among all of the methods (Figure 2A(a)). SP3 and ST showed a greater number of unique protein identifications over FASP. Specifically, SP3 only identified around 33% of unique proteins (1447) compared to ST and FASP, whereas only 10% and 2% of unique proteins were detected, respectively (Figure 2A(a)).
Like proteins, a similar trend was observed for peptide identification, where SP3 exhibited the highest number (11,225 correspond to >39%) of uniquely identified peptides (Figure 2A(b)). However, only a small fraction (4151 peptides), corresponding to 14% of total peptides, were found to overlap with all the methods. These results were substantiated using gene annotations, with the highest number of total and unique gene annotations observed in SP3, followed by ST and FASP (Figure 2A(c)). Interestingly, both ST and SP3 resulted in the majority of proteins identified with more than two unique peptides with corresponding values of 82% and 73%, respectively. However, in the FASP method, only 63% of proteins were detected with >2 unique peptides and 47% of proteins with one unique peptide (Figure 2C).
The exceptional performance of SP3 in identifying the highest percentage of total and unique proteins and peptides could be attributed to its greater efficiency for purifying protein and peptides with high yield, which was not observed in other methods. In the present study, both SP3 and ST workflows recovered peptides to >87%, compared to FASP with only 69% peptides recovery (Supplementary Figure S2). In line with our findings, both SP3 and ST based sample preparation workflows performed better than FASP in human cervix carcinoma cell lines [25]. In the original FASP workflow [28,33], typically 60–70% protein-to-peptide yield is suggested using 10–100 μg of starting protein sample. However, protein sample loss associated with FASP digestion workflow has been observed with protein quantity-limited samples [25]. Further, filter type and shape have been shown to influence the FASP performance (REF). Filters with low molecular weight cutoff (MWCO; 3–10 K) not only add to the centrifugation time during protein and peptide clean-up but also lead to poor peptide recovery [25]. Considering this, the use of 10K MWCO filters with protein sample size of 20 μg could be the reason for poor FASP performance in this study. Therefore, using filters with 30K MWCO together with a larger starting amount of protein material and sequential digestion with multiple enzymes should be considered in the future to improve the FASP performance [25,28,33].
We further investigated if the higher number of unique peptides observed in SP3 and ST were merely artifacts arising from high missed tryptic cleavage during digestion. Interestingly, all the methods showed high trypsin digestion efficiency, wherein >90% of peptides were identified with no missed cleavages in both SP3 and FASP workflows (Figure 2D). However, peptides identified in ST had a slightly lower percentage of no miss-cleavage (85%), while only 14% of peptides contained one miss-cleavage. Higher total peptide yields were accompanied by a reduction in peptides with missed cleavages [25,28].
Gene ontology (GO) analysis also revealed a bias toward a specific protein class with biological, molecular, and cellular function (Supplementary Table S1) in different workflows. A large proportion of proteins belonging to biological processes, including protein chromophore linkage, carbohydrate metabolism, and calcium ion binding, were enriched in both SP3 and ST workflows compared to FASP. Interestingly, proteins linked to cellular processes, including integral components of membrane proteins, were a major class detected in all the three workflows (Supplementary Table S1).
The observed biases for enriching certain classes of proteins in SP3 and ST, but not in FASP, could be related to protein loss in FASP during the clean-up process. FASP and SP3 involve the digestion on filters and beads, respectively, whereas ST does the same in solution, i.e., outside filters. Therefore, the digestion process and kind of filters/beads used in the sample preparation process could lead to GO biases of certain protein groups. Moreover, it appeared that the protein extraction buffer used in this study was efficient in extracting membrane proteins as observed in all the tested workflows. Sielaff et al. [25], however, did not reveal any bias toward a specific protein class or sub-cellular localization in the HeLa cell lysates using similar workflows.
4.3. Physiochemical Properties of Proteins and Peptides Detected Different Protein Sample Preparation Workflows
We further investigated the physicochemical properties of our extracted proteins including isoelectric point (pI), molecular weight (Mw), and grand average of hydropathy (GRAVY) score of the proteins and peptides detected in each workflow to identify if any bias towards specific pI/Mw values, or hydrophobic or hydrophilic proteins, existed. Interestingly, no specific bias was observed regarding these physicochemical properties for the proteins identified in this study. All the workflows displayed a propensity to enrich proteins of pI 5–9; Mw 50–400 kDa, and GRAVY score negative 0–0.5 (i.e., hydrophilic proteins) (Figure 3A).
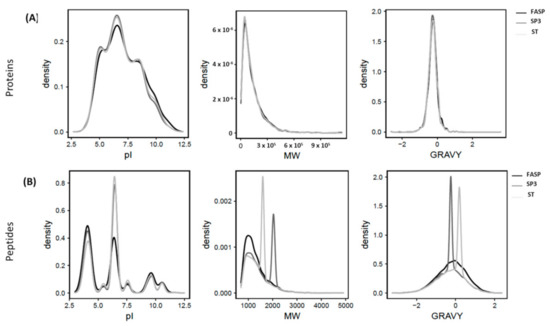
Figure 3.
Distribution of isoelectric point (pI), molecular weight (Mw), and grand average of hydropathy (GRAVY) score for the proteins (A) and peptides (B) identified in filter-aided sample preparation (FASP), single-pot solid-phase-enhanced sample preparation (SP3), and stop-and-go-extraction tips (STAGETips, ST) based protein sample preparation workflows in Symbiodinium tridacnidorum combined from three biological replicates (n = 3).
In contrast, considerable differences were observed at the peptide level (Figure 3B). In both SP3 and ST workflows, peptides were enriched with pI values between 6–7 (>43%, p < 0.01) compared to FASP, where only 29% of total peptides were detected in this range. Further, the majority of identified peptides in SP3 and ST exhibited MW in the range of 1–2 kDa with their corresponding proportion of 53% and 77%, respectively, compared to 69% in FASP. Interestingly, a significant proportion of peptides (29%) identified in SP3 were from Mw range of 2–2.5 kDa. Occurrence of these large peptides could possibly be correlated with membrane proteins extracted in this workflow that might be precipitated and digested well in the SP3 workflow. Regarding peptide GRAVY scores, >73% of identified peptides in SP3 were hydrophilic with peak values observed with scores of −0.5–0 (45%) compared to ST, where nearly 60% of peptides were hydrophobic with peak value scores of +0–0.5 (44%) (Figure 3B). However, in FASP, peptides were slightly more hydrophilic (54%) compared to hydrophobic (46%). These results are in line with the findings of Dimayacyac-Esleta et al. [50] who demonstrated the enhanced coverage of hydrophobic peptides with GRAVY scores of 0.25−0.5 in the peptides purified using HpH-RP STAGETip (Hp-RP-ST) columns. Unlike our findings, cellular digests processed with SCX STAGETips, and high-/low-pH reversed phase fractionation [51] and OFFGel pre-fractionation [52] was shown to be rich in hydrophilic peptides with a loss of a significant proportion of hydrophobic peptides during sample handling procedures. In contrast to our findings, no discernible differences were observed in physiochemical properties of peptides detected in FASP, SP3, and iST workflows, with a 10–20 μg of yeast [25,30] and HeLa cell protein lysate [32]. Like our observations, a comparable distributions of protein Mw and GRAVY scores (negative) were observed in the identified proteins and peptides processed through SP3 beads and MagReSyn hydrophilic interaction chromatography (HILIC) beads [49,53]. Therefore, these reports support our findings for the loss of hydrophobic peptides to some extent in SP3 and their considerable retention with ST workflows.
4.4. Evaluation of Single-Pot Solid-Phase-Enhanced Sample Preparation (SP3) Workflow to Reveal Proteome Regulation in Symbiodinium Tridacnidorum Under Low Light Growth
Since SP3 outperformed ST and FASP, we tested this workflow to examine the proteome regulation in S. tridacnidorum cultured in laboratory condition at 30 µmol photons m−2 s−1 (low light, LL) compared to 120 μmol photons m−2 s−1 (control) light intensities. Our preliminary observations suggested a slow growth but higher photosynthetic performance (Figure 4A) and a 4-fold accumulation of peridinin-chlorophyll-protein complex (PCP) when cultures shifted from control light to low light in late exponential growth phase for 7 days (Supplementary Figure S3A,B). In this study, we successfully employed the SP3 workflow to better understand the molecular mechanism of PCP accumulation at the proteomic level in symbiotic dinoflagellate cells exposed to low light.
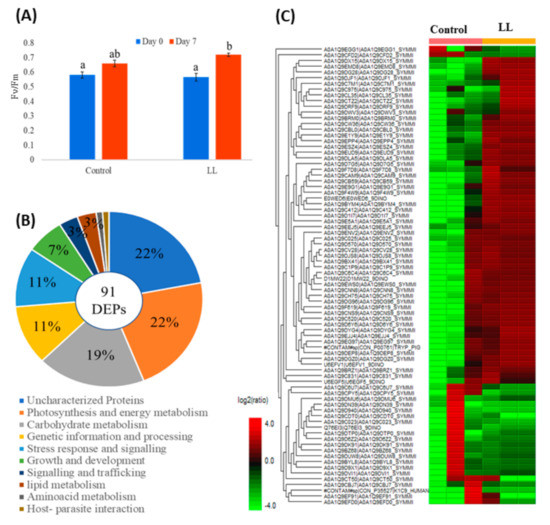
Figure 4.
Proteome profiling in Symbiodinium tridacnidorum. Photosynthetic performance (Fv/Fm) (A); differential expressed proteins with their functional classification (B); and heat map of differentially expressed proteins (DEPs) (C) in Symbiodinium tridacnidorum grown under control (120 μmol photon m−2 s−1) and low light (30 μmol photon m−2 s−1) conditions for 7 days from three biological replicates (n = 3). Different lower-case letters in (A) represent the statistical difference in photosynthetic performance (p < 0.05) of Symbiodinium tridacnidorum cultures grown under control (120 μmol photon m−2 s−1) and low light (30 μmol photon m−2 s−1) stress condition for 7 days.
The SP3 protocol enabled us to identify on average 2682 proteins and 20,763 peptides among the three cultures. However, only 91 proteins (with >1600 peptides detected) were found to be differentially expressed (DEPs) with >2-fold regulation (p < 0.05) in these cultures (Figure 4B,C). Among these DEPs, 22% of proteins belonged to photosynthesis and energy metabolism followed by carbohydrate (19%), genetic information and processing (11%), and stress response (11%) (Figure 4B). Interestingly, a significant proportion of DEPs (22%) were identified as uncharacterized proteins due to limited availability of S. tridacnidorum proteome information in the Uniprot database. Further, the GO analysis of these DEPs revealed a significant enrichment of molecular function GO term including photosystem, chlorophyll, ATP, and heme-binding proteins (Supplementary Figure S4B) evaluated to be localized primarily to integral membrane components, thylakoid and plastids (Supplementary Figure S4C).
Low light stress led to the accumulation of light harvesting proteins including chlorophyll a/c2-peridinin-protein-complex (acpPCs) possibly through mevalonate-independent pathway.
A range of proteins belonging to photosystems and energy metabolism were abundant under LL conditions (Supplementary Table S2). Various subunits of photosystem I (PSI; PsaD, PsaF) and photosystem II (PSII; PsbA, PsbD and PsbV), ATP synthases, ferredoxin NADP reductase (FNR), and light harvesting proteins including fucoxanthin chl a/c binding protein (FCPs) were increased in abundance by 2- to 4-fold (p < 0.05) (Figure 5). A higher abundance of PSI proteins suggests optimal excitation energy transfer to PSI, preventing reactive oxygen species generation that may cause photoinhibition of PSII [54]. However, the increased abundance of PsbA (D1), PsbD (D2) and PsbV (Cytc550), which are the core proteins of PSII and involved in its biogenesis and maintenance, suggests that PSII–LHCII supercomplex remained intact under low light conditions and that it moderates the transfer of light energy from LHCII to PSI.
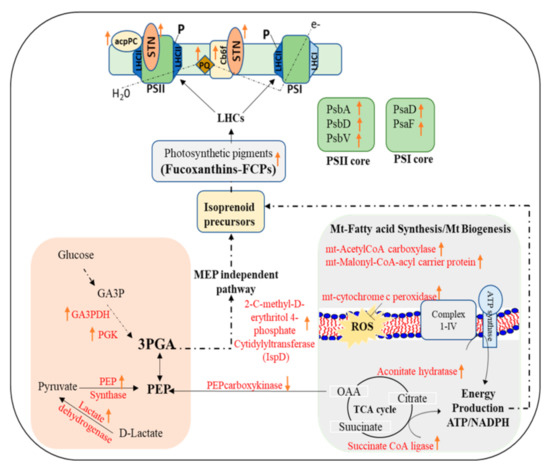
Figure 5.
Schematic description of the molecular mechanism of peridinin-chlorophyll-protein complex (PCP) light harvesting protein accumulation under low light in Symbiodinium tridacnidorum. This involves the upregulation of mevalonate-independent pathway and mitochondrial biogenesis for isoprenoid based photosynthetic pigments biosynthesis. STN—Serine/threonine-protein kinase; LHC—light harvesting complex; GA3P—glyceraldehyde phosphate; GA3PDH—glyceraldehyde phosphate dehydrogenase; PGK—phosphoglycerate kinase; PEP-phosphoenol pyruvate; OAA-oxaloacetate; PGA—phosphoglycerate; FCPs—fucoxanthin Chl a/c protein complex; acpPC—chlorophyll a–chlorophyll c2–peridinin-protein-complex; PS—photosystem; P—phosphorylation.
In our present study, the upregulation of FCPs and chlorophyll a/c2-peridinin-protein-complex (acpPCs) under low light conditions is similar to the findings of Bobeszko [55], which suggest the light harvesting role of these proteins to transport light energy to the photosynthetic apparatus. The adaptative capacity of LHC to light, thermal, and nutrient stress have been explained previously, wherein LHCs improves the energy capturing in low light and induces the thermal dissipation of excess energy absorbed under high light conditions [56,57,58]. In contrast to our findings, Xiang et al. [59] observed the accumulation of transcripts encoding acpPC in Symbiodiniaceae cells (from the genera Clodocopium and Durusdinium) cultures when transferred from LL (40 μmol photons m−2 s−1) to moderate and high conditions (100–500 μmol photons m−2 s−1).
Interestingly, we observed a higher abundance of serine/threonine-protein kinase (STN protein) (>10-folds; p < 0.01; Supplementary Table S2) together with significant increases in the abundance of photosystem II (PSII) D1 and D2 proteins and cytochrome c6 under LL conditions, which suggests light-induced dynamic modulation and phosphorylation of photosystem (Figure 5). These findings correlated well with the photobiology observations, wherein photosynthetic efficiency Fv/Fm was found higher in cells cultured in LL. It suggests activated STNs via binding of plastoquinol to the cytochrome b6f complex phosphorylate PSII D1, D2, CP4, and LHCII subunits under low light intensities [60]. STNs mediated LHCII phosphorylation is essential to regulate the distribution of excitation energy to PSII and PSI under low light, where the thermal dissipation of excitation energy is low and energy transfer from LHCII to the photosystems must be efficient [61]. However, significant accumulation of serine/therionine protein phosphatases (PP) under growth light (control) in the present study suggests their role in PSII core dephosphorylation and degradation of damaged D1 protein for PSII repair and ROS homeostasis [62].
The abundance of both phosphoenol pyruvate synthase (PEPS; 2.2-fold, p < 0.05) and lactate dehydrogenase (3.9-fold, p < 0.01) were significantly increased along with a decreased abundance of phosphoenol pyruvate carboxykinase (PEPCK; 0.4-fold, p < 0.05) also observed under LL condition. PEPS catalyzes an essential step in the Calvin cycle and converts pyruvate into phosphoenolpyruvate (PEP). This suggests the induction of PEP synthesis in cells for its utilization either as an energy source for the phosphotransferase system of sugar uptake under stress conditions [63] or as a precursor for isoprenoid molecules such as fucoxanthin/peridinin (a major component of light harvesting complexes- fucoxanthin/peridinin chl-binding protein; FCPs/PCPs) under LL conditions [64]. A range of FCPs and PCPs were found to be increased in abundance (2–5 folds, p < 0.05) under LL conditions (Table S2). Further, a significant increase (3.8-fold, p < 0.01) of plastid localized 2-C-methyl-D-erythritol 4-phosphate cytidylyltransferase (IspD) was observed in LL conditions. IspD is an essential enzyme in the mevalonate-independent pathway (MEP) to supply isoprenoid precursors for photosynthetic pigments [65] (Figure 5). All these results suggest that LL conditions favor isoprenoid precursor synthesis for photosynthetic pigments and fucoxanthin. A significant increase of GAPDH (7 folds, p < 0.01) and phosphoglycerate kinase (PGK) (2.8 folds, p < 0.05) was observed in LL compared to control. GAPDH and PGK together convert glyceraldehyde-3-phosphate (GAP) into 3-phosphoglycerate (3-PG) through glycolysis and the Calvin cycle, (i) playing critical roles in carbon and nitrogen metabolism via phosphorylated pathway of serine biosynthesis [66], and (ii) providing isoprenoid precursors in the mevalonate-independent pathway [65] (Figure 5).
In the present study, increased abundance of mitochondrial acetylCoA carboxylase and Malonyl-CoA-acyl carrier protein transacylase suggests LL favors mitochondrial fatty acid synthesis (mtFAS) that is essential for mitochondrial biogenesis. It appeared that mtFAS under LL conditions is required for respiratory chain assembly and function, and lipoic acid synthesis (co-factor of several mitochondrial enzymes) to meet increased metabolic demand possibly for isoprenoids synthesis (Figure 5) [67]. Furthermore, the upregulation of mitochondrial cytochrome c-peroxidase (mtCcP) under LL conditions indicates its role in detoxifying the reactive oxygen species (ROS) that would have been generated due to enhanced respiratory processes under LL conditions during mitochondrial biogenesis. In symbiotic cnidarians, the regulation of mitochondrial integrity and associated cell-signaling pathways has been proposed as a component of their response to acute abiotic stressors such as low light [68].
5. Conclusions
In this work, for the first time we compared the performance of three sample preparation techniques (FASP, SP3, and ST) for bottom-up shotgun proteotyping in Symbiodiniaceae. Among the three tested workflows, SP3 outperformed FASP and ST with a total sample processing time of nearly 6 h starting from protein extraction to injecting samples into the LCMS (excluding trypsin digestion). SP3 provides better quality peptide detection with high (i) number of unique peptides, (ii) percentage of zero missed tryptic cleavage peptides, (iii) protein sequence match scores, and (iv) percentage of uniquely identified proteins. Further, in the SP3 workflow, sample preparation was carried out in a single reaction vessel—therefore preventing sample loss during the process—and required only a small amount of protein lysate. The SP3 workflow successfully revealed the proteome regulation in Symbiodinium exposed to low light stress. It appeared that algal cells in LL upregulated their light harvesting complex proteins, namely fucoxanthin chl a/c binding protein (FCPs), chlorophyll a/c2-peridinin-protein-complex (acpPCs), and various other proteins associated with PSI and PSII, to capture more light and yield more photosynthetic electron transfer. Cells maintained their regular supply of these photosynthetic pigments from the mevalonate-independent pathway by utilizing carbon and nitrogen reserves for isoprenoid precursor synthesis. Furthermore, cells modulated their mitochondrial fatty acid synthesis (mtFAS) and TCA cycle to maintain proper respiratory chain assembly and function to meet enhanced energy demand possibly for pigments synthesis under LL conditions. Overall, the SP3 based sample preparation workflow was found to be robust and provides a high-throughput bottom-up proteotyping tool for Symbiodiniaceae-based algal research to better understand the molecular mechanism underpinning the coral-Symbiodinium association.
Supplementary Materials
The following are available online at https://www.mdpi.com/article/10.3390/pr9060983/s1, Figure S1: Distribution of protein sequence match (PSM) score plots in filter aided sample preparation (FASP), single-pot solid-phase-enhanced sample preparation (SP3), and stop-and-go-extraction tips (STAGETips, ST) based protein sample preparation workflows in Symbiodinium tridacnidorum combined from three biological replicates (n = 3), Figure S2: Protein/peptide recovery from filter-aided sample preparation (FASP), single-pot solid-phase-enhanced sample preparation (SP3), and stop-and-go-extraction tips (STAGETips, ST) based protein sample preparation workflows in Symbiodinium tridacnidorum combined from three biological replicates (n = 3 ± S.D). Different lower-case letters represent the statistical difference for peptide recovery at p < 0.05 among all the tested methods, Figure S3: Time courses of cell density of Symbiodinium tridacnidorum cultures (A) and peridinin-chlorophyll-protein complex (PCP) accumulation (B) in cultures grown under varying light conditions. Before being transferred to 30 µmol m−2 s−1 (low light, LL), cultures were developed under 120 µmol m−2 s−1 (control). Light shift was performed at the late exponential phase (day 14) for 7 days; Figure S4: Gene ontology (GO) assignment involve in biological (A), molecular (B) and cellular (C) functions for differentially expressed proteins (DEPs) identified in Symbiodinium tridacnidorum cultures grown under control (120 μmol photon m−2 s−1) and low light (30 μmol photon m−2 s−1) stress condition for 7 days from three biological replicates (n = 3), Table S1: Gene ontology (GO) assignment involve in biological, molecular and cellular functions with GO count for the proteins identified in filter-aided sample preparation (FASP), single-pot solid- phase-enhanced sample preparation (SP3), and stop-and-go-extraction tips (STAGETips, ST) based protein sample preparation workflows in Symbiodinium tridacnidorum, Table S2: List of differentially expressed proteins (DEPs) with their statistical scoring, protein descriptions and expression level (ratio over control values, ≥2 fold, p < 0.01 and 0.05) identified in Symbiodinium tridacnidorum grown under control (120 μmol photon m−2 s−1) and low light (30 μmol photon m−2 s−1) conditions for 7 days (three biological replicates; n = 3). Extracted proteins were processed using SP3 workflow for protein sample preparation.
Author Contributions
K.M.S. executed the study. K.M.S., M.K., P.J.R., M.P.P. and D.J.S. planned the experimental design. D.J.S. kindly provided the Symbiodinium tridacnidorum cultures. P.J.R. and D.J.S. funded the research. M.J.M. and B.S. contributed in bioinformatic and statistical analysis. K.M.S. conducted the analyses and interpretations, with contributions from M.K., M.P.P. and P.J.R. M.K. and K.M.S. wrote the manuscript with inputs from P.J.R., M.P.P. and D.J.S. All authors have read and agreed to the published version of the manuscript.
Funding
This work was funded by ARC linkage grant (LP150100751) to PJR and DJS, and UTS IRS Scholarship to KMS. MK is grateful to the Australian Academy of Sciences for awarding him the Thomas Davies Research Grant (2018) that was partially utilized to cover sample analysis costs at the proteomic facility, University of Technology Sydney (UTS).
Institutional Review Board Statement
Not applicable.
Informed Consent Statement
No conflicts, informed consent, or human or animal rights are applicable to this study.
Data Availability Statement
Not applicable.
Conflicts of Interest
The authors declare that the research was conducted in the absence of any commercial or financial relationships that could be construed as a potential conflict of interest.
References
- LaJeunesse, T.C.; Parkinson, J.E.; Gabrielson, P.W.; Jeong, H.J.; Reimer, J.D.; Voolstra, C.R.; Santos, S.R. Systematic revision of Symbiodiniaceae highlights the antiquity and diversity of coral endosymbionts. Curr. Biol. 2018, 28, 2570–2580. [Google Scholar] [CrossRef]
- Suggett, D.J.; Smith, D.J. Coral bleaching patterns are the outcome of complex biological and environmental networking. Glob. Chang. Biol. 2020, 26, 68–79. [Google Scholar] [CrossRef]
- Oakley, C.; Davy, S. Cell biology of coral bleaching. In Coral Bleaching; Springer: Cham, Switzerland, 2018; pp. 189–211. [Google Scholar]
- Barshis, D.J.; Ladner, J.T.; Oliver, T.A.; Seneca, F.O.; Traylor-Knowles, N.; Palumbi, S.R. Genomic basis for coral resilience to climate change. Proc. Natl. Acad. Sci. USA 2013, 110, 1387–1392. [Google Scholar] [CrossRef]
- Fuller, Z.L.; Mocellin, V.J.L.; Morris, L.A.; Cantin, N.; Shepherd, J.; Sarre, L.; Peng, J.; Liao, Y.; Pickrell, J.; Andolfatto, P.; et al. Population genetics of the coral Acropora millepora: Toward genomic prediction of bleaching. Science 2020, 369, 268–278. [Google Scholar] [CrossRef]
- Pinzón, J.H.; Kamel, B.; Burge, C.A.; Harvell, C.D.; Medina, M.; Weil, E.; Mydlarz, L.D. Whole transcriptome analysis reveals changes in expression of immune-related genes during and after bleaching in a reef-building coral. R. Soc. Open Sci. 2015, 2, 140214. [Google Scholar] [CrossRef] [PubMed]
- Rosic, N.; Kaniewska, P.; Chan, C.K.; Ling, E.Y.; Edwards, D.; Dove, S.; Hoegh-Guldberg, O. Early transcriptional changes in the reef-building coral Acropora aspera in response to thermal and nutrient stress. BMC Genom. 2014, 15, 1052. [Google Scholar] [CrossRef] [PubMed]
- Shinzato, C.; Inoue, M.; Kusakabe, M. A snapshot of a coral “holobiont”: A transcriptome assembly of the scleractinian coral, Porites, captures a wide variety of genes from both the host and symbiotic zooxanthellae. PLoS ONE 2014, 9, e85182. [Google Scholar] [CrossRef] [PubMed]
- Lin, S.; Yu, L.; Zhang, H. Transcriptomic Responses to Thermal Stress and Varied Phosphorus Conditions in Fugacium kawagutii. Microorganisms 2019, 7, 96. [Google Scholar] [CrossRef] [PubMed]
- Lin, S.; Cheng, S.; Song, B.; Zhong, Z.; Lin, X.; Li, W.; Li, L.; Zhang, Y.; Zhang, H.; Ji, Z.; et al. The Symbiodinium kawagutii genome illuminates dinoflagellate gene expression and coral symbiosis. Science 2015, 350, 691–694. [Google Scholar] [CrossRef]
- Bayer, T.; Aranda, M.; Sunagawa, S.; Yum, L.K.; DeSalvo, M.K.; Lindquist, E.; Coffroth, M.A.; Voolstra, C.R.; Medina, M. Symbiodinium transcriptomes: Genome insights into the dinoflagellate symbionts of reef-building corals. PLoS ONE 2012, 7, e35269. [Google Scholar] [CrossRef]
- González-Pech, R.A.; Ragan, M.A.; Chan, C.X. Signatures of adaptation and symbiosis in genomes and transcriptomes of Symbiodinium. Sci. Rep. 2017, 7, 15021. [Google Scholar] [CrossRef]
- Parkinson, J.E.; Baker, A.C.; Baums, I.B.; Davies, S.W.; Grottoli, A.G.; Kitchen, S.A.; Matz, M.V.; Miller, M.W.; Shantz, A.A.; Kenkel, C.D. Molecular tools for coral reef restoration: Beyond biomarker discovery. Conserv. Lett. 2020, 13, e12687. [Google Scholar] [CrossRef]
- Vélez-Bermúdez, I.C.; Schmidt, W. The conundrum of discordant protein and mRNA expression. Are plants special? Front. Plant Sci. 2014, 5, 619. [Google Scholar]
- Manzoni, C.; Kia, D.A.; Vandrovcova, J.; Hardy, J.; Wood, N.W.; Lewis, P.A.; Ferrari, R. Genome, transcriptome and proteome: The rise of omics data and their integration in biomedical sciences. Brief Bioinform. 2018, 19, 286–302. [Google Scholar] [CrossRef]
- Mayfield, A.B. Proteomic Signatures of Corals from Thermodynamic Reefs. Microorganisms 2020, 8, 1171. [Google Scholar] [CrossRef] [PubMed]
- Reynolds, D.A.; Yoo, M.-J.; Dixson, D.L.; Ross, C. Exposure to the Florida red tide dinoflagellate, Karenia brevis, and its associated brevetoxins induces ecophysiological and proteomic alterations in Porites astreoides. PLoS ONE 2020, 15, e0228414. [Google Scholar] [CrossRef] [PubMed]
- Warner, M.E.; Fitt, W.K.; Schmidt, G.W. Damage to photosystem II in symbiotic dinoflagellates: A determinant of coral bleaching. Proc. Natl. Acad. Sci. USA 1999, 96, 8007–8012. [Google Scholar] [CrossRef] [PubMed]
- Castillo-Medina, R.E.; Islas-Flores, T.; Villanueva, M.A. Phosphorylation/dephosphorylation response to light stimuli of Symbiodinium proteins: Specific light-induced dephosphorylation of an HSP-like 75 kDa protein from S. microadriaticum. PeerJ. 2019, 7, e7406. [Google Scholar] [CrossRef] [PubMed]
- Mayfield, A.B.; Hsiao, Y.Y.; Chen, H.K.; Chen, C.S. Rubisco expression in the dinoflagellate Symbiodinium sp. is influenced by both photoperiod and endosymbiotic lifestyle. Mar. Biotech. 2014, 16, 371–384. [Google Scholar] [CrossRef] [PubMed]
- Pasaribu, B.; Weng, L.-C.; Lin, I.-P.; Camargo, E.; Tzen, J.T.; Tsai, C.-H.; Ho, S.-L.; Lin, M.-R.; Wang, L.-H.; Chen, C.-S.; et al. Morphological variability and distinct protein profiles of cultured and endosymbiotic Symbiodinium cells isolated from Exaiptasia pulchella. Sci. Rep. 2015, 5, 15353. [Google Scholar] [CrossRef] [PubMed]
- Medrano, E.; Merselis, D.G.; Bellantuono, A.J.; Rodriguez-Lanetty, M. Proteomic basis of symbiosis: A heterologous partner fails to duplicate homologous colonization in a novel cnidarian–Symbiodiniaceae mutualism. Front. Microbiol. 2019, 10, 1153. [Google Scholar] [CrossRef]
- Awad, D.; Brueck, T. Optimization of protein isolation by proteomic qualification from Cutaneotrichosporon oleaginosus. Anal. Bioanal. Chem. 2020, 412, 449–462. [Google Scholar] [CrossRef] [PubMed]
- Zhang, Z.; Wu, S.; Stenoien, D.L.; Paša-Tolić, L. High-throughput proteomics. Annu. Rev. Anal. Chem. 2014, 7, 427–454. [Google Scholar] [CrossRef] [PubMed]
- Sielaff, M.; Kuharev, J.R.; Bohn, T.; Hahlbrock, J.; Bopp, T.; Tenzer, S.; Distler, U. Evaluation of FASP, SP3, and iST protocols for proteomic sample preparation in the low microgram range. J. Proteom. Res. 2017, 16, 4060–4072. [Google Scholar] [CrossRef]
- Batth, T.S.; Tollenaere, M.A.; Rüther, P.; Gonzalez-Franquesa, A.; Prabhakar, B.S.; Bekker-Jensen, S.; Deshmukh, A.S.; Olsen, J.V. Protein aggregation capture on microparticles enables multipurpose proteomics sample preparation. Mol. Cell Proteom. 2019, 18, 1027–1035. [Google Scholar] [CrossRef]
- Eddhif, B.; Lange, J.; Guignard, N.; Batonneau, Y.; Clarhaut, J.; Papot, S.; Geffroy-Rodier, C.; Poinot, P. Study of a novel agent for TCA precipitated proteins washing-comprehensive insights into the role of ethanol/HCl on molten globule state by multi-spectroscopic analyses. J. Proteom. 2018, 173, 77–88. [Google Scholar] [CrossRef] [PubMed]
- Wiśniewski, J. Filter-aided sample preparation: The versatile and efficient method for proteomic analysis. In Methods in Enzymology; Elsevier: Amsterdam, The Netherlands, 2017; pp. 15–27. [Google Scholar]
- Zougman, A.; Selby, P.J.; Banks, R.E. Suspension trapping (STrap) sample preparation method for bottom-up proteomics analysis. Proteomics 2014, 14, 1006–1010. [Google Scholar] [CrossRef]
- Hughes, C.S.; Foehr, S.; Garfield, D.A.; Furlong, E.E.; Steinmetz, L.M.; Krijgsveld, J. Ultrasensitive proteome analysis using paramagnetic bead technology. Mol. Syst. Biol. 2014, 10, 757. [Google Scholar] [CrossRef] [PubMed]
- Choksawangkarn, W.; Edwards, N.; Wang, Y.; Gutierrez, P.; Fenselau, C. Comparative study of workflows optimized for in-gel, in-solution, and on-filter proteolysis in the analysis of plasma membrane proteins. J. Proteom. Res. 2012, 11, 3030–3034. [Google Scholar] [CrossRef] [PubMed]
- Ludwig, K.R.; Schroll, M.M.; Hummon, A.B. Comparison of in-solution, FASP, and S-trap based digestion methods for bottom-up proteomic studies. J. Proteom. Res. 2018, 17, 2480–2490. [Google Scholar] [CrossRef]
- Wiśniewski, J.R.; Zougman, A.; Nagaraj, N.; Mann, M. Universal sample preparation method for proteome analysis. Nat. Methods 2009, 6, 359–362. [Google Scholar] [CrossRef] [PubMed]
- Hughes, C.S.; Moggridge, S.; Müller, T.; Sorensen, P.H.; Morin, G.B.; Krijgsveld, J. Single-pot, solid-phase-enhanced sample preparation for proteomics experiments. Nat. Protoc. 2019, 14, 68–85. [Google Scholar] [CrossRef]
- Kulak, N.A.; Pichler, G.; Paron, I.; Nagaraj, N.; Mann, M. Minimal, encapsulated proteomic-sample processing applied to copy-number estimation in eukaryotic cells. Nat. Methods 2014, 11, 319. [Google Scholar] [CrossRef]
- Suggett, D.J.; Goyen, S.; Evenhuis, C.; Szabó, M.; Pettay, D.T.; Warner, M.E.; Ralph, P.J. Functional diversity of photobiological traits within the genus Symbiodinium appears to be governed by the interaction of cell size with cladal designation. New Phytol. 2015, 208, 370–381. [Google Scholar] [CrossRef]
- Goodman, J.K.; Zampronio, C.G.; Jones, A.M.; Hernandez-Fernaud, J.R. Updates of the In-Gel Digestion Method for Protein Analysis by Mass Spectrometry. Proteomics 2018, 18, 1800236. [Google Scholar] [CrossRef] [PubMed]
- Kumar, M.; Padula, M.P.; Davey, P.; Pernice, M.; Jiang, Z.; Sablok, G.; Contreras-Porcia, L.; Ralph, P.J. Proteome Analysis Reveals Extensive Light Stress-Response Reprogramming in the Seagrass Zostera muelleri (Alismatales, Zosteraceae) Metabolism. Front. Plant Sci. 2017, 7, 1–19. [Google Scholar] [CrossRef] [PubMed]
- Rappsilber, J.; Ishihama, Y.; Mann, M. Stop and go extraction tips for matrix-assisted laser desorption/ionization, nanoelectrospray, and LC/MS sample pretreatment in proteomics. Anal. Chem. 2003, 75, 663–670. [Google Scholar] [CrossRef] [PubMed]
- Artimo, P.; Jonnalagedda, M.; Arnold, K.; Baratin, D.; Csardi, G.; de Castro, E.; Duvaud, S.; Flegel, V.; Fortier, A.; Gasteiger, E.; et al. ExPASy: SIB bioinformatics resource portal. Nucleic Acids Res. 2012, 40, W597–W603. [Google Scholar] [CrossRef]
- Stepanova, E.; Gygi, S.P.; Paulo, J.A. Filter-based protein digestion (FPD): A detergent-free and scaffold-based strategy for TMT workflows. J. Proteom. Res. 2018, 17, 1227–1234. [Google Scholar] [CrossRef]
- HaileMariam, M.; Eguez, R.V.; Singh, H.; Bekele, S.; Ameni, G.; Pieper, R.; Yu, Y. S-Trap, an ultrafast sample-preparation approach for shotgun proteomics. J. Proteom. Res. 2018, 17, 2917–2924. [Google Scholar] [CrossRef]
- Erde, J.; Loo, R.R.O.; Loo, J.A. Enhanced FASP (eFASP) to increase proteome coverage and sample recovery for quantitative proteomic experiments. J. Proteom. Res. 2014, 13, 1885–1895. [Google Scholar] [CrossRef]
- Ni, M.W.; Wang, L.; Chen, W.; Mou, H.Z.; Zhou, J.; Zheng, Z.G. Modified filter-aided sample preparation (FASP) method increases peptide and protein identifications for shotgun proteomics. Rapid Commun. Mass Spectrom. 2017, 31, 171–178. [Google Scholar] [CrossRef]
- Li, S.; Cao, X.; Wang, Y.; Zhu, Z.; Zhang, H.; Xue, S.; Tian, J. A method for microalgae proteomics analysis based on modified filter-aided sample preparation. Appl. Biochem. Biotechnol. 2017, 183, 923–930. [Google Scholar] [CrossRef]
- Yu, Y.; Xie, L.; Gunawardena, H.P.; Khatun, J.; Maier, C.; Spitzer, W.; Leerkes, M.; Giddings, M.C.; Chen, X. GOFAST: An Integrated Approach for Efficient and Comprehensive Membrane Proteome Analysis. Anal. Chem. 2012, 84, 9008–9014. [Google Scholar] [CrossRef] [PubMed]
- Hildonen, S.; Halvorsen, T.G.; Reubsaet, L. Why less is more when generating tryptic peptides in bottom-up proteomics. Proteomics 2014, 14, 2031–2041. [Google Scholar] [CrossRef]
- Hayoun, K.; Gouveia, D.D.; Grenga, L.; Pible, O.; Armengaud, J. Evaluation of sample preparation methods for fast proteotyping of microorganisms by tandem mass spectrometry. Front. Microbiol. 2019, 10, 1985. [Google Scholar] [CrossRef] [PubMed]
- Moggridge, S.; Sorensen, P.H.; Morin, G.B.; Hughes, C.S. Extending the compatibility of the SP3 paramagnetic bead processing approach for proteomics. J. Proteom. Res. 2018, 17, 1730–1740. [Google Scholar] [CrossRef]
- Dimayacyac-Esleta, B.R.T.; Tsai, C.-F.; Kitata, R.B.; Lin, P.-Y.; Choong, W.-K.; Lin, T.-D.; Wang, Y.-T.; Weng, S.-H.; Yang, P.-C.; Arco, S.D.; et al. Rapid high-pH reverse phase StageTip for sensitive small-scale membrane proteomic profiling. Anal. Chem. 2015, 87, 12016–12023. [Google Scholar] [CrossRef]
- Kuljanin, M.; Dieters-Castator, D.Z.; Hess, D.A.; Postovit, L.M.; Lajoie, G.A. Comparison of sample preparation techniques for large-scale proteomics. Proteomics 2017, 17, 1600337. [Google Scholar] [CrossRef]
- Magdeldin, S.; Yamamoto, K.; Yoshida, Y.; Xu, B.; Zhang, Y.; Fujinaka, H.; Yaoita, E.; Yates, J.R., III; Yamamoto, T. Deep proteome mapping of mouse kidney based on OFFGel prefractionation reveals remarkable protein post-translational modifications. J. Proteom. Res. 2014, 13, 1636–1646. [Google Scholar] [CrossRef] [PubMed]
- Malin, K.; Mohan, G.; Rafael, H.; Fredrik, L.; Jonas, B.; Kovac, L.; Bergström Lind, S. Magnetic beads for desalting of monoclonal antibodies and antibody–drug Conjugates. Anal. Chem. 2020, 92, 9001–9007. [Google Scholar]
- Busch, A.; Hippler, M. The structure and function of eukaryotic photosystem I. Biochim. Biophys. Acta Bioenerg. 2011, 1807, 864–877. [Google Scholar] [CrossRef]
- Bobeszko, T. Characterisation of Carbonic Anhydrase in the Symbiotic Dinoflagellate Symbiodinium; James Cook University: Townsville, Australia, 2017. [Google Scholar]
- Gierz, S.L.; Forêt, S.; Leggat, W. Transcriptomic analysis of thermally stressed Symbiodinium reveals differential expression of stress and metabolism genes. Front. Plant Sci. 2017, 8, 271. [Google Scholar] [CrossRef]
- Gierz, S.L.; Gordon, B.R.; Leggat, W. Integral light-harvesting complex expression in Symbiodinium within the coral Acropora aspera under thermal stress. Sci. Rep. 2016, 6, 1–10. [Google Scholar] [CrossRef]
- Buck, J.M.; Sherman, J.; Bártulos, C.R.; Serif, M.; Halder, M.; Henkel, J.; Falciatore, A.; Lavaud, J.; Gorbunov, M.Y.; Kroth, P.G.; et al. Lhcx proteins provide photoprotection via thermal dissipation of absorbed light in the diatom Phaeodactylum tricornutum. Nat. Commun. 2019, 10, 1–12. [Google Scholar] [CrossRef] [PubMed]
- Xiang, T.; Nelson, W.; Rodriguez, J.; Tolleter, D.; Grossman, A.R. Symbiodinium transcriptome and global responses of cells to immediate changes in light intensity when grown under autotrophic or mixotrophic conditions. Plant J. 2015, 82, 67–80. [Google Scholar] [CrossRef] [PubMed]
- Trotta, A.; Suorsa, M.; Rantala, M.; Lundin, B.; Aro, E.M. Serine and threonine residues of plant STN7 kinase are differentially phosphorylated upon changing light conditions and specifically influence the activity and stability of the kinase. Plant J. 2016, 87, 484–494. [Google Scholar] [CrossRef] [PubMed]
- Tikkanen, M.; Gollan, P.J.; Suorsa, M.; Kangasjärvi, S.; Aro, E.M. STN7 Operates in Retrograde Signaling through Controlling Redox Balance in the Electron Transfer Chain. Front. Plant Sci. 2012, 3, 277. [Google Scholar] [CrossRef]
- Puthiyaveetil, S.; Woodiwiss, T.; Knoerdel, R.; Zia, A.; Wood, M.; Hoehner, R.; Kirchhoff, H. Significance of the photosystem II core phosphatase PBCP for plant viability and protein repair in thylakoid membranes. Plant Cell Physiol. 2014, 55, 1245–1254. [Google Scholar] [CrossRef]
- Babele, P.K.; Kumar, J.; Chaturvedi, V. Proteomic De-Regulation in Cyanobacteria in Response to Abiotic Stresses. Front. Microbiol. 2019, 10, 1315. [Google Scholar] [CrossRef]
- Dizengremel, P.; Vaultier, M.N.; Le Thiec, D.; Cabané, M.; Bagard, M.; Gérant, D.; Gérard, J.; Dghim, A.A.; Richet, N.; Afif, D.; et al. Phosphoenolpyruvate is at the crossroads of leaf metabolic responses to ozone stress. New Phytol. 2012, 195, 512–517. [Google Scholar] [CrossRef]
- Hunter, W.N. The non-mevalonate pathway of isoprenoid precursor biosynthesis. J. Biol. Chem. 2007, 282, 21573–21577. [Google Scholar] [CrossRef] [PubMed]
- Igamberdiev, A.U.; Kleczkowski, L.A. The Glycerate and Phosphorylated Pathways of Serine Synthesis in Plants: The Branches of Plant Glycolysis Linking Carbon and Nitrogen Metabolism. Front. Plant Sci. 2018, 9, 318. [Google Scholar] [CrossRef]
- Welchen, E.; García, L.; Mansilla, N.; Gonzalez, D. Coordination of plant mitochondrial biogenesis: Keeping pace with cellular requirements. Front. Plant Sci. 2014, 4, 551. [Google Scholar] [CrossRef] [PubMed]
- Hawkins, T.D.; Hagemeyer, J.C.G.; Hoadley, K.D.; Marsh, A.G.; Warner, M.E. Partitioning of Respiration in an Animal-Algal Symbiosis: Implications for Different Aerobic Capacity between Symbiodinium spp. Front. Physiol. 2016, 7, 128. [Google Scholar] [CrossRef] [PubMed]


Publisher’s Note: MDPI stays neutral with regard to jurisdictional claims in published maps and institutional affiliations. |
© 2021 by the authors. Licensee MDPI, Basel, Switzerland. This article is an open access article distributed under the terms and conditions of the Creative Commons Attribution (CC BY) license (https://creativecommons.org/licenses/by/4.0/).