Article

Crude Slate, FCC Slurry Oil, Recycle, and Operating Conditions Effects on H-Oil® Product Quality

by
Dicho Stoyanov Stratiev
1,*,
Ivelina Kostova Shishkova
1,
Rosen Kocev Dinkov
1,
Ivan Petrov Petrov
1,
Iliyan Venkov Kolev
1,
Dobromir Yordanov
2,
Sotir Sotirov
2,
Evdokia Nikolaeva Sotirova
2,
Vassia Krassimirova Atanassova
3,
Simeon Ribagin
3,
Krassimir Todorov Atanassov
2,3,
Danail Dichev Stratiev
3 and
Svetoslav Nenov
4
1
LUKOIL Neftohim Burgas, 8104 Burgas, Bulgaria
2
Intelligent Systems Laboratory, University Prof. Dr. Assen Zlatarov, Professor Yakimov 1, 8010 Burgas, Bulgaria
3
Institute of Biophysics and Biomedical Engineering, Bulgarian Academy of Sciences, Academic Georgi Bonchev 105, 1113 Sofia, Bulgaria
4
University of Chemical Technology and Metallurgy, Kliment Ohridski 8, 1756 Sofia, Bulgaria
*
Author to whom correspondence should be addressed.
Processes 2021, 9(6), 952; https://doi.org/10.3390/pr9060952
Submission received: 7 April 2021 / Revised: 13 May 2021 / Accepted: 25 May 2021 / Published: 27 May 2021

Abstract

:
This paper evaluates the influence of crude oil (vacuum residue) properties, the processing of fluid catalytic cracking slurry oil, and recycle of hydrocracked vacuum residue diluted with fluid catalytic cracking heavy cycle oil, and the operating conditions of the H-Oil vacuum residue hydrocracking on the quality of the H-Oil liquid products. 36 cases of operation of a commercial H-Oil® ebullated bed hydrocracker were studied at different feed composition, and different operating conditions. Intercriteria analysis was employed to define the statistically meaningful relations between 135 parameters including operating conditions, feed and products characteristics. Correlations and regression equations which related the H-Oil® mixed feed quality and the operating conditions (reaction temperature, and reaction time (throughput)) to the liquid H-Oil® products quality were developed. The developed equations can be used to find the optimal performance of the whole refinery considering that the H-Oil liquid products are part of the feed for the units: fluid catalytic cracking, hydrotreating, road pavement bitumen, and blending.

1. Introduction

The ebullated bed vacuum residue H-Oil® hydrocracking proved commercially to be able of achieving 93% conversion of vacuum residue into gas (15.2%), naphtha (10.2%), diesel (47.2%), vacuum gas oil (25.1%), and unconverted hydrocracked vacuum residue, also known as vacuum tower bottom product (VTB) (5.85%) [1,2]. However, the naphtha, the diesel, the vacuum gas oil, and the VTB from H-Oil® are not finished marketable products and they require further processing. The naphtha and the diesel are hydrotreated to near zero sulphur level. The vacuum gas oil (VGO) is catalytically cracked. It was found that the properties of the H-Oil® VGO varied in a wide range, depending on H-Oil® feed structure and operation severity which affected the H-Oil® VGO reactivity during its processing in the fluid catalytic cracking (FCC) [3,4]. The H-Oil® feed structure consisted of straight run vacuum residue, FCC slurry oil (SLO) and recycle of partially blended fuel oil (PBFO). The PBFO is prepared from around 70% VTB and 30% FCC heavy cycle oil (HCO). The VTB, is blended with cutter stocks (FCC cycle oils) to produce heavy fuel oil and it is also used as a feed component for production of road asphalt [5,6]. It was found that the properties of the VTB also varied in a wide range, depending on the crude blend processing and on the H-Oil® feed structure and operation severity [1]. This variation in VTB quality affects the processes of production of heavy fuel oil and road asphalt [5,6]. In an extreme case, the properties of the VTB were identical with those of asphaltenes produced from commercial deasphaltization units as reported by Naghizada et al. [7]. Considering the wide range of variation of the properties of the H-Oil® VGO and VTB, which influenced the performance of the other refinery units, their dependence on fluctuation of crude slate, the H-Oil® feed structure and H-Oil® operating conditions requires investigation in order to optimize the refinery performance. Besides, the lack of information about the properties variation of H-Oil® naphtha and diesel as a function of crude slate, the H-Oil® feed structure and H-Oil® operating conditions was another incentive to perform this study.
The aim of this work is to define how the crude slate, the FCC SLO, and the PBFO recycle processing, and the unit operating conditions affect the quality of naphtha, diesel, VGO, and VTB obtained in the LUKOIL Neftohim Burgas (LNB) refinery commercial H-Oil® hydrocracker.

2. Results and Discussion

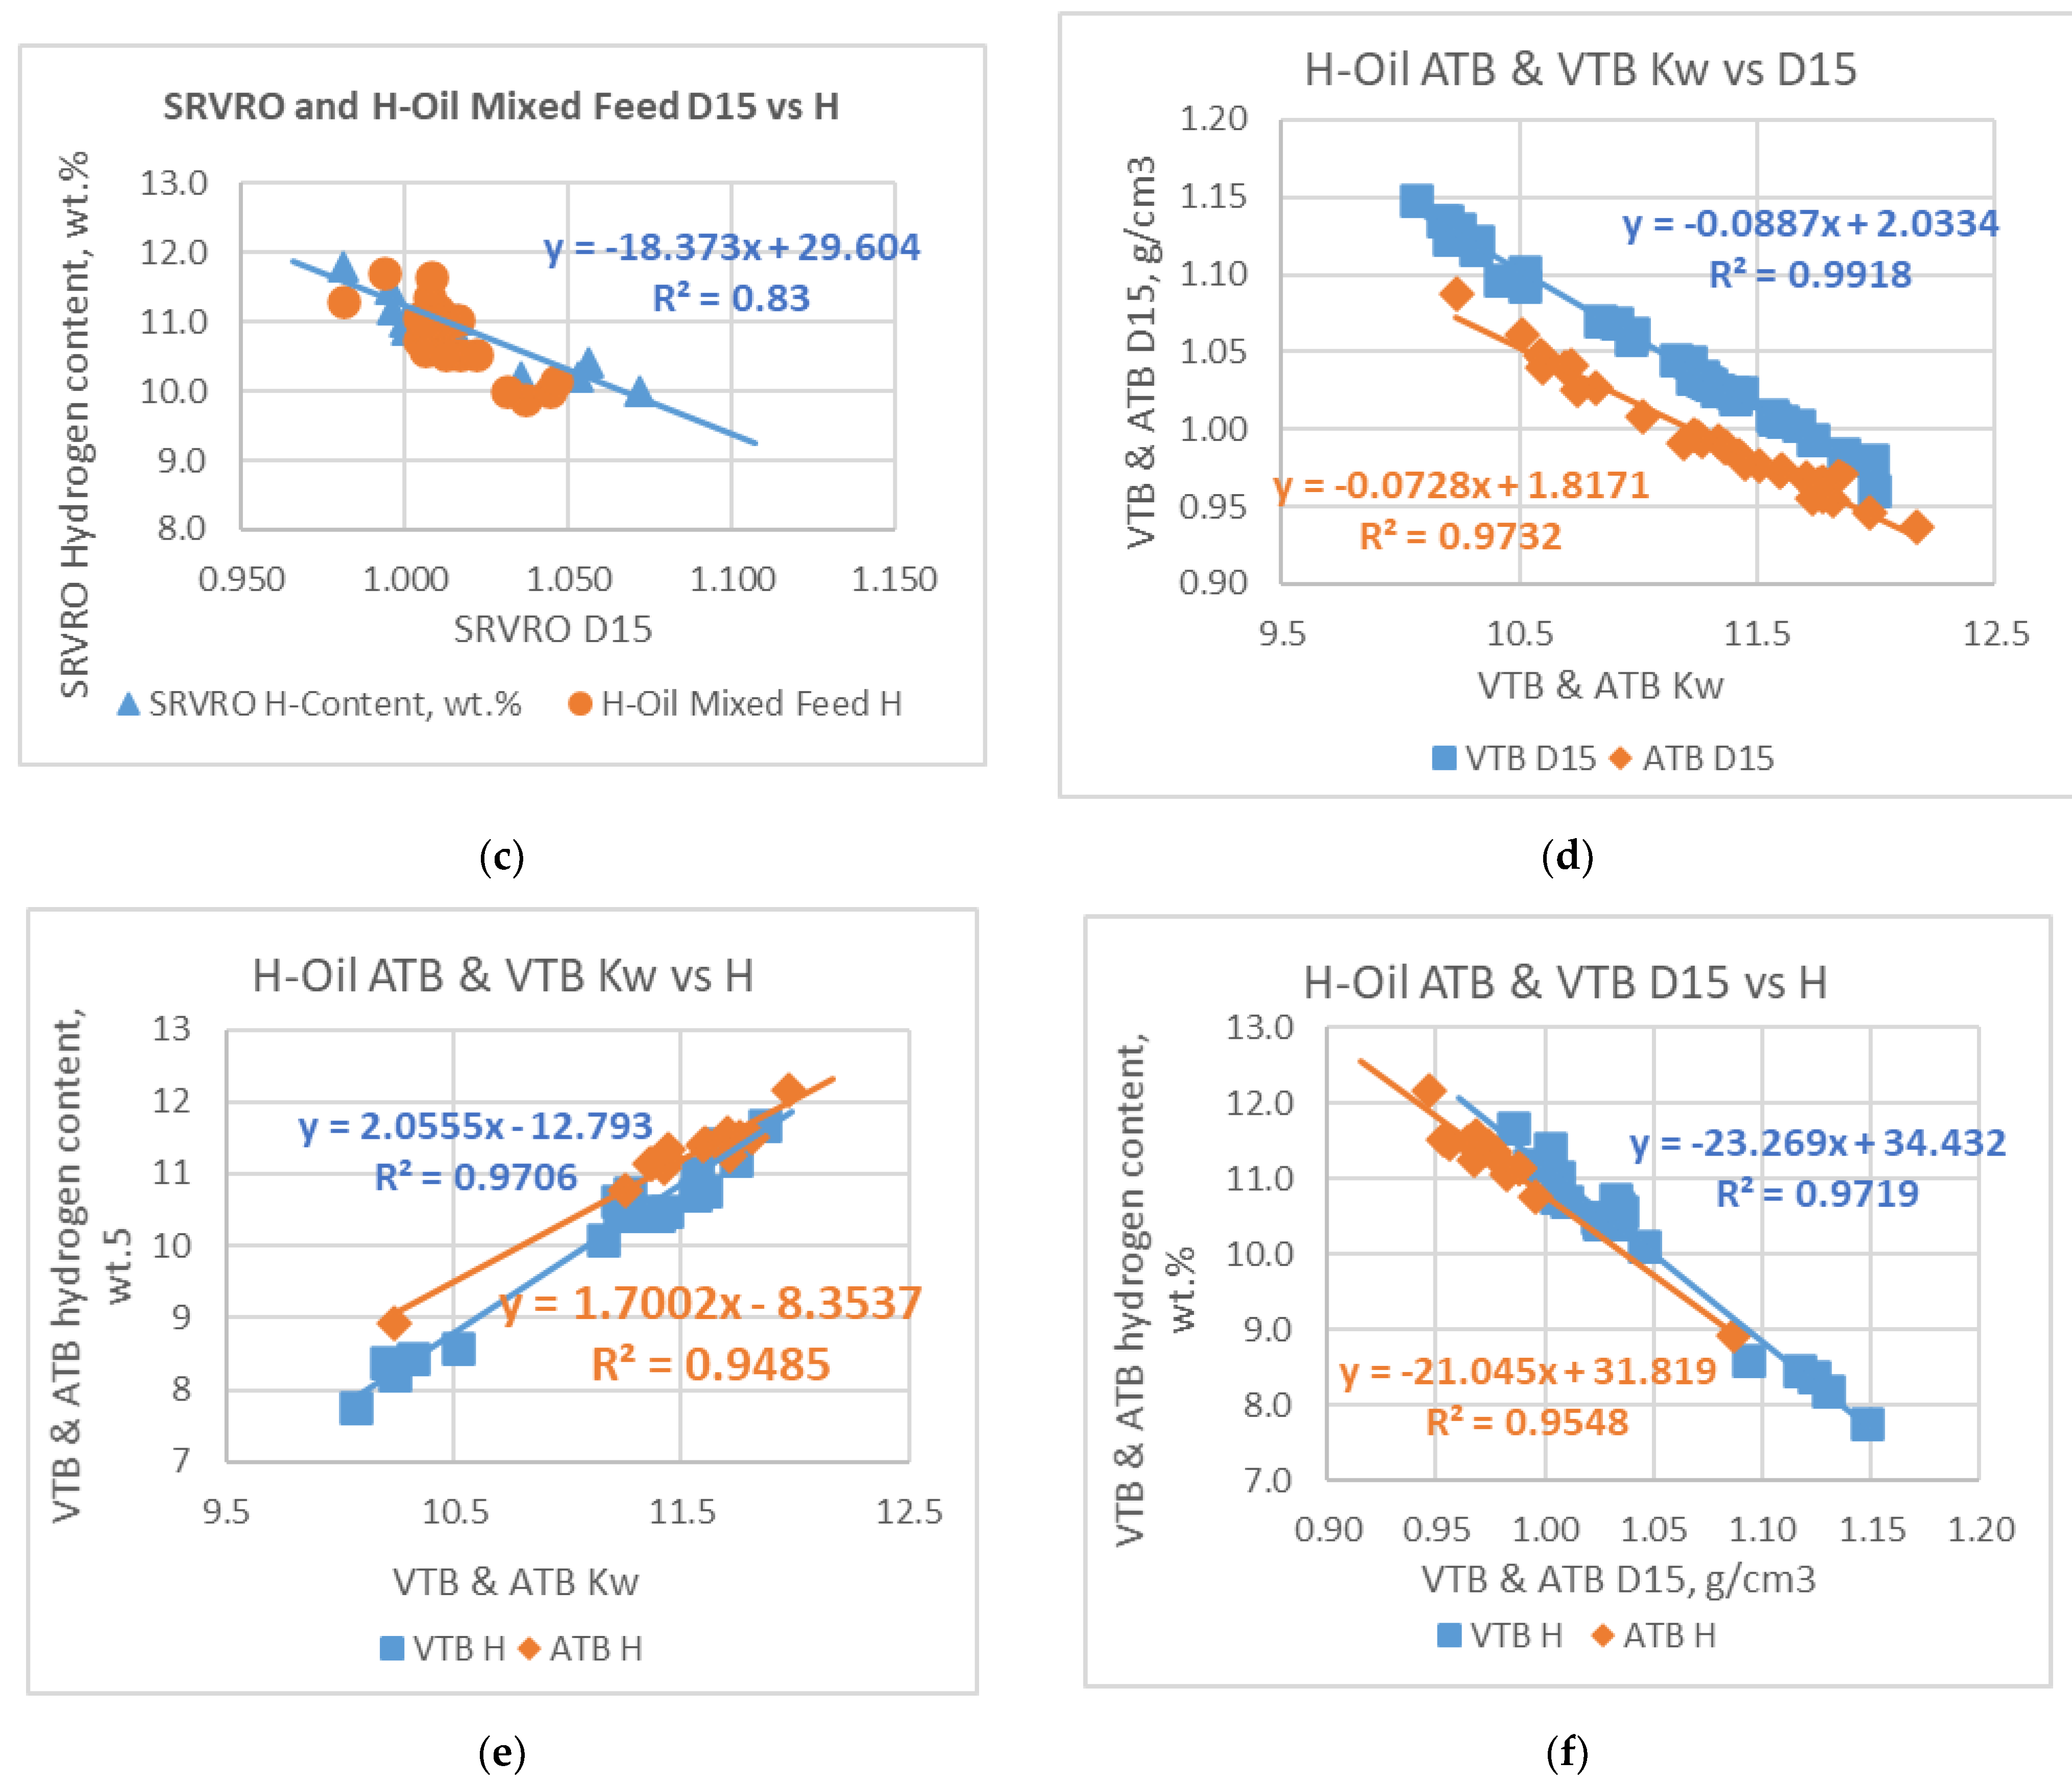
Investigations have shown that density and Kw (Watson characterization factor) of heavy oils very well correlate with their contents of saturates [1,8], hydrogen, and aromatic carbon [9,10,11]. Therefore, density and Kw can be used as indicators for aromaticity and hydrogen deficiency of the heavy oils. Figure 1 presents graphs of the relations of density with Kw, and hydrogen content of the mixed H-Oil® feed, straight run vacuum residual oils (SRVROs), and H-Oil® atmospheric tower bottom product (ATB), and VTB. These data show a very strong relation between density, Kw, and hydrogen content for the H-Oil® ATB, and VTB, and a weaker relation for the SRVROs, and the H-Oil® mixed feed. The mixed feed demonstrates a lower slope of decreasing of Kw with enhancement of density than the SRVROs. Since Kw depends on average boiling and density [9] this phenomenon can be explained with a lower average boiling point of the mixed feed. The addition of FCC SLO and recycle of partially blended fuel oil (PBFO) to the straight run vacuum residue indeed decreases the average boiling point of the mixed feed. It is difficult to find a reasonable explanation why the correlations of Kw, density and hydrogen content for the H-Oil® residual oil products ATB, and VTB are stronger than those of the mixed feed, and the SRVROs.
The relations between 135 characterizing parameters for the 36 studied cases were investigated by the use of intercriteria analysis (ICrA). More information about the application of ICrA the reader can find in our recent studies [1,3]. ICrA defines the values of positive and negative consonance (μ) of the studied criteria (parameters) [1,3]. The meaning of µ = 0.75÷1.00 denotes a statistically meaningful positive relation, where the strong positive consonance exhibits values of µ = 0.95÷1.00, and the weak positive consonance exhibits values of µ = 0.75÷0.85. Respectively, the values of negative consonance with µ = 0.00÷0.25 means a statistically meaningful negative relation, where the strong negative consonance exhibits values of µ = 0.00÷0.05, and the weak negative consonance exhibits values of µ = 0.15÷0.25 [1,3].
The data in Table 1 confirm that for the studied 36 cases the density, and the Kw are equivalent substitutes of the contents of aromatic carbon, and hydrogen content for the H-Oil® gas oils. The consonances μ of Kw and aromatic carbon content for HAGO (heavy atmospheric gas oil), LVGO (light vacuum gas oil), and HVGO (heavy vacuum gas oil) are 0.00. The consonances μ of density and hydrogen content for HAGO, LVGO, and HVGO are also 0.00. The average number of aromatic rings predicted by the aromatic ring index (ARI) strongly correlates with density of HAGO, LVGO, and HVGO (μ = 0.98–0.99). The ARI of H-Oil® gas oils was found to affect conversion and coke yield during catalytic cracking of H-Oil® heavy oils [3].
Table 2 presents the range of variation of the properties of the mixed feed and of the products: naphtha, diesel, heavy atmospheric gas oil (HAGO), light vacuum gas oil (LVGO), heavy vacuum gas oil (HVGO), ATB, and VTB for the studied 36 cases. These data indicate that the properties of mixed feed and of the liquid products vary in a rather wide range. Properties of the liquid products from H-Oil® are important because they control the reactivity of these streams during their further refining in processes like FCC and hydrotreatment [3,4,12,13] to produce finished marketable products. It was found in our earlier studies that the lower the Kw of H-Oil® gas oils the lower their crackability in FCC is [3]. The higher the density, and the aromatics content in the H-Oil® diesel the lower its reactivity during hydrotreatment [12,13,14]. It was reported in [1] and in [5,6,15] that the properties of H-Oil® VTB affect the process of production of road asphalt whose feed contains H-Oil® VTB. Therefore, understanding the factors controlling H-Oil® liquid products properties can allow optimization of the whole refinery performance.
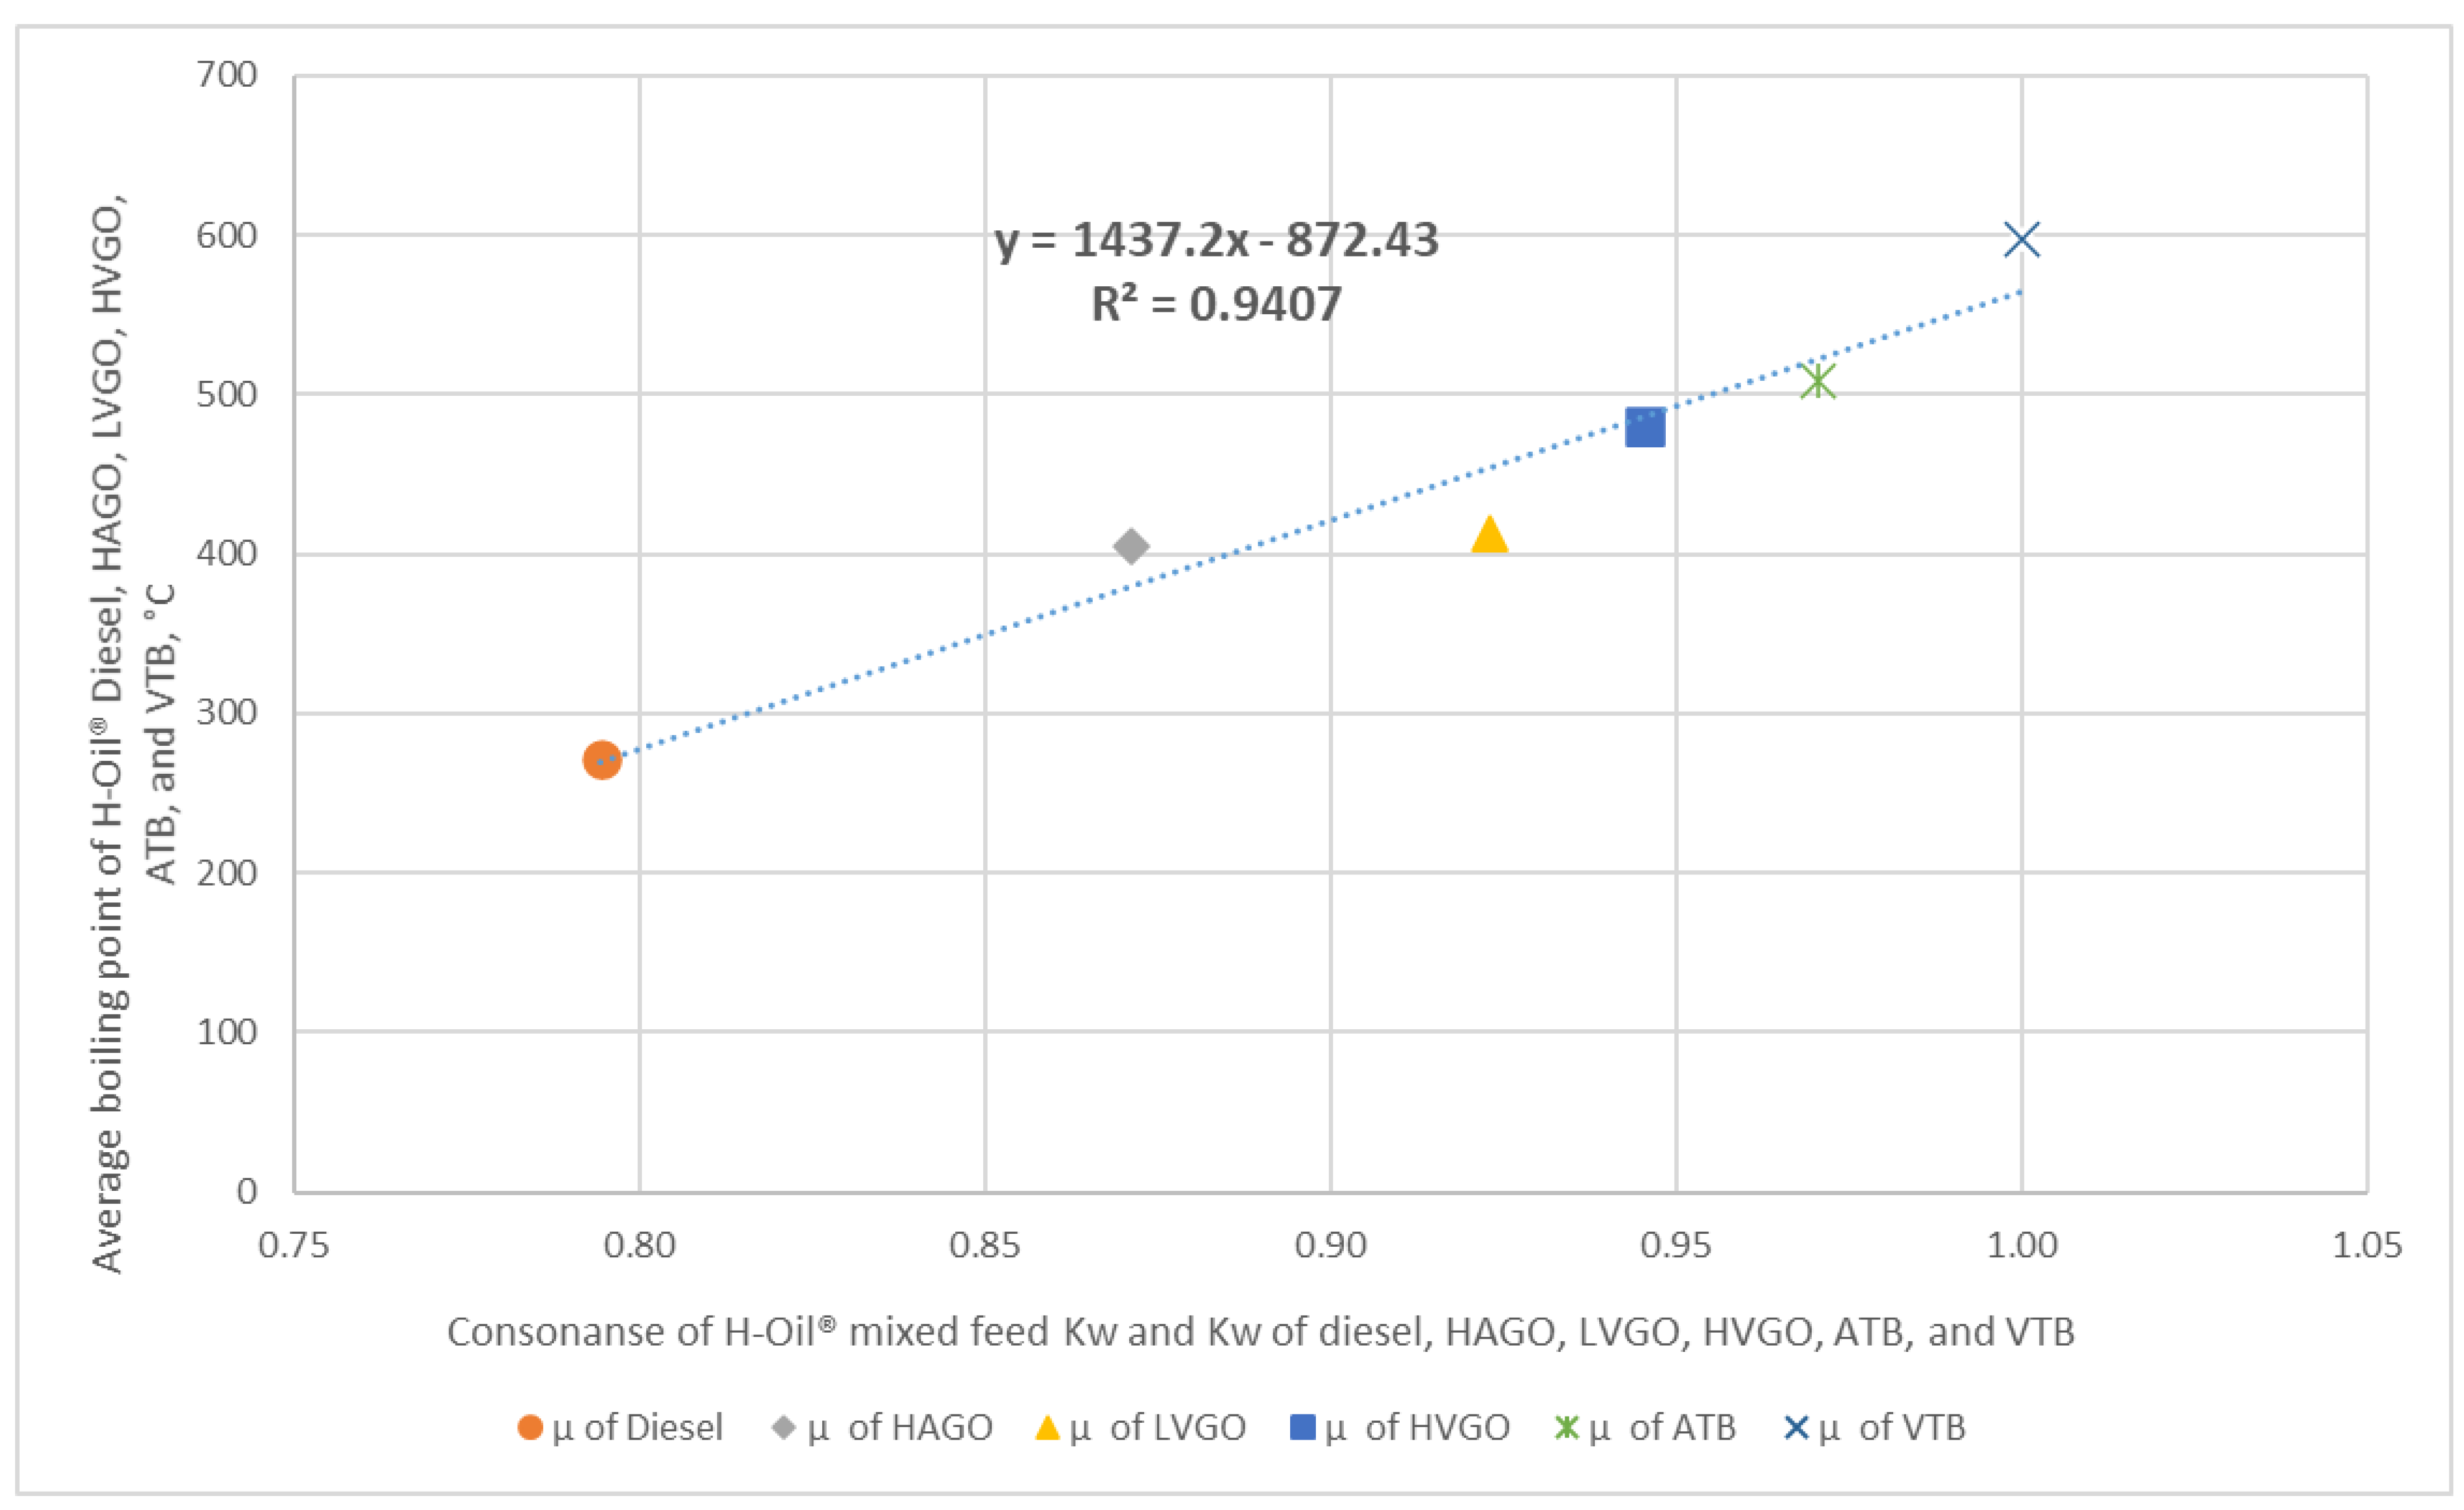
Table 3 shows some of the statistically meaningful relations between the H-Oil® feed properties, H-Oil® operating conditions and H-Oil® product properties established by the use of ICrA. It is evident from these data that the H-Oil® mixed feed Kw very strongly correlates with VTB density; ATB Kw, and HVGO Kw. The influence of the H-Oil® mixed feed Kw on the LVGO, HAGO, and diesel Kw factors decreases with reduction of molecular weight (average boiling point) of these three products (Figure 2). Figure 2 shows that there is a dependence of the consonance of mixed feed Kw and Kw of H-Oil® liquid products: diesel, HAGO, LVGO, HVGO, ATB, and VTB on the average boiling point of the liquid products. These data indicate that quality of the H-Oil® mixed feed affects mostly the quality of the hydrocracked heavy oil products, and the lighter products like diesel are weaker dependent on the H-Oil® residual feedstock quality, while the naphtha quality is not affected at all from the H-Oil® feed quality. The lighter products like diesel and naphtha are primary and secondary products and the secondary cracking reactions most probably decrease the dependence of their quality on the original vacuum residue feedstock quality.
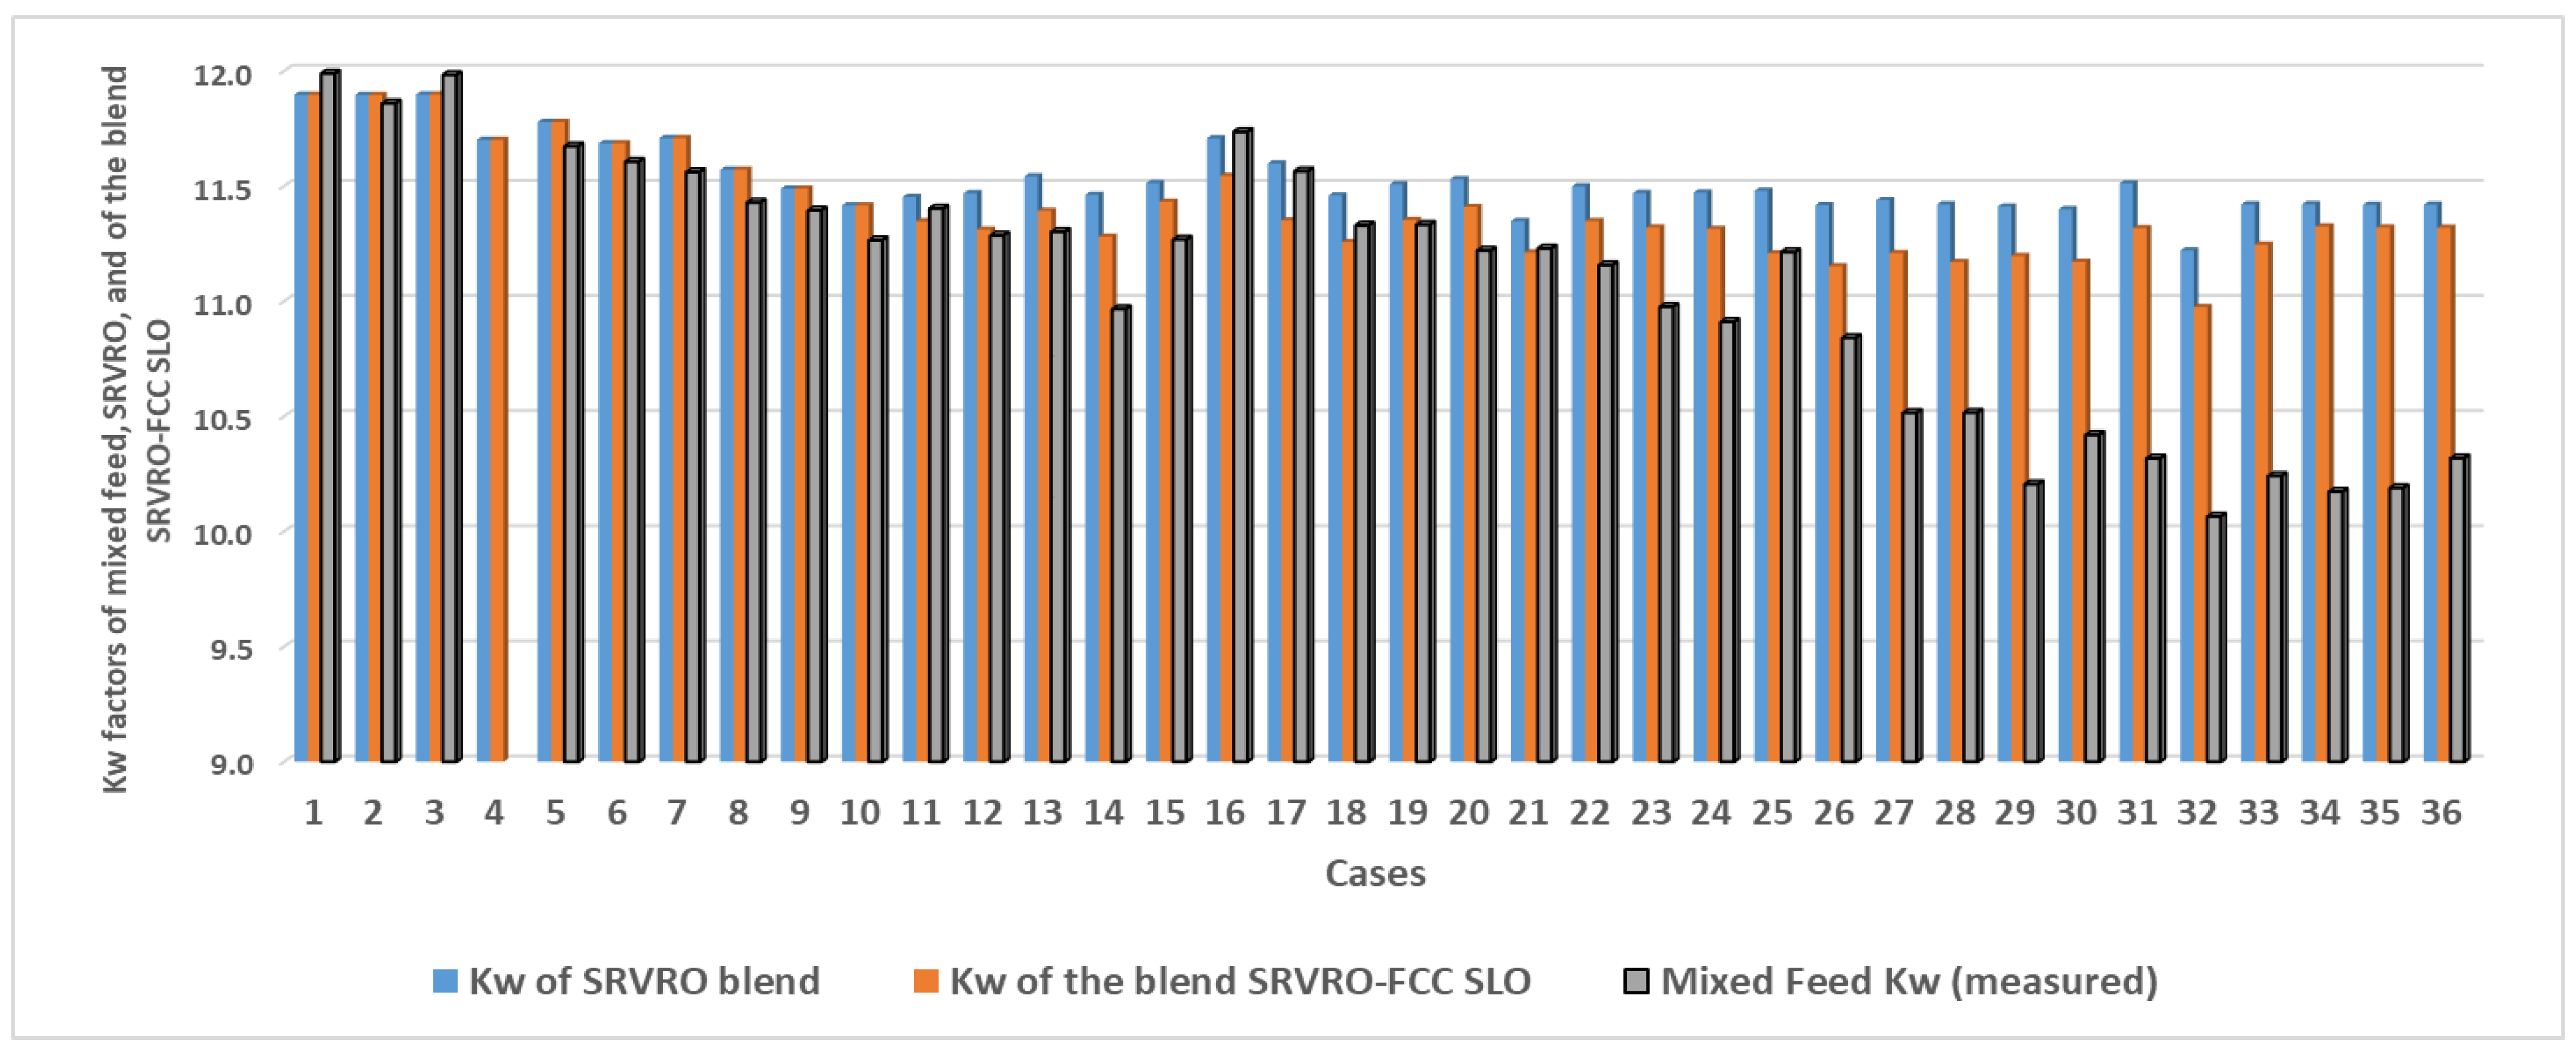
The data in Table 3 show that the mixed H-Oil® feed quality expressed by Kw controls the H-Oil® VTB properties since it is known that the H-Oil® VTB density strongly correlates with Concarbon (micro carbon) content [1] and as we will see later in this work it also correlates with softening point and viscosity. Thus, quality of the H-Oil® VTB will be strongly affected by the Kw of the feed, and from crudes which contain vacuum residue fractions with a lower Kw may be expected during H-Oil® hydrocracking to be produced VTB with a higher density. Figure 3 presents a graph of the Kw of the blended SRVROs, of the mixture blended SRVROs—FCC SLO, and of the mixed H-Oil® feed for the studied 36 cases. The blended SRVRO Kw was calculated on the base of Kw of the individual SRVROs originated from the different crude oils by the use of Equation (1) [16]:
K w m i x = i = 1 n X i . K w i
where:
Kwmix = Watson characterization factor of the mixture;
Xi = weight fraction of ith pure component in the mixture;
Kwi = Watson characterization factor of the of ith pure component in the mixture.
The Kw of the mixture blended SRVROs—FCC SLO was computed by Equation (10) and the calculated Kw of the blended SRVROs, and the Kw of FCC SLO that varied between 9.6 and 9.8.
It is evident from the data in Figure 3 that the Kw of the mixed H-Oil® feed gradually decreases from Case 1 to Case 36. The blended SRVROs Kw for the studied 36 cases varied between 11.90 (Kw of Urals crude oil, the main crude oil for LNB refinery for this study) and 11.22 (Kw of the crude oil blend 41%Urals/34.5%Kirkuk/24.5%El Bouri; Case 32). The lowest Kw of the mixture blended SRVROs—FCC SLO was that of Case 32 and it was 10.97. The lowest Kw of the mixed H-Oil® feed was that of case 32, and it was 10.07. As apparent from the data in Figure 4 the sum of the FCC SLO and the recycle of PBFO can reach 43% of the fresh blended SRVRO feed. Considering that it has a substantially lower Kw (9.7 for FCC SLO, and 10.4 for the PBFO) it becomes clear that its effect on the mixed H-Oil® feed Kw will be appreciable. By the use of multiple linear regression for the studied 36 cases two equations were obtained relating Kw factors of FCC SLO and PBFO recycle to H-Oil® mixed feed Kw (Equation (2)), and Equation (3) that relates besides Kw factors of FCC SLO and PBFO recycle, and Kw of the blended SRVROs to the H-Oil® mixed feed Kw.
H O i l   m i x e d   f e e d   K w = 11.62 0.0253 F C C S L O 0.0142 R e c . R = 0.876 ,   rel .   av .   error = 0.80 %  
H O i l   m i x e d   f e e d   K w = 1.43 + 0.866 S R V R O K w 0.0206 F C C S L O 0.0137 R e c . R = 0.876 ,   rel .   av .   error = 0.74 %  
where:
SRVROKw = Kw of blended SRVROs originated from the processed crude oil blend;
FCCSLO = per cent of FCC SLO in the H-Oil® mixed feed, wt.%;
Rec. = per cent of recycle of PBFO in the H-Oil® mixed feed, wt.%.
Equations (2) and (3) exhibit that for the studied 36 cases the H-Oil® mixed feed Kw predominantly depends on the shares of FCC SLO and of PBFO recycle. Understandably the FCC SLO has a bigger negative impact on the H-Oil® mixed feed Kw than that of the recycle because the FCC SLO has a lower Kw than that of the recycle. The influence of the blended SRVROs Kw on the H-Oil® mixed feed Kw seems to be negligible, because after inclusion of the blended SRVROs Kw in Equation (3) the relative average error of Equation (3) is slightly improved in comparison with that of Equation (2) (from 0.80 down to 0.74%).
The relation of the H-Oil® mixed feed to VTB density can be expressed by Equation (4)
V T B   D 15 = 0.178 F e e d K w + 3.074 R = 0.992 ,   av .   rel .   error = 0.3 %
Interestingly the data in Table 3 also show that the feed Kw statistically meaningful intermediary negatively correlates with the hydrocracking reaction temperature. This at first glance strange correlation can be explained with the fact that the higher Kw vacuum residual oil feeds are lighter, and contain more saturates which negatively impact colloidal stability of the H-Oil® feed and as a consequence require lower reaction temperature to keep the ATB sediment content within the acceptable limits [1].
In order to evaluate the influence of H-Oil® unit through-put, hydrocracking reaction temperature, and shares of FCC SLO, and of PBFO recycle in the H-Oil® mixed feed on HVGO quality expressed by the Kw a multiple linear regression of the data was performed. Equation (5) shows the developed relation.
H V G O K w = 24.34 + 0.000841 F R 0.03034 W A B T 0.004 F C C S L O 0.01326 R e c . R = 0.96 ,   rel .   av .   error = 0.68 %
where:
FR = H-Oil® unit trough-put, t/h;
WABT = average weight average bed temperature of both reactors in LNB H-Oil® unit, °C.
Equation (5) indicates that HVGO Kw increases with enhancement of throughput, and reduction of reaction temperature, FCC SLO, and PBFO recycle contents in the mixed feed. Increasing H-Oil® feed rate decreases reaction time, that in turn diminishes the secondary cracking reactions and as a consequence a higher amount of aliphatic hydrocarbons from the HVGO boiling range are preserved, and they are known to have a higher Kw. As temperature increases, the rates of thermal cracking reactions increase more rapidly than the hydrogen addition counterparts [17], that in turn gives HVGO product with a lower amount of preserved aliphatic hydrocarbons leading to a product with a lower Kw. The FCC SLO, and the recycle of PBFO increase the aromaticity of the feedstock and from the more aromatic feedstock during hydrocracking a more aromatic lower Kw HVGO is obtained.
The relation between Kw of HVGO and Kw of LVGO is given by the regression Equation (6).
L V G O K w = 0.983 H V G O K w R = 0.965 ,   av .   rel .   error = 0.47 %
The relation of Kw of LVGO and Kw of HAGO is presented by the regression Equation (7).
H A G O K w = 1.011 L V G O K w R = 0.970 ,   av .   rel .   error = 0.45 %
The H-Oil® diesel quality expressed by its cetane index was found to depend on through-put, reaction temperature, and FCC SLO content in the H-Oil® mixed feed. This dependence is given in the regression Equation (8).
H O i l   D i e s e l   C e t a n e   I n d e x = 212.1 + 0.6645 F R 0.42254 W A B T 0.28432 F C C   S L O R = 0.85 ,   av .   rel .   error = 6.7 %
It is evident from Equation (8) that similarly to the H-Oil® HVGO (Equation (5)) the H-Oil® diesel cetane index (CI) increases with enhancement of throughput, and decreasing of reaction temperature, and FCC SLO content in H-Oil® mixed feed. The dependence of diesel CI on these variables, however, is lower than that of the H-Oil® HVGO which can be seen from the lower accuracy of the prediction of Equation (8), ten times as low as that of Equation (5). This suggests that other factors not included in Equation (8) can also affect the hydrocracked diesel fraction cetane index. The inclusion of the recycle of PBFO does not improve the accuracy of prediction that suggests that it does not have impact on H-Oil® diesel cetane index. The diesel fraction is difficult to crack at the hydrocracking conditions, although its secondary hydrocracking is documented in several researches [18,19,20,21]. The fact that the H-Oil® diesel cetane index decreases with augmentation of reaction temperature and extending of reaction time (feed through-put reduction) suggests that the diesel may undergo secondary cracking reactions which reduce the aliphatic hydrocarbons content in the diesel and increase the aromatics content. The higher aromatics content was found in our earlier study to correlate with a lower cetane index [22].
As mentioned earlier in this research the H-Oil® VTB density strongly correlates with Concarbon (micro carbon) content. Since the measurement of the viscosity of the H-Oil® VTB samples featured with high density and high Concarbon content was difficult to perform due to their high melting point solutions with FCC HCO containing 30% FCC HCO with kinematic viscosity of 11.6 mm2/s were prepared and their viscosity was measured. An ICrA matrix of the H-Oil® VTB properties studied in this work density, Concarbon content (CCR), kinematic viscosity of blends 70%VTB/30%FCC HCO, and softening point was prepared and shown in Table 4. As evident from the ICrA matrix in Table 4 all four studied H-Oil® VTB properties density, Concarbon content (CCR), kinematic viscosity of blends 70%VTB/30%FCC HCO, and softening point statistically meaningful strongly correlate with each other. Figure 5 exhibits graphs of the dependences of density, viscosity, and softening point of H-Oil® VTB on Concarbon content. These data clearly indicate that viscosity, and softening point of the H-Oil® VTB exponentially increase with enhancement of Concarbon content and density. The relation of Concarbon content to density for the H-Oil® VTB and for the straight run vacuum residual oils shown in Figure 5a indicates that for the same value of density the H-Oil® VTB has a higher Concarbon content. Since the density correlates with the total aromatic structures content, and the Concarbon content correlates with the number of condensed aromatic rings [1] one may conclude that at the same content of aromatic structures the H-Oil® VTB could contain a higher amount of condensed aromatic rings.
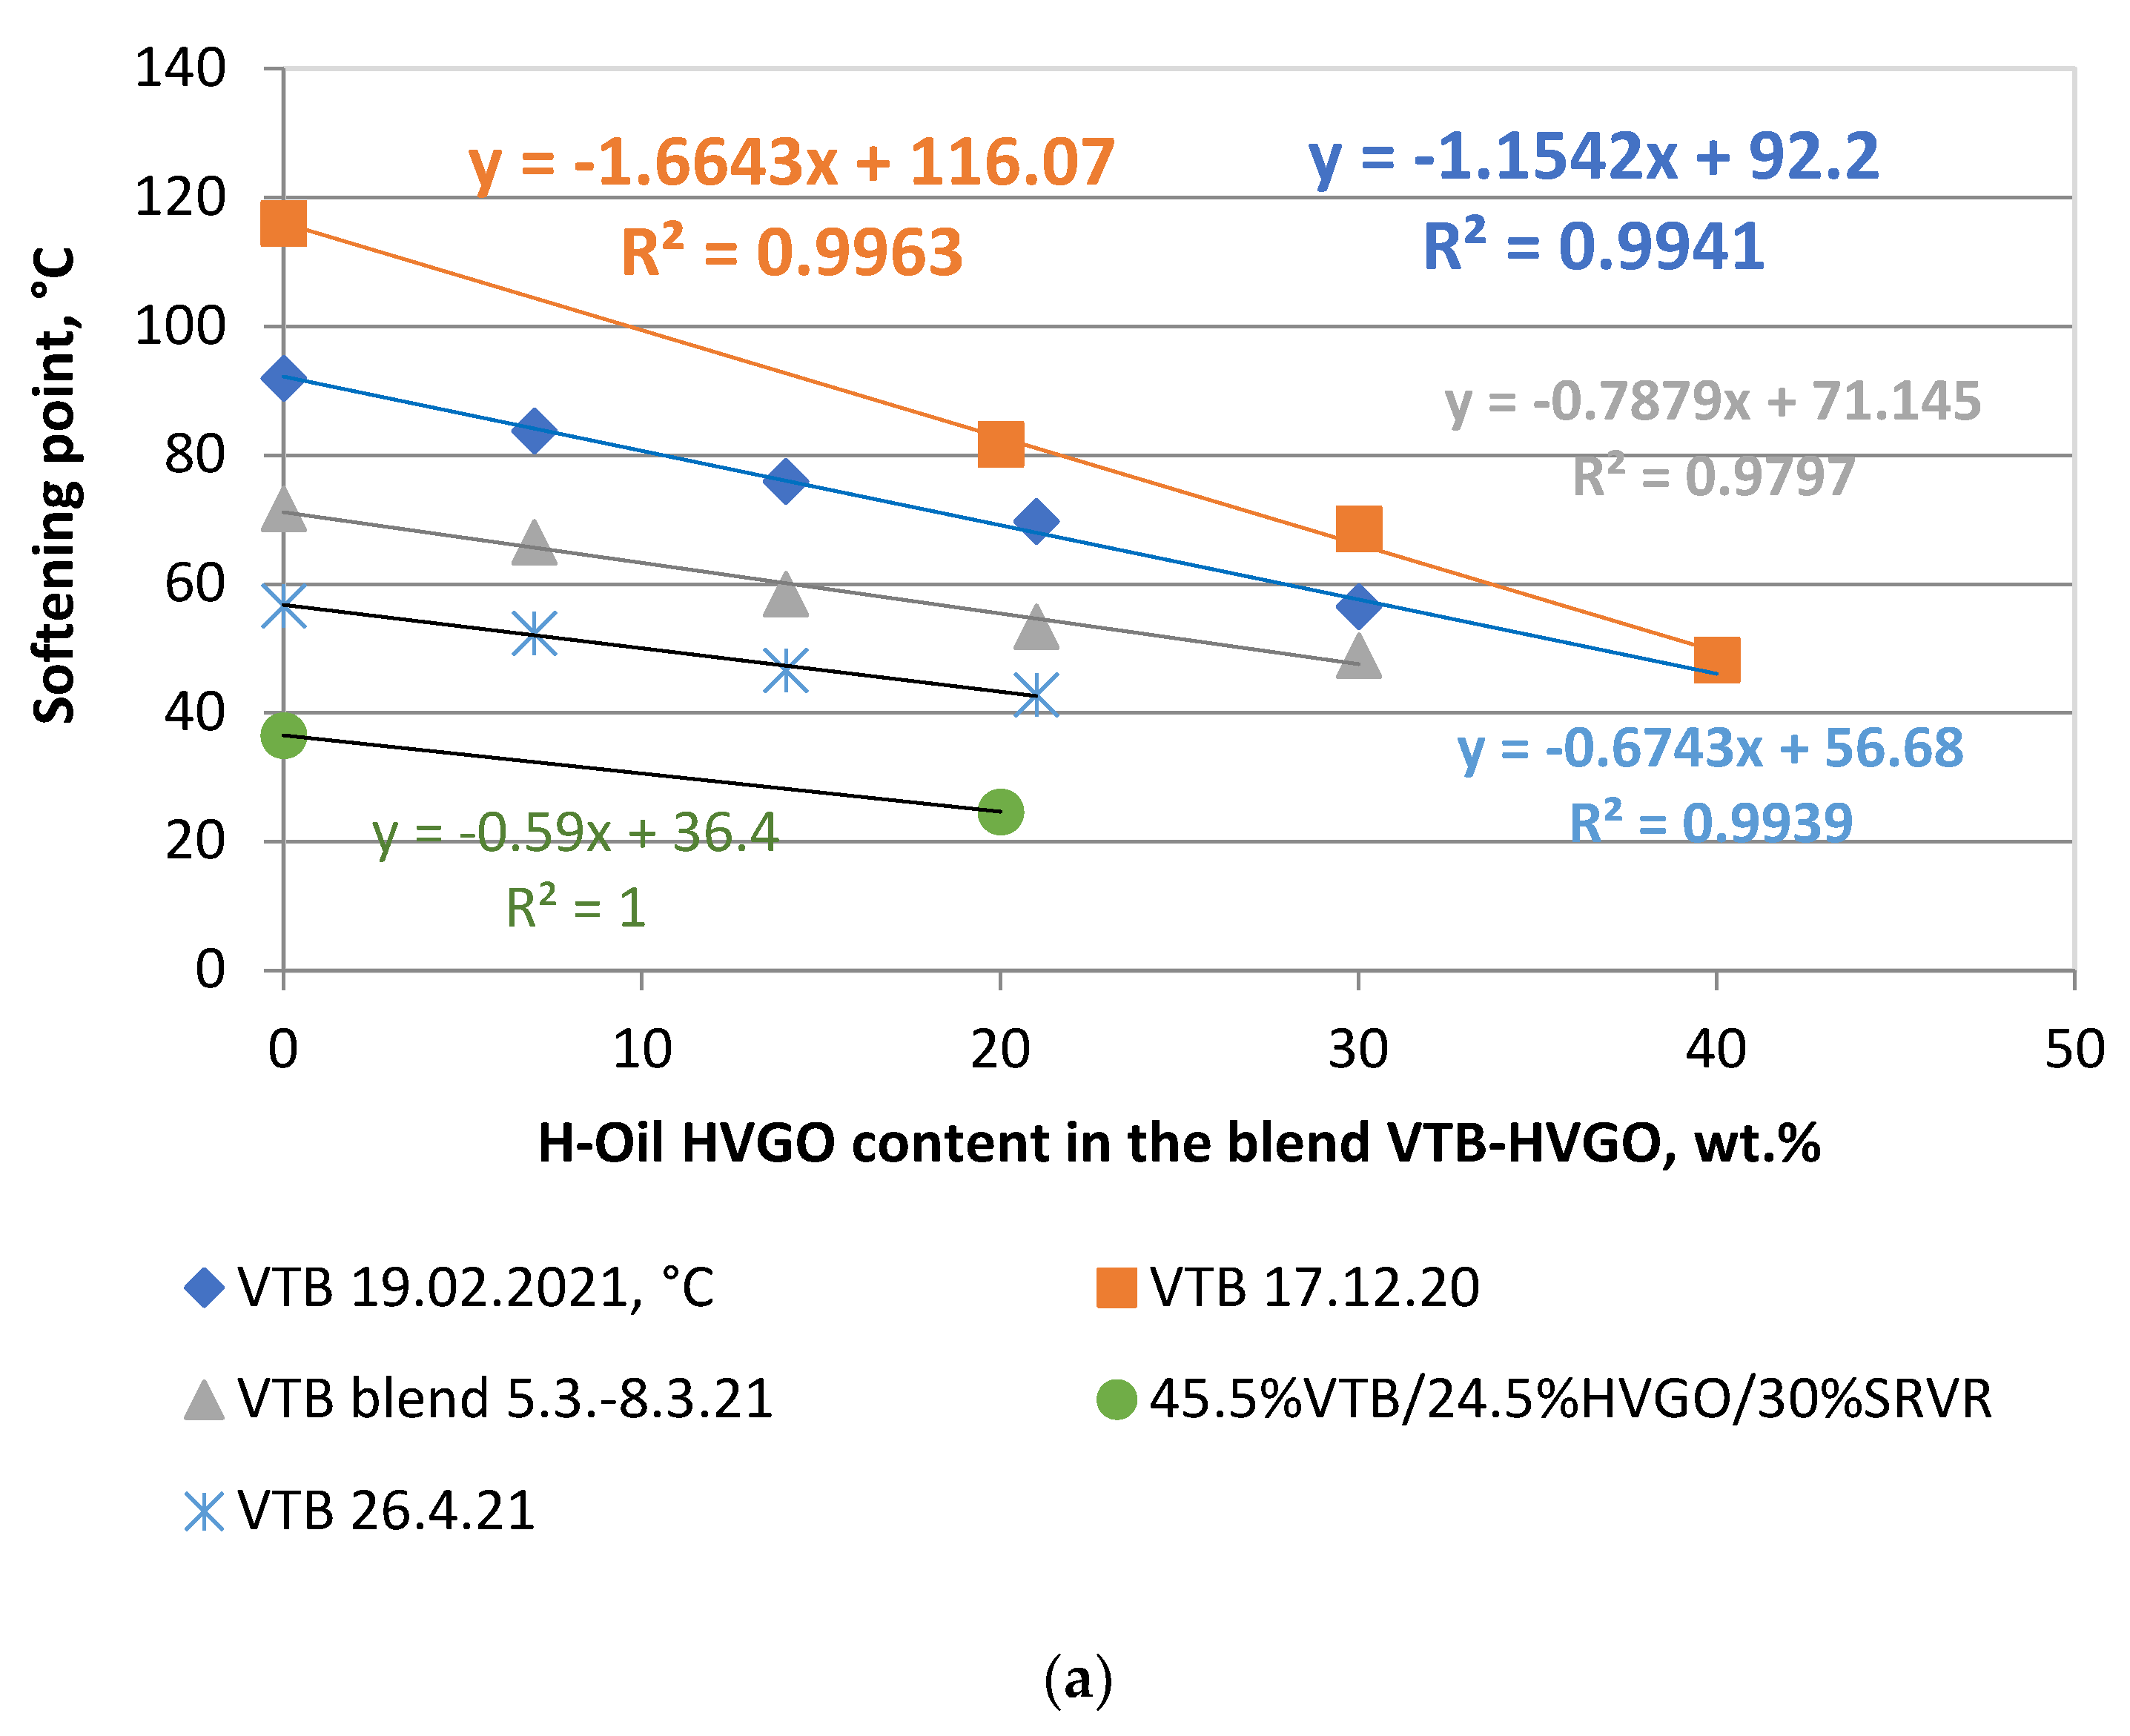
As the H-Oil® VTB having higher density, and higher Concarbon content possesses a higher softening point and it is more brittle undercutting of HVGO in the vacuum distillation column has been applied to decrease softening point and Fraas breaking point, and increase penetration to use this material as a feed for production of road asphalt [1,6]. In this study instead of undercutting H-Oil® HVGO we explored the feasibility to improve softening point of the harder H-Oil® VTB samples by blending them with H-Oil®. Figure 6 shows that the softening point of the H-Oil® VTB linearly decreases with augmentation of HVGO content in the blend H-Oil® VTB-HVGO (Figure 6a), and that the dependence of the slope of decreasing the softening point of the blend VTB-HVGO on the softening point of the pure VTB can be described by a second order polynomial (Figure 6b).

3. Materials and Methods

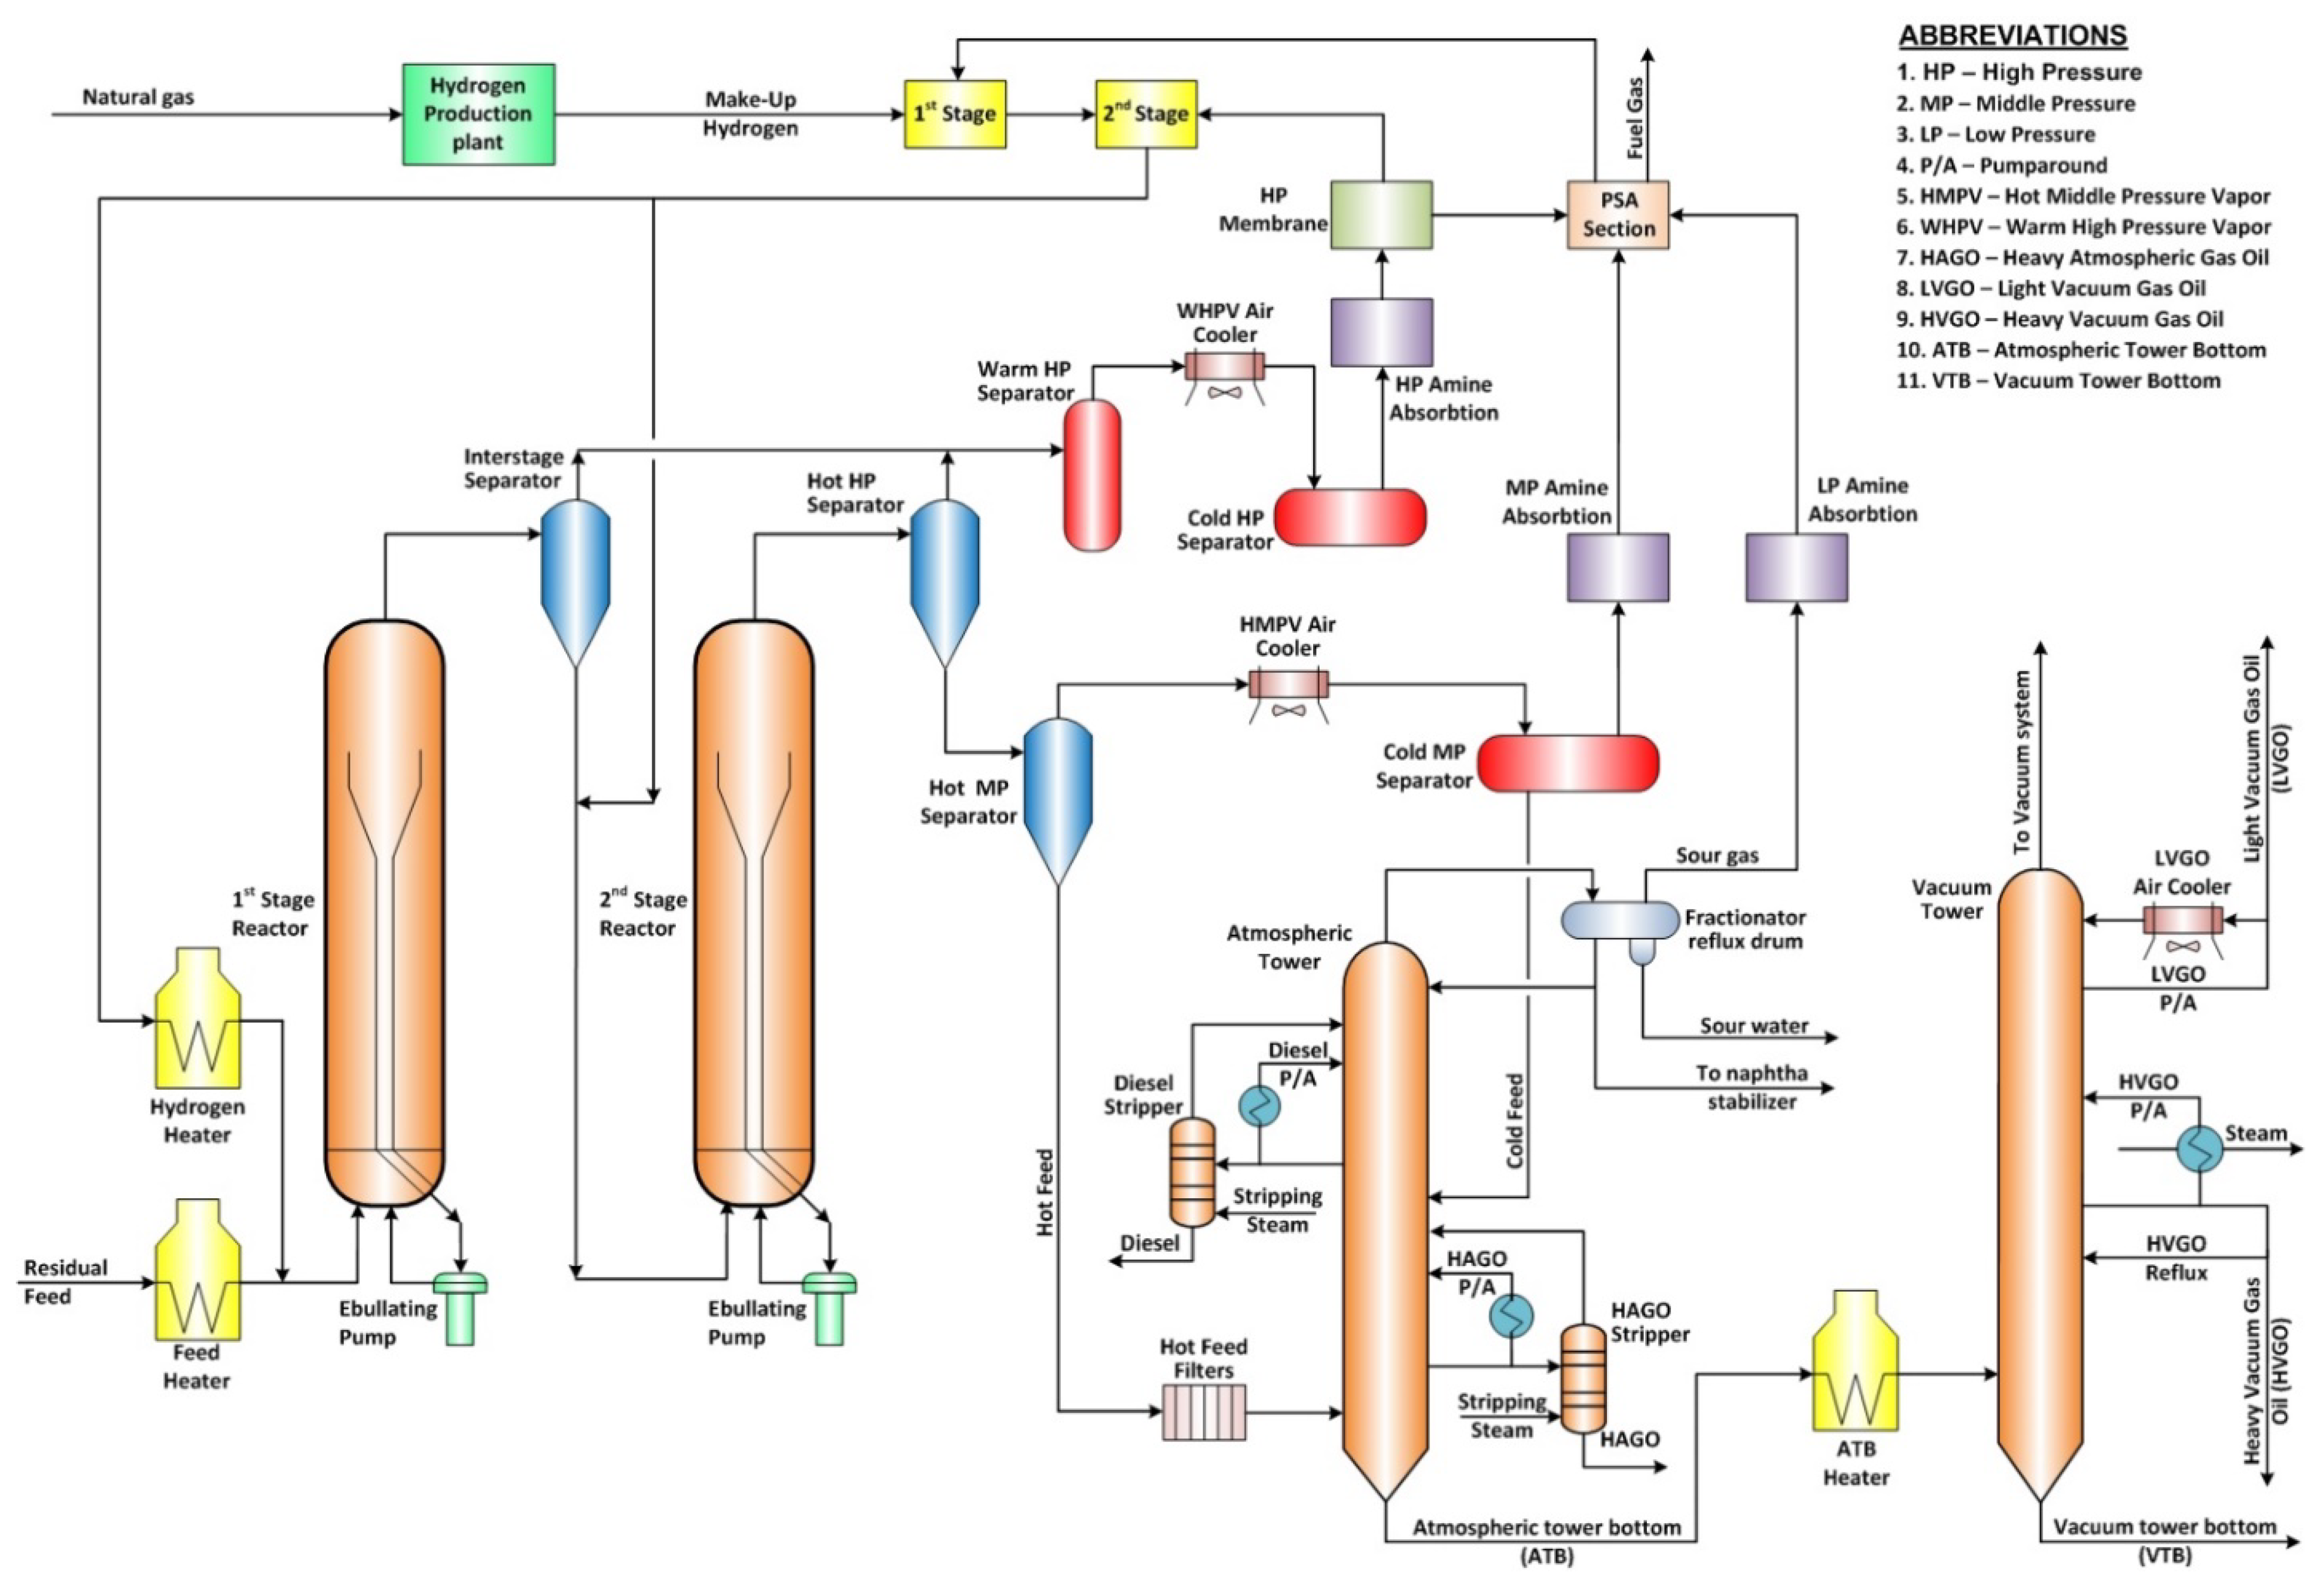
36 different cases of the operation of the LNB H-Oil® ebullated vacuum residue hydrocracking (EBVRHC) with crude slate (this is the crude slate processed in LNB refinery), share (per cent of total fresh vacuum residue feed) of FCC SLO, and of VTB recycle as shown in Figure 4 were studied. The variation of operating conditions and net conversion for the studied 36 cases is summarized in Table 5. A simplified diagram of the LNB H-Oil® hydrocracker where the investigations were performed is presented in Figure 7. A commercial supported Ni-Mo catalyst was employed throughout the study and for some of the cases a nano-dispersed catalyst was also used.
The net vacuum residue 540 °C+ conversion was estimated by the equation:
C o n v e r s i o n ( % ) = E B R H C F e e d 540 ° C + E B R H C P r o d u c t 540 ° C + E B R H C F e e d 540 ° C + 100
where:
EBRHCFeed540 °C+ = mass flow rate of the EBVRHC feed fraction boiling above 540 °C, determined by high temperature simulated distillation, method ASTM D 7169 of the feed and multiplied by the mass flow rate of the feed;
EBRHCProduct540 °C+ = mass flow rate of the EBVRHC product fraction boiling above 540 °C, determined by high temperature simulated distillation, method ASTM D 7169 of the liquid product multiplied by the flow rate of the liquid product.
The methods used to characterize the mixed H-Oil® feed, and the liquid products: naphtha, diesel, HAGO, LVGO, HVGO, VTB, ATB are summarized in Table 6.
The Kw [9] was estimated based on information about density and distillation characteristics by the use of Equation (10).
K w = 1.8 [ T 10 + T 30 + T 50 + T 70 + T 90 5 + 273.15 ] 3 D 15
where:
T10—boiling point of 10% of evaporate according to the HTSD, or physical distillation °C;
T30—boiling point of 30% of evaporate according to the HTSD or physical distillation °C;
T50—boiling point of 50% of evaporate according to the HTSD or physical distillation °C;
T70—boiling point of 70% of evaporate according to the HTSD or physical distillation °C;
T90—boiling point of 10% of evaporate according to the HTSD or physical distillation °C.
The aromatic carbon content of the HAGO, LVGO, and HVGO was estimated by Equation (11) (Conoco Philips Prediction method) [11].
C A = 292.1 S G 0.043 T 50 F 212.2
where:
CA = Aromatic carbon content, wt.%;
SG = specific gravity;
T50F = boiling point of 50% of evaporate according to the HTSD, °F.
The hydrogen content of the HAGO, LVGO, and HVGO was estimated by Equation (12) (Conoco Philips Prediction method) [11].
H = 26.25 S G + 0.0013 T 50 F + 35.2
The molecular weight of the studied H-Oil® mixed feed, HAGO, LVGO, HVGO, ATB, and VTB was estimated by the correlation of Goosens [23] (Equation (13)):
M W = 0.01077 T b [ 1.52869 + 0.06486 L n ( T b 1078 T b   ) ] / d
The correlation developed by Abutaqiya [24] was employed to estimate the average aromatic ring numbers in the average hydrocarbon structure of the investigated EBVRHC heavy oils, designated as ARI. ARI is estimated by Equations (14) and (15).
A R I = f ( M W , F R I ) = 2 [ M W F R I   ( 3.5149 M W + 73.1858 } ( 3.5074 M W 91.972 ( 3.5149 M W + 73.1858 )
where:
MW = molecular weight of EBVRHC heavy oils, g/mol;
FRI = function of refractive index
F R I = ( n D 20 ) 2 1 ( n D 20 ) 2 + 2
where, nD20 = refractive index at 20 °C.
The refractive index was estimated from density at 15 °C by the correlation developed in our earlier research [25] and shown in Equation (16).
n d 20 = 0.77887 D 15 + 0.80065

4. Conclusions

135 parameters including H-Oil® operating conditions and H-Oil® feed and liquid product properties were evaluated by the use of Intercriteria analysis. It was found that the crude oils containing vacuum residue fractions with a lower Kw factor during ebullated bed hydrocracking produce hydrocracked vacuum residue with a higher density, higher Concarbon content, higher viscosity, and higher softening point. The addition of FCC slurry oil and recycle of partially blended fuel oil to the straight run vacuum residual oils decreases the H-Oil® mixed feed Kw that in turn leads to production of higher density hydrocracked vacuum residue, lower Kw gas oils, and lower cetane index diesel. The augmentation of H-Oil® reaction temperature enhances density and decreases Kw of VTB, and H-Oil® gas oils, and reduces the cetane index of diesel. The magnification of through-put amplifies the H-Oil gas oil Kw and diesel cetane index. All investigated factors controlling the properties of the liquid H-Oil® products: hydrocracked vacuum residue, hydrocracked gas oils, and hydrocracked diesel were found to have no impact on the properties of hydrocracked naphtha.
The developed in this work correlations can be used to evaluate the influence of crude oil properties, H-Oil® operating conditions, and the processing of FCC slurry oil, and recycle of partially blended fuel oil on the quality of the H-Oil® products: diesel, HAGO, LVGO, HVGO, and VTB. This information can be used to assess the impact H-Oil feed properties and operating conditions on the performance of the other refinery units which process the H-Oil® products mentioned above and to find the parameters which provide the optimal performance of the whole refinery.

Author Contributions

Conceptualization, E.N.S.; Data curation, R.K.D. and S.N.; Formal analysis, I.P.P. and D.Y.; Investigation, I.V.K.; Methodology, S.S.; Software, V.K.A., S.R. and D.D.S.; Supervision, K.T.A.; Writing—original draft, D.S.S. and I.K.S. All authors have read and agreed to the published version of the manuscript.

Funding

This research was funded by Asen Zlatarov University–Burgas, Project: Center of Excellence UNITE BG05M2OP001-1.001-0004 /28.02.2018 (2018–2023).

Institutional Review Board Statement

Not applicable.

Informed Consent Statement

Informed consent was obtained from all subjects involved in the study.

Data Availability Statement

Not applicable.

Acknowledgments

Krassimir Atanassov acknowledges the support from the project UNITe BG05M2OP001-1.001-0004 /28.02.2018 (2018–2023).

Conflicts of Interest

The authors declare no conflict of interest.

Nomenclature

ATBatmospheric tower bottom product
ARIAromatic ring index (average ring number) in the average EBVRHC heavy oil hydrocarbon structure;
CAAromatic carbon content, wt.%
CCRConradson carbon content, wt.%
CICetane index
D15Density at 15 °C, g/cm3
drelative density at 15 °C, g/cm3
EBVRHCEbullated bed vacuum residue hydrocracking
FCCFluid catalytic cracking
FRH-Oil® unit trough-put (feed low rate), t/h
FRI20function of refractive index
Hhydrogen content, wt.%
HAGOHeavy atmospheric gas oil
HCOHeavy cycle oil
HTSDHigh temperature simulated distillation
HVGOHeavy vacuum gas oil
ICrAInterCriteria Analysis
nd20refractive index
KwWatson characterization factor
KwiWatson characterization factor of the of ith pure component in the mixture
LNBLUKOIL Neftohim Burgas refinery
LVGOLight vacuum gas oil
μconsonance
MWmolecular weight, g/mol
PBFOPartially blended fuel oil
SGspecific gravity
SLOSlurry oil
SRVROStraight run vacuum residual oil
T50Fboiling point of 50% of evaporate according to the HTSD, °F
Tbnormal boiling point or 50 wt % of evaporate according to the HTSD, K
T10boiling point of 10% of evaporate according to the HTSD, or physical distillation, °C
T30boiling point of 30% of evaporate according to the HTSD or physical distillation, °C
T50boiling point of 50% of evaporate according to the HTSD or physical distillation, °C
T70boiling point of 70% of evaporate according to the HTSD or physical distillation, °C
T90boiling point of 10% of evaporate according to the HTSD or physical distillation, °C
Rec.per cent of PBFO recycle in the H-Oil® mixed feed, wt.%.
VGOVacuum gas oil
VTBVacuum tower bottom product (equivalent to unconverted hydrocracked vacuum residue)
WABTaverage weight average bed temperature of both reactors in LNB H-Oil® unit, °C
VISkinematic viscosity at 80 °C, mm2/s
Xiweight fraction of ith pure component in the mixture

References

  1. Stratiev, D.; Nenov, S.; Shishkova, I.; Georgiev, B.; Argirov, G.; Dinkov, R.; Yordanov, D.; Atanassova, V.; Vassilev, P.; Atanassov, K. Commercial Investigation of the Ebullated-Bed Vacuum Residue Hydrocracking in the Conversion Range of 55–93%. ACS Omega 2020, 51, 33290. [Google Scholar] [CrossRef] [PubMed]
  2. Stratiev, D.; Nenov, S.; Shishkova, I.; Dinkov, R.; Argirov, G.; Georgiev, B.; Yordanov, D.; Atanassova, V.; Vassilev, P.; Atanassov, K. Non-linear least-squares method for modeling vacuum residue hydrocracking selectivity data. submitted for publication in Oxidation Communications.
  3. Stratiev, D.; Shishkova, I.; Ivanov, M.; Dinkov, R.; Georgiev, B.; Argirov, G.; Atanassova, V.; Vassilev, P.; Atanassov, K.; Yordanov, D.; et al. Catalytic cracking of diverse vacuum residue hydrocracking gas oils. Chem. Eng. Technol. 2021, 44, 1–13. [Google Scholar] [CrossRef]
  4. Stratiev, D.; Shishkova, I.; Ivanov, M.; Dinkov, R.; Georgiev, B.; Argirov, G.; Atanassova, V.; Vassilev, P.; Atanassov, K.; Yordanov, D.; et al. Role of Catalyst in Optimizing Fluid Catalytic Cracking Performance During Cracking of H-Oil-Derived Gas Oils. ACS Omega 2021, in press. [Google Scholar] [CrossRef] [PubMed]
  5. Dinkov, R.; Kirilov, K.; Stratiev, D. Feasibility of Bitumen Production from Unconverted Vacuum Tower Bottom from H-Oil Ebullated Bed Residue Hydrocracking. Ind. Eng. Chem. Res. 2018, 57, 2003. [Google Scholar] [CrossRef]
  6. Stratiev, D.; Shishkova, I.; Dinkov, R.; Kirilov, K.; Yordanov, D.; Nikolova, R.; Veli, A.; Tavlieva, M.; Vasilev, S.; Suyunov, R. Variation of Oxidation Reactivity of Straight Run and H-Oil Hydrocracked Vacuum Residual Oils in the Process of Road Asphalt Production. Road Mater. Pavement Des. 2021, 1–25. [Google Scholar] [CrossRef]
  7. Naghizada, N.; Prado, G.H.C.; de Klerk, A. Uncatalyzed Hydrogen Transfer during 100−250 °C Conversion of Asphaltenes. Energy Fuels 2017, 31, 6800–6811. [Google Scholar] [CrossRef] [Green Version]
  8. Stratiev, D.S.; Marinov, I.M.; Shishkova, I.K.; Dinkov, R.K.; Stratiev, D.D. Investigation on feasibility to predict the content of saturate plus mono-nuclear aromatic hydrocarbons in vacuum gas oils from bulk properties and empirical correlations. Fuel 2014, 129, 156–162. [Google Scholar] [CrossRef]
  9. Watson, K.M.; Nelson, E.F.; Murphy, G.B. Characterization of Petroleum Fractions. Ind. Eng. Chem. 1935, 27, 1460–1464. [Google Scholar] [CrossRef]
  10. Stratiev, D.; Shishkova, I.; Tsaneva, T.; Mitkova, M.; Yordanov, D. Investigation of relations between properties of vacuum residual oils from different origin, and of their deasphalted and asphaltene fractions. Fuel 2016, 170, 115–129. [Google Scholar] [CrossRef]
  11. Choudhary, T.V.; Meier, P.F. Characterization of heavy petroleum feedstocks. Fuel Process. Technol. 2008, 89, 697–703. [Google Scholar] [CrossRef]
  12. Herrera, P.S.; Oballa, M.C.; Somogyvari, A.F.; Monnier, J. Catalyst selection for hydrotreating diesel fuel from residue hydrocracking. ACS Prepr. 1992, 37, 1855–1863. [Google Scholar]
  13. Wandas, R.; Chrapek, T. Hydrotreating of middle distillates from destructive petroleum processing over high-activity catalysts to reduce nitrogen and improve the quality. Fuel Process. Technol. 2004, 85, 1333–1343. [Google Scholar] [CrossRef]
  14. Tomášek, J.; Matĕjovský, L.; Lamblová, M.; Blažek, J. Properties and Composition of Products from Hydrotreating of Straight-Run Gas Oil and Its Mixtures with Light Cycle Oil over Sulfidic Ni-Mo/Al2O3 Catalyst. ACS Omega 2020, 5, 27922–27932. [Google Scholar] [CrossRef] [PubMed]
  15. Dinkov, R.; Stratiev, D. Studying The Evolution of H-OIL Hydrocracked Residual Oil Properties In The Conversion Range 65–93%, and the Opportunity To Produce Road Asphalt From H-OIL VTB. Oxid. Commun. 2021, 5, 33290–33304. [Google Scholar]
  16. Gharagheizi, F.; Fazeli, A. Prediction of the Watson Characterization Factor of Hydrocarbon Components from Molecular Properties. QSAR Comb. Sci. 2008, 27, 758–767. [Google Scholar] [CrossRef]
  17. Chabot, J.; Shiflett, W. Residuum Hydrocracking: Chemistry and Catalysis. Available online: https://www.digitalrefining.com/article/1002340/residuum-hydrocracking-chemistry-and-catalysis#.YK9AZaFRVPY (accessed on 6 April 2021).
  18. Sánchez, S.; Rodríguez, M.A.; Ancheyta, J. Kinetic model for moderate hydrocracking of heavy oils. Ind. Eng. Chem. Res. 2005, 44, 9409–9413. [Google Scholar] [CrossRef]
  19. Loria, H.; Trujillo-Ferrer, G.; Sosa-Stull, C.; Pereira-Almao, P. Kinetic modeling of bitumen hydroprocessing at in-reservoir conditions employing ultradispersed catalysts. Energy Fuels 2011, 25, 1364–1372. [Google Scholar] [CrossRef]
  20. Martínez, J.; Ancheyta, J. Kinetic model for hydrocracking of heavy oil in a CSTR involving short term catalyst deactivation. Fuel 2012, 100, 193–199. [Google Scholar] [CrossRef]
  21. Asaee, S.D.S.; Vafajoo, L.; Khorasheh, F. A new approach to estimate parameters of a lumped kinetic model for hydroconversion of heavy residue. Fuel 2014, 134, 343–353. [Google Scholar] [CrossRef]
  22. Sharafutdinov, I.; Stratiev, D.; Shishkova, I.; Dinkov, R.; Pavlova, A.; Petkov, P.; Rudnev, N. Dependence of cetane index on aromatic content in diesel fuels. OGEM 2012, 38, 148–152. [Google Scholar]
  23. Goossens, A.G. Prediction of Molecular Weight of Petroleum Fractions. Ind. Eng. Chem. Res. 1996, 35, 985. [Google Scholar] [CrossRef]
  24. Abutaqiya, M. Advances in Thermodynamic Modeling of Nonpolar Hydrocarbons and Asphaltene Precipitation in Crude Oils. Ph.D. Thesis, Rice University, Houston, TX, USA, 2019. [Google Scholar]
  25. Stratiev, D.; Shishkova, I.; Tankov, I.; Pavlova, A. Challenges in characterization of residual oils. A review. J. Petrol. Sci. Eng. 2019, 178, 227–250. [Google Scholar] [CrossRef]
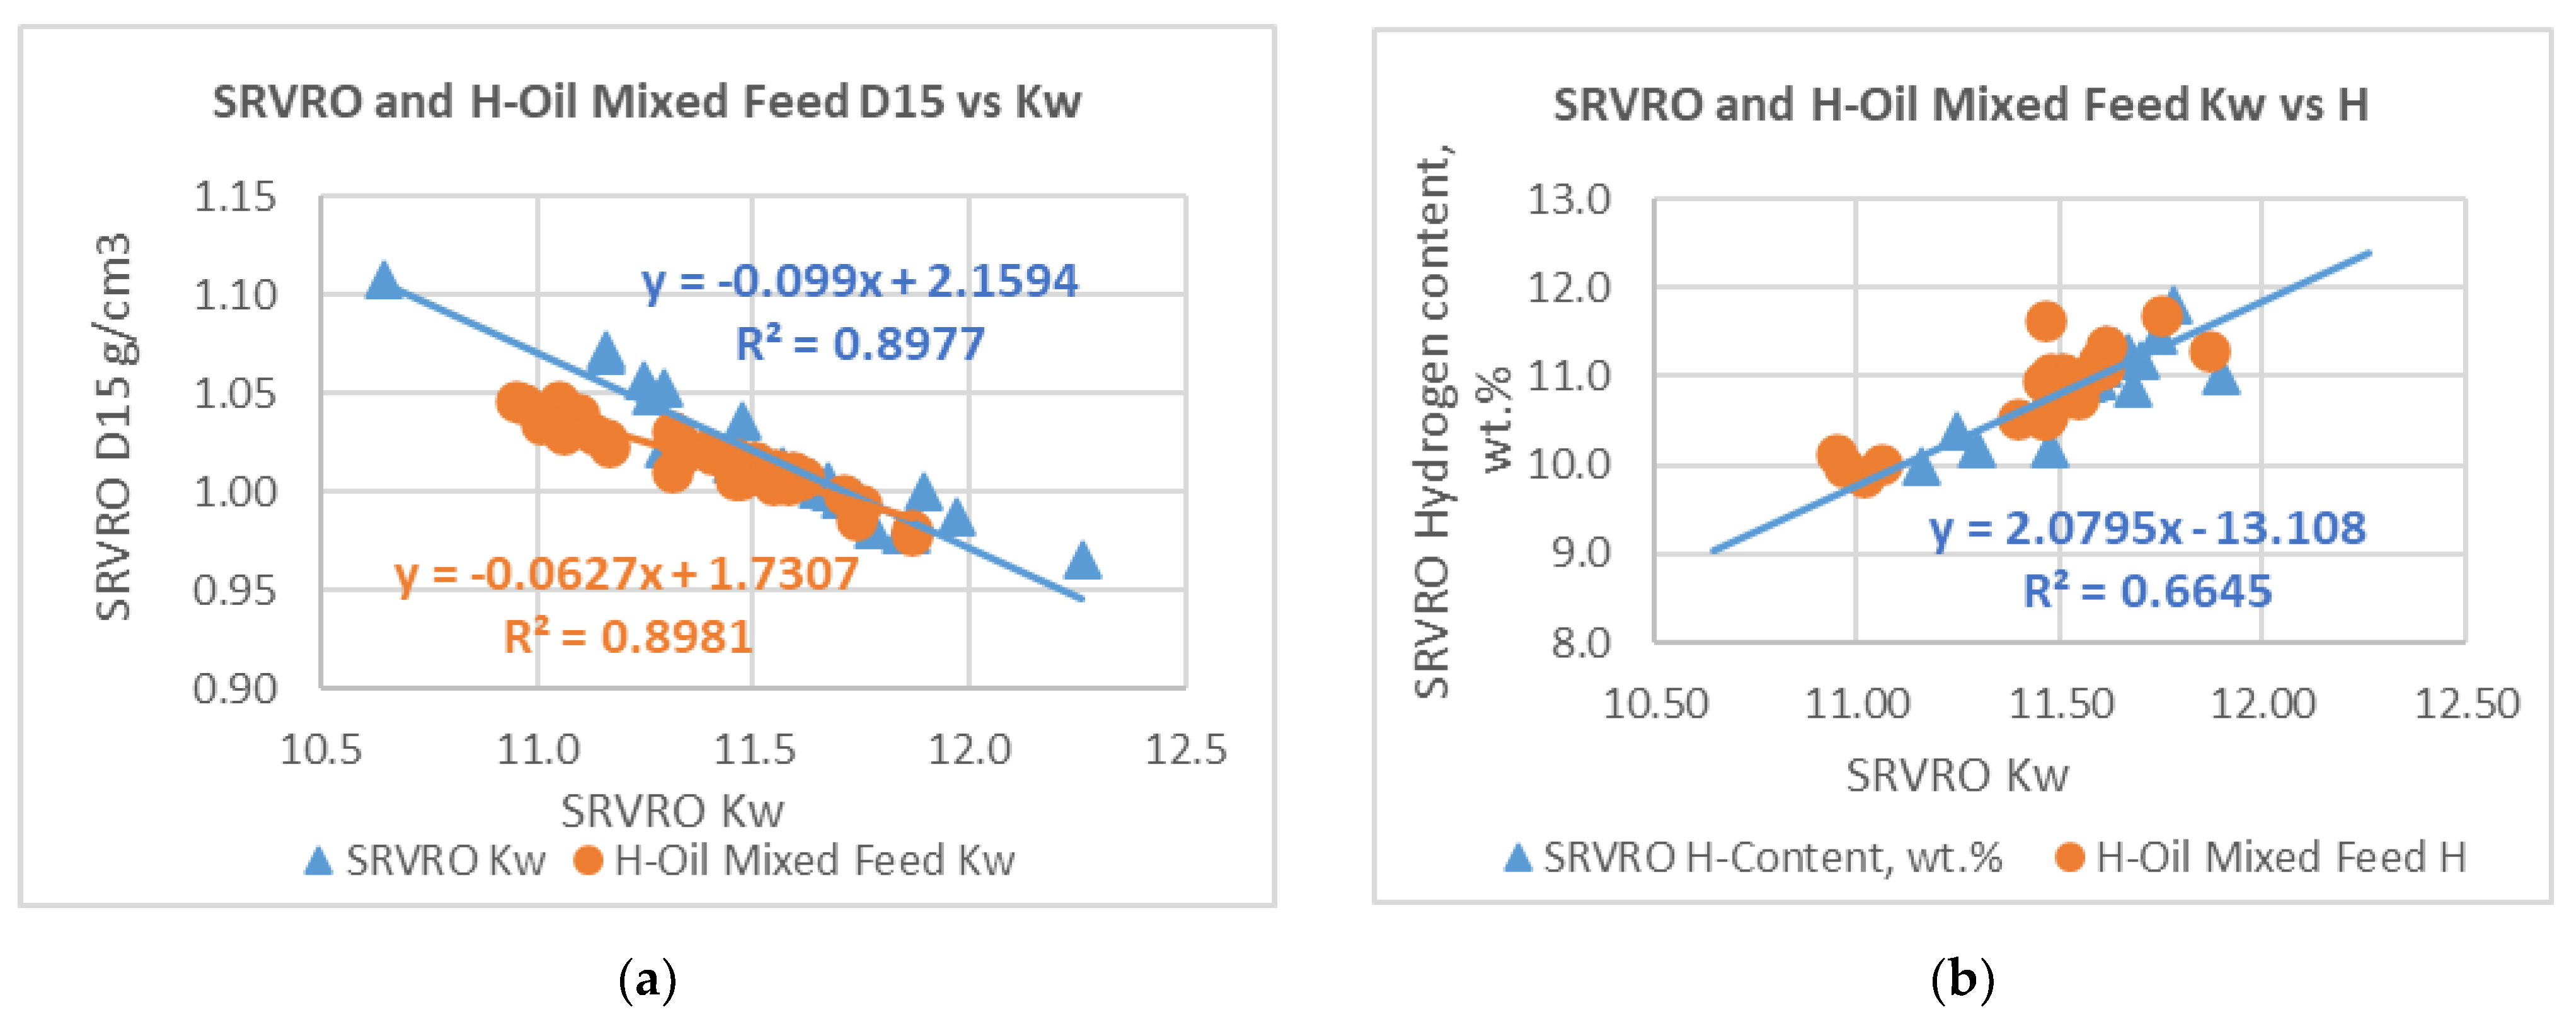
Figure 1. Correlations of Kw, density, and hydrogen content of H-Oil® mixed feed (ac) SRVRO (ac), and of H-Oil® ATB, and VTB (df).
Processes 09 00952 g001aProcesses 09 00952 g001b
Figure 2. Dependence of the consonanse of mixed feed Kw and Kw of H-Oil® liquid products on the average boiling point of the liquid products.
Processes 09 00952 g002
Figure 3. Kw for the blended SRVROs, the mixture SRVRO-FCC SLO, and for the mixed feed.
Processes 09 00952 g003
Figure 4. Crude slate processing, FCC SLO and Recycle of VTB share in the H-Oil® feed.
Processes 09 00952 g004
Figure 5. Dependence of density (a), viscosity (b), and softening point (c) of H-Oil®VTB on Concarbon content.
Processes 09 00952 g005
Figure 6. Variation of H-Oil® VTB softening point with increasing of HVGO content in the blend VTB-HVGO (a), and dependence of the slope of decreasing of the softening point of the blend VTB-HVGO on the softening point of the pure VTB (b).
Processes 09 00952 g006aProcesses 09 00952 g006b
Figure 7. Process flow diagram of the LUKOIL Neftohim Burgas ebullated bed residue H-Oil® hydrocracker.
Processes 09 00952 g007
Table 1. µ-value of ICrA for the evaluation of relations between H-Oil® gas oils parameters contents of aromatic carbon, and hydrogen, and density, and molecular weight.
HAGO KwHAGO ARIHAGO CAHAGO HHAGO D15LVGO D15LVGO KwLVGO
CA
LVGO
H
LVGO ARIHVGO KwHVGO
CA
HVGO
H
HVGO D15HVGO ARI
HAGO Kw1.00
HAGO ARI0.051.00
HAGO CA0.000.961.00
HAGO H0.990.020.001.00
HAGO D150.020.990.990.001.00
LVGO D150.020.970.990.010.991.00
LVGO Kw0.990.080.020.970.030.021.00
LVGO CA0.010.940.990.020.980.990.001.00
LVGO H0.990.040.010.990.010.000.990.001.00
LVGO ARI0.050.980.960.030.980.980.070.950.031.00
HVGO Kw0.930.110.070.930.020.040.970.030.960.111.00
HVGO CA0.070.900.930.070.930.960.030.970.030.900.001.00
HVGO H0.930.090.060.940.060.040.970.030.970.090.990.001.00
HVGO D150.070.910.940.060.940.970.030.970.030.920.011.000.001.00
HVGO ARI0.060.940.950.040.960.970.050.960.030.940.060.050.030.981.00
Table 2. Variation in the properties of liquid H-Oil® EBVRHC products.
H-Oil Liquid Products PropertiesRangeMixed FeedNaphthaDieselATBHAGOLVGOHVGOVTB
Sulphur, wt.%Min2.550.020.080.590.360.410.500.94
Max3.920.040.271.360.760.891.172.21
Density at 15 °C, g/cm3Min0.9790.6980.8410.9150.8990.9020.9210.961
Max1.0460.7270.8751.0870.9580.9851.0131.148
Kw-charaterzing factorMin10.912.011.410.211.110.910.910.1
Max11.912.512.112.211.911.912.012.0
Diesel Cetane IndexMin--38.2--- --
Max--67.1-----
Hydrogen content, wt.%Min9.9--8.91110.3 9.87.8
Max11.7--12.212.612.5 12.211.7
Micro carbon residue, wt.%Min12------17.9
Max23.6------45.6
C5 asphaltenes, wt.%Min9.3------21.8
Max28.5------91
C7 asphaltenes, wt.%Min7.2--2.7---12.1
Max26.7--17.3---67
Nitrogen content, wt.%Min0.21--0.34---0.36
Max0.52--0.61---0.86
Nickel, ppmMin38------19
Max75------84
Vanadium, ppmMin110------39
Max245------191
Sodium, ppmMin12------7
Max41------95
Iron, ppmMin4------0.3
Max69------113
Diesel Mono-Aromatic Hydrocarbons, wt.%Min---21.9----
Max---37.6----
Diesel Di-Aromatic Hydrocarbons, wt.%Min---3.9----
Max---10.9----
Diesel Tri-Aromatic Hydrocarbons, wt.%Min---0.7----
Max---12.2----
MW, g/molMin492--323271286343482
Max683--583341348440737
CA, wt.%Min----17.41918.1-
Max----3642.545.4-
Aromatic ring indexMin4.1--1.61.31.41.93.5
Max5.4--4.32.12.53.46.5
Table 3. Some statistically meaningful relations (µ-value) between the H-Oil® feed properties, H-Oil® operating conditions and H-Oil® product properties established by the use of Intercriteria analysis.
FRWABTRec.VTB D15Diesel KwHAGO KwLVGO KwHVGO
Kw
ATB KwFeed Kw
FR1.00---------
WABT0.431.00--------
Rec.0.330.551.00------
VTB D150.290.870.751.00------
Diesel Kw0.790.220.460.221.00-----
HAGO Kw0.680.080.480.140.821.00---
LVGO Kw0.720.100.500.080.790.991.00---
HVGO Kw0.740.110.210.070.780.930.971.00--
ATB Kw0.730.130.190.040.770.860.940.961.00-
Feed Kw0.720.120.220.000.790.870.920.950.971.00
Table 4. 1 µ-value of ICrA for the evaluation of relations of H-Oil® VTB properties density, Concarbon content (CCR), kinematic viscosity of blends 70%VTB/30%FCC HCO, and softening point.
VTB D15VTB CCRVTB VIS (70%VR/30%HCO) at 80 °C, mm2/sSoftening Point, °C
VTB D15, g/cm31.00---
VTB CCR, wt.%0.991.00--
VTB VIS (70%VTB/30%HCO) at 80 °C, mm2/s0.920.951.00
Softening point, °C0.950.950.961.00
Table 5. Operating conditions in LNB H-Oil® hydrocracker for the studied 36 cases.
CaseTrough-Put, t/hWABT, °CFCC SLO, wt.% of FeedRecycle,
wt.% of Feed
Recycle Gas/Oil Ratio, R-1001 kg/tRecycle Gas Hydrogen Content, wt (vol.) %Net Conversion, wt.%First Reactor Inlet Pressure, Bar First Reactor Inlet H2 Partial Pressure, Bar
13134180020.695.765.0173166
228541000--55.0174-
32794110024.495.654.7173166
43064140021.88956.1174155
52934180021.897.767.3173169
61724190037.397.776.8173169
72394200028.79771.2173168
82404180029.497.570.1173169
92304190030.197.667.5174170
102084230033.29772.9174168
112444240022.597.672.5174169
122454268022.597.675.3174169
1326342780--70.7173-
142664309019.897.474.3173169
152364174024.698.363.4173170
162244149029.198.560.4173171
1719541712033.699.367.3173171
1822742510029.699.171.7174172
192474268029.8-75.1174-
202504256028.09372.9173161
212144268016.092.376.3174160
222564278026.190.874.1174158
232574338026.088.879.0174154
2424243380--80.8174-
2522543314028.587.780.3173152
26142429141043.087.185.9173151
271274301210.0--90.3173-
281234311329.451.792.593.2173160
29128433112744.986.992.6173150
30126433122647.890.291.1173156
31140434111844.789.991.1173155
32146434142139.582.487.5173142
3315643292240.287.589.5172151
341824354.919.2--86.2172-
351784355.09.835.489.887.2172155
361754365.10.035.587.485.2172151
Table 6. Methods employed to measure properties of the LNB H-Oil® mixed feed and liquid products.
Density of Mixed Feed, g/cm3BDS EN ISO 3675
Sulfur of mixed feed, ATB, VTB, HAGO, LVGO, HVGO, Diesel wt.%ASTM D 4294
Asphaltene (C7, and C5) content, wt.%ASTM D 6560
Micro carbon content, wt.%EN ISO 10370
Specific viscosity, °EASTM D1665
Carbon content, wt.%ASTM D 5291
Hydrogen content, wt.%ASTM D 5291
Nitrogen content, wt.%ASTM D 5291
Nickel, ppmIP 501
Vanadium, ppmIP 501
Sodium, ppmIP 501
Iron, ppmIP 501
High temperature simulation distillation (HTSD)ASTM D7169
Density of naphtha, g/cm3BDS EN ISO 12185
Sulfur of naphtha, ppmBDS EN ISO 20846
Distillation of naphtha and dieselBDS EN ISO 3405
Density of diesel, g/cm3BDS EN ISO 3675
Diesel Aromatic hydrocarbons, wt.%BDS EN 12916
Diesel Cetane IndexASTM D4737
Publisher’s Note: MDPI stays neutral with regard to jurisdictional claims in published maps and institutional affiliations.