Abstract
Liquid loading in gas wells may slash production rates, shorten production life, or even stop production. In order to reveal the mechanism of liquid loading in gas wells and predict its critical flowrates, theoretical research and laboratory experiments were conducted in this work. A new model of liquid-film reversal was established based on Newton’s law of internal friction and gas–liquid two-phase force balance, with the critical reverse point obtained using the minimum gas–liquid interface shear force method. In this model, the influences of the pipe angle on the liquid film thickness were considered, and the friction coefficient of the gas–liquid interface was refined based on the experimental data. The results showed that the interfacial shear force increases by increasing the liquid superficial velocity, which leads first to an increase of the critical liquid-carrying gas velocity and then to a decrease, and the critical production also decreases. With 0° as the vertical position of the pipeline and an increase of the inclination angle, the critical liquid-carrying velocity first increases and then decreases, and the maximum liquid-carrying velocity appears in the range of 30–40°. In addition, the critical liquid-carrying gas velocity is positively correlated with the pipe diameter. Compared with the previous model, the model in this work performed better considering its prediction discrepancy with experiment data was less than 10%, which shows that the model can be used to calculate the critical liquid-carrying flow rate of gas wells. The outcome of this work provides better understanding of the liquid-loading mechanism. Furthermore, the prediction model proposed can provide guidance in field design to prevent liquid loading.
1. Introduction
Due to the intrusion of formation water or the precipitation of condensate, gas wells often appear as gas and water co-production. In the early stage of production, the gas reservoir has sufficient energy and the gas can carry liquid to the surface at a higher speed. However, as the gas reservoir depletes, the gas velocity decreases [1], the formation pressure attenuates, and the temperature decreases, so that the gas cannot carry the formation liquid out of the wellbore. This phenomenon is called liquid loading of gas wells [2,3,4]. Geng et al. also pointed out that the discontinuity of gas is the fundamental cause of gas-well effusion [5], so it is easy to form effusion in the middle and late stage of gas-well production.
Liquid loading in the wellbore has many drawbacks—it creates a back pressure against the formation pressure and increases the instability of production, resulting in a significant reduction in output, or even shutdown ahead of time [6,7,8,9,10,11,12,13,14]. Therefore, some mitigation measures need to be taken to drain the wellbore. At present, the commonly used drainage methods include foam dewatering in gas wells, gas lift drainage, and downhole nebulizers [12]. In order to make better use of drainage measures, it is necessary to know when to carry out drainage gas production, that is, to predict when liquid loading will occur in gas wells. Accurate prediction of liquid loading in gas wells requires in-depth study of the mechanism, analysis of the causes of the liquid loading, and establishment of a reasonable prediction model.
The minimum gas flow rate that can prevent liquid accumulation in the gas well is called the critical liquid-carrying flow rate. The corresponding flow rate is called the critical liquid-carrying flow rate of the gas well. The calculation of critical liquid-carrying gas velocity and critical production is an important method for predicting liquid loading, which is of great significance for ensuring the normal production of gas wells. The theory of liquid-droplet reversal and liquid-film reversal are two main viewpoints to explain the mechanism of liquid loading in gas wells. The droplet-reversal theory holds that when the gas velocity in the wellbore decreases, the droplets flow downward and reverse under the action of gravity, which leads to the phenomenon of liquid loading. The most popular model is an equation developed by Turner et al. [15]. Many researchers have modified Turner’s equation, and applied it to different flow patterns, pipe conditions, and field data [16,17,18,19,20,21]. Pressure drive plays an important role in the accumulation of liquid in gas wells, but the variation of pressure drop is rarely discussed in the existing research; the liquid-film reversal theory holds that the liquid mainly exists in the pipe wall in the form of liquid film. When the gas velocity is higher, the gas carries the liquid film upward. But as the gas velocity decreases, the shear force between the gas and liquid phases is not enough to carry the liquid film flow, and the liquid film begins to reverse under the action of gravity, resulting in liquid loading. Wallis investigated the liquid entrainment in the gas core and proposed a liquid-film model to predict the critical gas velocity [22]. On the basis of the theory of liquid-film reversal, Barnea [23] modified the existing model to explore the influence of liquid-film stability on the flow pattern of two-phase flow. Some researchers have established the flow equation by comprehensively considering the pipeline conditions and other factors, and theoretically predicted the critical liquid-carrying parameters [24,25,26,27]. Compared with the field data, the model can give an effective prediction, but the analysis of the influence factors of the critical liquid loading model still lack intuitive experimental verification. In addition, because the liquid loading is a transient behavior of production decline, some scholars have also explained and analyzed the phenomenon from the perspective of wellbore–reservoir coupling in recent years. However, this is only in the theoretical research stage, and there is no calculation model that can be popularized and applied.
In the field operation, the liquid-loading prediction model based on the droplet inversion theory has been widely used, but there has been a lack of systematic theoretical prediction and experimental proof. In recent years, through laboratory experiments, some scholars found that the liquid-film reversal is more likely the cause of liquid loading at low gas velocity, especially in inclined wells. Previous studies have shown that the accuracy of the liquid-film reversal model is higher, and it can better reflect the behavior of gas–liquid two-phase flow [19]. At present, the most widely used model of liquid-film reversal is the theory proposed by Barnea [23]. Although the liquid film inversion model is more complex, it is more consistent with the experimental phenomenon of gas–liquid two-phase annular flow.
Therefore, this work studies the mechanism of liquid accumulation, establishes a theoretical model, calculates the critical liquid-carrying flow rate, and realizes the theoretical prediction of liquid loading in gas wells. In order to further verify the effectiveness of the prediction model, the two-phase flow at low gas velocity in the wellbore was simulated by indoor experiments, and a large amount of field data was used to verify the universality of the model.
2. Governing Equations
2.1. Analysis of Liquid-Film Reversal
There are two ways to judge the prediction point of liquid-film reversal: criterions of minimum gas–liquid interface shear force and zero wall shear force. The two kinds of criteria are, respectively, obtained from the analysis of liquid film flow stability and the laminar flow velocity assumption. However, there are some differences in the critical gas velocity obtained by the two kinds of methods. Therefore, it is necessary to analyze the judgment criteria of liquid-film reversal before building the theoretical model.
2.1.1. Stability Analysis
The essence of the liquid-film reversal model proposed by Barnea [23] is the transition from annular flow to stirring flow. According to the relationship between dimensionless liquid film thickness and gas–liquid interfacial shear force shown as Equation (1), the stability of liquid film can be analyzed as follows:
According to the gas equilibrium equation, the relationship between the interfacial shear stress and the gas flow rate is as follows [23]:
where is interface shear force, Pa; is the velocity, m/s; and and are the dimensionless superficial liquid velocity and gas velocity, respectively, m/s. In multiphase flow, the superficial velocity is expressed as the velocity of a single fluid flowing through the area; is the dimensionless liquid film thickness; is the interfacial friction coefficient; is the pipe diameter, m; is the angle of inclination from the horizontal; is the liquid phase density, kg/m3; is the constant related to the friction coefficient, and is the gravitational acceleration m/s2.
As shown in Figure 1, in the curve of the relationship between the liquid film thickness and the interfacial shear force, when the gas phase curve intersects to the right of the lowest point of the liquid phase curve (as shown in point B in the figure), the liquid film thickness increases, the interfacial shear force required by the liquid film increases, and the interfacial shear force of gas phase also increases. The interaction between gas and liquid leads to the divergence of the liquid film thickness and interfacial shear force. This physical phenomenon is characterized by the instability of the liquid film and the flow state of liquid film cannot maintain the same as that at point B. When the gas phase curve intersects on the left side of the lowest point of the liquid phase curve (as shown in point A in Figure 1), if the liquid film thickness increases, the interfacial shear force required by the liquid phase decreases, and the interfacial shear force of the gas phase increases. The interaction between the gas and liquid phases causes the liquid film thickness and interfacial shear force to return to the same as at point A, so point A is the stable flow point of the liquid film.
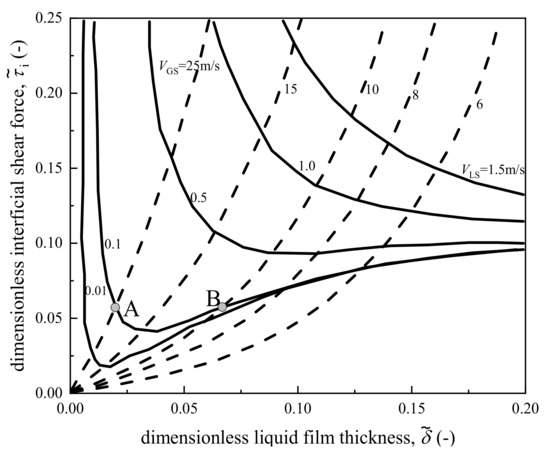
Figure 1.
Relationship between dimensionless interfacial shear force and liquid film thickness.
According to the analysis, it can be concluded that the minimum value of liquid phase curve is the critical point of liquid film stable flow, and the gas velocity corresponding to this point is the critical velocity of liquid-film reversal.
2.1.2. Criteria for Judging Liquid-Film Reversal
Some researchers believe that the flow state of the liquid film in the annular flow is laminar flow. When the gas velocity is not enough to carry the liquid film continuously upward, the liquid film velocity near the wall will decrease to zero, and the corresponding wall shear force will also be close to zero. This method can be derived from N–S equation or Hagen–Poiseuille equation.
In this work, Newton’s law of internal friction and force balance are used to analyze the liquid film. Assuming that the thickness of the liquid film attached to the pipe wall is small enough in annular flow, the relationship between the shear force and the velocity gradient of the liquid film can be obtained according to Newton’s law of internal friction and the balance of forces:
where is the interfacial shear force, Pa; is the liquid dynamic viscosity, Pa·s; is the radial distance from the wall, m; is the pressure, Pa; is the axial distance, m; and is the liquid film thickness, m.
By integrating the above formula, the expression of velocity is obtained:
The equation of superficial liquid velocity can be obtained by integrating the expression of velocity on the thickness of liquid film:
The mechanical equilibrium of the gas phase is analyzed, and the relationship is as follows:
Equation (6) is introduced into Equation (5), and the relationship between the interfacial shear force and the superficial velocity of liquid phase and the thickness of liquid film can be obtained:
The dimensionless relationship is:
where is the dimensionless interfacial shear force; is the dimensionless superficial liquid velocity; is the dimensionless liquid film thickness, and the expression of each dimensionless number is as follows:
- Deriving from the relationship between the interface shear force and the liquid film thickness (Equation (8)), the formula of the critical liquid film thickness corresponding to the minimum interfacial shear force criterion is obtained:
- If the wall shear force is equal to zero, the Equation (3) can be rewritten as:
By introducing Equations (6) and (7) into Equation (14), the critical liquid film thickness formula under the zero wall shear criterion can be obtained:
According to Equations (13) and (15), the curves of critical liquid film thickness under different liquid velocities are shown in Figure 2. At the same liquid velocity, the critical liquid film thickness obtained by the zero wall-shear criterion is greater than that obtained by the minimum interface shear criterion, indicating that with the decrease of gas velocity the liquid film first reaches the unstable point, and then reaches the zero wall-shear point. Considering that it is difficult for the liquid film to maintain its shape after reaching the instability point, and the zero wall-shear point may not appear under physical conditions, this study considers that the minimum interfacial shear criterion determines the critical condition of liquid-film reversal.
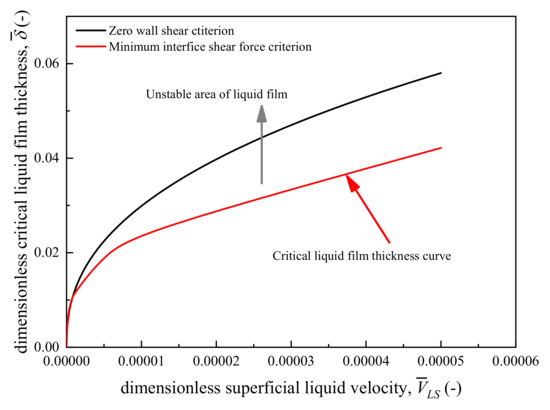
Figure 2.
Comparison of dimensionless liquid film thickness calculated by two criteria.
2.2. Establishment of Liquid-Film Reversal Model
Based on the minimum interfacial shear criterion, the critical thickness and the critical interfacial shear force of liquid film inversion can be obtained. Combined with the flow model of the gas phase, the critical superficial gas velocity of liquid-film reversal can be derived.
The dimensionless expression of critical superficial gas velocity can be obtained by dimensionless transformation of Equation (2).
This is the basic formula for calculating the critical liquid-carrying velocity. The critical gas–liquid interfacial shear force and critical liquid film thickness obtained from Equations (8) and (15) are brought into the above formula to obtain the critical liquid-carrying gas velocity. It should be noted that accurate prediction of the critical velocity also requires reasonable consideration of the effect of the tilt angle on the film thickness and the interfacial friction coefficient. In this model, the empirical relationship proposed by Belforid [19] is used to introduce the influence of tilt angle on the critical liquid-carrying velocity, which is expressed by parameter K.
Differently from previous studies, a new interface friction coefficient is proposed based on the experimental data fitting. Considering that the calculation of liquid film flow in this model still keeps Wallis friction coefficient form [22], the modified friction coefficient expression is:
Based on the above formulas, the expression of critical superficial gas velocity can be obtained:
Differently from the conditions in laboratory, the fluid medium in the wellbore is generally natural gas and water under the condition of high temperature and high pressure, in which natural gas belongs to compressible gas, so it is necessary to obtain the physical parameters of natural gas in the actual wellbore according to the non-ideal gas equation, and then calculate the critical liquid-carrying flow rate. According to the working conditions of a natural gas well, the expression of critical production is as follows:
where q is wellhead production, m3/d; A is cross-sectional area of tubing, m2; P is gas pressure, Pa; is the gas velocity, m/s; Z is natural gas compression factor, and T is ambient temperature, K. In order to facilitate the engineering calculation, the temperature of 25 °C and the pressure of 0.1 MPa are taken as the ambient temperature and atmospheric pressure environmental parameters.
3. Results and Analysis
3.1. The Effect of Interfacial Shear Force on the Critical Liquid-Carrying Gas Velocity
In the vertical pipeline, the shear force at the gas–liquid interface provided by the gas movement is closely related to the gas velocity. The relationship between the critical liquid-carrying gas velocity and the shear force at the gas–liquid interface is shown in Figure 3. When the superficial liquid velocity increases from 0.014 m/s to 0.071 m/s, the corresponding interfacial shear force also increases. It shows that the critical liquid-carrying gas velocity increases with the increase of interfacial shear force. When the interfacial shear force is around 8 Pa, the superficial liquid-carrying gas velocity increases to the maximum. At that time, the critical gas velocity is the gas velocity corresponding to the formation of stable liquid film in the pipeline. However, with the further increase of interfacial shear force, the increase of critical gas velocity is not obvious, or is even slightly decreased. The reason is that increase the interfacial shear force by increasing the superficial velocity of liquid will cause the liquid film to thicken, then the interphase friction will be increased, and the energy loss will be slightly increased, which shows that the superficial gas velocity of liquid-carrying will be reduced.
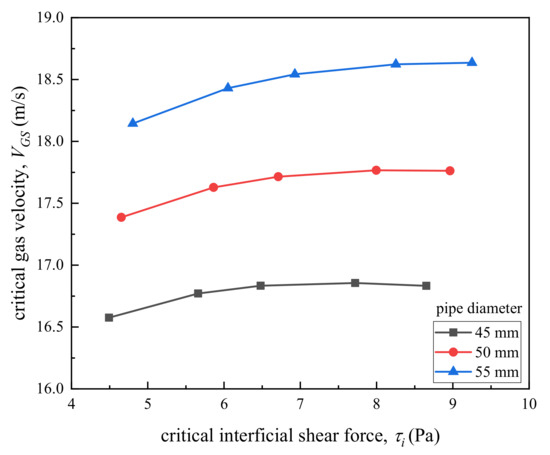
Figure 3.
The relationship between critical gas velocity and critical interface shear.
3.2. Relationship between Critical Liquid-Carrying Gas Velocity and Pipe Conditions
According to the prediction model of critical gas velocity proposed in this work, the change of critical gas velocity with pipe inclination angle can be obtained by further analysis. It can be seen from Figure 4 that the vertical position of the pipeline is set at an inclination angle of 0° and the critical liquid-carrying superficial gas velocity increases first and then decreases with the decrease of the inclination angle of the pipeline. It shows that the gas velocity reaches the maximum value when the pipe angle is 30° to 40° from horizontal position, and then the critical gas velocity gradually decreases when the pipeline continues to tilt. This law exists under different liquid velocities and is consistent with the results of literatures research [28,29], which also verifies the effectiveness of the new model proposed in this work.
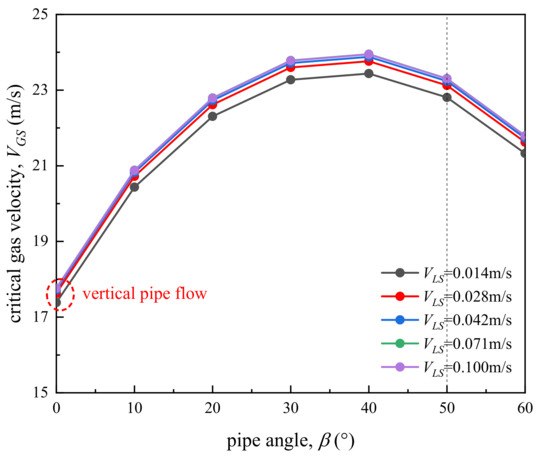
Figure 4.
The relationship between gas velocity and pipe inclination angle.
Figure 5 shows the variation of critical liquid-carrying gas velocity with pipe size under different superficial liquid velocities in the vertical pipeline. The result shows that at the same superficial liquid velocity, the critical liquid-carrying gas velocity is positively correlated with the pipe diameter. According to Wallis’s formula of gas–liquid shear force [22], it can be seen that as the pipe diameter increases, the internal friction decreases, and the drag force of the gas on the liquid film decreases. Conversely, the smaller the pipe diameter, the greater the drag force provided, and the liquid film is more likely to be carried upward and not easily reversed. Therefore, the required liquid-carrying critical gas velocity is relatively small.
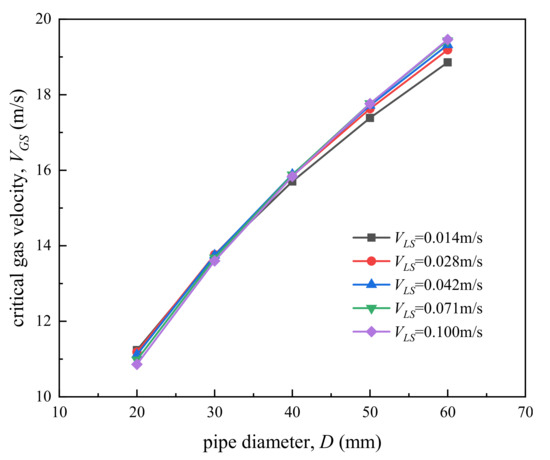
Figure 5.
The relationship between critical liquid-carrying gas velocity and pipe diameter.
3.3. Prediction of Critical Production under Different Values of Liquid-to-Gas Ratio
According to the prediction model, the change of superficial liquid velocity will directly affect the wellhead production, as shown in Figure 6. With the increase of superficial liquid velocity, the critical production decreases. When the liquid velocity increases to 0.015 m/s, the wellhead production begins to drop drastically. This rule is especially obvious when the value of the liquid-to-gas ratio is relatively large, where the liquid-to-gas ratio can be defined as the ratio of superficial liquid velocity and superficial gas velocity, VLS/VGS. Further analysis shows that under the condition of lower liquid velocity, the wellhead production decreases significantly as thereciprocal of gas-liquid ratio increases.
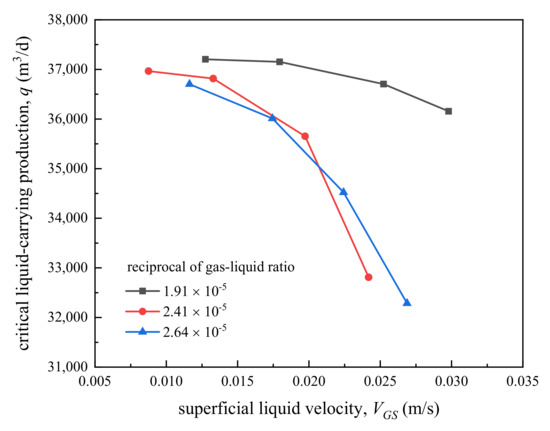
Figure 6.
The relationship between superficial liquid velocity and critical liquid-carrying production.
4. Verification and Evaluation of the Theoretical Prediction Model
4.1. Laboratory Test Verification
In this work, 24 groups of indoor experiment were carried out to simulate the gas–liquid two-phase flow phenomenon in the pipeline and reproduce the liquid reversal behavior. Through experimental observation and parameter measurement, the mechanism of gas-well effusion was studied, and the effectiveness of the theoretical prediction model proposed in this paper was verified.
The experimental work was carried out on the multiphase flow experimental platform of the Institute of Mechanics, Chinese Academy of Sciences. The platform can realize the experimental simulation of gas–liquid and liquid-liquid two-phase pipe flow. The experiment process is shown in Figure 7. The test pipeline is a transparent plexiglass pipe with a height of 3.2 m and a diameter of 50 mm. The liquid is injected through the liquid inlet at the lower part of the pipe, and the gas enters through the bottom of the pipe. When the gas velocity is large enough, the gas carries the liquid upward. The experimental parameters were observed and measured in the fully developed section of the pipeline, at a height of 2.5 m. The droplet size in the gas core could be measured after stripping the liquid film.
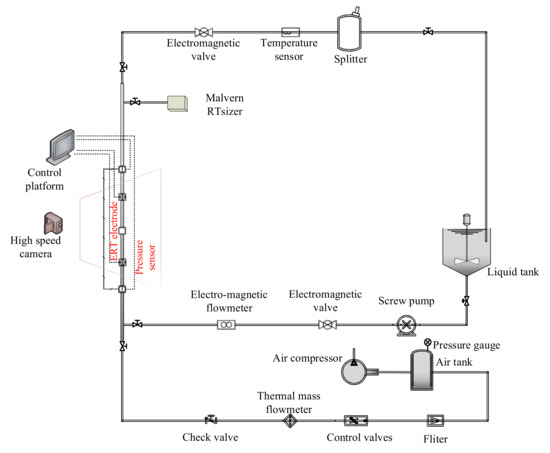
Figure 7.
Experimental flowchart.
The experimental superficial liquid velocity was set to 0.014, 0.028, 0.042, and 0.071 m/s, the superficial gas velocity was 22.64, 19.81, 16.98, 14.15, 11.32, and 8.49 m/s, and the gas–liquid ratio range of the experimental conditions was 1600 to 120. Measurement parameters included camera recording of flow pattern, droplet size, pressure drop, and liquid-film velocity.
4.1.1. Liquid-Film Reversal Mechanism
The experiment conducted online measurements of the droplet size under five different gas–liquid ratio conditions shown as Table 1. The measurement results show that the droplet size decreased with the decrease of the gas–liquid ratio, but the range fluctuation was not large. The largest droplet size distribution occurred when the gas–liquid ratio was 1463. Under this working condition, the droplet size with a cumulative volume fraction of 90% was 1863.87 μm. Figure 8 shows that when the gas–liquid ratio was 1463, the droplet size of 2500 μm increased sharply to 22%. This may have been due to the coalescence behavior of the droplets in the sampling tube under larger gas conditions. The droplet size after coalescence was 2500 μm. Considering that the droplet coalescence may occur in this test, the actual droplet size will be smaller and the maximum droplet size will not exceed 2500 μm. The droplet size with a cumulative volume fraction of 50% ranged from 50 μm to 192 μm, and the droplet size with a cumulative volume fraction of 10% ranged from 7.56 μm to 30.50 μm. These results indicate that most of the droplets were smaller in size. Therefore, the following conclusion can be drawn—under the liquid reversal condition, the droplet size does not exceed 2500 μm at most.

Table 1.
Droplet size distribution under five different gas–liquid ratios.
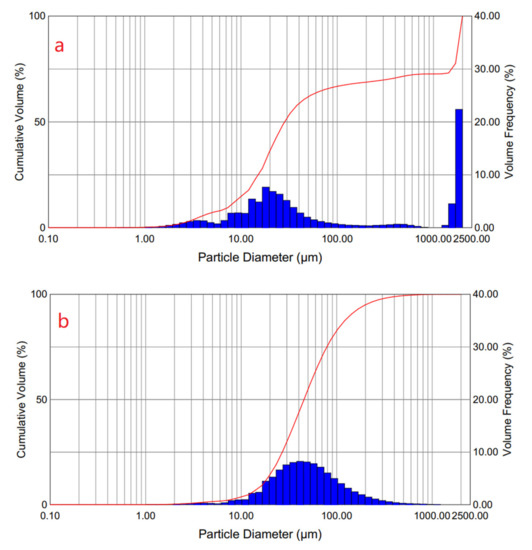
Figure 8.
Droplet size distribution: (a) gas–liquid ratio is 1463 and (b) gas–liquid ratio is 300.
The maximum droplet size calculated using the droplet reversal model [16] ranged from 3201 μm to 9024 μm, which is much larger than the droplet size measured in this work (2500 μm). This shows that droplet reversal is not the dominant factor in the formation of liquid accumulation in gas wells. It can be seen that the liquid-film reversal mechanism selected in this study is reasonable, which is supported by experimental data.
4.1.2. Correlation between Pressure Drop and Liquid-Film Reversal
Figure 9 shows the relationship between the experimental value of pressure drop and the superficial gas velocity. The change trend of the pressure-drop curve under different liquid velocities was consistent—the measured value of pressure drop decreased with the decrease of gas velocity. When it decreased to a minimum value, the pressure drop increased with the decrease of gas velocity.
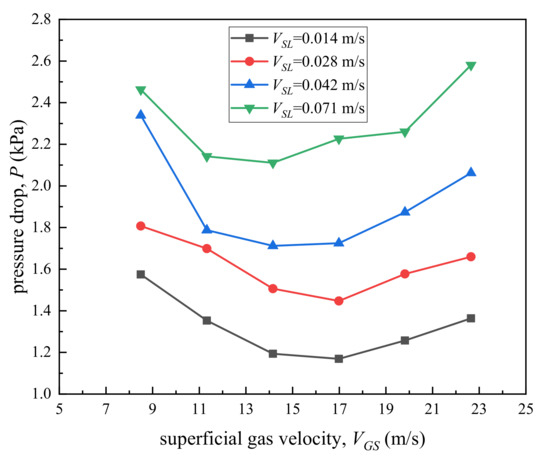
Figure 9.
Variation of total pressure gradient with gas velocity.
In most cases, the acceleration pressure drop is very small and can be ignored, so the gravity pressure drop and friction pressure drop determine the total pressure drop. With the decrease of gas velocity, the friction pressure drop will decrease, and the gravity pressure drop will increase with the increase of liquid film thickness. If the gas velocity is further reduced, the flow pattern may transition to slug flow, and the pressure drop at this time may further increase. Combined with the critical gas velocity of the liquid-film reversal, it was found that the liquid-film reversal flow point was close to the minimum pressure drop point, which indicates that the flow pattern may change after the liquid-film reversal, and the pressure drop may have a complicated fluctuating trend.
4.1.3. Verification of the Prediction Model of Critical Liquid-Carrying Gas Velocity
A high-speed camera was used to record the liquid film flow under different working conditions, as well as the gas velocity range and the liquid film falls were determined through image analysis. The experimental video record is shown in Figure 10. The results show that when the gas velocity was 22.64 m/s, the liquid film under all liquid velocities was in a continuous upward flow state, and there were fewer ripples on the liquid film. As the gas flow rate decreased, the liquid film became thicker, the interface wave became significant, and the bubbles entrained in the liquid film increased. When the gas flow rate decreased to 16.98 m/s, the interface wave became significant, and the video recording shows that the liquid film started to oscillate up and down, indicating that the liquid film had a tendency to fall. Although the liquid appears to fall back, the liquid film moved down a certain distance, but soon continued to flow upward, so the liquid film was in a state of repeated rising–reversal flow. Further reducing the gas velocity to 11.32 m/s and 8.49 m/s, the thickness of the liquid film increased significantly. Even under the condition of large liquid volume (superficial liquid velocity reached 0.071 m/s), the liquid film could not be maintained, and the liquid moved repeatedly up and down in the pipeline in the form of blocks. This showed that the flow pattern gradually transitioned to slug flow. When the gas velocity dropped below 8.49 m/s, slug flow appeared.
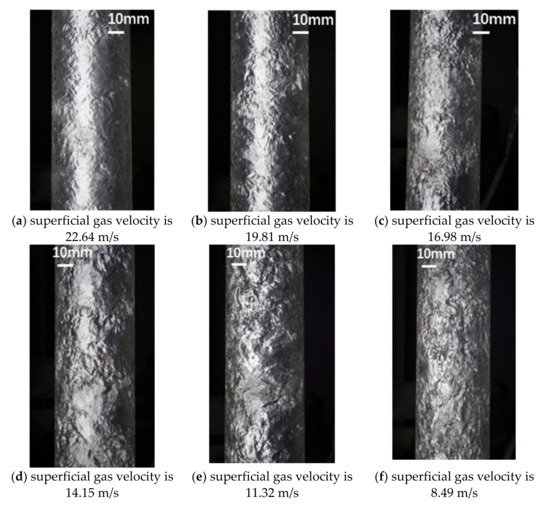
Figure 10.
Image recording (the superficial liquid velocity is 0.028 m/s).
The above analysis can limit the liquid-film reversal range to the gas velocity of 16.98 m/s to 14.15 m/s. According to the analysis of the liquid film flow trajectory and the high-speed imaging, the critical gas velocity when liquid-film reverses can be determined.
The comparison between the prediction values by the new model proposed and the indoor simulation experiment results in this work is shown in Figure 11. The maximum relative error is 8.73%, the minimum is 6.38%, and the errors are not more than 10%, indicating that the new model has high accuracy.
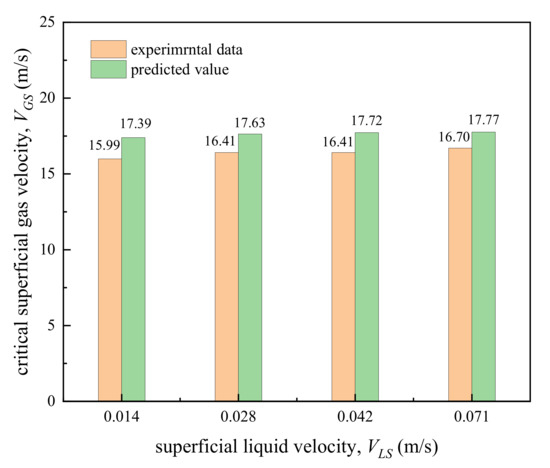
Figure 11.
Comparison of experimental and predicted values in this work.
The liquid-film reversal model is compared with 110 sets of laboratory experimental data in published literature [29,30,31,32,33,34,35,36,37]. The experiment data covers the pipe size range from 30 mm to 152 mm, with an inclination of 1 degree to 90 degrees. The fluid medium includes air–water and air–oil. In order to intuitively show the prediction ability of different models, the prediction results of the model were compared with the published experimental data under the same working condition. Comparing the average error of each model under 110 working conditions, the overall error of different models can be obtained. As shown in Figure 12, compared with the previous model, the new model has the best agreement with the 110 groups of published experimental results, and the relative error is only 11.62%.
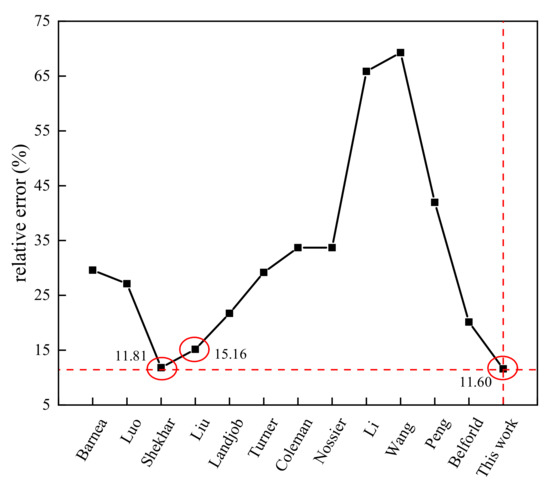
Figure 12.
The relative error of different models.
In addition, the Shekhar and Liu models also have relatively small errors (Figure 12), of 11.81% and 15.16%, respectively. The detailed comparison of the three models is shown in Figure 13. When the inclination angle is 90 degrees (vertical pipe) to 10 degrees from horizontal position, the error of the new model is smaller than that of Shekhar model and Liu model, which shows that the accuracy of the new model is higher in the prediction of vertical and inclined wells. When the inclination angle is less than 10 degrees, the relative errors of the three models are significantly larger. The accuracy of the current liquid film inversion model for predicting the critical gas velocity of the horizontal pipe needs to be improved. Previous experimental studies have shown that the maximum critical gas velocity occurs at an angle of inclination of about 60 degrees. Therefore, the current new model meets the engineering application of general gas wells and can be used to predict the critical flow rate of liquid carrying in gas wells.
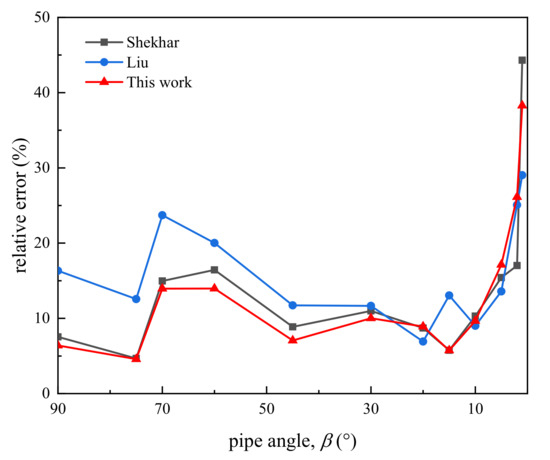
Figure 13.
The relative error of different models under different pipe angles.
4.2. Application of Field Data
The model proposed in this work was validated and calculated using gas well data published in the literature. A total of 191 sets of gas-well data in Turner [15], Coleman [16], and Veeken [14] were collected, including from 136 wells with fluid accumulation and 55 wells without fluid accumulation. Because the Barnea model is widely used in effusion prediction, and the Shekhar model is more accurate in analysis, the new model is compared with the Barnea model and the Shekhar model. The abscissa of Figure 14, Figure 15, Figure 16 and Figure 17 is the actual wellhead production, and the ordinate is the predicted wellhead production. The red solid line in the figure divides the figure into upper and lower areas, which are the loaded area and unloaded area. For the unloaded wells, the prediction data are more in the unloaded area below the graph, which means that the prediction effect of the model is better (as shown in Figure 14). For the effusion wells, the prediction data are mostly located in the loaded area, which indicates that the prediction effect is good (see Figure 15, Figure 16 and Figure 17). The results show that the accuracy of the liquid-film reversal model proposed in this work is better than the Shekhar model, and much better than Barnea model. Among 191 gas wells, the new model correctly predicted 161, the Shekhar model correctly predicted 158, and the Barnea model correctly predicted 150. Compared with the field data, the new model can effectively predict 84.3% of the wellhead effusion, and the prediction effect is better than other models. Therefore, the model established in this study has higher accuracy and is suitable for the prediction of the critical liquid-carrying flow rate in vertical wells and inclined gas wells, which is helpful for gas well construction design and in preventing the damage of liquid loading in gas well.
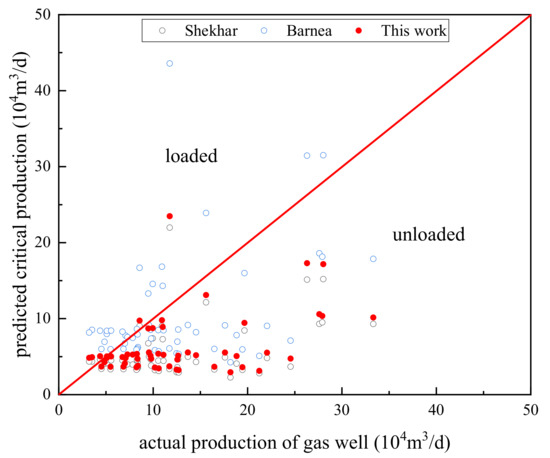
Figure 14.
Comparison of prediction results of each model (Turner unloaded well).

Figure 15.
Comparison of prediction results of each model (Turner loaded well).
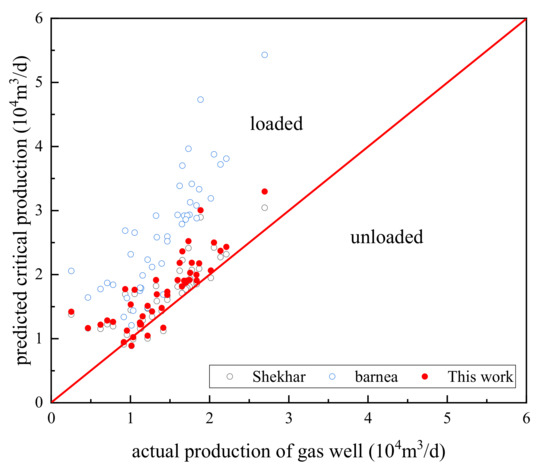
Figure 16.
Comparison of prediction results of each model (Coleman well).
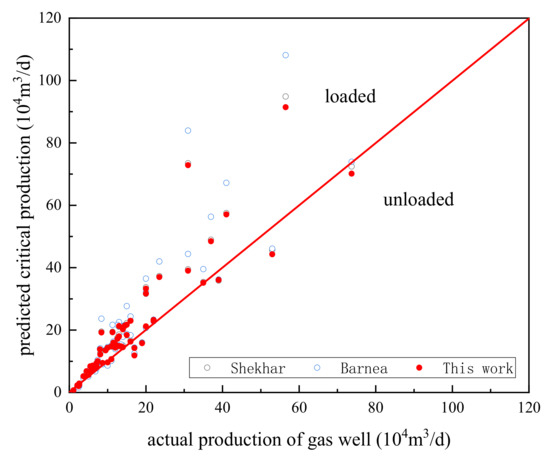
Figure 17.
Comparison of prediction results of each model (Veeken well).
5. Conclusions
In this work, the maximum droplet size obtained from the experimental measurement results proves that liquid-film reversal is the dominant factor of gas well fluid accumulation, and it is reasonable to predict the liquid loading in gas wells by establishing a liquid film-reversal model. Further experimental analysis of the liquid film flow was carried out, and the behavior characteristics of the liquid film flow and reversal and the pressure fluctuation law were obtained. Based on experimental phenomena, the critical gas velocity was determined, and the results show that liquid-film reverses when the gas flow rate is lower than 17 m/s. This work found that the thickness of the liquid film increases and the interfacial wave oscillation intensifies at low gas velocity. As the gas velocity decreases, the flow gradually becomes unstable, the pressure drop appears to be a minimum, and the flow pattern gradually transitions to slug flow.
Through analysis of the liquid film modeling, the results show that it is more reasonable to use the minimum interface shear force criterion to determine the liquid film inversion critical point, and then obtain the liquid film inversion critical thickness and interface shear force. Based on the Newton’s law of inner friction and mechanical equilibrium, a new critical liquid-carrying model is established. This model considers the influence of the tilt angle on the thickness of the liquid film, and the new interface friction coefficient is corrected. Comparing the prediction model with experimental and field data, the results show that the prediction accuracy of this new model is high, and it can be used to predict the critical production of gas wells. The proposed modified model can help field operators to design the gas well construction, predict the risk of liquid accumulation in gas wells in advance, formulate reasonable drainage gas recovery measures, and achieve the goal of reducing costs and increasing efficiency in natural gas recovery. This work has a good effect on predicting liquid loading in conventional wellbore, but the law of gas–liquid flow in unconventional wells and complex environmental conditions needs further research and discussion.
Author Contributions
L.W. and W.K. conceived and designed the experiments; L.W. and L.H. performed the experiments and wrote this paper; J.N. and J.X. provided support and helpful suggestions in setting up and revising the manuscript. All authors have read and agreed to the published version of the manuscript.
Funding
This research was funded by State Key Laboratory of Shale Oil and Gas Enrichment Mechanisms and Effective Development, as well as the fund of National Natural Science Foundation of China (No. 51779243) and the Strategic Priority Research Program of the Chinese Academy of Science (Grant No: XDB22030101).
Institutional Review Board Statement
Not applicable.
Informed Consent Statement
Not applicable.
Data Availability Statement
The datasets used and/or analyzed during the current study are available from the corresponding author on reasonable request.
Acknowledgments
The authors gratefully acknowledge that the work described here is financially supported by State Key Laboratory of Shale Oil and Gas Enrichment Mechanisms and Effective Development, as well as the fund of National Natural Science Foundation of China (No. 51779243) and the Strategic Priority Research Program of the Chinese Academy of Science (Grant No: XDB22030101).
Conflicts of Interest
The authors declare no conflict of interest.
Nomenclature
| A | Cross-sectional area, m2 |
| C | Constant related to the friction coefficient |
| d | Day |
| D | Pipe diameter, m |
| V | Velocity, m/s |
| P | Pressure, Pa |
| f | Friction factor |
| K | Parameter |
| g | Acceleration of gravity, m/s2 |
| q | Wellhead production, m3/d |
| y | Radial distance from the wall, m |
| z | Axial distance, m |
| Z | Natural gas compression factor |
| T | Temperature, K |
| Greek letters | |
| ρ | Density |
| μ | Viscosity |
| τ | Shear stress |
| β | Pipe inclination angle, rad |
| δ | Liquid film thickness, m |
| Subscripts | |
| G | Gas |
| GS | Superficial gas |
| L | Liquid |
| LS | Superficial liquid |
| i | Interface |
References
- Daas, M.A.; Golczynski, T.S.; Harry, J.J. Minimum flowrate to unload gas wells: Dynamic multiphase modeling to validate existing correlations. In Proceedings of the SPE Latin America and Caribbean Petroleum Engineering Conference, Society of Petroleum Engineers, Mexico City, Mexico, 16 April 2012. [Google Scholar]
- Chupin, G.; Hu, B.; Haugset, T.; Sagen, J.; Claudel, M. Integrated wellbore/reservoir model predicts flow transients in liquid-loaded gas wells. In Proceedings of the SPE Annual Technical Conference and Exhibition, Anaheim, CA, USA, 11–14 November 2017. [Google Scholar]
- Schiferli, W.; Belfroid, S.P.C.; Savenko, S.; Veeken, C.A.M.; Hu, B. Simulating liquid loading in gas wells. In Proceedings of the 7th North American Conference on Multiphase Technology, Banff, AB, Canada, 2–4 June 2010. [Google Scholar]
- Ming, R.Q.; He, H.Q. A new approach for accurate prediction of liquid loading of directional gas wells in transition flow or turbulent flow. J. Chem. 2017, 2017, 4969765. [Google Scholar] [CrossRef]
- Geng, X. A new wellbore fluid load diagnosing model based on the energy conservation law. Nat. Gas Ind. B 2020, 7, 141–148. [Google Scholar] [CrossRef]
- Pagou, A.L.; Han, G.-Q.; Peng, L.; Dehdah, O.; Kamdem Guyap, V.; Abimbola, F.; Mccarthy, S.A.; Tchomche, H.F.; Harmash, I.; Kanturyna, Z. Liquid loading prediction and identification model for vertical and inclined gas wells. J. Nat. Gas. Sci. Eng. 2020, 84, 103641. [Google Scholar] [CrossRef]
- Fadili, Y.E.; Shah, S. A new model for predicting critical gas rate in horizontal and deviated wells. J. Petrol Sci. Eng. 2017, 150, 154–161. [Google Scholar] [CrossRef]
- Ajani, A.; Kelkar, M.; Cem, S.; Eduardo, P. Foam flow in vertical gas wells under liquid loading: Critical velocity and pressure drop prediction. Int. J. Multiph. Flow 2016, 87, 124–135. [Google Scholar] [CrossRef]
- Zhou, C.; Wu, X.-D.; Li, H.-C.; Lin, H.; Liu, X.-W.; Cao, M.-J. Optimization of methods for liquid loading prediction in deep condensate gas wells. J. Petrol Sci. Eng. 2016, 146, 71–80. [Google Scholar] [CrossRef]
- Fadairo, A.; Femi-Oyewole, D.; Falode, O.A. An Improved Tool for Liquid Loading in a Gas Well. In Proceedings of the SPE Nigerian Annual International Conference and Exhibition, Abuja, Nigeria, 4–6 April 2013. [Google Scholar]
- Guo, B.; Ghalambor, A.; Xu, C. A Systematic Approach to Predicting Liquid Loading in Gas Wells. In Proceedings of the SPE Production and Operations Symposium, Oklahoma City, OK, USA, 17–19 April 2005. [Google Scholar]
- Xiaohong, B.; Yang, C.; Jian, Y.; Jian, W.; Yao, L. Calculating Model of Frictional Pressure Drop for Gas Well During Foam Drainage. Chem. Technol. Fuels Oils 2021, 56, 950–961. [Google Scholar] [CrossRef]
- Lea, J.F.; Nickens, H.V. Solving gas-well liquid-loading problems. J. Petrol Technol. 2004, 56, 30–36. [Google Scholar] [CrossRef]
- Veeken, K.; Bakker, E.; Verbeek, P. Evaluating Liquid Loading Field Data and Remedial Measures. In Proceedings of the Gas Well De-Watering Forum, Denver, CO, USA, 3–4 March 2003. [Google Scholar]
- Turner, R.G.; Hubbard, M.G.; Dukler, A.E. Analysis and prediction of minimum flow rate for the continuous removal of liquids from gas wells. J. Petrol Technol. 1969, 21, 1475–1482. [Google Scholar] [CrossRef]
- Coleman, S.B.; Clay, H.B.; McCurdy, D.G.; Norris, H.L., III. A new look at predicting gas-well load-up. J. Petrol Technol. 1991, 43, 329–333. [Google Scholar] [CrossRef]
- Coleman, S.B.; Clay, H.B.; McCurdy, D.G.; Norris, H.L., III. Understanding gas well load-up behavior. J. Petrol Technol. 1991, 43, 334–338. [Google Scholar] [CrossRef]
- Nosseir, M.A.; Darwich, T.A.; Sayyouh, M.H.; Sallaly, M.E. A new approach for accurate prediction of loading in gas wells under different flowing conditions. SPE Prod. Facil. 2000, 15, 241–246. [Google Scholar] [CrossRef]
- Belfroid, S.P.C.; Schiferli, W.; Alberts, G.J.N.; Veeken, C.A.M.; Biezen, E. Prediction onset and dynamic behaviour of liquid loading gas wells. In Proceedings of the SPE Annual Technical Conference and Exhibition, Society of Petroleum Engineers, Denver, CO, USA, 21–24 September 2008. [Google Scholar]
- Davarpanah, A.; Mirshekari, B. Experimental Investigation and Mathematical Modeling of Gas Diffusivity by Carbon Dioxide and Methane Kinetic Adsorption. Ind. Eng. Chem. Res. 2019, 58, 12392–12400. [Google Scholar] [CrossRef]
- Li, L.; Zhang, L.; Yang, B.; Yin, Y.; Li, D. Prediction method of critical liquid carrying flow rate for directional gas wells. Oil Gas Geol. 2012, 33, 650–654. [Google Scholar]
- Wallis, G.B. One-Dimensional Two-Phase Flow; McGraw-Hill: New York, NY, USA, 1969. [Google Scholar]
- Barnea, D. Transition from annular flow and from dispersed bubble flow—unified models for the whole range of pipe inclinations. Int. J. Multiph. Flow 1986, 12, 733–744. [Google Scholar] [CrossRef]
- Luo, S.; Kelkar, M.; Pereyra, E.; Sarica, C. A new comprehensive model for predicting liquid loading in gas wells. SPE Prod. Oper. 2014, 29, 337–349. [Google Scholar] [CrossRef]
- Zhang, H.-Q.; Wang, Q.; Sarica, C.; Brill, J.P. Unified model for gas-liquid pipe flow via slug dynamics: Part 1-model development. J. Energy Resour. Technol. 2003, 125, 266–273. [Google Scholar] [CrossRef]
- Zhang, H.-Q.; Wang, Q.; Sarica, C.; Brill, J.P. Unified model for gas-liquid pipe flow via slug dynamics: Part 2-model validation. J. Energy Resour. Technol. 2003, 125, 274–283. [Google Scholar] [CrossRef]
- Hu, X.; Xie, J.; Cai, W.; Wang, R.; Davarpanah, A. Thermodynamic effects of cycling carbon dioxide injectivity in shale reservoirs. J. Pet. Sci. Eng. 2020, 195, 107717. [Google Scholar] [CrossRef]
- Van ’t Westende, J.M.C.; Kemp, H.K.; Belt, R.J.; Portela, M.; Mudde, O.; Oliemas, K. On the role of droplets in cocurrent annular and churn-annular pipe flow. Int. J. Multiph. Flow 2007, 33, 595–615. [Google Scholar] [CrossRef]
- Guner, M.; Pereyra, E.; Sarica, C.; Torres, C. An experimental study of low liquid loading in inclined pipes from 90° to 45°. In Proceedings of the SPE Production and Operations Symposium, Oklahoma City, OK, USA, 1–5 March 2015. [Google Scholar]
- Alsaadi, Y.; Pereyra, E.; Sarica, C.; Torres, C. Liquid loading of highly deviated gas wells from 60° to 88°. In Proceedings of the SPE Annual Technical Conference and Exhibition, Houston, TX, USA, 28–30 September 2015. [Google Scholar]
- Fan, Y.; Pereyra, E.; Sarica, C. Onset of liquid-film reversal in upward-inclined pipes. SPE J. 2018, 23, 1630–1647. [Google Scholar] [CrossRef]
- Liu, X.; Falcone, G.; Teodoriu, C. Liquid loading in gas wells: From core-scale transient measurements to coupled field-scale simulations. J. Petrol Sci. Eng. 2017, 157, 1056–1066. [Google Scholar] [CrossRef][Green Version]
- Skopich, A.; Pereyra, E.; Sarica, C.; Kelkar, M. Pipe-Diameter effect on liquid loading in vertical gas wells. SPE Prod. Oper. 2015, 30, 164–176. [Google Scholar] [CrossRef]
- Davarpanah, A.; Mirshekari, B. Mathematical modeling of injectivity damage with oil droplets in the waste produced water re-injection of the linear flow. Eur. Phys. J. Plus. 2019, 134, 180. [Google Scholar] [CrossRef]
- Rastogi, A.; Fan, Y. Experimental and modeling study of onset of liquid accumulation. J. Nat. Gas Sci. Eng. 2020, 73, 103064. [Google Scholar] [CrossRef]
- Vieira, C.; Stanko, M. Effect of droplet entrainment in liquid loading prediction. In Proceedings of the 19th International Conference on Multiphase Production Technology, Cannes, France, 5–7 June 2019; BHR Group: Bedfordshire, UK, 2019. [Google Scholar]
- Vieira, C.; Stanko, M. Applicability of models for liquid loading prediction in gas wells. In Proceedings of the SPE Europec Featured at 81st EAGE Conference and Exhibition, London, UK, 3–6 June 2019. [Google Scholar]
Publisher’s Note: MDPI stays neutral with regard to jurisdictional claims in published maps and institutional affiliations. |
© 2021 by the authors. Licensee MDPI, Basel, Switzerland. This article is an open access article distributed under the terms and conditions of the Creative Commons Attribution (CC BY) license (https://creativecommons.org/licenses/by/4.0/).