Article

A Theoretical Study on the Thermodynamic Cycle of Concept Engine with Miller Cycle

1
Division of Marine Engineering, Mokpo National Maritime University, Mokpo 58628, Korea
2
Department of Mechanical and Shipbuilding Convergence Engineering, Pukyong National University, Busan 48547, Korea
*
Author to whom correspondence should be addressed.
Processes 2021, 9(6), 1051; https://doi.org/10.3390/pr9061051
Submission received: 12 May 2021 / Revised: 10 June 2021 / Accepted: 12 June 2021 / Published: 16 June 2021
(This article belongs to the Special Issue Advanced Combustion and Combustion Diagnostic Techniques)

Abstract

:
The Atkinson cycle, where expansion ratio is higher than the compression ratio, is one of the methods used to improve thermal efficiency of engines. Miller improved the Atkinson cycle by controlling the intake- or exhaust-valve closing timing, a technique which is called the Miller cycle. The Otto–Miller cycle can improve thermal efficiency and reduce NOx emission by reducing compression work; however, it must compensate for the compression pressure and maintain the intake air mass through an effective compression ratio or turbocharge. Hence, we performed thermodynamic cycle analysis with changes in the intake-valve closing timing for the Otto–Miller cycle and evaluated the engine performance and Miller timing through the resulting problems and solutions. When only the compression ratio was compensated, the theoretical thermal efficiency of the Otto–Miller cycle improved by approximately 18.8% compared to that of the Otto cycle. In terms of thermal efficiency, it is more advantageous to compensate only the compression ratio; however, when considering the output of the engine, it is advantageous to also compensate the boost pressure to maintain the intake air mass flow rate.

1. Introduction

One of the methods to improve engine efficiency is to convert the pressure energy obtained from combustion into mechanical work energy by expanding it to atmospheric pressure as much as possible [1,2]. This can be accomplished through the Atkinson cycle. In the mid-1940s, Miller proposed the concept of making the expansion ratio higher than the compression ratio through a the decrease in the effective compression ratio due to the change in valve closing time, without significant structural changes in the existing engine. This technique highlights the usefulness of increasing the thermal efficiency of engines by applying the Atkinson cycle.
Thermodynamics has seen a series of advances since these techniques were used to optimize efficiency, along with improvements in the performance of real thermodynamic process devices and cycles [1,2,3,4,5]. In the 1940s, Miller [6] proposed an auto cycle with a low compression and high expansion stroke called the Miller cycle. Recently, the Miller cycle has attracted attention, and some authors [7] have investigated the finite-time thermodynamic performance of the Miller cycle. Hatamura et al. [8] reported that the Miller cycle has the same advantages as the mean effective pressure higher than the Otto cycle with a lower nominal compression ratio. Fukuzawa et al. [9] described key technologies and performance specifications for high-efficiency Miller cycle gas engines and a series of engines planned for the future. Using a numerical example of Al-Sarki et al. [10], we compare the performance characteristic curves of the Atkinson cycle with the curves of the Miller and Joule–Brayton cycles, and summarize the impact of maximizing power density on the performance of cycle efficiency. Sasaki et al. [11] reported performance by applying efficient Miller cycles to hybrid buses with high-performance capacitance systems. Performance analysis and optimization of the right-hand [12] turbocharged Miller cycle auto engine was performed. Get et al. [13] studied the performance characteristics of the Auto Miller cycle along with heat transfer losses and friction losses in the engine combustion chamber [14]. These studies were conducted without considering the variable heat of the working fluid. Other researchers [15] also studied the effect of variable generating heat on the performance of the Miller cycle in working fluids. Al-Sarki et al. [16] and Zhao and Chen [17] conducted a study based on the theoretical basis for engine performance in the Miller cycle, as well as the effects of major engine design variables and system irreversibility. Al-Saki et al. [18] compared and evaluated the performance properties of Miller’s engine by considering various thermal models (i.e., constant, linear, and quadratic polynomials). To accurately predict the performance of the Miller cycle, we need an accurate model beyond the quadratic polynomial. Lin and Hou [19] conducted a study on the properties of fuel, friction, and heat loss generated by variable specific heat with Miller cycles under peak temperature limits on the performance of standard Miller cycles. Chen et al. [20] established an engine model of the Miller cycle consisting of two heating, two cooling, and two radioactive parts using heat loss, leakage, and internal inelastic properties. A cycle with the performance of diesel cars, Brayton, Atkinson, Dual, and Miller cycles has been derived. Liu and Chen [21] established a general Miller reversible cycle model, including variable heat capacity of working fluids, the process of compression and expansion, and the reversibility of heat leakage losses. In all of the above studies, it is assumed that the specific heat at constant pressure and volume of the working fluid is a constant or function of temperature alone and has a linear or nonlinear form. However, in computing the chemical energy emitted by instantaneous combustion of internal combustion engines, a specific heat ratio is usually presented as a linear function of the average temperature [22]. The aforementioned model has already been used and the phenomenon considered is well known [23]. However, since certain heat ratios have a large effect on the shape of emission peaks and emission curves [24], some researchers have elaborated various equations to illustrate the dependence of specific heat ratios on temperature [22,23,24,25]. The most important thermodynamic property used to calculate the heat emission of an engine is the specific heat ratio [25]. It is also important to note that it is possible to change the specific heat ratio value of the intake charge by changing the exhaust gas recirculation (EGR) speed on the actual engine. EGR is a common method of controlling the production of nitrogen oxides in cylinders and is used in most modern internal combustion engines [26]. Furthermore, no investigation has been published on the impact of engine speed on Miller cycle performance. Therefore, the purpose of this study is to examine the effect of variable heat ratios and engine speed on power and the thermal efficiency of the air standard miller cycle.
The Miller cycle [27] was initially proposed to improve engine efficiency. This cycle is an over-expanded cycle, i.e., one with a higher expansion ratio than compression ratio. It has recently been proposed as a means of reducing hazardous emissions while maintaining engine efficiency by lowering the engine compression rates and maximizing the gas temperature and pressure in cylinders. Many reports have described the concept of the Miller cycle engine and investigated various aspects of the Miller cycle engine design and operation. Alsargh et al. [28] and Zhao and Chen [29] conducted theoretical investigations on Miller cycle engine performance and studied the effects of key engine design variables and system invisibility. Endo et al. [30] have described the design of a large commercial (280–1100 kW) gas engine using the Miller cycle principle, claiming a fuel economy advantage of >5% over existing technologies of its class. Gheorghiu and Uberschör [31] studied overextended engines for use in hybrid vehicles and investigated the causes of efficiency loss in common implementations of these cycles. Wang and Lucston [32] and Wang et al. [33] investigated the application of the Miller cycle concept to reduce engine emissions and found that a significant reduction in engine fuel consumption was possible, despite its penalties. The Miller cycle is a modification of the overinflating cycle, which provides a higher expansion ratio than the compression ratio, with improved thermal efficiency compared to the operating conditions of a conventional internal combustion engine [34]. In practice, this difference in expansion ratio can be achieved through a compression stroke that includes a late or early closing of the intake valve. This effectively reduces the compression stroke, but maintains the combustion and expansion processes as normal to extract additional energy before the exhaust process while reducing the brake average effective pressure (BMEP) to improve thermal efficiency [34,35]. The brake mean effective pressure metric is used to define the operation of the actual engine output defined in the brake output. To avoid a short compression stroke, turbochargers or superchargers have been used to maintain a stable BMEP level and thus ensure continued benefits of this cycle [34]. Therefore, the Miller cycle uses boosting to recover the lost charge caused by a smaller displacement during compression. This cycle also provides cooling to the pre-combustion fuel–air mixture according to the inlet valve closing timing to help minimize the combustion knock problems with SI engine operation prior to ignition [35].
Additionally, through the study of potential internal combustion engine high efficiency, Lui et al. [36] demonstrated the impact of energy balance on combustion efficiency limits through evaluation by various parameters such as compression ratio (CR), heat transfer coefficient, intake charge characteristics, combustion phase, etc. Lui et al. [37] used a mixture of n-heptane and toluene to study the formation of polycyclic aromatic hydrocarbons (PAHs) and soot in rich, partially mixed, and non-mixed flames. The flame temperature was adjusted by diluting the flame with Ar, N2, and CO2. To study the effect of flame temperature on PAHs and soot evolution, laser-induced fluorescence, laser-induced incident, and bicolor furnace measurements were used. Results show similar temperature distributions for different gas dilutions at low flow rates. When CO2 is diluted, the formation of large PAH increases as the flow rate increases, but when the flame temperature decreases, the formation of soot decreases because the formation of soot is suppressed. Therefore, it can be concluded that the evolution of PAH and soot depends greatly on the flame temperature.
In addition, the Miller cycle reduces NOx emissions by reducing the compression and combustion peak temperatures. The Miller cycle is one of the best methods to satisfy IMO (International Maritime Organization) Tier III regulations and improve thermal efficiency [38,39,40,41,42]. Therefore, determining the intake-valve closing timing, called the Miller timing, is one of the most important processes in developing auxiliary gas engines for ships. The Miller cycle is divided into early intake-valve closing (EIVC) and late intake-valve closing, which close the intake valve during the intake process and during the compression process, respectively. However, there is no difference in the analysis results of the two processes, as only the intake-valve closing timing is involved in thermodynamic cycle analysis, although their actual flow patterns in the cylinder and combustion characteristics are different.
In this study, we performed thermodynamic cycle analysis with changes in the intake-valve closing timing for the Otto–Miller cycle and evaluated the engine performance and Miller timing through the resulting problems and solutions. EIVC, which is considered more effective in reducing NOx emissions [43,44,45], was applied in this cycle analysis.

2. Otto–Miller Cycle

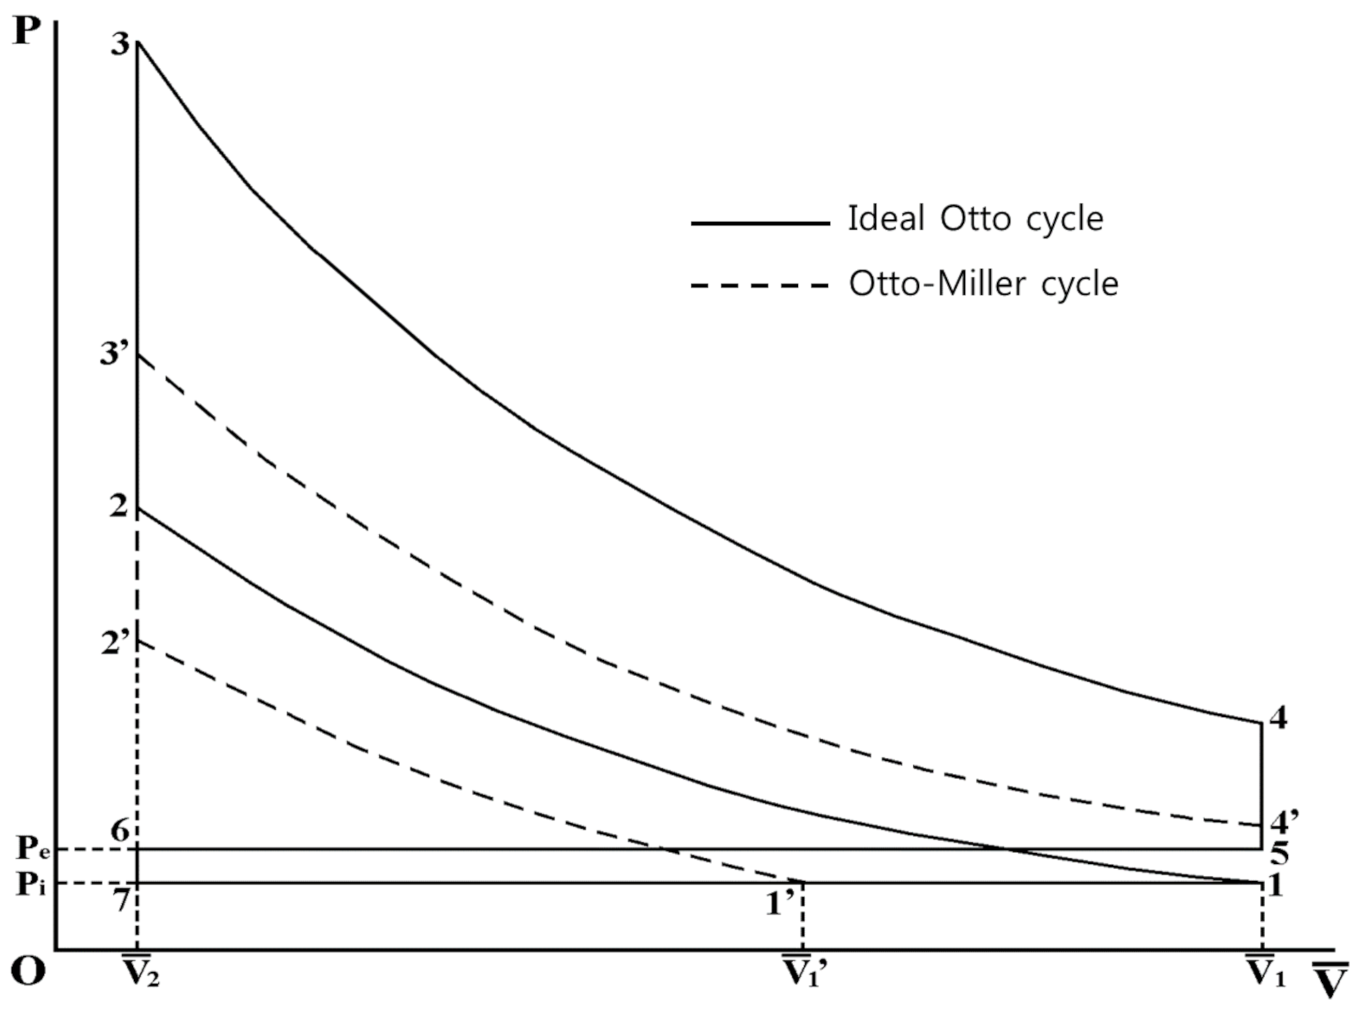
2.1. Cycle Curve and the Quantity of State in Each Process

Figure 1 demonstrates the curves of the ideal Otto cycle considering air exchange and the Otto–Miller cycle, which closes the intake valve during the intake process. The negative pressure caused by the downward motion of the piston after valve closure was not considered.
According to the figure, the Otto cycle performs in the order of 1-2-3-4-5-6-7-1. During analysis, we assumed that the operating fluid is a mixture of air and fuel, and the specific heat ratio of each process is the same. Here, the design compression ratio, ε c , is v 1 / v 2 , and the expansion ratio, ε e , is v 3 / v 4 = v 1 / v 2 . The pressure ratio, α , which is the ratio of the pressure before and after combustion under constant volume conditions, is defined as p 3 / p 2 = T 3 / T 2 .
When the Otto cycle is converted into the Miller cycle, the 1′-2′-3′-4′-5-6-7-1′-1-1′ process is performed by advancing the intake-valve closing timing. In this case, the effective compression ratio,   ε c , and pressure ratio,   α , differ from the design compression ratio (apparent compression ratio), ε c , and the apparent pressure ratio,   α , of the cycle, respectively. However, the effective expansion ratio, ε e , is always the same as the design compression ratio, ε c , as shown in the figure. The effective compression ratio, pressure ratio, and expansion ratio are expressed as follows:
ε c = v 1 v 2 = ε c v 1 v 1
α = p 3 p 2 = T 3 T 2
ε e = v 4 v 3 = v 4 v 3 = v 1 v 2 = ε c
The compression expansion ratio, Rec, defined as the ratio of the compression ratio to the expansion ratio, can be expressed as a function of the intake-valve closing timing, as follows:
R e c = ε c ε e = ε c   v 1 / v 1 ε c = v 1 v 1
For the cycle analysis, we determined the changes in the temperature, pressure, and gas mass in each state as follows.
In state 1′, the temperature and pressure are the same as in the initial state, but the gas mass decreases because the intake valve is closed during the downward movement of the piston. The gas mass flow rate can be described as a function of the intake-valve closing timing as shown in Equation (4).
m 1 = m 1 v 1 v 1
Process 1′–2′ is regarded as an adiabatic compression process, process 2′–3′ is a heating process with constant volume combustion, and process 3′–4′ is an adiabatic expansion process; therefore, the temperature and pressure in each state are expressed as follows:
T 2 = T 1 ε c κ 1 ,   p 2 = p 1 ε c κ
T 3 = T 1 α ε c κ 1 ,   p 3 = p 1 α ε c κ
T 4 = T 1 α ε c ε e κ 1 ,   p 4 = p 1 α ε c ε e κ
The gas mass in each state during this process is the same as that of state 1′ because there is no inflow or outflow of the gas in the cylinder.
Next, process 4′–5 is a blowdown process when the piston stops at the bottom dead center. Therefore, although it is a heat dissipation process under constant volume conditions, the change in the gas state can be interpreted as an adiabatic process because of the entropy emission from the exhaust process. Therefore, the temperature, pressure, and gas mass in state 5 are expressed as follows:
T 5 = T 4 p 5 p 4 κ 1 κ = T 1 α 1 κ P e P i κ 1 κ
p 5 = P e   ( exhaust   pressure )
m 5 = m 4 T 4 T 5   p 5 p 4 = m 1 α 1 κ ε e ε c P e P i 1 κ
Process 5–6 is a heat dissipation process under constant pressure, and the gas temperature change can be regarded as an isothermal process owing to the discharge of unburned gas; thus, the temperature, pressure, and gas mass in state are expressed as follows:
T 6 = T 5 = T 4 p 5 p 4 κ 1 κ = T 1 α 1 κ P e P i κ 1 κ
p 6 = p 5 = P e
m 6 = m 5 v 6 v 5 = m 1 α 1 κ   ε c 1 ε e ε c P e P i 1 κ
In process 6–7, because the pressure in the intake pipe is lower than the exhaust pressure, there is a pressure drop due to the reverse flow of gas in the cylinder when the intake valve is opened. Therefore, the gas undergoes an adiabatic state change under a constant volume, as in process 4′–5, and state 7 is expressed as follows:
T 7 = T 6 p 7 p 6 κ 1 κ = T 1 α 1 κ
p 7 = p 1 = P i   ( intake   pressure )
m 7 = m 6 p 7 p 6 T 6 T 7 = m 1 α 1 κ   ε c 1
Process 7-1′-1-1′ is an intake process under constant pressure, during which the intake valve is closed before bottom dead center (BDC), and the piston moves downward and upward continuously till the position where the intake valve is closed. Each quantity of state becomes an initial state and forms a cycle.
However, because the increase in temperature due to combustion under constant volume conditions depends on the air–fuel ratio, the temperature increase for a specific air–fuel ratio is always the same. Thus, the pressure ratio, α , can be expressed as a function of the intake-valve closing timing, as shown in the following equation.
Δ T = Q 1 m C v = 1 1 + λ a f H u f C v = c o n s t a n t Where ,   Q 1 m C v = m f · H u f m a + m f C v = 1 m a + m f m f H u f C v = 1 1 + m a m f H u f C v = 1 1 + λ a f H u f C v
  T 3 T 2 = T 3 T 2     T 2 α 1 = T 2 α 1
α = 1 + ε c ε c κ 1 α 1 = 1 + v 1 v 1 κ 1 α 1
Here, the thermal dissociation is not considered, in order to analyze the convenience of analysis and the effect of valve timing.

2.2. Thermal Efficiency and Mean Effective Pressure (MEP) of Miller Cycle

Based on the quantities of states in each process calculated above, the thermal efficiency when the Otto cycle is converted into the Otto–Miller cycle according to the intake-valve closing timing can be obtained as follows:
η t h O M = W t h Q 1 = 1 Q 21 + Q 22 Q 1
In the above equation, the amount of heat supplied,   Q 1 , and that released under constant volume and constant pressure conditions, Q 21 , and Q 22 , respectively, correspond to the following changes in internal energy and enthalpy.
Q 1 = 2 3 m C v d T = m 1 C v ( T 3 T 2 )
Q 21 = 4 5 m C v d T = C v ( m 4 T 4 m 5 T 5 )
Q 22 = 5 6 m C p d T = C p ( m 5 T 5 m 6 T 6 )
By substituting the temperature and mass change in each state described above and considering it as an intake and exhaust process involving a quasi-static change P i = P e ,   the theoretical thermal efficiency is expressed as follows, when the Otto cycle is converted into the Miller cycle by changing the intake-valve closing timing.
η t h O M = 1 ε c κ 1 · F O M F O M = α ε c ε e κ 1 ε c ε e 1 + κ ε c ε e 1 ε c 1 α 1
This equation can also be expressed as a function of the intake- valve closing timing using Equation (4), which is the relational equation of the compression expansion ratio.
η t h O M = 1 ε c κ 1 · F O M F O M = v 1 v 1 κ α v 1 v 1 κ 1 + κ 1 ε c 1 α 1
The point at which the Miller cycling effect can be maximized is the point at which the cycle work reaches its maximum, and the pressure after expansion is the same as the initial pressure. Rec is expressed as a function of the pressure ratio as follows:
R e c = ε c ε e = α 1 κ
Figure 2 demonstrates the relationship between these parameters according to intake valve closing timing. The valve closing timing is expressed as crank angle (CA). Here, the design compression ratio ( ε c ) and apparent pressure ratio ( α ) 10 and 3.5, respectively.
Figure 2 clearly shows that the maximum expansion effect can be obtained at approximately 430 °CA, where the maximum theoretical thermal efficiency is expected.
Figure 3 illustrates the theoretical thermal efficiency of the Otto–Miller cycle according to the change in the design compression ratio ( ε c ), apparent pressure ratio ( α ) and the intake-valve closing timing obtained from Equation (26).
The theoretical thermal efficiency tends to decrease gradually as the intake-valve closing timing advances, and then decreases rapidly after approximately 420 °CA. This is because the effective compression ratio decreases according to the EIVC timing, thereby decreasing the maximum pressure in the cylinder. The thermal efficiency at 430 °CA, which is the intake valve closing time for achieving the maximum Miller effect as mentioned above, is about 36.7%, which is 8.3% (rel.) less than when the intake valve is closed at 540 °CA (BDC).
In addition, the engine output is evaluated using the theoretical MEP, and the relationship is as follows, according to the definition of the MEP.
M E P t h O M = W t h V s = η t h O M p 1 ε c κ α 1 κ 1 ε c 1 v 1 v 1 κ
The MEP of the Otto–Miller cycle according to Equation (28) is presented in Figure 4. Here, the design compression ratio ( ε c ) and apparent pressure ratio ( α ) are 10 and 3.5, respectively.
The earlier the intake valve is closed, the less fresh is the inflow, thereby decreasing the heat supply and engine output. The MEP is a function of the thermal efficiency and the amount of heat supplied; thus, as the intake-valve closing timing is increased, the decrease in the MEP is more pronounced than the thermal efficiency. Therefore, the MEP at an intake-valve closing timing of approximately 430 °CA is significantly reduced, to approximately 58.4% from the value at 540 °CA.
As described above, to observe the effect of the Miller cycle, the effective compression ratio and intake air mass must be compensated. Namely, either the maximum pressure in the combustion chamber must be maintained or the intake air mass must be the same.

3. Compensation for Otto–Miller Cycle

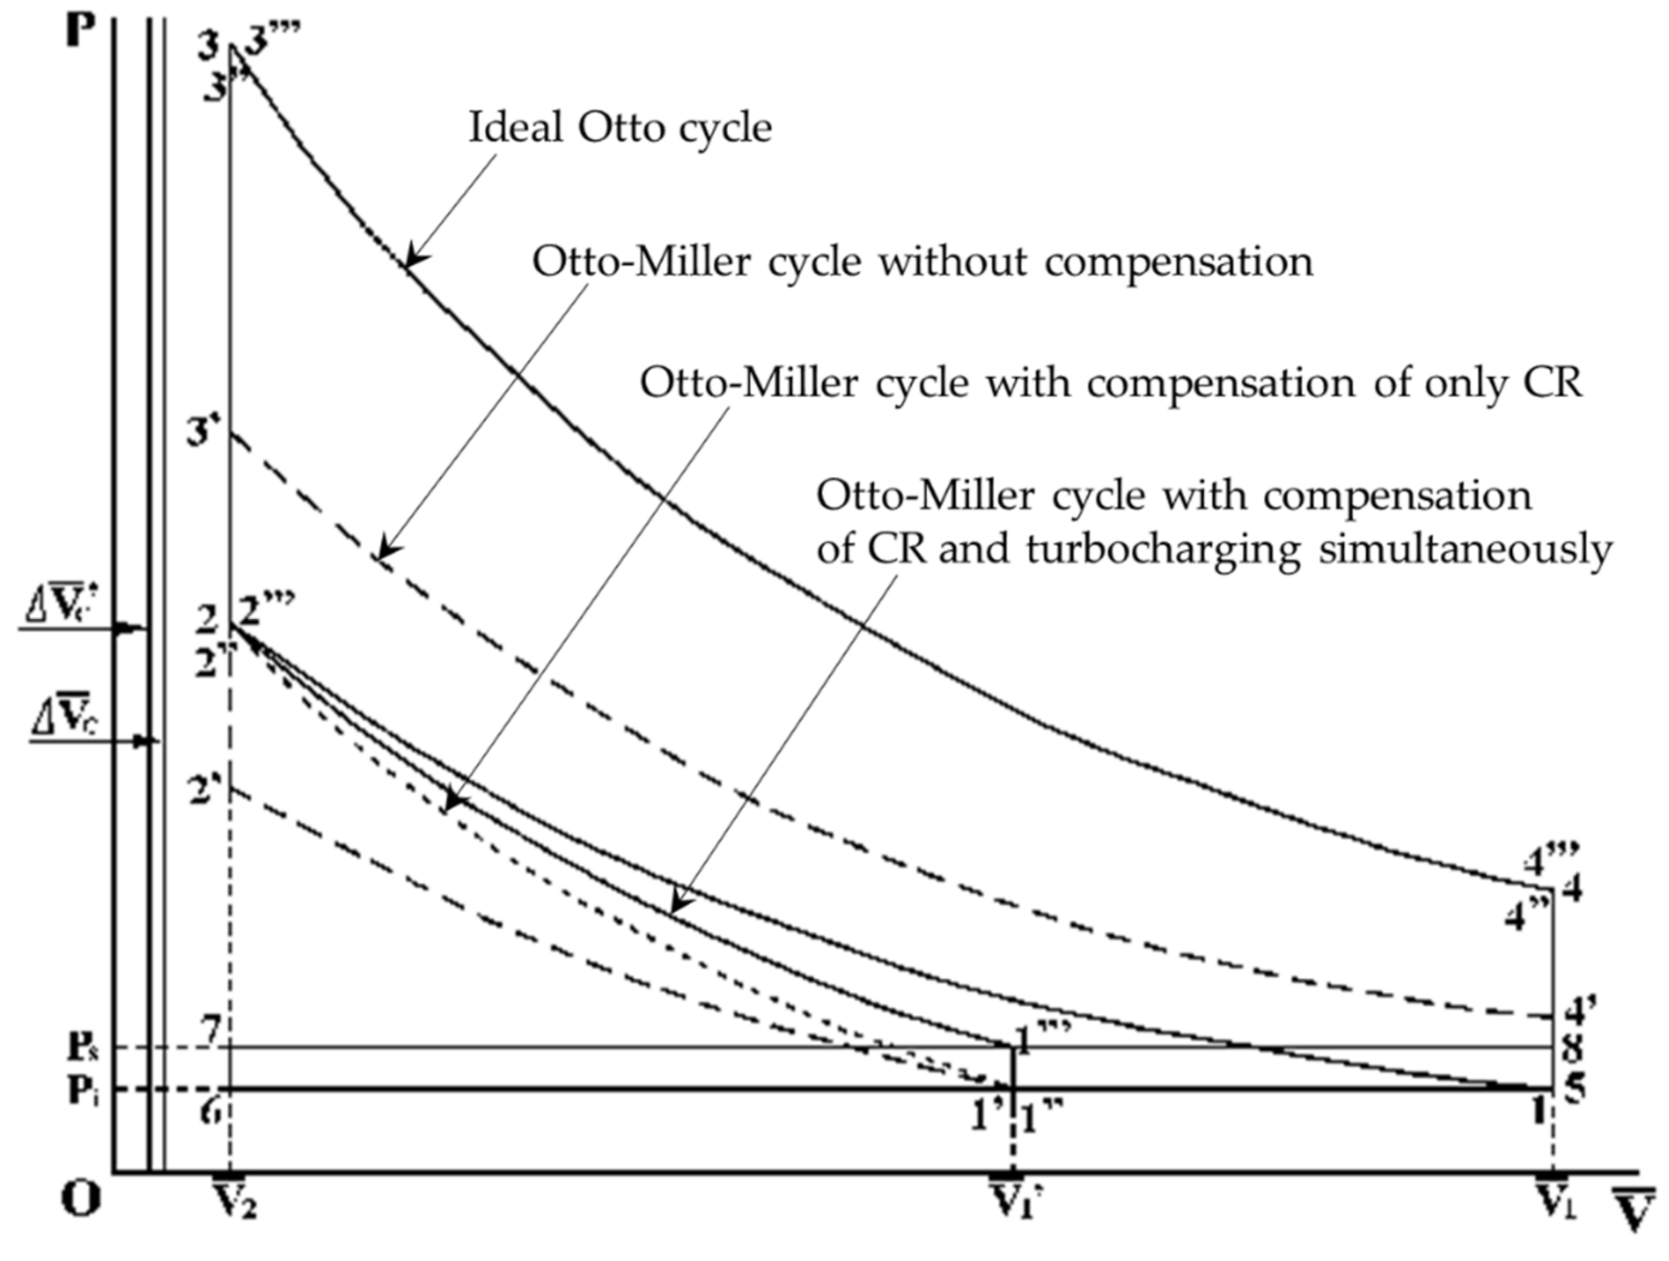
3.1. Cycle Curve Showing Compensation for Otto–Miller Cycle

Figure 5 presents the curves obtained when the maximum pressure in the cylinder is kept the same by compensating the effective compression ratio; the maximum pressure in the cylinder and the effective intake air mass are kept the same by compensating the effective compression ratio and simultaneous turbocharging.
Here, the quasi-static change   P i = P e is considered in the gas exchange process. Therefore, the Otto cycle performs the 1-2-3-4-5-6-1 process. When only the effective compression ratio is compensated, the clearance volume is reduced by Δ V c ¯ ; further, when turbocharging is performed by compensating the compression ratio, the clearance volume is reduced by Δ V c ¯ . Therefore, when compensating only the compression ratio, the cycle performs the 1′′-2′′-3′′-4′′-5-6-1′′-1-1′′ process, and when simultaneously compensating the intake air mass by turbocharging, the cycle follows the 1′′′-2′′′-3′′′-4′′′-5-6-7-1′′′-8-1′′′ process. In addition, even if each state is in the same position, the actual volume is different because the reference point of the clearance volume is adjusted.

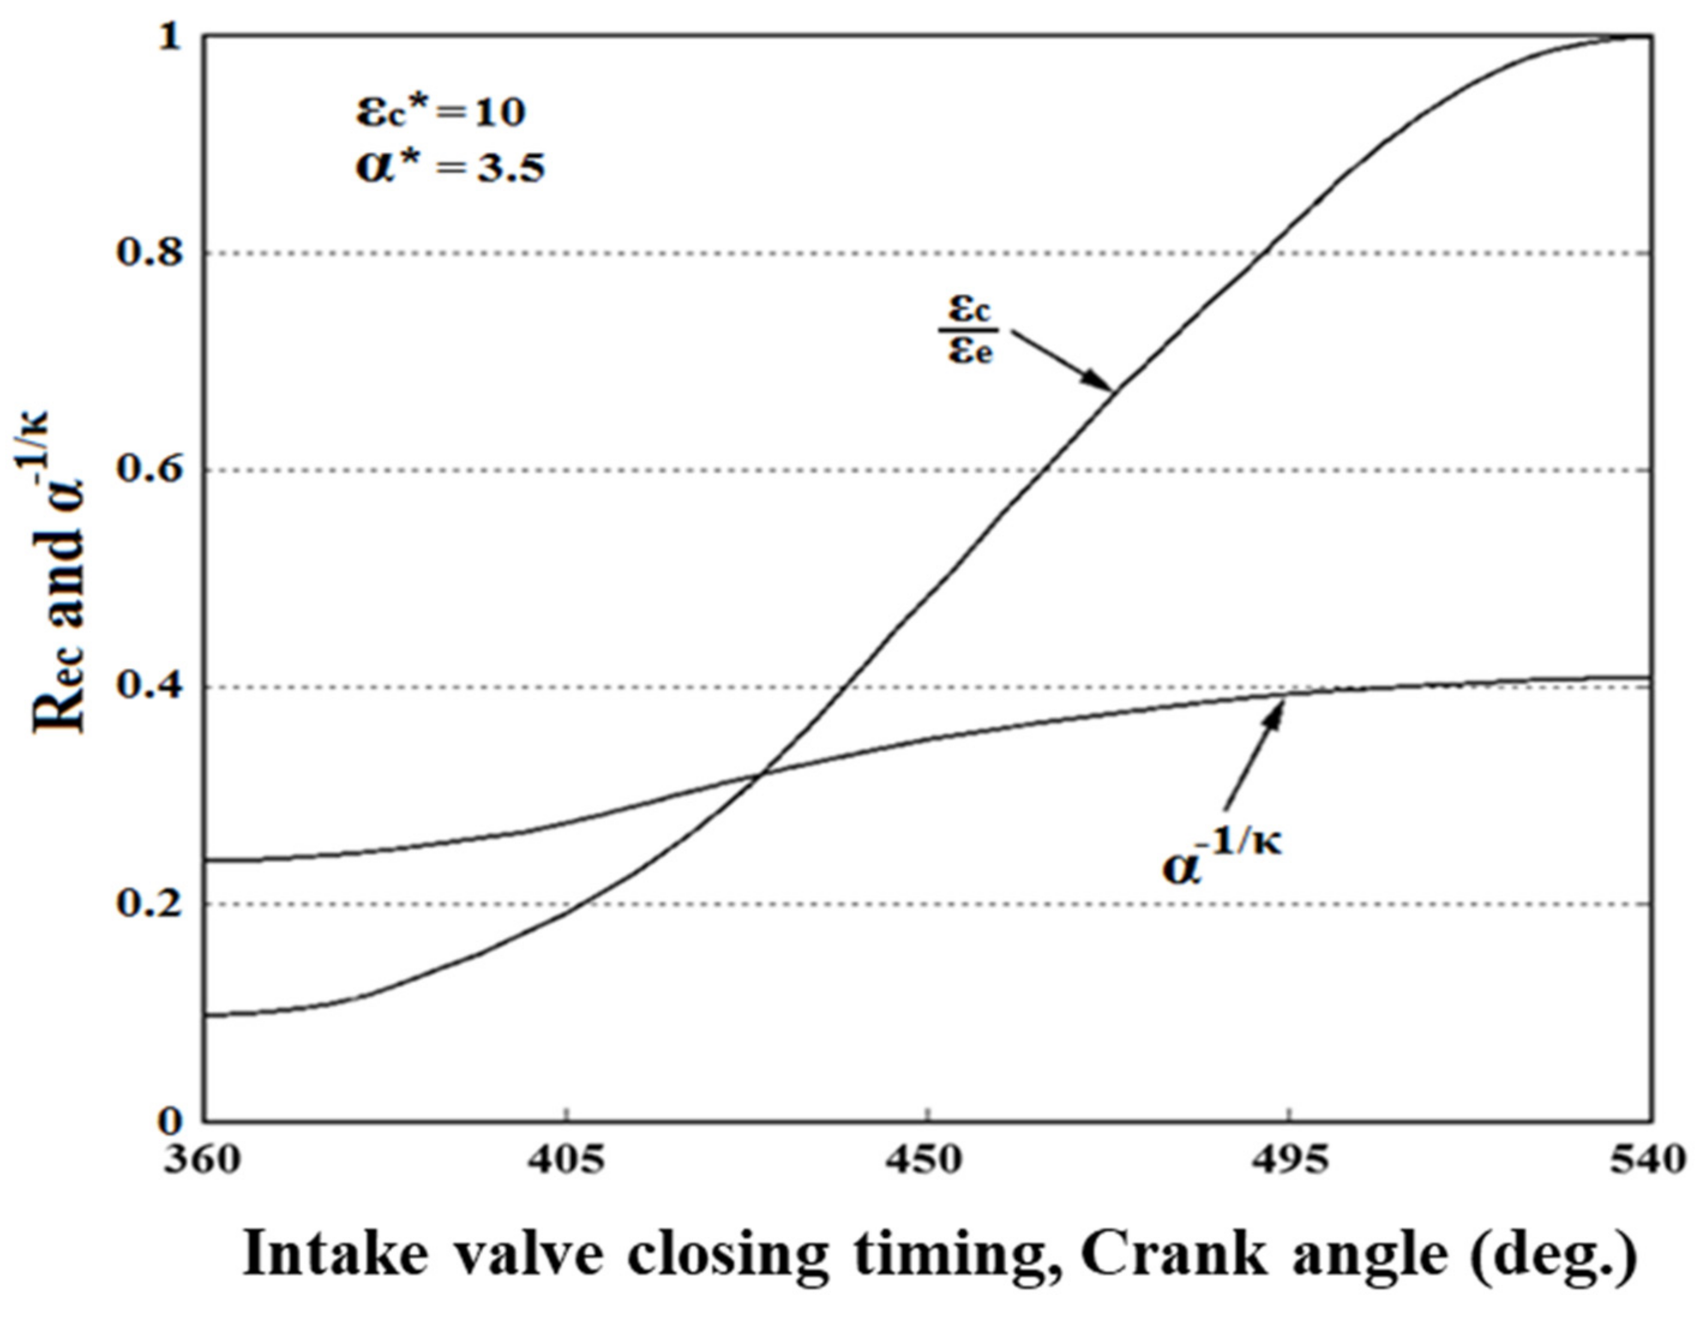
3.2. Compensation of Effective Compression Ratio (Maximum Pressure)

Compensating the maximum pressure involves reducing the clearance volume by Δ V c ¯ according to the intake-valve closing time, so that the effective compression ratio always becomes equal to the design compression ratio; thus, the maximum pressure of the combustion chamber is maintained even when the closing time is advanced. Therefore, the effective compression ratio ε c c can be expressed as
ε c c = v 1 v 2 = v 1 Δ V c ¯ v 2 Δ V c ¯ = ε c = v 1 v 2 .
From the above relationship, the clearance volume can be reduced according to the change in the intake-valve closing timing.
Δ V c ¯ = v 1 v 1 ε c 1 = v 1 ε c 1 1 v 1 v 1
Furthermore, the effective expansion ratio,   ε e c , can be obtained by the following equation:
ε e c = v 4 v 3 = v 4 Δ V c ¯ v 3 Δ V c ¯ = v 1 Δ V c ¯ v 2 Δ V c ¯
In contrast, because the effective and design compression ratios are equal, the effective pressure ratio,   α c , and the design pressure ratio,   α , are also equal.
Using the above relationships in Equations (25) and (28), the theoretical thermal efficiency and MEP of the Otto–Miller cycle when compensating only the compression ratio can be obtained as follows:
η t h O M _ C = 1 ε c c κ 1 · F O M _ C F O M _ C = α ε c c ε e c κ 1 ε c c ε e c 1 + κ ε c c ε e c 1 ε c c 1 α 1
M E P t h O M _ C = η t h O M _ C · p 1 ε c c κ α 1 κ 1 ε c c 1 · v 1 v 1
Therefore, the equations of the thermal efficiency and MEP have the same pattern, although the values of the effective compression ratio and expansion ratio are different.

3.3. Simultaneous Compensation of Effective Compression Ratio and Intake Air Mass

In this case, the maximum pressure of the gas in the cylinder is equaliszd by compensating the effective compression ratio, and concurrently, the intake air mass is also equalized through turbocharging. Therefore, because the effective compression ratio must be reduced owing to an increase in the compression pressure due to turbocharging, the clearance volume to be reduced,   Δ V c ¯ , is slightly smaller than in the case of compensating only the compression ratio.
Accordingly, the effective compression ratio,   ε c t , and effective expansion ratio,   ε e t , shown in Figure 5, are defined as follows:
ε c t = v 1 v 2 = v 1 Δ V c ¯ v 2 Δ V c ¯ = ε c = v 1 v 2
ε e t = v 4 v 3 = v 4 Δ V c ¯ v 3 Δ V c ¯ = v 1 Δ V c ¯ v 2 Δ V c ¯
In addition, because the gas pressure after compression is equally adjusted, the following relationship is established.
p 2 = p 2
P t v 1 Δ V c ¯ v 2 Δ V c ¯ κ = p 1 v 1 v 2 κ
Similarly, because the intake air mass is the same, the following relationship is established by applying the ideal gas state equation.
m o = m s
P t = v 1 Δ V c ¯ v 1 Δ V c ¯ p 1
Thus, the clearance volume to be reduced is expressed as follows using Equations (38) and (39):
v 1 Δ V c ¯ v 1 Δ V c ¯ v 1 Δ V c ¯ v 2 Δ V c ¯ κ = v 1 v 2 κ
The theoretical thermal efficiency and the mean effective pressure can also be obtained by substituting Equations (26) and (28) for simultaneous compensation of the maximum pressure and the intake air mass in the cylinder through compensating the effective compression ratio and simultaneous turbocharging. They are expressed as follows:
η t h O M _ T = 1 ε c t κ 1 · F O M _ T F O M _ C = α ε c t ε e t κ 1 P e P t ε c t ε e t 1 + κ P e P t ε c t ε e t 1 ε c t 1 α 1
M E P t h O M _ T = η t h O M _ T · p 1 ε c t κ α 1 κ 1 { ( ε c t 1 } · v 1 v 1

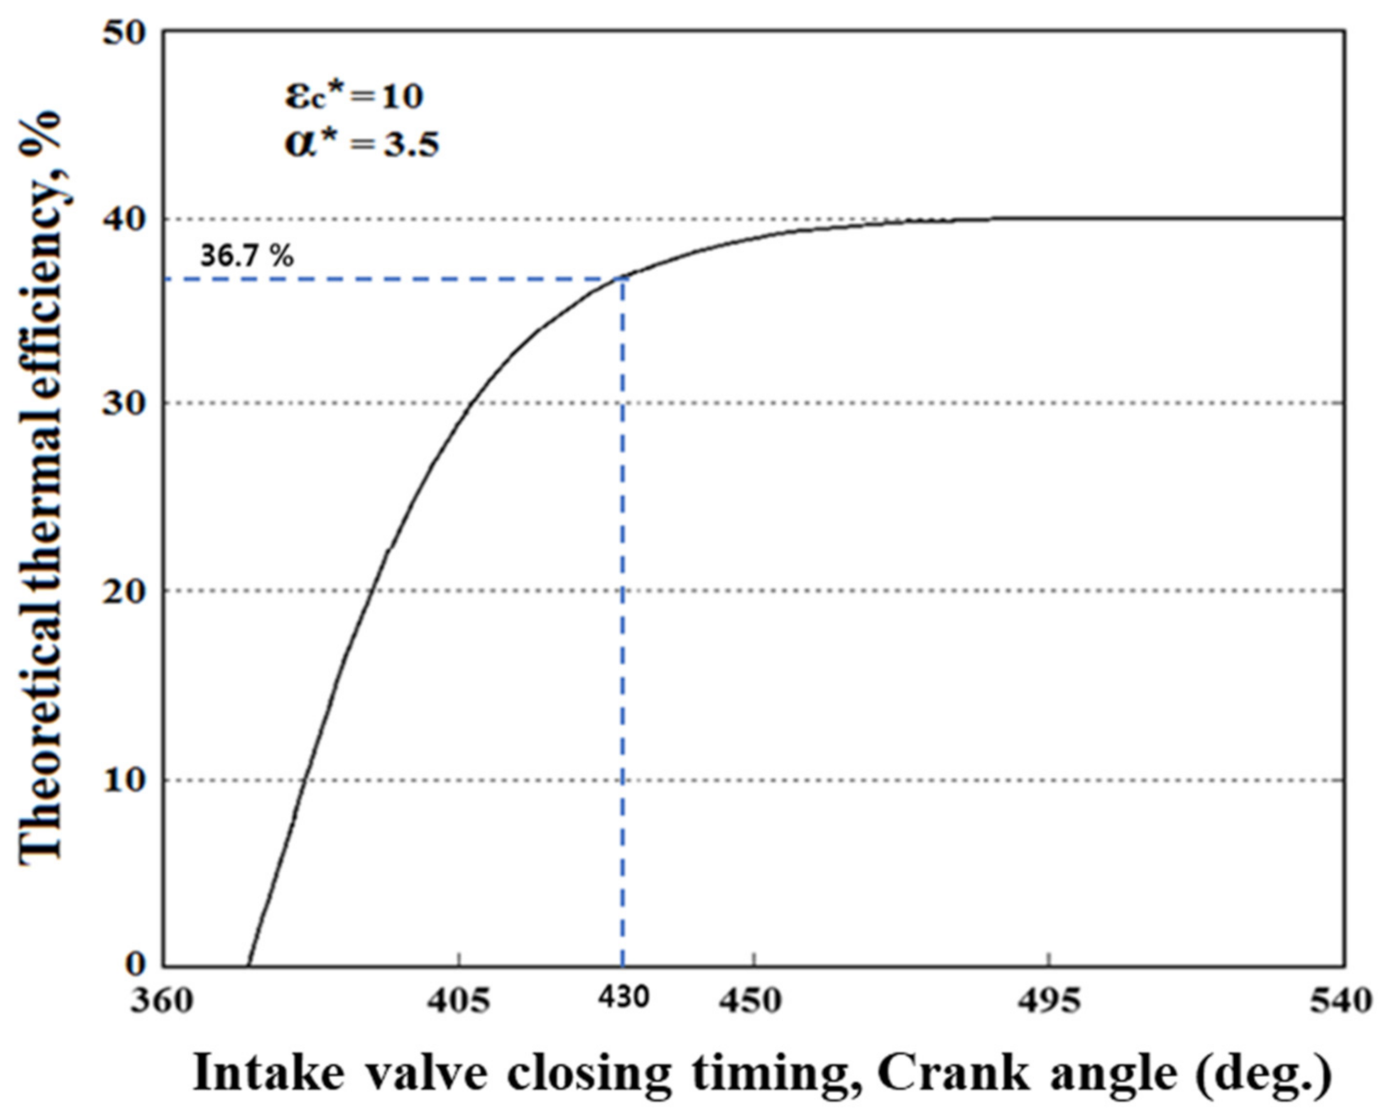
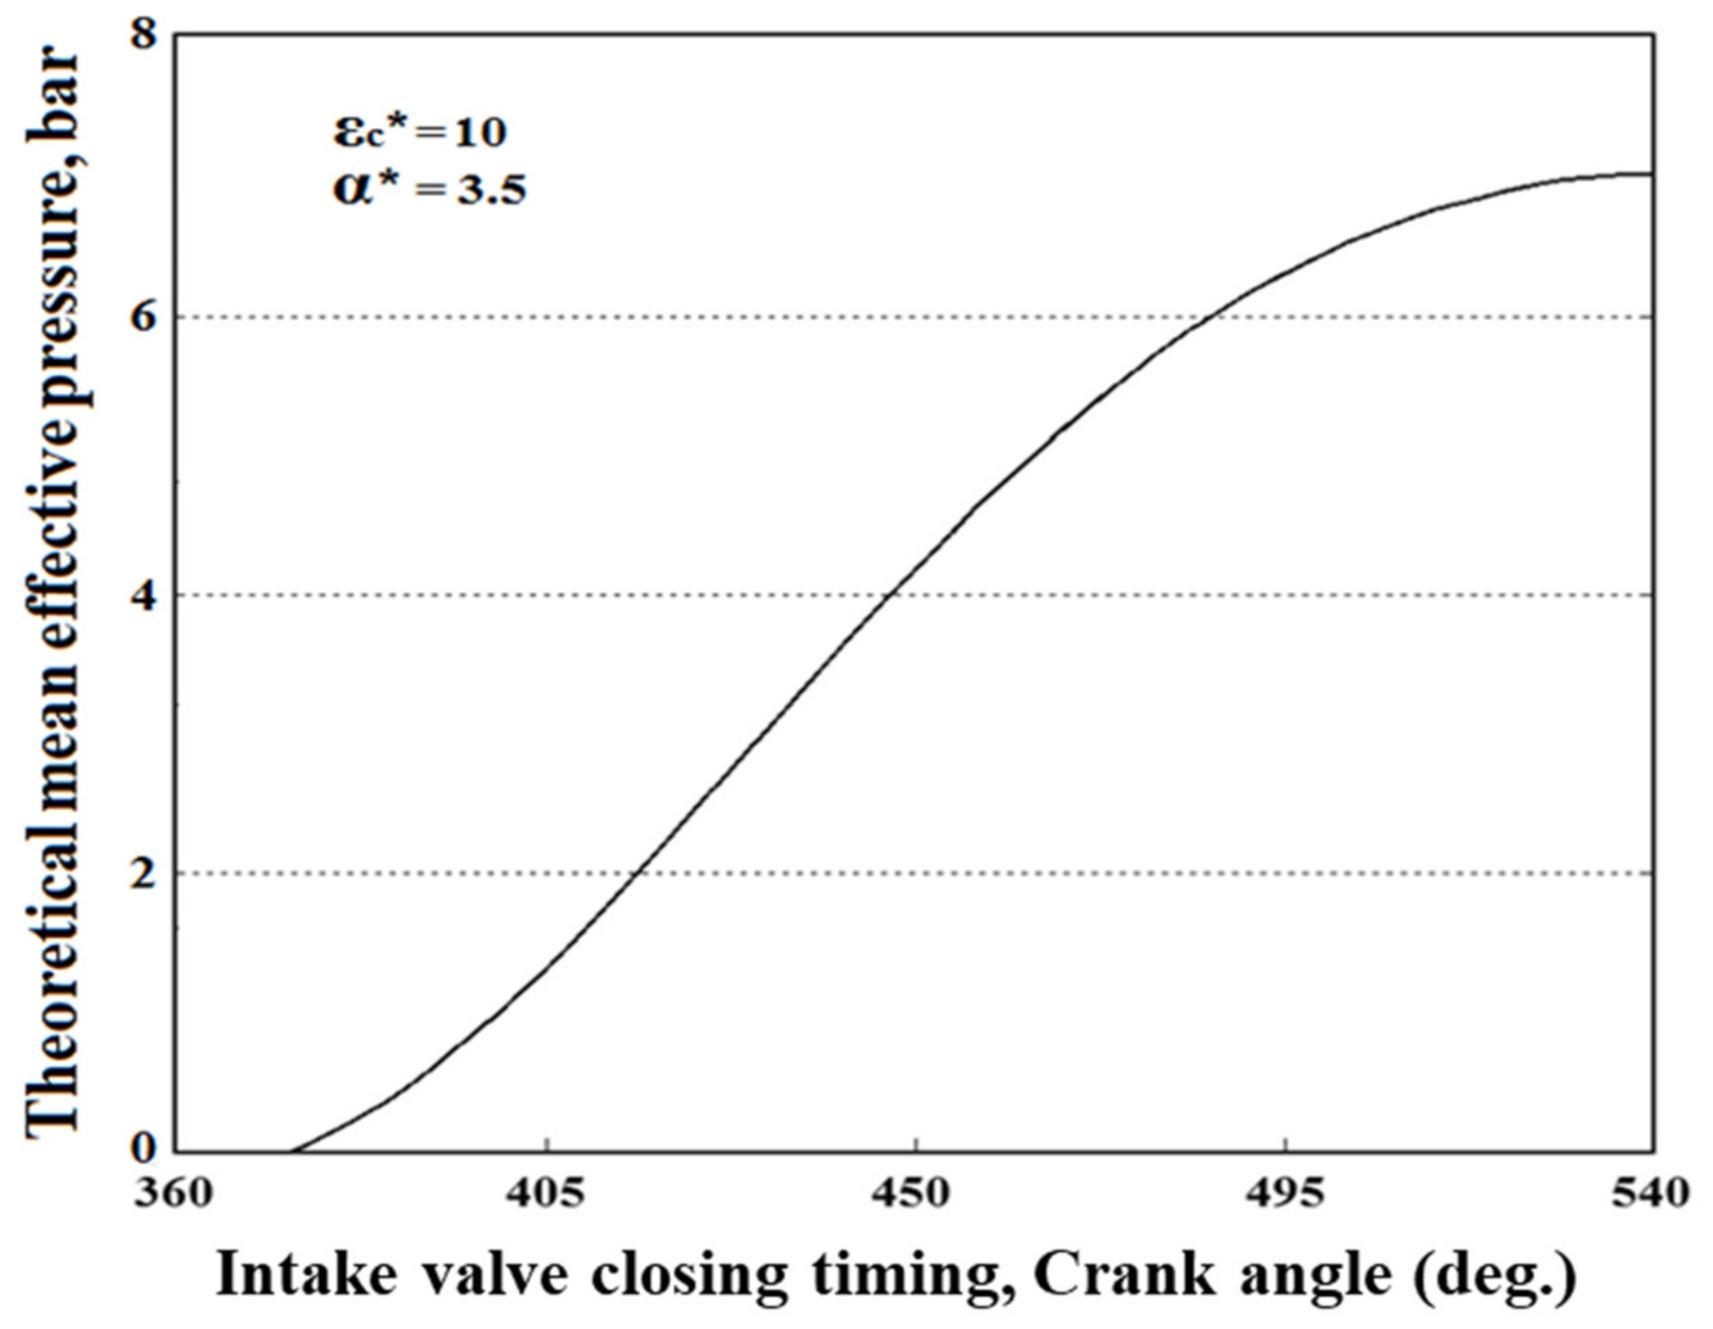
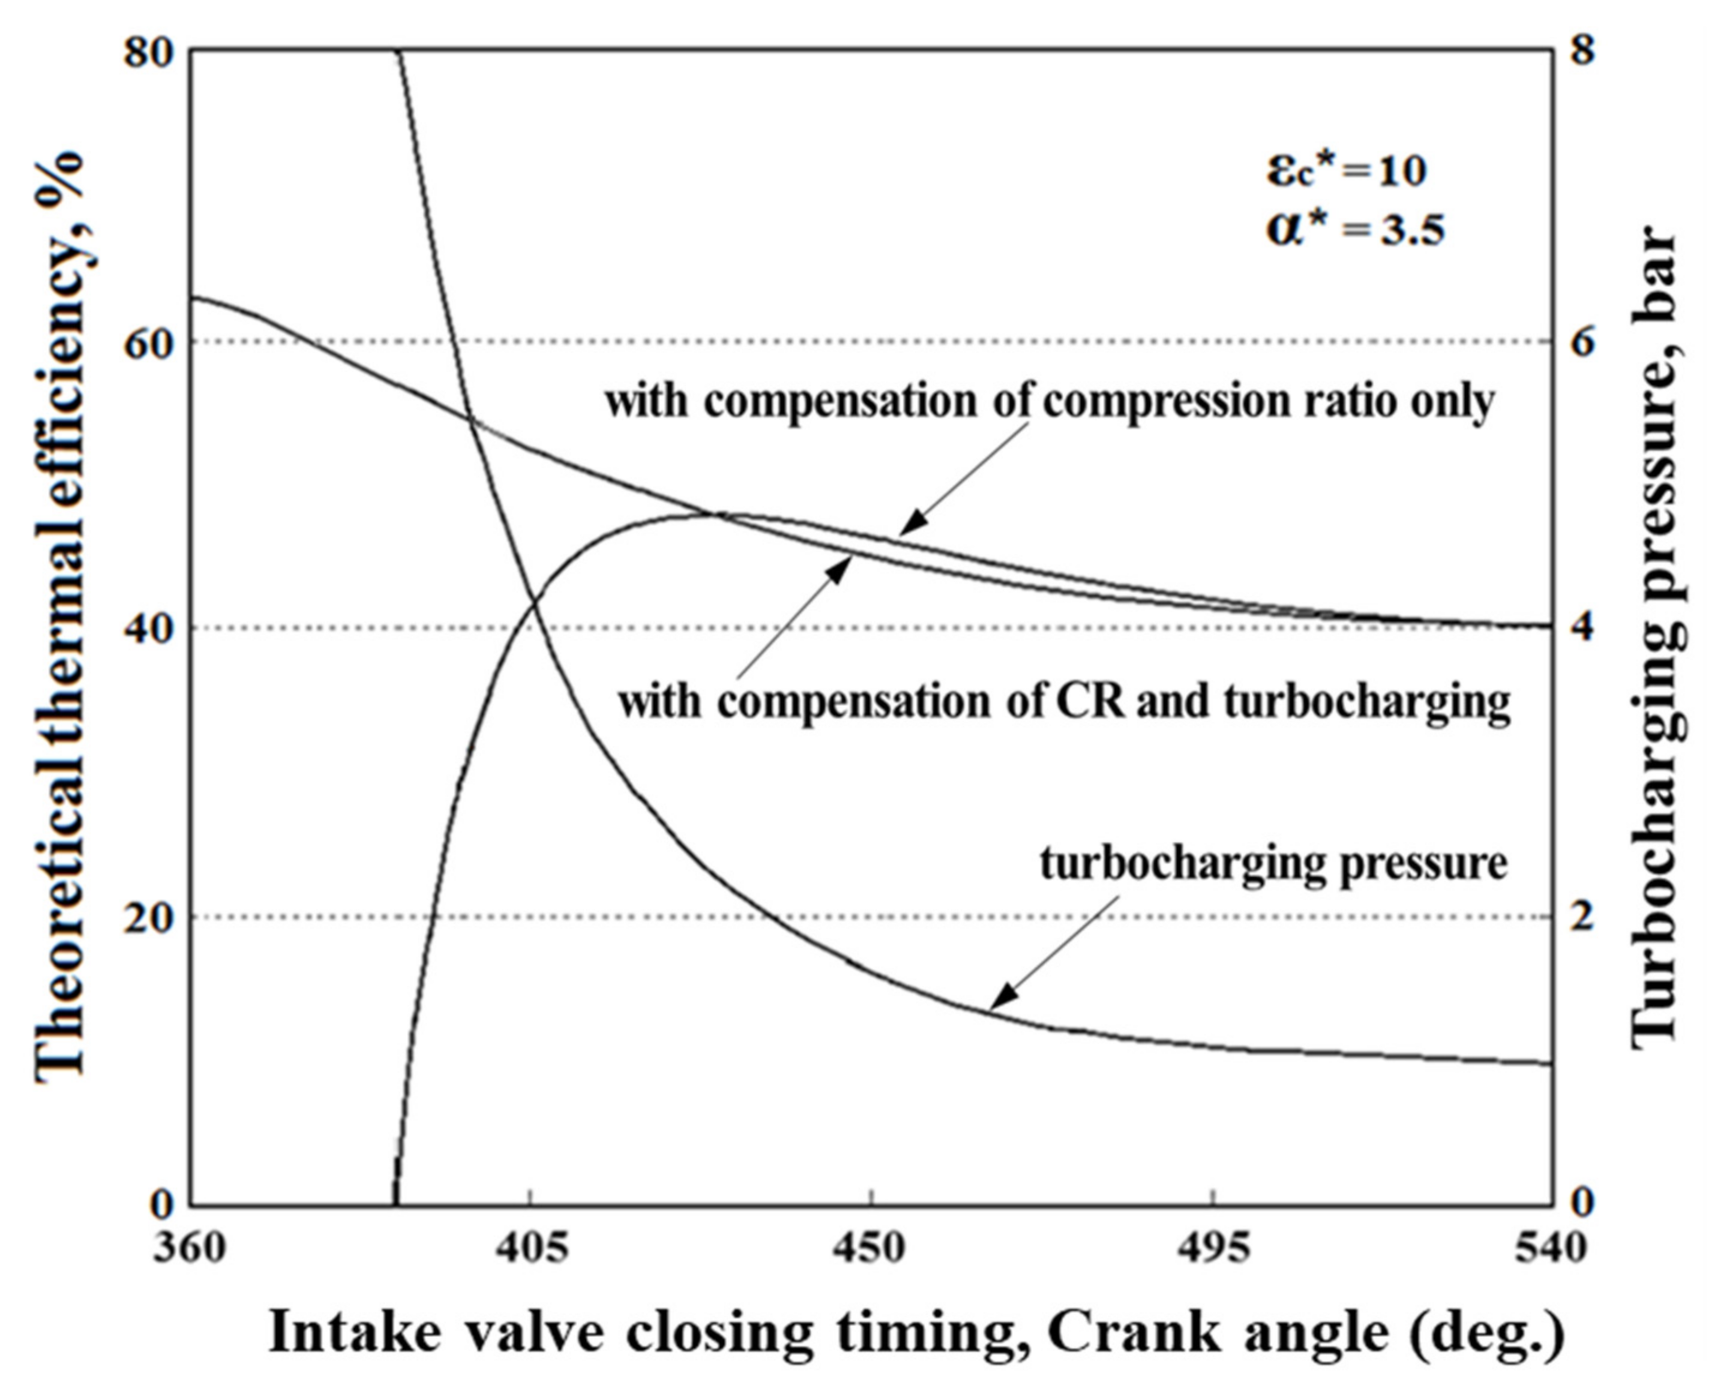
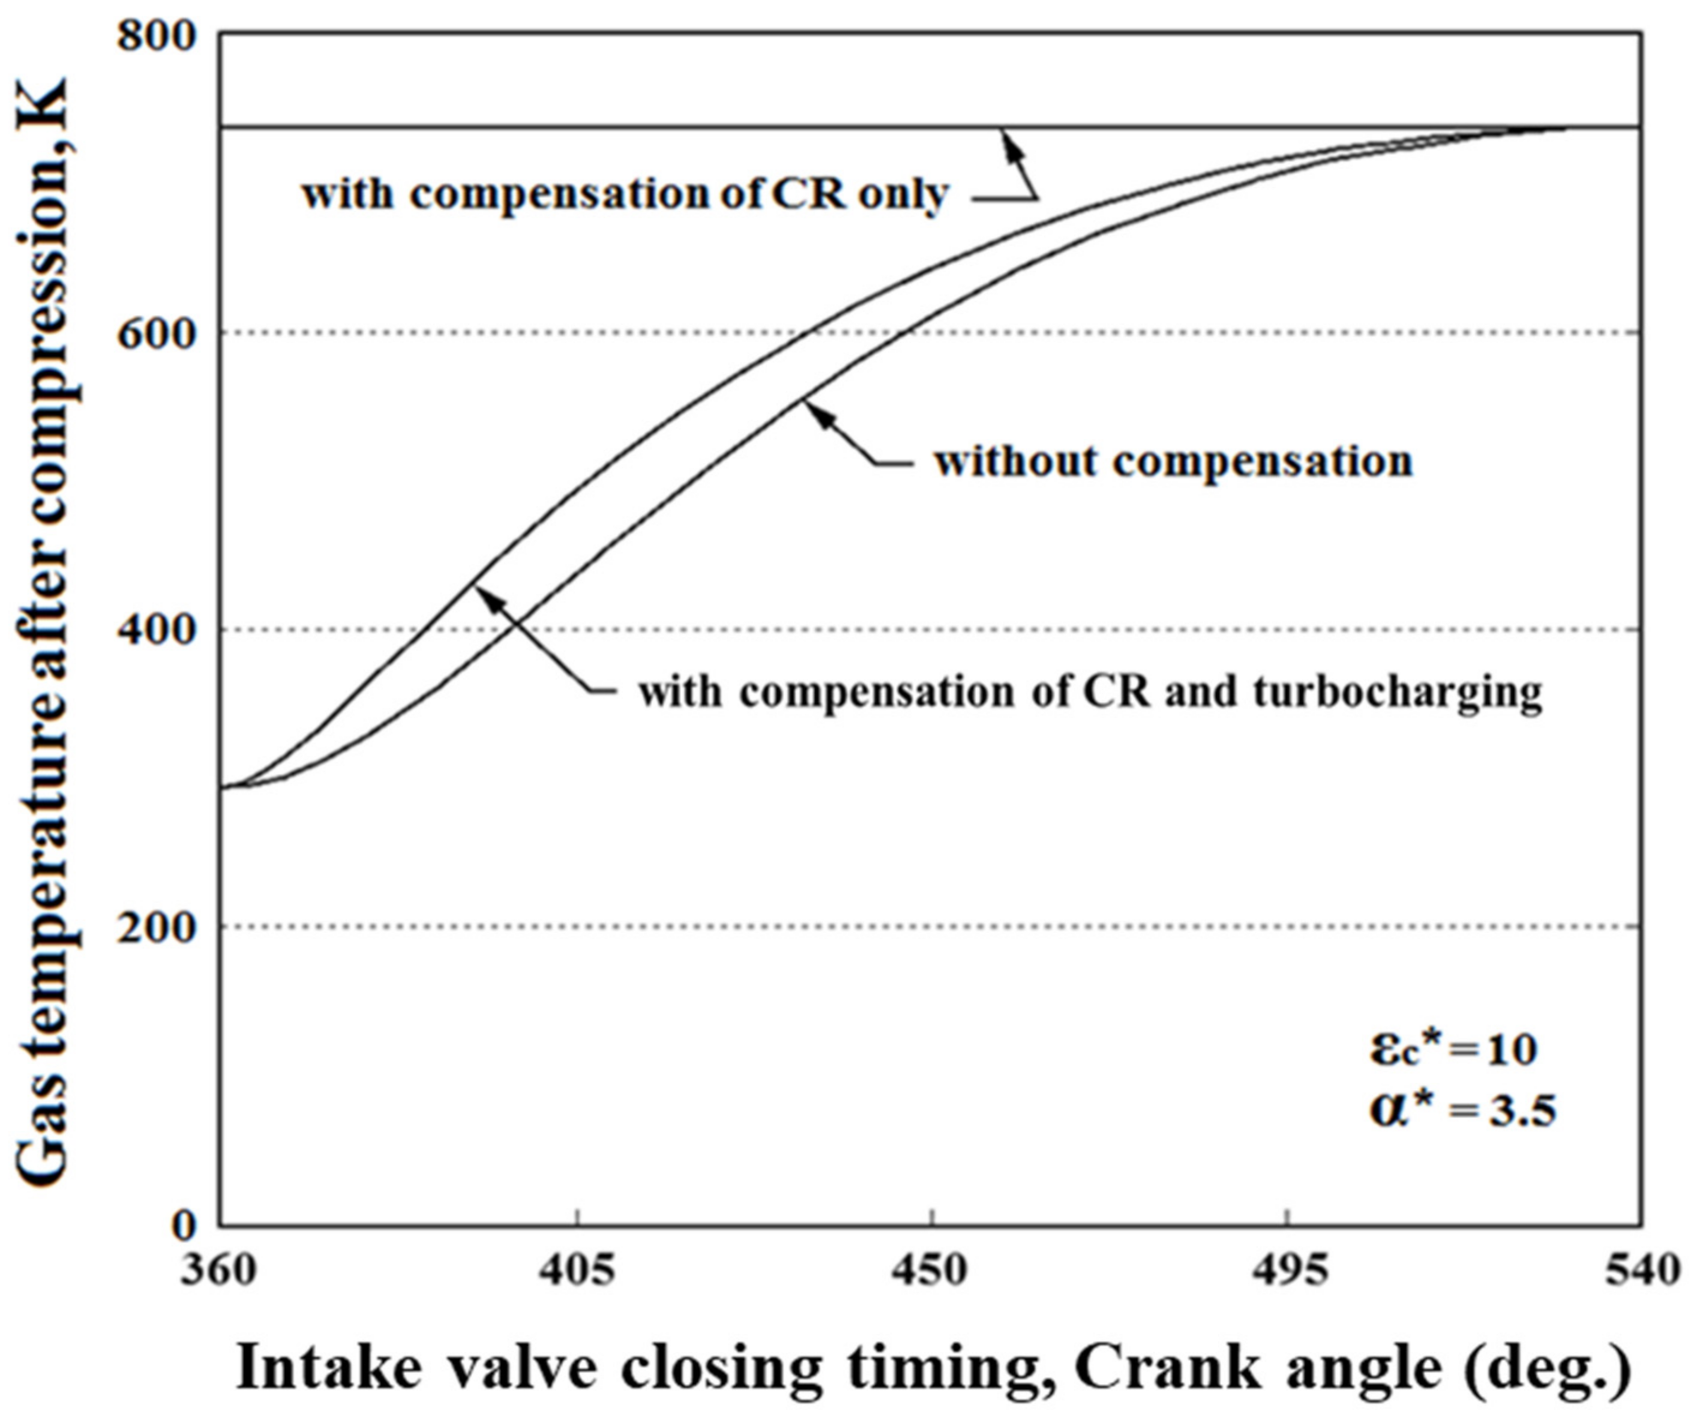
3.4. Thermal Efficiency and MEP of Otto–Miller Cycles with Compensation

Figure 6 compares the theoretical thermal efficiency of the Otto–Miller cycles when the maximum pressure is equalized by only compensating for the effective compression ratio ( ε c ), and when the maximum pressure and intake air mass are equalized simultaneously through compensating the compression ratio ( ε c ), pressure ratio ( α ) and turbocharging. The figure also demonstrates the required boost pressure.
When compensating only the compression ratio, the thermal efficiency increases as the intake-valve closing time advances, reaches a maximum value at approximately 430 °CA, where the effect of the Miller cycle is the greatest, and then decreases rapidly. For the Otto–Miller engine cycle with compression ratio compensation, the thermal efficiency can be improved by approximately 18.8% compared to that of the Otto cycle. In addition, in the region of the intake-valve closing timing before 430 °CA, the thermal efficiency when only the compression ratio is compensated is slightly higher than that when the compression ratio compensation and turbocharging are simultaneously performed. This is because the effective compression ratio when only the compression ratio is compensated, as described above, is higher than that when the compression ratio compensation and turbocharging are performed simultaneously.
Compression ratio compensation along with turbocharging indicates that the thermal efficiency continuously increases according to the increase in the intake-valve closing timing. However, excessive increase in the intake-valve closing timing causes mechanical and thermal disturbances, and it is therefore limited to the application extent. As shown in the figure, a turbocharging pressure of approximately 2.27 bar is required at around 430 °CA, indicating maximum thermal efficiency. In the case of a medium-speed marine engine, owing to a high compression ratio and mechanical loss, the intake-valve closing timing is approximately 500–520 °CA. To ensure an earlier closing time, the application of two-stage turbocharger should be considered [34].
Figure 7 compares the MEPs obtained under the same conditions as in Figure 6.
As mentioned above, the MEP depends on the thermal efficiency and amount of heat supplied. Therefore, when compensating only the compression ratio ( ε c ), pressure ratio ( α ) and the MEP tends to decrease owing to the continuous reduction in the intake air mass, although the thermal efficiency is improved up to 430 °CA. When compensating the intake air mass along with simultaneous turbocharging, because the supplied heat is constant, regardless of the change in the intake-valve closing timing, the MEP depends on the thermal efficiency and thus increases continuously as the thermal efficiency changes.
To enhance only the thermal efficiency, it is advantageous to compensate only the compression ratio; however, if the overall engine performance is considered, it is advantageous to compensate the compression ratio along with simultaneous turbocharging. In other words, to maximize the Miller effect, it is necessary to select an appropriate Miller timing and boost pressure.
Figure 8 depicts the temperature in the combustion chamber after compression in the Otto–Miller cycle.
Figure 8 depicts the temperature in the combustion chamber after compression with the compression ratio ( ε c ) and pressure ratio ( α ) in the Otto–Miller cycle. The gas temperature after compression can be obtained as a function of only the effective compression ratio ( ε c ) because the compression process is adiabatic. When the maximum pressure and intake air mass are simultaneously compensated for by compensating the compression ratio ( ε c ), pressure ratio ( α ) and turbocharging, the gas temperature continuously decreases with the advancement of the intake-valve closing timing. Accordingly, the peak gas temperature after combustion will also be lowered, thereby reducing NOx emissions.

4. Conclusions

Thermodynamic analysis of the Otto–Miller cycle was performed, taking into consideration changes in the closing time of the intake valve, and the potential for improvement of the thermal efficiency and engine output was evaluated. The following important conclusions were obtained:
  • The Otto–Miller cycle can improve thermal efficiency and reduce NOx emissions by reducing compression work; however, it must compensate for the compression pressure and intake air mass by compensating the effective compression ratio or turbocharging.
  • The Miller effect yielded the maximum theoretical thermal efficiency at approximately 430 °CA. However, considering the actual engine characteristics and operating conditions, an appropriate effective compression ratio and boost pressure must be selected.
  • When only the compression ratio was compensated, the theoretical thermal efficiency of the Otto–Miller cycle improved by approximately 18.8% compared to that of the Otto cycle.
  • In terms of enhancing only the thermal efficiency, it is more advantageous to compensate only the compression ratio, but when considering the engine output, it is effective to compensate the boost pressure also to maintain the intake air mass.

Author Contributions

Conceptualization, K.N.; methodology, K.N.; investigation, J.O.; data curation, J.O.; writing—original draft preparation, C.L.; writing—review and editing, C.L. All authors have read and agreed to the published version of the manuscript.

Funding

This research was supported by the Basic Science Research Program through the National Research Foundation of Korea (NRF) funded by the Ministry of Education (NO. 2020R1I1A2073426).

Institutional Review Board Statement

Not applicable.

Informed Consent Statement

Not applicable.

Data Availability Statement

Not applicable.

Conflicts of Interest

The authors declare no conflict of interest.

Nomenclature

Nomenclature
C v   Constant specific heat
HufLower heating value
RecRatio of the compression ratio to the expansion ratio
VSDisplacement volume
WthTheoretical cycle work
α Pressure ratio before and after combustion at Otto cycle
ε c Compression ratio
ε e Expansion ratio
κ Specific heat ratio
λafAir/fuel equivalence ratio
Abbreviation
BDCBottom dead center
CACrank angle
EGRExhaust gas recirculation
EIVCEarly intake valve closing
LIVCLate intake valve closing
MEPMean effective pressure
(c)with compensation of only compression ratio
(t)with compensation of compression ratio and turbocharging
simultaneously
Subscripts
OMOtto-Miller cycle
OM_COtto-Miller cycle with compensation of only compression ratio
OM_TOtto-Miller cycle with compensation of compression ratio and
turbocharging simultaneously
thTheoretical value
Superscripts
*apparent value (design value)

References

  1. Andresen, B.; Salamon, P.; Berry, R.S. Thermodynamics infinite time. Phys. Today 1984, 37, 62–70. [Google Scholar] [CrossRef]
  2. Chen, L.; Wang, J.; Sun, F. Power density analysis and optimization of an irreversible closed intercooled regenerated Brayton cycle. Math. Comput. Model. 2008, 48, 527–540. [Google Scholar] [CrossRef]
  3. Ebrahimi, R. Effects of mean piston speed, equivalence ratio and cylinder wall temperature on performance of an Atkinson engine. Math. Comput. Model. 2011, 53, 1289–1297. [Google Scholar] [CrossRef]
  4. Parlak, A. The effect of heat transfer on performance of the diesel cycle and exergy of the exhaust gas stream in a LHR diesel engine at the optimum injection timing. Energy Convers. Manag. 2005, 46, 167–179. [Google Scholar] [CrossRef]
  5. Jesudason, C.G. Focus on the Clausius inequalities as a consequence of modeling thermodynamic systems as a series of open Carnot cycles. Math. Comput. Model. 2009, 49, 835–842. [Google Scholar] [CrossRef]
  6. Miller, R.H. Supercharging and internally cooling for high output. Asme Trans. 1947, 69, 453–464. [Google Scholar]
  7. Kesgin, U. Efficiency improvement and NOx emission reduction potential soft wo-stage turbocharged Miller cycle for stationary natural gas engines. Int. J. Energy Res. 2005, 29, 189–216. [Google Scholar] [CrossRef]
  8. Hatamura, K.; Hayakawa, M.; Goto, T.; Hitomi, M. A study of the improvement effect of Miller-cycle on mean effective pressure limit for high-pressure supercharged gasoline engines. JSAE Rev. 1997, 18, 101–106. [Google Scholar] [CrossRef]
  9. Fukuzawa, Y.; Shimoda, H.; Kakuhama, Y.; Endo, H.; Tanaka, K. Development of high efficiency Miller cycle gas engine. Tech. Rev. 2001, 38, 146–150. [Google Scholar]
  10. Al-Sarkhi, A.; Akash, B.A.; Jaber, J.O.; Mohsen, M.S.; Abu-Nada, E. Efficiency of Miller engine at maximum power density. Int. Commun. Heat Mass Transf. 2002, 29, 1159–1167. [Google Scholar] [CrossRef]
  11. Sasaki, M.; Araki, S.; Miyata, T.; Kawaji, T. Development of capacity or hybrid system or urban buses. JSAE Rev. 2002, 23, 451–457. [Google Scholar] [CrossRef]
  12. Wu, C.; Puzinauskas, P.V.; Tsai, J.S. Performance analysis and optimization of a supercharged Miller cycle Otto engine. Appl. Therm. Eng. 2003, 23, 511–521. [Google Scholar] [CrossRef]
  13. Ge, Y.; Chen, L.; Sun, F.; Wu, C. Effects of heat transfer and friction on the performance of an irreversible air-standard Miller cycle. Int. Commun. Heat Mass Transf. 2005, 32, 1045–1056. [Google Scholar] [CrossRef]
  14. Ge, Y.; Chen, L.; Sun, F.; Wu, C. Reciprocating heat-engine cycles. Appl. Energy 2005, 81, 397–408. [Google Scholar] [CrossRef]
  15. Ge, Y.; Chen, L.; Sun, F.; Wu, C. Effects of heat transfer and variable specific heats of working fluid on performance of a Miller cycle. Int. J. Ambient Energy 2005, 26, 203–214. [Google Scholar] [CrossRef]
  16. Al-Sarkhi, A.; Jaber, J.O.; Probert, S.D. Efficiency of a Miller engine. Appl. Energy 2006, 83, 343–351. [Google Scholar] [CrossRef]
  17. Zhao, Y.; Chen, J. Performance analysis of an irreversible Miller heat engine and its optimum criteria. Appl. Therm. Eng. 2007, 27, 2051–2058. [Google Scholar] [CrossRef]
  18. Al-Sarkhi, A.; Al-Hinti, I.; Abu-Nada, E.; Akash, B. Performance evaluation of irreversible Miller engine under various specific heat models. Int. Commun. Heat Mass Transf. 2007, 34, 897–906. [Google Scholar] [CrossRef]
  19. Lin, J.C.; Hou, S.S. Performance analysis of an air-standard Miller cycle with considerations of heat loss as a percentage of fuel’s energy, friction and variable specific heats of working fluid. Int. J. Therm. Sci. 2008, 47, 182–191. [Google Scholar] [CrossRef]
  20. Chen, L.; Zhang, W.; Sun, F. Power efficiency, entropy-generation rate and ecological optimisation for a class of generalised irreversible universal heat-engine cycles. Appl. Energy 2007, 84, 512–525. [Google Scholar] [CrossRef]
  21. Liu, J.; Chen, J. Optimum performance analysis of a class of typical irreversible heat engines with temperature-dependent heat capacities of the working substance. Int. J. Ambient Energy 2010, 31, 59–70. [Google Scholar] [CrossRef]
  22. Gatowski, J.A.; Balles, E.N.; Chun, K.M.; Nelson, F.E.; Ekchian, J.A.; Heywood, J.B. Heat Release Analysis of Engine Pressure Data. SAE Trans. 1984, 961–977. [Google Scholar] [CrossRef]
  23. Klein, M. A specific heat ratio model and compression ratio estimation, Department of Electrical Engineering. Ph.D. Thesis, Linkoping University, Linköping, Sweden, 2004. [Google Scholar]
  24. Brunt, M.; Rai, H.; Emtage, A. The Calculation of Heat Release Energy from Engine Cylinder Pressure Data. SAE Trans. 1998, 1596–1609. [Google Scholar] [CrossRef]
  25. Ceviz, M.A.; Kaymaz, I. Temperature and air–fuel ratio dependent specific heat ratio functions for lean burned and unburned mixture. Energy Convers. Manag. 2005, 46, 2387–2404. [Google Scholar] [CrossRef]
  26. Maiboom, A.; Tauzia, X.; Hetet, J.F. Experimental study of various effects of exhaust gas recirculation (EGR) on combustion and emissions of an automotive direct injection diesel engine. Energy 2008, 33, 22–34. [Google Scholar] [CrossRef]
  27. Wang, Y.; Zeng, S.; Huang, J.; He, Y.; Huang, X.; Lin, L.; Li, S. Experimental investigation of applying miller cycle to reduce NOx emission from diesel engine. J. Power Energy 2005, 219, 631–638. [Google Scholar] [CrossRef]
  28. Hou, S.S. Comparison of performances of air standard Atkinson and Otto cycles with heat transfer considerations. Energy Convers. Manag. 2007, 48, 1683–1690. [Google Scholar] [CrossRef]
  29. Lin, J.-C.; Hou, S.S. Influence of heat loss on the performance of an air-standard Atkinson cycle. Appl. Energy 2007, 84, 904–920. [Google Scholar] [CrossRef]
  30. Endo, H.; Tanaka, K.; Kakuhama, Y.; Goda, Y.; Fujiwaka, T.; Nishigaki, M. Development of the lean burn Miller cycle gas engine. In Proceedings of the 5th International Symposium on Diagnostics and Modeling of Combustion in Internal Combustion Engines (COMODIA 2001), Nagoya, Janpan, 1–4 July 2001. [Google Scholar]
  31. Gheorghiu, V.; Ueberschar, D. Enhancement potential of the thermal conversion efficiency of ICE cycles especially for use in hybrid vehicles. In Proceedings of the 5th International Conference on Heat Transfer, Fluid Mechanics and Thermodynamics (HEFEAT2007), Sun City, South Africa, 1–4 July 2007. [Google Scholar]
  32. Wang, Y.; Ruxton, T. An experimental investigation of NOx emission reduction from automotive engine using the Miller cycle. In Proceedings of the ASME 2004 Fall Technical Conference, Long Beach, CA, USA, 24–27 October 2004. [Google Scholar]
  33. Wang, Y.; Lin, L.; Roskilly, A.P.; Zeng, S.; Huang, J.; He, Y.; Huang, X.; Huang, H.; Wei, H.; Li, S.; et al. An analytic study of applying Miller cycle to reduce NOx emission from petrol engine. Appl. Therm. Eng. 2007, 27, 1779–1789. [Google Scholar] [CrossRef] [Green Version]
  34. Branyon, D.; Simpson, D. Miller Cycle Application to the Scuderi Split Cycle Engine (by Downsizing the Compressor Cylinder). SAE Tech. Paper 2012. [Google Scholar] [CrossRef]
  35. Wei, S.; Zhao, X.; Liu, X.; Qu, X.; He, C.; Leng, X. Research on effects of early intake valve closure (EIVC) miller cycle on combustion and emissions of marine diesel engines at medium and low loads. J. Energy 2019, 173, 45–58. [Google Scholar] [CrossRef]
  36. Liu, H.; Ma, J.; Tong, L.; Ma, G.; Zheng, Z.; Yao, M. Investigation on the Potential of High Efficiency for Internal Combustion Engines. Energies 2018, 11, 513. [Google Scholar] [CrossRef] [Green Version]
  37. Liu, H.; Cui, Y.; Chen, B.; Kyritsis, D.C.; Tang, Q.; Feng, L.; Wang, Y.; Li, Z.; Geng, C.; Yao, M. Effects of Flame Temperature on PAHs and Soot Evolution in Partially Premixed and Diffusion Flames of a Diesel Surrogate. Energy Fuels 2019, 33, 11821–11829. [Google Scholar] [CrossRef]
  38. Brooks, J.; Lane, A. Features of an Atkinson Two-Stroke Engine. SAE Tech. Paper. 1994. [Google Scholar] [CrossRef]
  39. Chen, L.; Ge, Y.; Sun, F.; Wu, C. Effects of heat transfer, friction and variable specific heats on performance of an irreversible dual cycle. Energy Convers. Manag. 2006, 47, 3224–3234. [Google Scholar] [CrossRef]
  40. Baek, H.M.; Lee, J.W.; Jeong, K.S.; Choi, J.S. Theoretical investigation of Miller cycle characteristics. J. Korea Soc. Mar. Eng. 2017, 41, 507–513. [Google Scholar]
  41. Boggs, D.; Hilbert, H.; Schechter, M. The Otto-Atkinson Cycle Engine-Fuel Economy and Emissions Results and Hardware Design. SAE Trans. 1995, 220–232. [Google Scholar] [CrossRef]
  42. Tuttle, J. Controlling Engine Load by Means of Early Intake-Valve Closing. SAE Trans. 1982, 1648–1662. [Google Scholar] [CrossRef]
  43. Blakey, S.; Saunders, R.; Ma, T.; Chopra, A. A Design and Experimental Study of an Otto Atkinson Cycle Engine Using Late Intake Valve Closing. SAE Tech. Paper 1991, 632–640. [Google Scholar] [CrossRef]
  44. Atkinson, C.M.; Petreanu, S.; Clark, N.N.; Atkinson, R.J.; McDaniel, T.I.; Nandkumar, S.; Famouri, P. Numerical Simulation of a Two-Stroke Linear Engine-Alternator Combination. SAE Tech. Paper 1999, 1416–1430. [Google Scholar] [CrossRef] [Green Version]
  45. Schenk, C.; Dekraker, P. Potential Fuel Economy Improvements from the Implementation of cEGR and CDA on an Atkinson Cycle Engine. SAE Tech. Paper 2017. [Google Scholar] [CrossRef]
Figure 1. Curves of the ideal Otto and Otto–Miller cycles.
Processes 09 01051 g001
Figure 2. Compression expansion ratio, Rec, and α 1 κ as functions of intake valve closing timing.
Processes 09 01051 g002
Figure 3. Theoretical thermal efficiency of Otto–Miller cycle according to the intake valve closing timing.
Processes 09 01051 g003
Figure 4. Theoretical MEP of Otto-Miller cycle according to the intake valve closing timing.
Processes 09 01051 g004
Figure 5. P–V curves showing compensation of only compression ratio (CR) and simultaneous turbocharging in Otto–Miller cycle.
Processes 09 01051 g005
Figure 6. Comparison of theoretical thermal efficiency with compensation of compression ratio (CR) only and simultaneous turbocharging.
Processes 09 01051 g006
Figure 7. Comparison of MEP with compensation of compression ratio (CR) only and turbocharging simultaneous.
Processes 09 01051 g007
Figure 8. Gas temperature after compression according to change intake valve closing timing.
Processes 09 01051 g008
Publisher’s Note: MDPI stays neutral with regard to jurisdictional claims in published maps and institutional affiliations.

