Article

Emerging Floating Photovoltaic System—Case Studies High Dam and Aswan Reservoir in Egypt

by
Nagananthini Ravichandran
1,
Hady H. Fayek
2 and
Eugen Rusu
3,*
1
Independent Researcher, Power Electronics and Drives, Tamil Nadu 624204, India
2
Electromechanics Engineering Department, Faculty of Engineering, Heliopolis University, Cairo 11785, Egypt
3
Department of Mechanical Engineering, Faculty of Engineering, ‘Dunarea de Jos’ University of Galati, 47 Domneasca Street, 800008 Galati, Romania
*
Author to whom correspondence should be addressed.
Processes 2021, 9(6), 1005; https://doi.org/10.3390/pr9061005
Submission received: 8 May 2021 / Revised: 3 June 2021 / Accepted: 4 June 2021 / Published: 6 June 2021
(This article belongs to the Topic Marine Renewable Energy)

Abstract

:
The world has a target of achieving 100% renewable energy by the end of the century. This paper presents a case study to establish a new floating photovoltaic park (FPV) in Egyptian dams. In Egypt, two hydroelectric dams, namely High Dam and Aswan Reservoir, together produce 2.65 GW in the Upper-Egypt region. The addition of 5 MW FPV for each dam is simulated using the Helioscope software application. A comparison between the performance of the dams with and without adding the FPV is presented in terms of the evaporation rate and total produced energy. A comparison between different types of FPV, namely polycrystalline, thin film and mono-crystalline in the two dams are also presented. The results show that installing FPV in the Egyptian dams will drive the dams to better performance in terms of carbon dioxide reduction, water-saving from reducing evaporation and increasing hydropower generation.

1. Introduction

The penetration level of renewable energies worldwide is continually increasing, and by the end of 2020, the net cumulative capacity added by the renewable energy system was 261 GW [1]. Due to the stochastic nature of sustainable energy technologies in terms of variability and reliability, not enough installed capacity of renewables is yet established worldwide to measure the impacts of each renewable energy technology in terms of construction footprints, environmental consequences, socio-economic studies and the reliability of those technologies over the years [2]. With the increase in renewable energy shares in different locations, all the previous impacts will be clearer until the world reaches fully sustainable power generation. Hydropower, wind turbines and photovoltaic technology are the three highest renewable energy technologies in terms of installed capacity. In the last 10 years, the installed capacity of photovoltaic technology has had a noticeable continuous increase and now, the cumulative photovoltaic power generation capacity is 707.5 GW. The solar PV system held the highest newly added renewable energy sources in 2020 with a capacity of 127 GW, which is 14.41% more than the wind energy system. The installed capacity of hydro power plants worldwide is 1150 GW, which represents 16% of the world generated electricity [3]. Particularly in Egypt, the government is focusing on increasing the penetration level of renewable energies to face the continuous increase in electricity demand [4]. Egypt has two hydro power stations with a total installed capacity of 2.65 GW, which was representative of all the renewable energy technologies of the Egyptian grid until the end of the last century. Egypt is rich with solar energy potential; the amount of solar energy incidence per square meter varies between 5 and 8 kWh per day with a duration of 3000–4000 h per year [5]. The Egyptian maximum demand in 2019 reached 32 GW, while the maximum penetration level of renewable energies in Egypt in 2020 was 10% [3].
The Upper-Egypt region has a target of 100% renewable energy operation with its two dams and the world’s largest photovoltaic park. The total generation of the region is 4.45 GW, in which 59% of the renewable power is generated from the hydropower plants of High Dam and Aswan Reservoir. However, several factors obstruct the maintenance of the capacity of the hydropower generation source. In 2011, Ethiopia started the construction of the Grand Ethiopian Renaissance Dam (GERD) on the Blue Nile in a place named Guba, approximately 60 km from Sudan. GERD will badly affect the High Dam (HD) and Aswan Reservoir (AR) in Egypt in terms of hydropower generation and the Nile water level. The hydropower is projected to decrease by 20–30% [6]. The Nile water level is anticipated to decrease by 0.4–0.75 m [7]. Additionally, the irradiation periods in the location of the reservoir increases the evaporation rate drastically, which results in poor power generation during high power demand periods. Therefore, to maintain the level of the reservoir by mitigating the evaporation rate, various countries experimented with a potential covering system. This covering system will reduce the action of wind and irradiation on the water surface, thereby reducing the rate of evaporation using monomolecular films, floating devices, suspended shading covers, and wind retarding devices [8,9]. One such covering system using PV panels can effectively shadow the reservoir from sunlight while generating power. This newly emerged solar technology, named a floating PV system, gained widespread global attention due to higher efficiency than a ground and roof-mounted PV system [10,11,12]. A water evaporative cooling mechanism and lower soiling loss improves the PV efficiency up to 30% according to a study in Indonesia, which has a climate similar to that of Egypt [13]. Several numerical and experimental analyses on the FPV system in minimizing water loss from evaporation while generating power have been carried out, with impressive results [14,15,16,17]. Apart from mounting FPV systems on lakes and ponds with the purpose of drinking and irrigation, it is efficient for installation on reservoirs with hydroelectric power plants [18]. The major advantage in hybridizing FPV on HEPP is the already available grid connection and water saved from evaporation can be effectively directed to hydropower generation [19,20]. Experimental results show the efficient yield from solar and hydropower in implementing this hybrid system [19,20,21,22,23]
Thus, FPV-HEPP integration has high potential, especially in countries with high temperatures such as Egypt, in addressing the water–energy demand. The use of FPV will secure the operation of this region as a 100% sustainable region and importing sustainable energy to other regions in the Egyptian grid.
The main contributions of this paper are:
-
The numerical analysis of the FPV system and its benefits if added to Aswan Reservoir and High Dam.
-
The comparison between the three types of PV modules, mono-crystalline, polycrystalline, and thin film, to be used in an FPV installed above Aswan Reservoir and High Dam.
-
A water-saving effect study when the FPV is added to Aswan Reservoir and High Dam, considering what the hydropower can generate from the saved water in the presence of FPV.
-
The environmental impacts of adding an FPV to both Dams.
The present study analyzes the potential of the FPV system upon implementation in the major hydropower reserves of Egypt: High Dam and Aswan Reservoir. The paper is organized as follows: Section 2 is an overview of the FPV, while Section 3 illustrates the need to reduce evaporation in High Dam and Aswan Reservoir. Section 4 illustrates the electrical performance of the two dams, while Section 5 presents the numerical analysis of the FPV in High Dam and Section 6 presents the numerical analysis of the FPV in Aswan Reservoir. Section 7 illustrates the FPV from the view of cost, carbon dioxide emissions and water–energy nexus. Section 8 and Section 9 illustrate the results, discussion and conclusion, respectively.

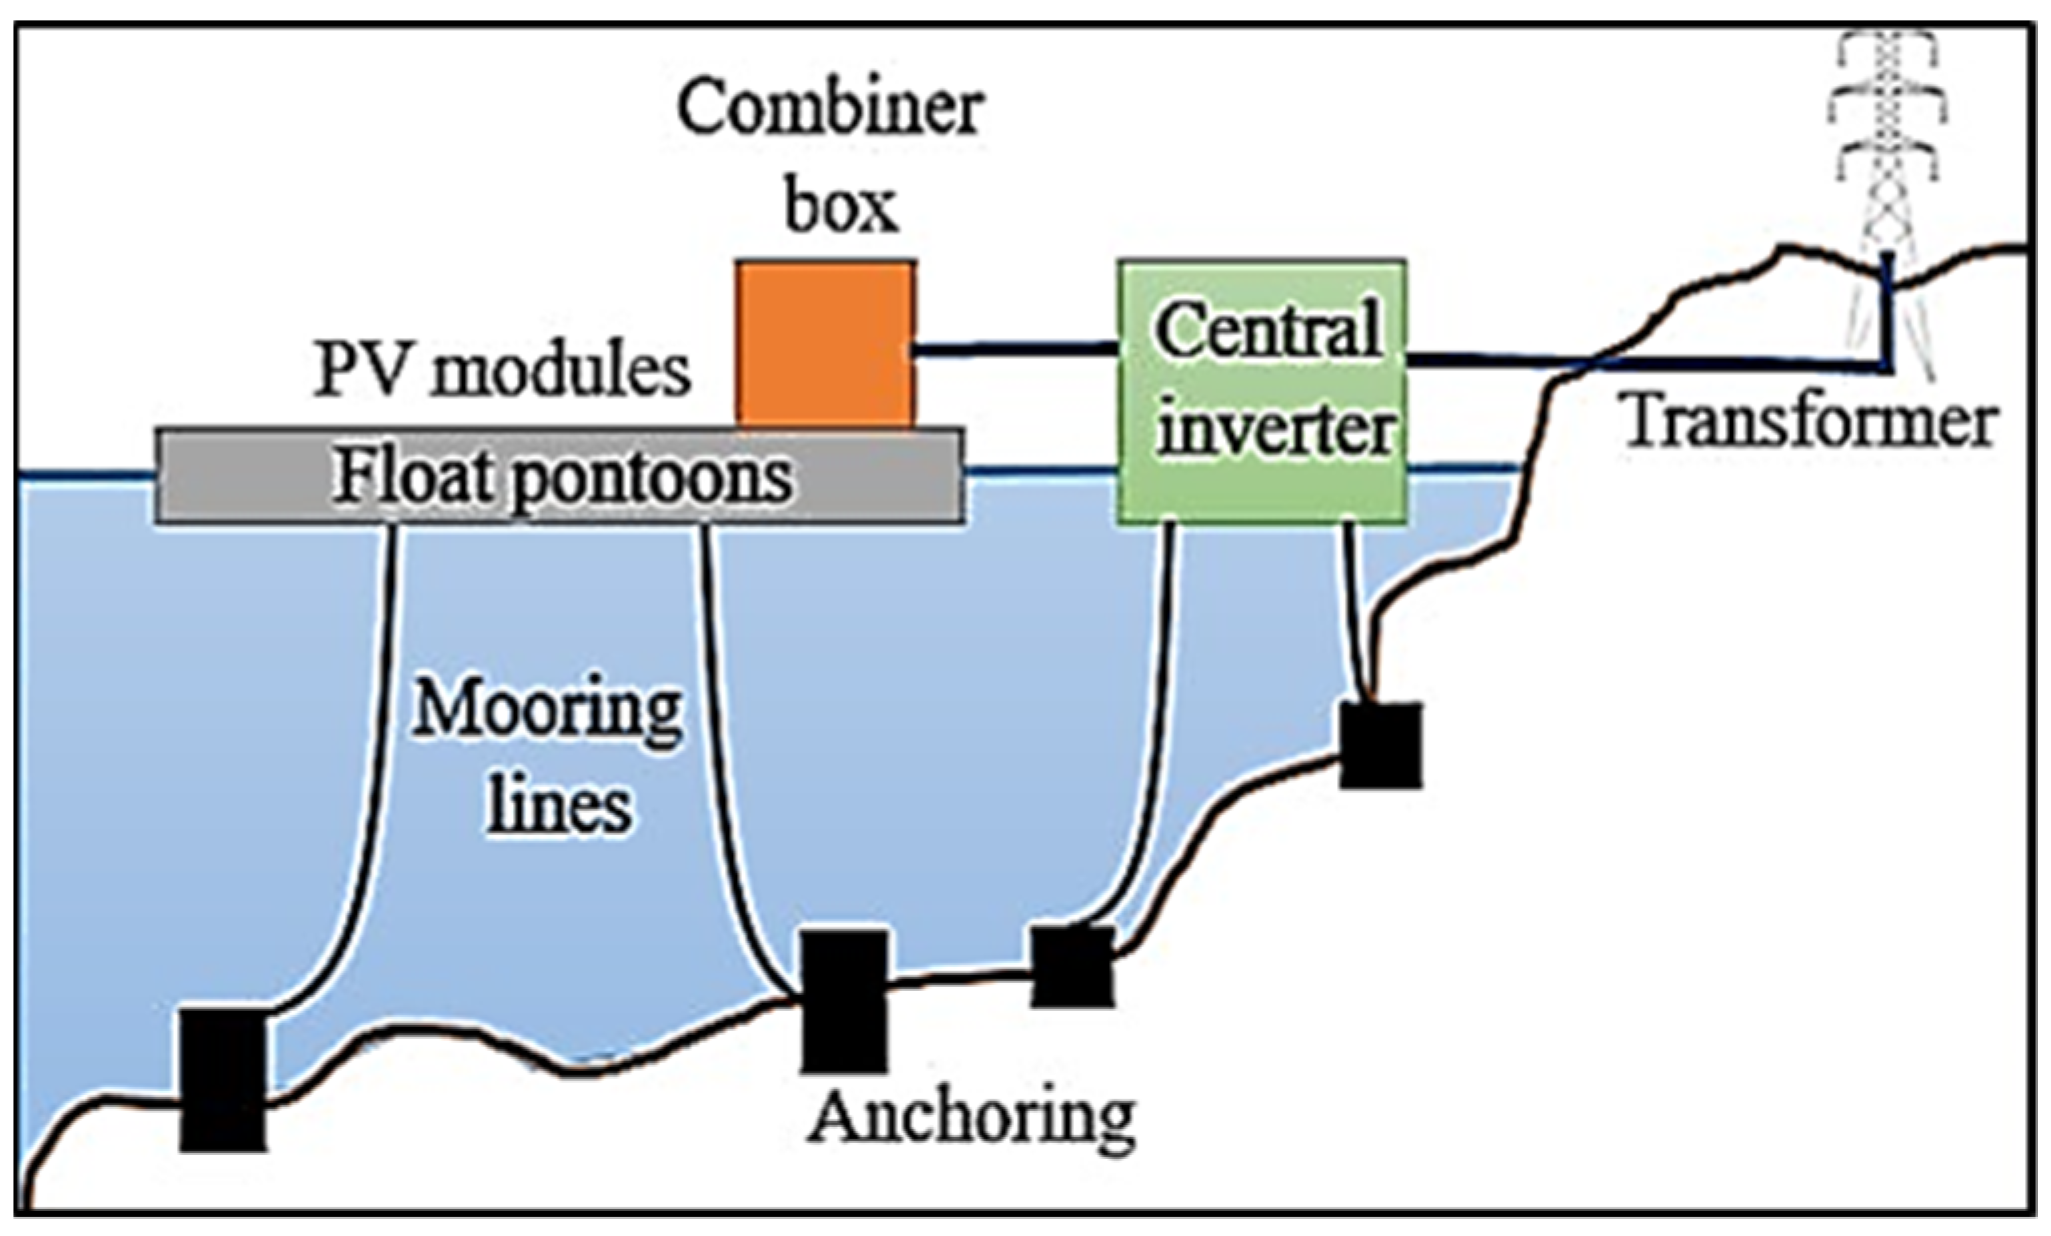
2. Overview of FPV System

Photovoltaics are now the fastest growing source of generating electricity worldwide. There are different methods to install PV systems in different infrastructures. The most famous mounting methods are:
  • Roof-top photovoltaic;
  • Canal photovoltaic;
  • Off-shore photovoltaic;
  • On-shore photovoltaic;
  • Agri-photovoltaics;
  • Floating photovoltaic (FPV).
In 2007, the first FPV system was installed with 20 kW capacity in Japan [24]. At present, they are installed in many locations worldwide, with a total installed capacity of 1.10 GW according to the World Bank report in 2019 [25]. Compared to ground or roof-mounted PV systems, water-mounted PV systems are proved to have very good performance among different countries and conditions. The main advantages of FPV systems are the absence of land acquisition, increased efficiency, less soiling and shading losses, the maintenance of water quality, the prevention of algal blooms, automatic water evaporative cooling and saving water from evaporation [26,27,28,29,30,31]. The most famous FPV stations worldwide are:
  • Coal mining subsidence area of Huainan City, China with of 60 MW capacity;
  • Yamakura solar power plant in Japan has an installed capacity of 13.70 MW;
  • Pei County in China has an installed capacity of 9.98 MW;
  • Umenoki in Japan has an installed capacity of 7.55 MW;
  • Jining GCL in China has an installed capacity of 6.78 MW;
  • Hirotani Ike Floating Solar Plant in Japan has an installed capacity of 6.80 MW;
  • Queen Elizabeth II Reservoir in the UK has an installed capacity of 6.34 MW;
  • Cheongpung Lake in South Korea has an installed capacity of 3 MW;
  • Otae Province in South Korea has an installed capacity of 3 MW.
There are remarkable benefits from floating PV technologies, which are:
  • Inverting underutilized bodies of water into money-making ponds.
  • Zero costs when it comes to land acquisition.
  • Lower grid connection costs and enhanced accessibility to the existing infrastructure.
  • Increased output and operational efficiency as a result of the water’s inherent cooling nature when evaporated.
  • Reduction in algae growth.
  • Improved plant load factor (PLF).
The structural components involved in the FPV system are floating platforms, cables, mooring and an anchoring mechanism, as shown in Figure 1. Floating platforms are the supporting structure with enough buoyancy to float itself with the installed PV array. Pontoon-based floating structures made up of high density polyethylene (HDPE), is the most commonly used floating structure [27]. Apart from that, metal-based structures with steel pipes are also used to support the PV array on water [28,29]. In order to ensure the stability of the floating structure from the action of waves and wind currents, a proper anchoring mechanism should be implemented. Based on the soil type and water level of the reservoir, the floating structure is anchored. Anchors made up of concrete blocks are placed on the bottom of the water body and connected to the edges of the PV array through mooring lines. [27,29]. Based on the position of the FPV array, anchoring on the embankment of the reservoir or on the nearby land area is possible [13,20,21,32]. Mooring lines ensure the flexibility and stability of the FPV system during severe wind and waves. Elastic mooring lines are used to make the FPV structure more flexible during a drift in water level during monsoon and empty reservoir conditions [30]. The power generated from the PV array installed on the floating structure is connected to the substation through underwater cables. Based on the distance of the substation from the FPV array, the inverter station is either placed on the ground or on a separate floating platform near the PV array to reduce the resistive losses [20,21,22,29,33]. Consequently, to increase the overall efficiency of the system, a cleaning and tracking mechanism can be implemented. In the present study, a pontoon-based floating PV, and a bottom anchoring system with elastic mooring lines is considered.

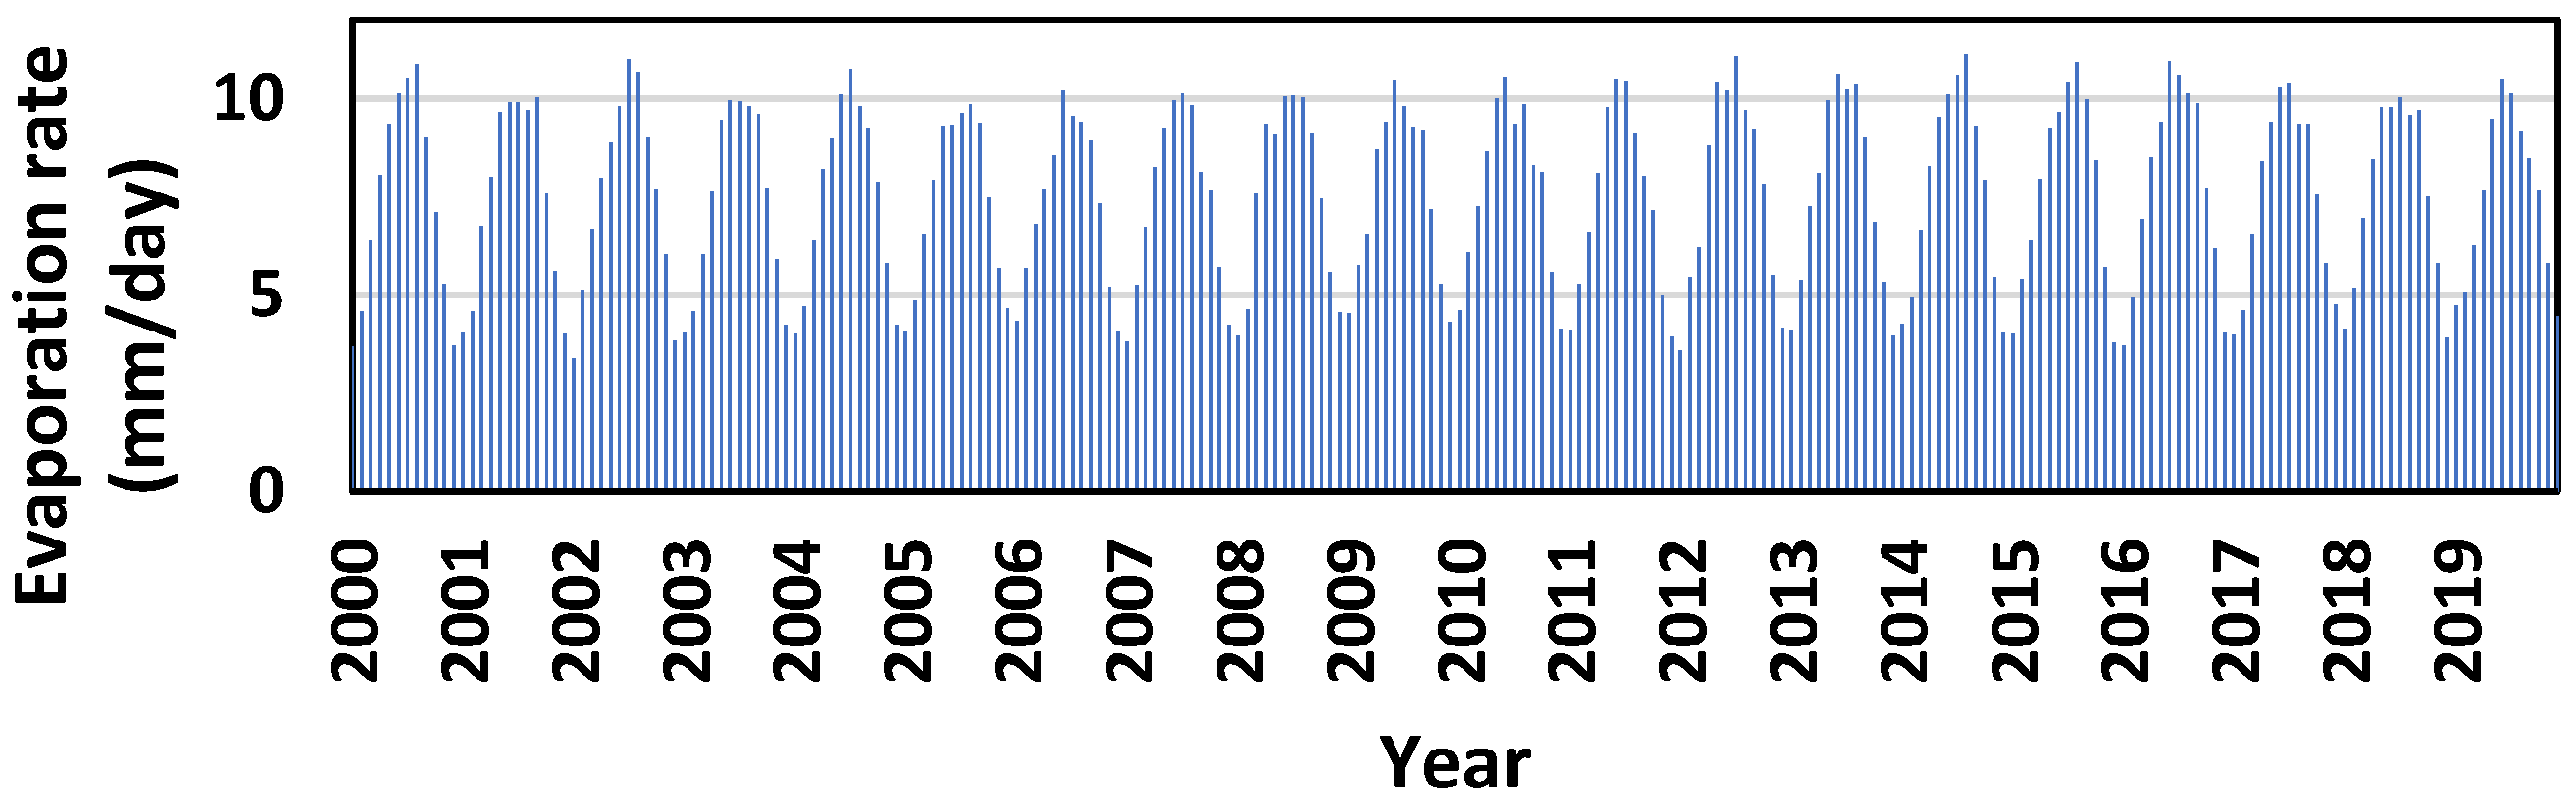
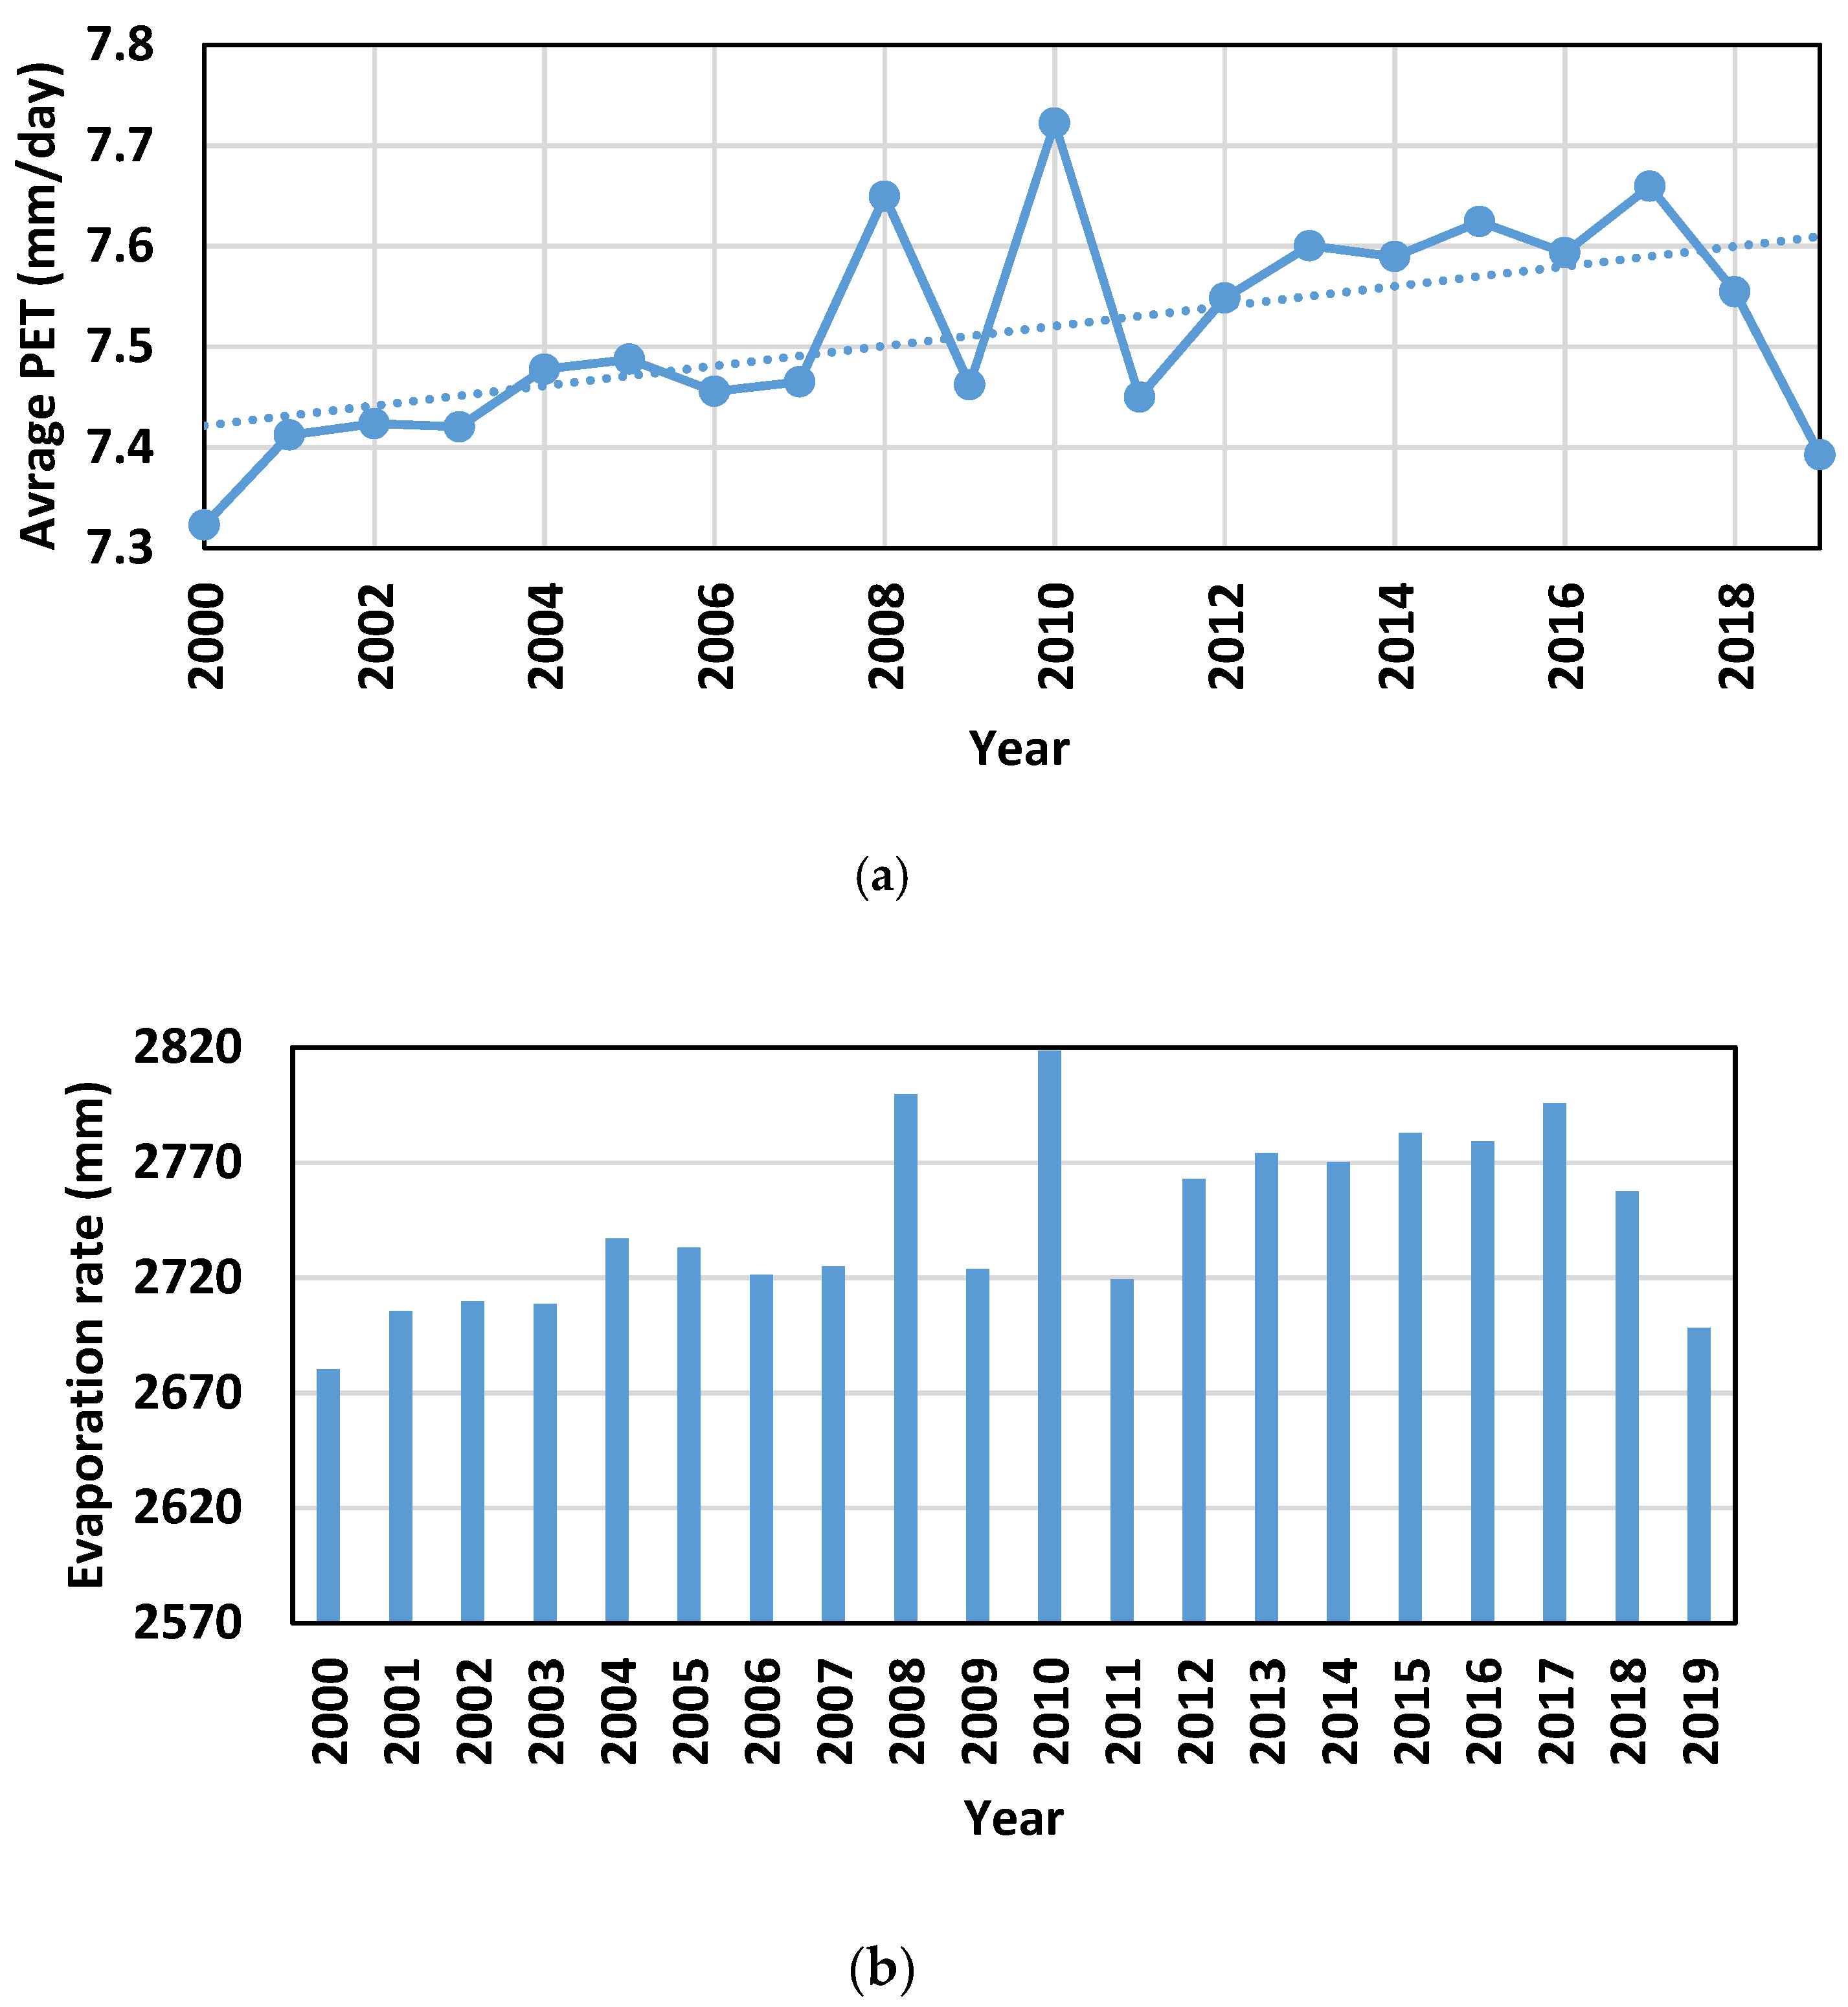
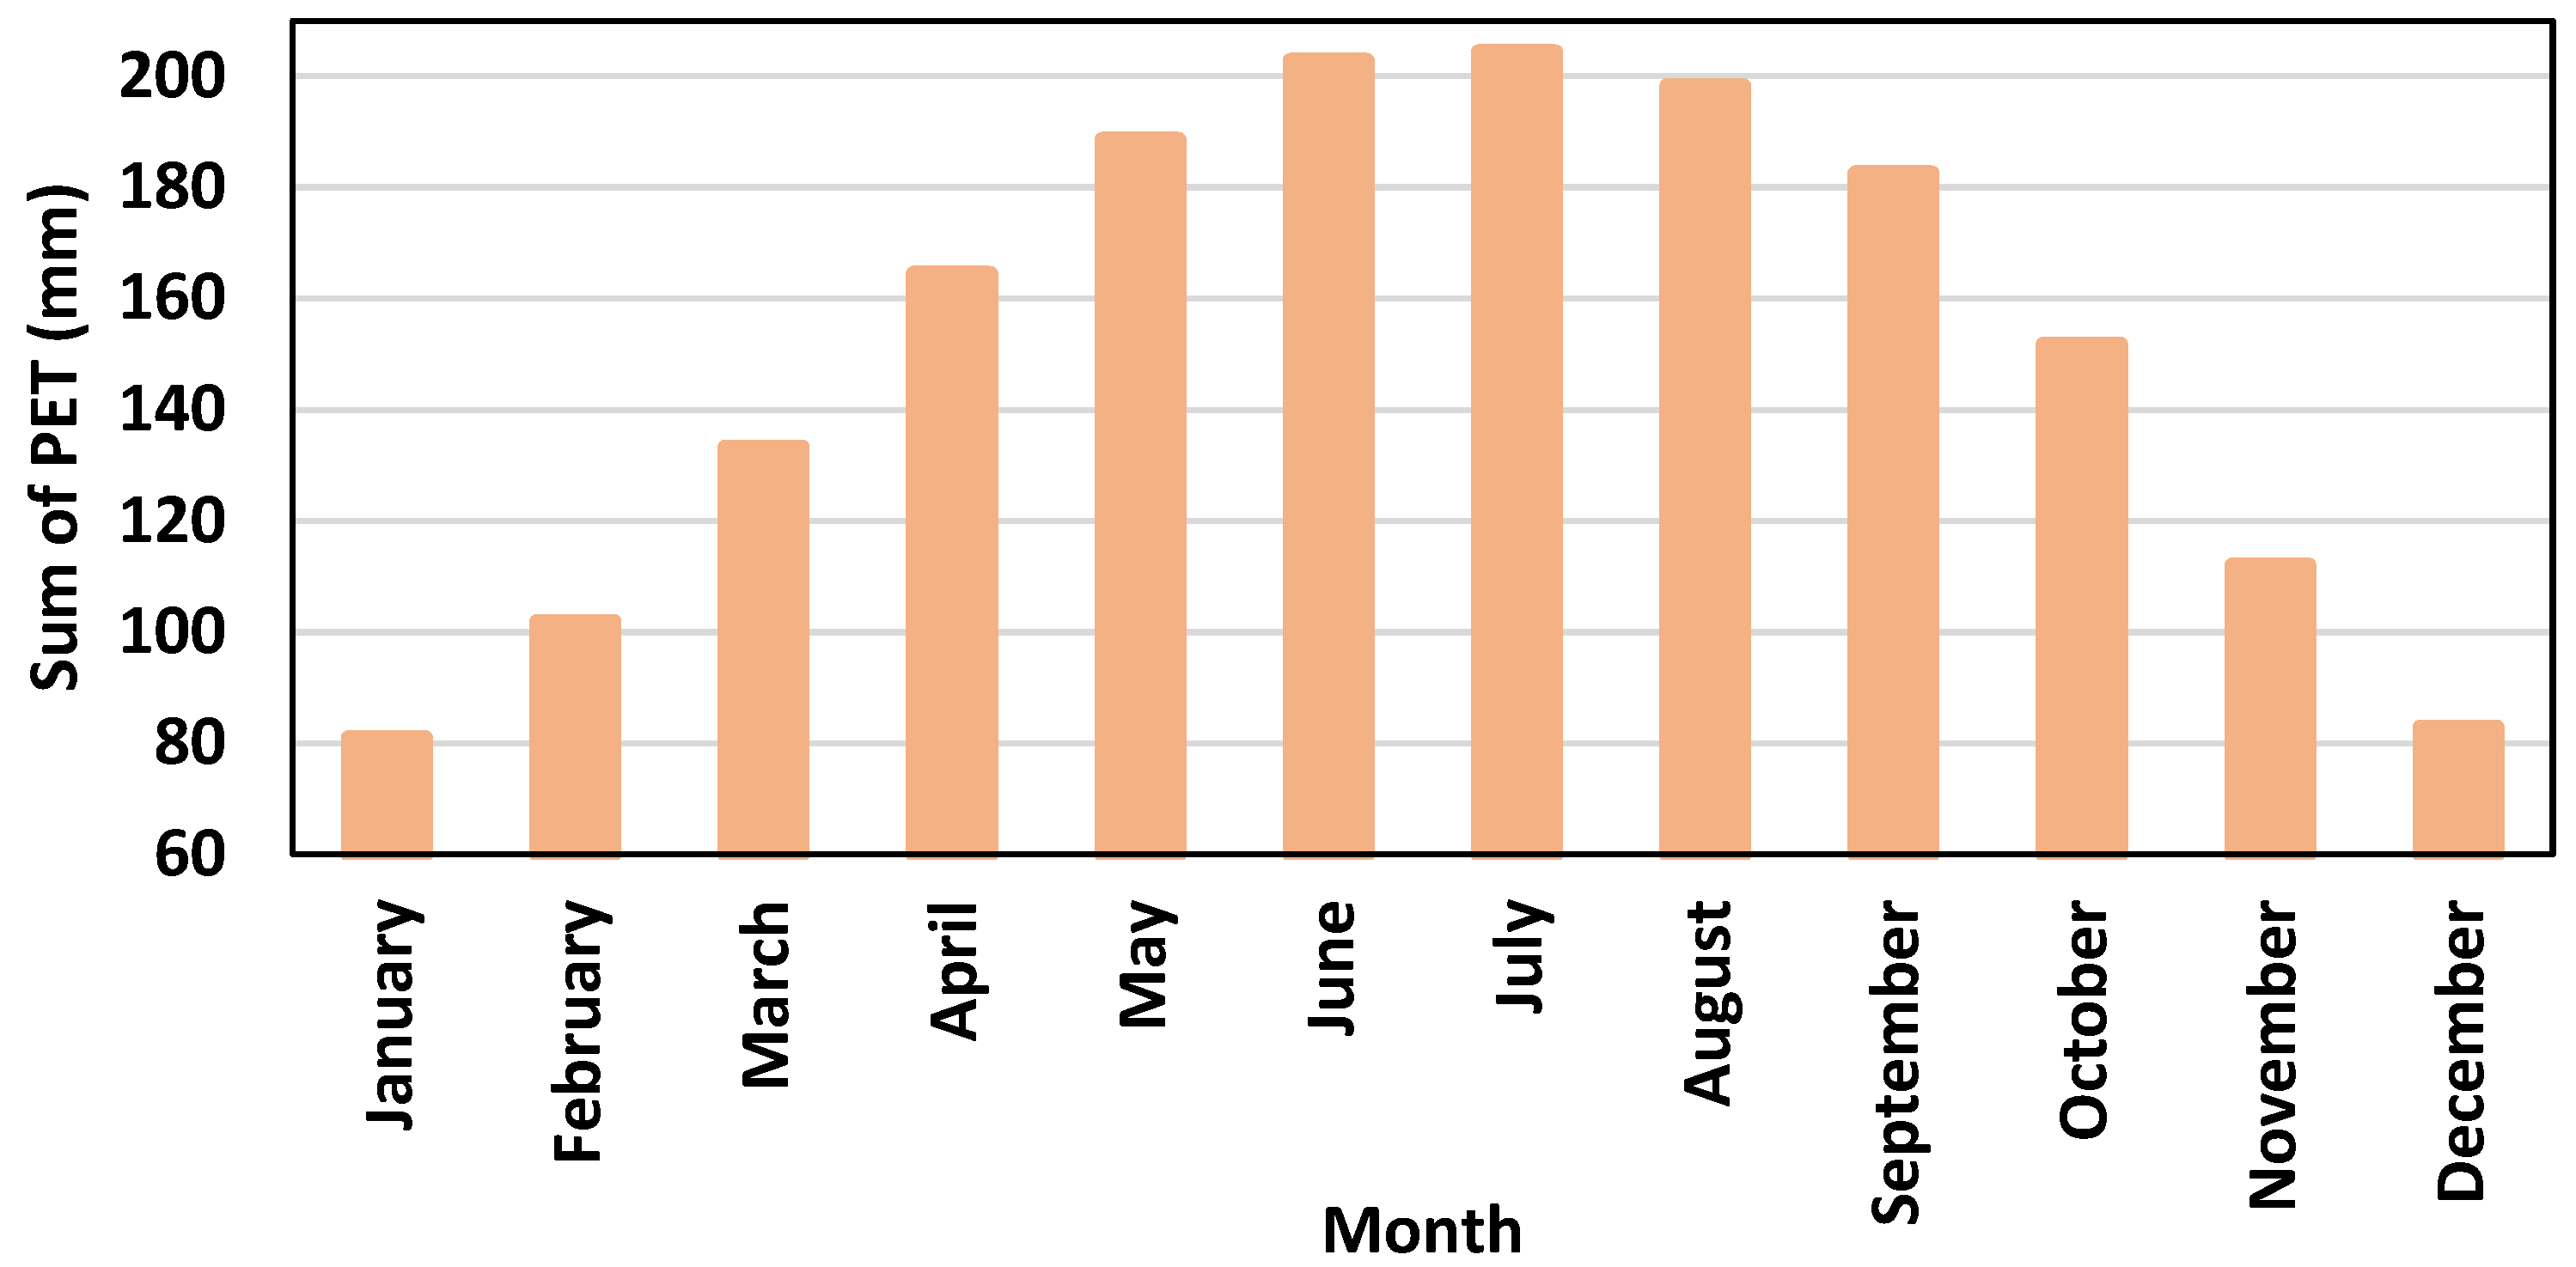
3. Need for Reducing Evaporation Rate

Egypt is situated in the north-eastern part of Africa that experiences hot desert climatic conditions all year round. The daytime temperatures in the geographical location are extremely hot, with temperature levels greater than 45 °C, and the annual average sunshine hours is more than 3500 h. With very good irradiation levels, Egypt experiences a high number of patent evolutions in the energy generation, transmission and distribution sector, in which solar PV technology from the renewable energy sources play a major role [7,8]. Additionally, these high radiation levels increase the rate of evaporation, which leads to water scarcity conditions.
The entire population of Egypt depends on the Nile River as the major water source to satisfy the irrigation, domestic and industrial water needs. A significant number of dams and canals were constructed in the early 1950s to preserve and consume the water during dry summer seasons. As mentioned above, this clear, bright and sunny year-round season elevates the evaporation rate of open water storage surfaces. Thus, an increase in evaporation rate increases the water loss, and the purpose of the water storage system is affected. Additionally, the drift in the water head level of the reservoir affects the continuous power generation through hydroelectric power plants. Various covering systems are practiced, reducing the impacts of radiation and temperature on a reservoir with a large surface area. Floating PV panels are an effective covering system in mitigating the evaporation rate while generating power. Additionally, with high radiation and sunlight hours of the region, the conventional PV system experiences issues of overheating of the panels by the formation of hotspots which experience the over proportional heating of solar cells in comparison with other cells of the module. These issues are eliminated by the water evaporative cooling of panels by placing PV panels on the water surface; thus, the generated power is more highly efficient than the rooftop and ground-mounted PV systems. Further, the FPV system with an equivalent capacity of the hydroelectric power plant has the potential to provide intermittent operation, ensuring a continuous power supply.

Potential Evapotranspiration Estimation

Initially, in order to calculate the amount of water saved by the FPV as it covers surface, it is necessary to estimate the annual water loss (liters/year) through potential evapotranspiration (PET) from the reservoir [30]. Many conventional methodologies are in practice to estimate the PET at different times of year based on the geographical conditions of the location [30]. The calculation needs the data of radiation with duration, temperature (surface, air, wet-bulb and dew point), wind velocity, latitude, and latent heat of vaporization, humidity, pressure and albedo over a period of time. Evaporation estimation techniques are mainly categorized into pan evaporation, the water budget method, the mass transfer method, and the water and energy balance method [30,33].
The Penman–Monteith method of estimating the evaporation rate is the most commonly used methodology, as it is highly recommended for its accuracy. The calculation needs the daily meteorological data of temperature, relative humidity, wind speed and irradiation incident on the horizontal surface with the geographical information including latitude and altitude above the sea level of the particular location. This meteorological data for Aswan High Dam and Aswan Reservoir for the period of 10 years (2010–2019) were obtained from the NASA website to calculate the annual water loss through PET [18].
These two dams also have a specific installed capacity and currently operate as the source of hydroelectric power projects. Since water is the direct source of power generation in HEPP, the rate of evaporation directly affects the power production, which is the major reason for selecting these dams for the location of the FPV system to balance the water–energy nexus. The evaporation rate is calculated using the Penman method by Equation (1) [33].
ET o = 0.408   Δ   ( R n G ) +   γ   900 T + 273   u 2   ( e s   e a ) Δ +   γ ( 1 + 0.34 ) u 2 ( mm   day 1 )
where E T o is the reference evapotranspiration ( mm   day 1 ) , Δ is the slope of the vapor pressure curve ( kPa   ° C 1 ) , u 2 is the wind speed at 2-m height ( ms 1 ) , R n is the net radiation ( MJ   m 2 day 1 ) . G is the soil heat flux density ( MJ   m 2 day 1 ) , e s is the saturation vapor pressure ( kPa ) , e a is the actual pressure ( kPa ) , γ is the psychometric constant ( kPa ° C 1 ) and T is the mean daily air temperature at 2 m height ( ° C ) .
From the calculated results, Figure 2 shows the sum of the monthly potential evaporation rate (mm), which is calculated from 2000 to 2019, that has a higher level of PET half of the year, with July being the peak [34]. Additionally, from the trend line of Figure 3a, it is observed that the cumulative rate of PET is increasing every year and Figure 3b shows the annual water loss of the reservoir through evaporation. This gives a major concern in regard to mitigating the loss of available freshwater resources through evaporation. Over the selected period, Figure 4 shows the month-wise sum of PET values. In the months of June and July, the water loss through evaporation is higher than others, with values reaching more than 200 mm.

4. Electrical Performance of FPV System in Egyptian Reservoirs
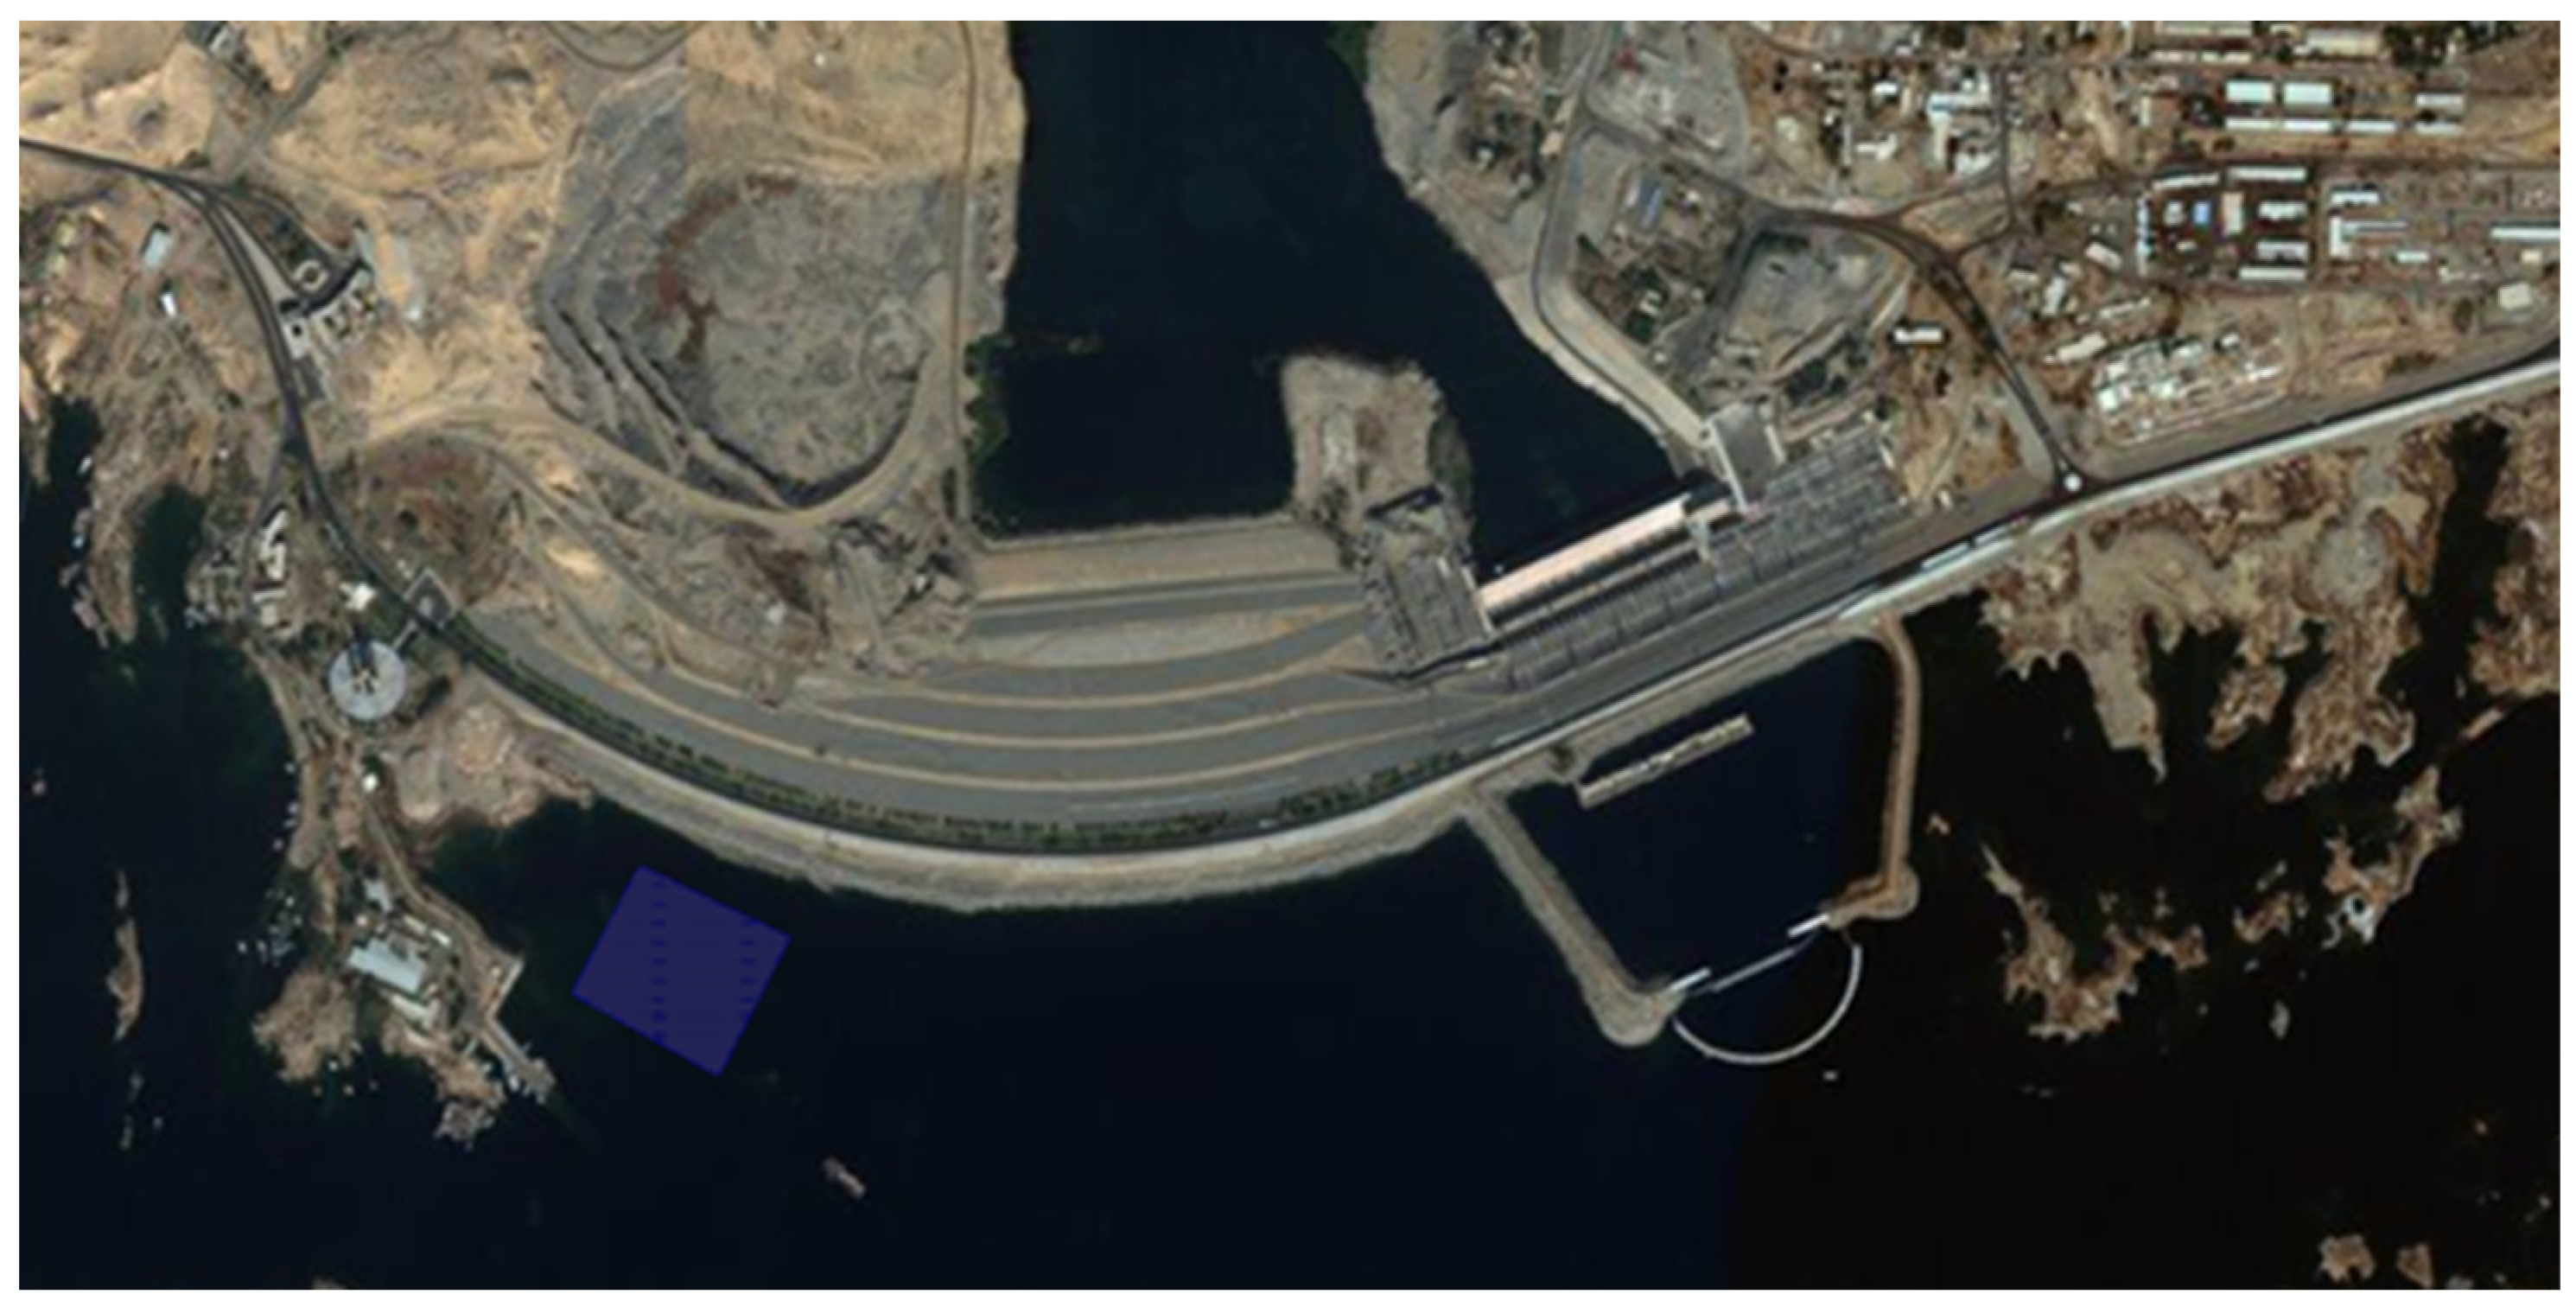
High Dam construction work was started in 1960, finished in 1971 and the operational head storage was reached 1976, and was the world’s largest dam at that time. The dam has 12 generating units with equal capacities; the total capacity of the power plant is 2.10 GW, and it was built to ensure water supply during dry seasons, as stated by its engineer. Its secondary and tertiary goals were to increase power production in Egypt and with it, drive industrialization. Now, it represents 5–6% of the total generated electricity of Egypt. Aswan Reservoir was built at the beginning of the 20th century and now it has a full capacity of 0.55 GW; it was built to feed the Aswan governorate with electricity before Egypt established a national power system [4,7].
The electrical performance of the floating photovoltaic system (FPV) is analyzed on the water surface of Aswan High Dam and Aswan Reservoir using monocrystalline, polycrystalline and thin film type PV panels. The model, type, dimensions, standard test conditions (STCs) nominal operating cell temperature (NOCT), and electrical performance of these PV panels used in the study is presented in Appendix A. Further, the floating platform is simulated in two different orientation and tracking mechanisms. To avoid variation in the electrical output of the system, the power output capacities of the three types of PV panels are selected in the same range. For all these analyses, the area covered by the FPV is kept constant in Aswan High Dam, while in Aswan Reservoir, the installed capacity is considered as constant. The floating platform for the present study is assumed to be a pontoon based on the dimension mentioned in the previous experiments [33]. Each pontoon occupies a pair of PV panels tilted at an angle of 25 degrees and placed at a distance of 0.15 m apart from each other. The pontoons are interconnected in a way to form the FPV array, providing 0.50 m distance between each row in an FPV array to provide catwalks. These catwalks are necessary for maintenance and the water evaporative cooling of the PV panels. The edges of the complete floating desk are coupled to the anchors, which are either placed on the embankment of the reservoir or in the bottom of the water in the form of concrete blocks surface through mooring lines [27,29]. Previous studies have focused in detail on this developing solar technology [27,33,34,35]. The present study will focus more on hybrid power production and its associated environmental and economic benefits.

5. High Dam

The reservoir area of Aswan High Dam receives an average annual global horizontal irradiance (GHI) of 2301.50 kWh/m2, and the plane of array (POA) irradiance differs according to the type of panel used. Figure 5 shows the FPV location on the Aswan High Dam that is decided based on the ease of grid connection and undulated water surface for effective mooring. In this study, 50,000 m2 of the total reservoir area is covered by the floating platform to install PV panels. The experiment to analyze the variation in the power generation capacity for portrait and landscape orientation in the presence and absence of a tracking mechanism is conducted and listed in Table 1 and Table 2.

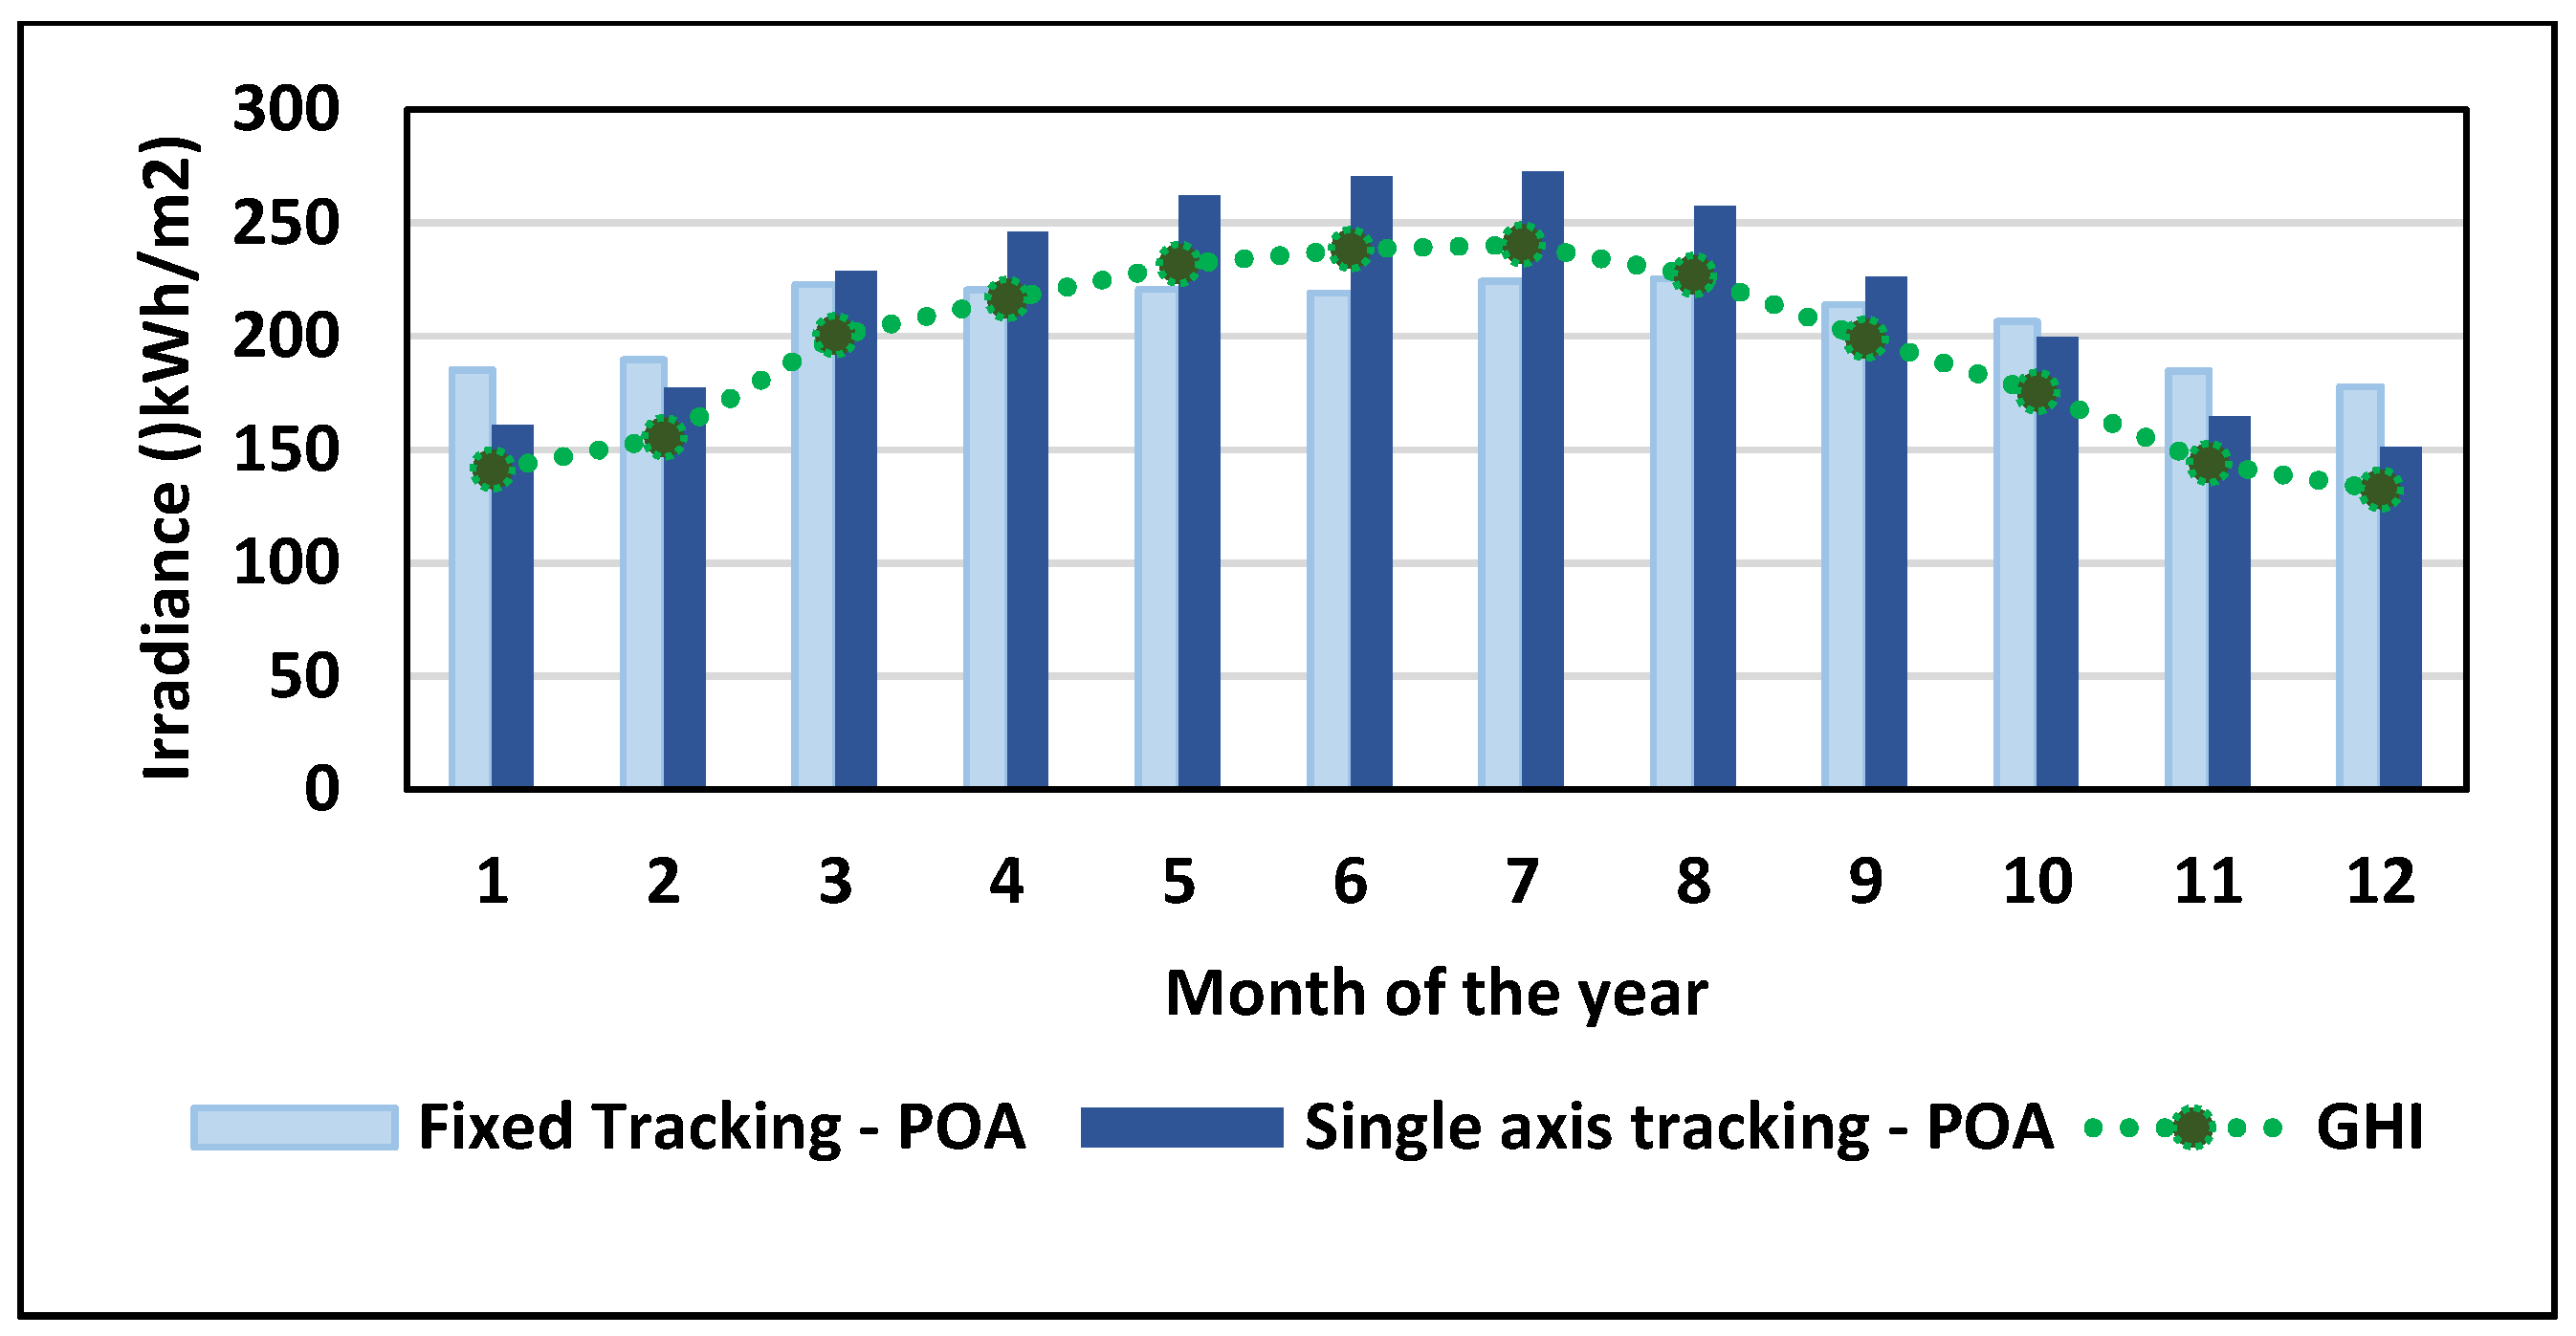
5.1. FPV with Fixed Tracking System

For a fixed type tracking system, the tilt angle (β) of the PV panel is analyzed from 0 to 89 degrees and it is found that the maximum plane of array (POA) irradiation is obtained at an angle of 25 degrees. At this angle, the obtained POA irradiance is 2491.11 kWh/m2 for crystalline type PV panels, and 2494.91 kWh/m2 for thin film PV panels.

5.1.1. Crystalline PV Panels

By covering the water surface area of 50,000 m2 with 21,602 polycrystalline modules in portrait orientation, results from the installed capacity are obtained as 5.18 MW with an annual yield of 9.72 GWh. Compared to portrait orientation, placing the PV panels in landscape orientation in the same area results in a decrease in the installed capacity and the energy yield of the FPV system by 9.05% and 4.14%, respectively, with a decrease in the number of modules and inverter requirement. For the given nameplate DC capacity, the performance of the FPV system is predicted by the performance ratio ( P R ), which is calculated using Equation (2) [16].
P R = E G   P O U T × I P O A I S T C
where, E G represents the total energy supplied to the grid (kWh), P O U T is the total power output from the FPV system (kW), I P O A is the plane of array irradiance (kW/m2), and I S T C is the irradiance at standard test conditions ( I S T C = 1000 W/m2).
Similarly, the specific yield capacity is the ratio of the amount of energy generated to the nameplate DC capacity of the FPV system. These two values are found to be lower in the portrait orientation than the landscape-oriented panels. Meanwhile, using monocrystalline modules the nameplate DC capacity is obtained as 4.75 MW with 20,872 panels while placing them vertically and 19,812 panels in the horizontal direction. The total FPV system yields 9.08 GWh per year and 8.72 GWh per year in the vertical and horizontal direction, respectively. The energy yield, PR and specific yield of the system using monocrystalline panels is lesser than polycrystalline panels.

5.1.2. Thin Film PV Panel

The electrical and mechanical properties of the thin film solar structure are different from the mono- and poly-crystalline solar modules [33]. This change in properties is reflected in its performance while placing it on the reservoirs in the present study. The POA irradiance of the FPV array consisting of thin film solar cells is 2494.9 kW/m2. In vertically oriented thin film cells, the installed capacity of the entire array is 22% and 29% higher than poly and mono crystalline panels, respectively. Similarly, compared to their counterparts, the energy yield is increased by 22 and 34%. Eventually, the performance ratio and the specific yield capacity of the system with thin film PV modules experience a higher rise than the crystalline panels in both orientations.

5.2. FPV with Single Axis Tracking System

Single- and dual-axis tracking systems are used to maximize the power output by focusing the PV panel normally to the direction of the irradiation in its availability. The dual-axis type of tracking system is slightly difficult to implement in FPV systems, which is still under analysis. In this study, single-axis tracking or east–west tracking of the FPV system is analyzed for crystalline and thin film type of PV panels placed horizontally and vertically. In the fixed tracking system, the modules are south-oriented, while in single axis tracking system the azimuth angle of the modules is changed to feasibly rotate the panels east to west. This change in the position of the PV panels decreases the number of panels occupied in the area and eventually, the installed capacity of the system. However, with the decreased installed capacity, it is observed that the output of the system in all six cases is considerably increased while implementing the tracking mechanism. Figure 6 shows the comparison POA irradiance level on the system with and without the tracking mechanism with reference to the global horizontal irradiation (GHI) levels in the reservoir. The irradiance levels are the data obtained from the polycrystalline module placed in portrait orientation.

5.3. Losses and Irradiation Utilization Factor
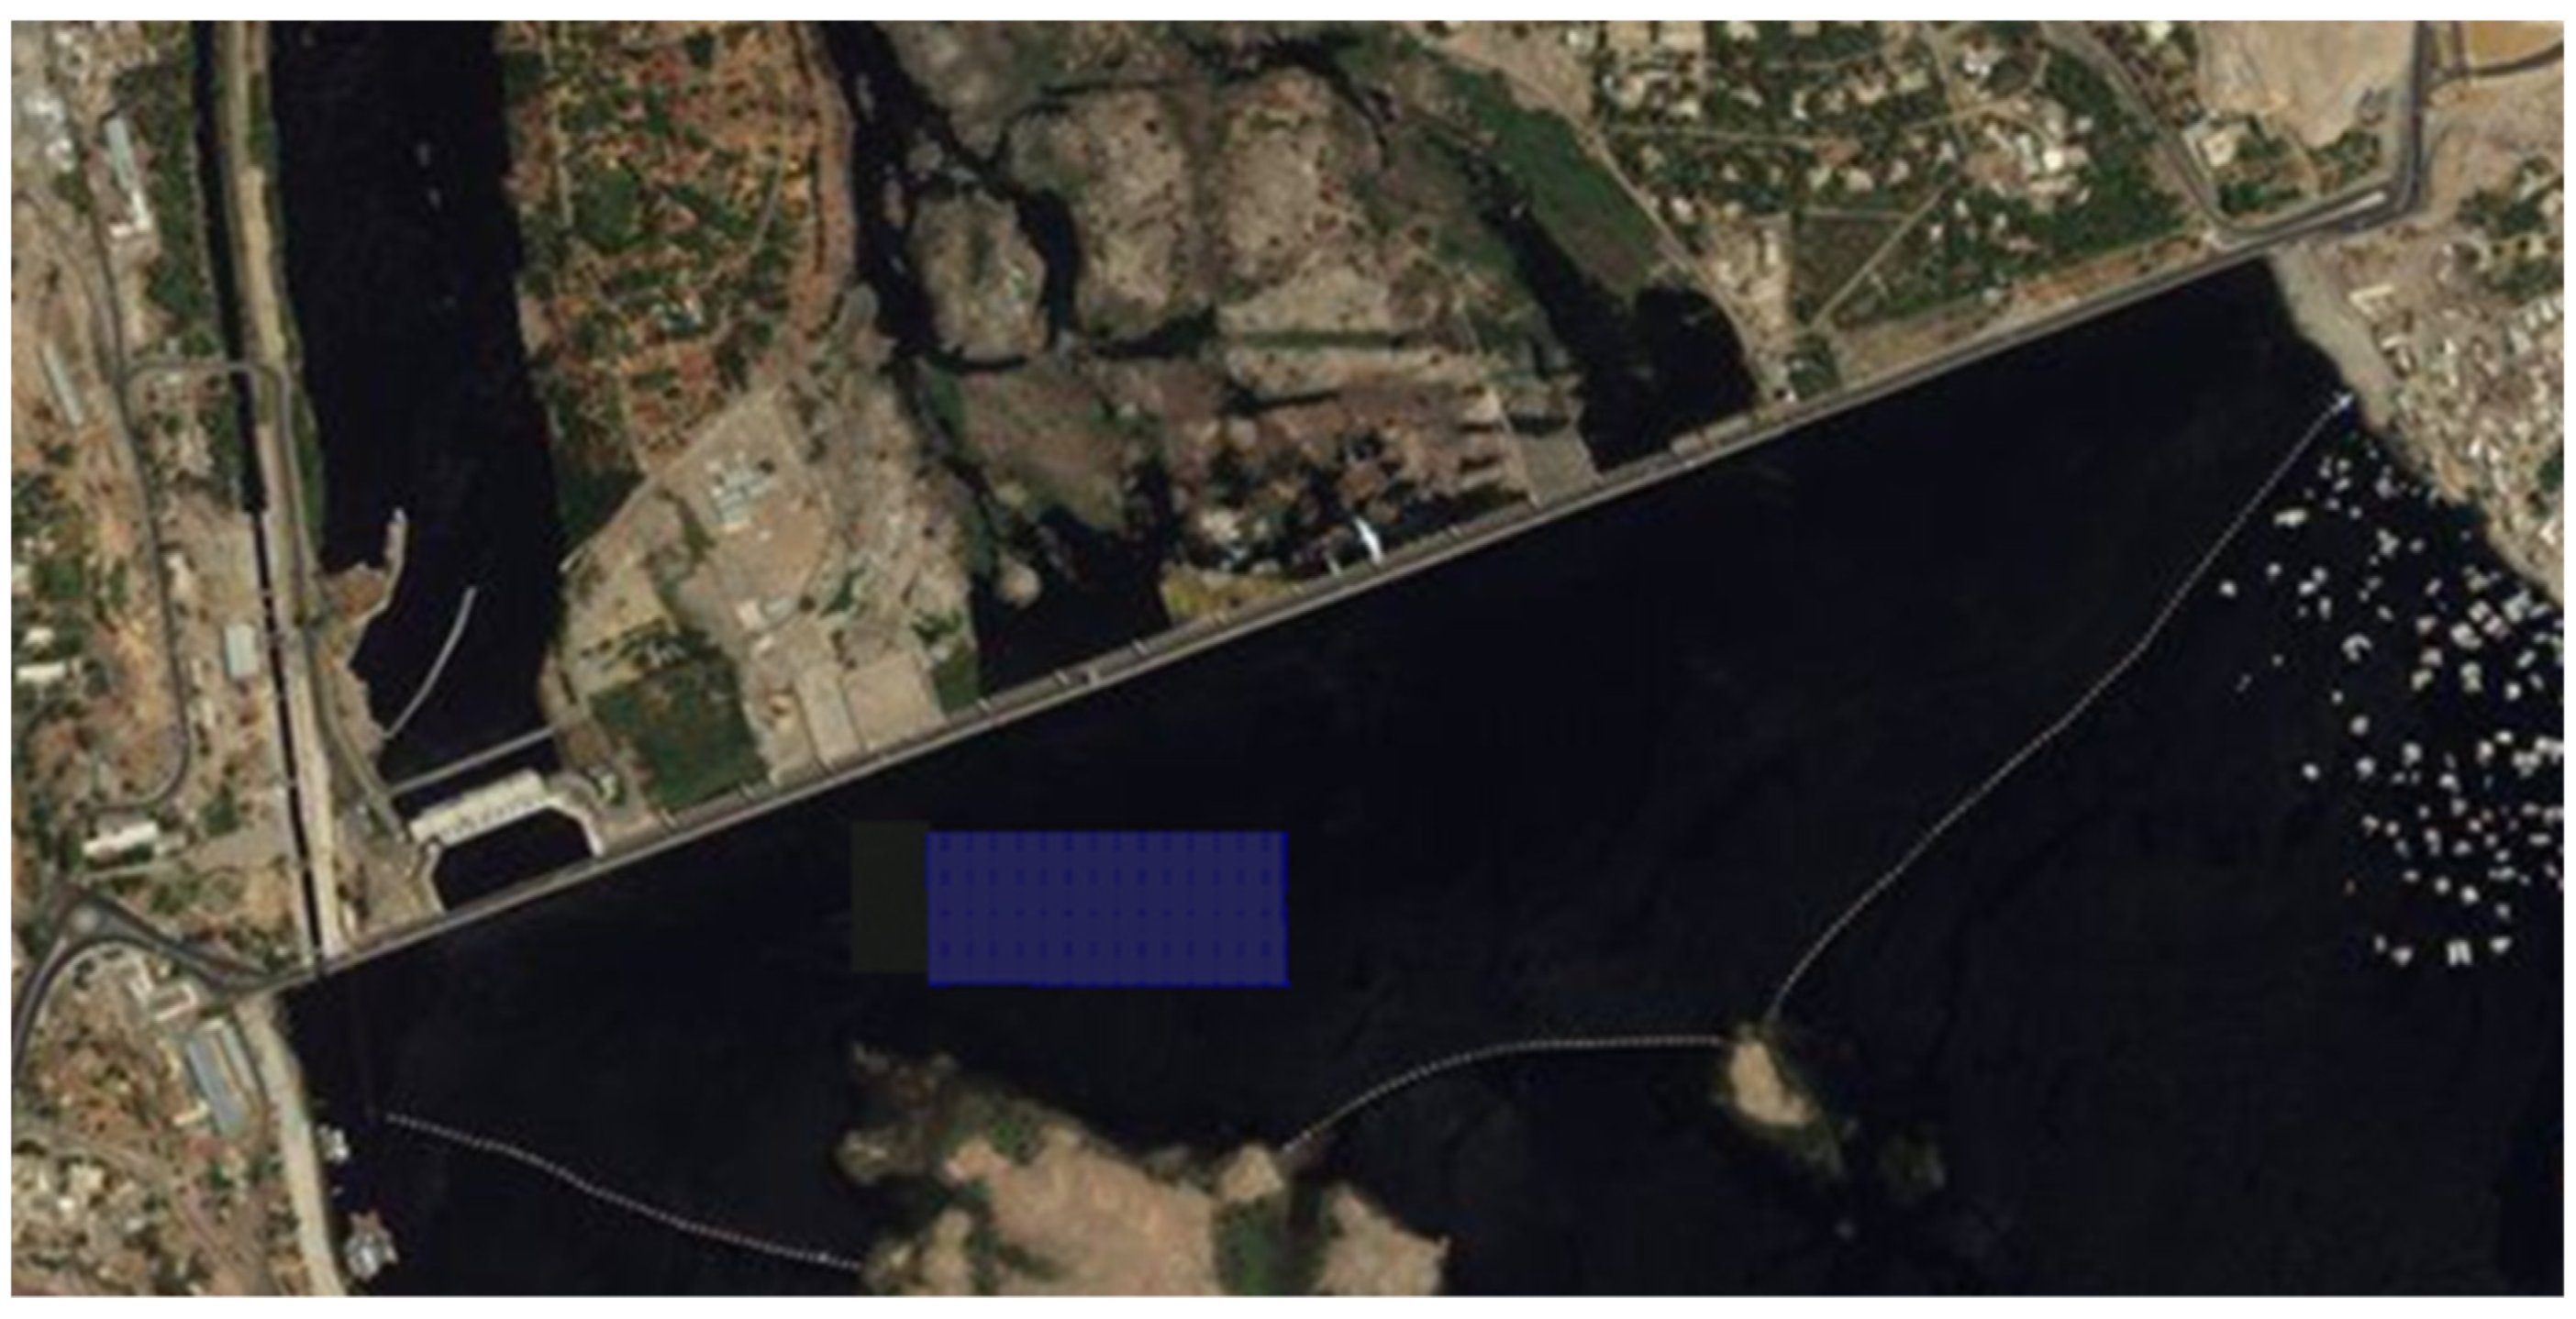
Reducing losses in the PV system is a significant challenge to address. In the FPV system, the soiling losses due to dust particles ranges from 1% to 3%, while in the land-based PV system it is 2% to 5%. Additionally, the optimum temperature of the PV panel is maintained by the automatic water evaporative cooling mechanism, while a land-based PV system requires separate water or air-based cooling systems. In the present study, with both types of orientation as listed in Table 3, the temperature loss is less slightly lesser in polycrystalline PV modules.
Eventually, shading losses due to near shading objects, including trees and buildings, and far shading objects including mountains and embankment of the reservoir can highly impact the total DC output of the PV system. In the present study, it is found to be higher in the portrait mode of panel arrangement than in the landscape condition. The increase in the shading losses of about 34% while placing the PV panels vertically is mainly due to shades from the top end of front row panels on the bottom edges of the subsequent row of panels. This increase in the shading loss is the key reason for the reduction in the tilt orientation factor (TOF) and solar access factor (SAF) [35].

6. Aswan Reservoir

A similar but slightly different numerical analysis of the floating PV system is performed on covering Aswan Reservoir. Figure 7 shows the FPV location on Aswan Reservoir that is decided based on the ease of grid connection and undulated water surface for effective mooring. In this study, the system set to have equal DC power capacity in portrait as well as landscape orientation with the percentage of area covering the total reservoir varied eventually. The electrical performance of the FPV system on Aswan Reservoir of 5 MW installed capacity with various orientations and tracking mechanism is simulated, and the results are listed in Table 4 and Table 5. The annual GHI of Aswan Reservoir is the same as Aswan High Dam, while varied POA irradiance, annual energy generated from the installed FPV capacity with their PR and specific yield is listed. For a fixed FPV system, the optimal tilt angle of the module is kept as 25°, with the floating platform design similar to the aforementioned study.
In all types of PV panels, the area required to install the PV modules in landscape orientation is higher than the portrait orientation. The reservoir area covered by the FPV system results minimum in portrait orientated thin film PV modules and maximum in landscape-oriented mono-crystalline modules. However, with the equivalent number of modules in both orientation type, the annual energy generated from the horizontally oriented crystalline array results higher. This higher energy yield from the FPV system in landscape orientation irrespective of their panel type is mainly due to the reduced shading losses (See Table 6). The amount of water saved per year by the FPV covering system is calculated by the actual annual evaporation rate when the reservoir is uncovered. The volume of water prevented from evaporation varies with respect to the area covered in each type of FPV system, as given in Table 5. The inverter nameplate is selected by keeping the constant DC to AC ratio as 1.24 and the total number of inverters required, and their associated losses are calculated. The major losses in the FPV system affecting the energy generated are irradiance, shading and temperature loss. Shading losses in the PV modules are comparatively high in the fixed mount tracking system in comparison to the single axis tracking system. The position of the floating platform is fixed on the reservoir with zero or fewer impacts of short and long-distance shadows such as hills, trees, and dam walls. However, the shading losses due to the adjacent panels even at optimum tilt angle are unavoidable. In contrast, the temperature losses in the system with a tracking mechanism experiences higher levels than the system without a tracking mechanism. The continuous exposure to the irradiation from the sunlight in order to enhance the energy yield results in an increase in the operating temperature of the PV cell and the module. However, the water evaporative cooling of the FPV modules boosts the energy generated from the system.

7. Proposed System Analysis

7.1. Cost Analysis

In the past ten years, solar PV technology experienced a tremendous decrease in the levelized cost of energy (LCOE) every year which in turn increases its total installed capacity as well as the employment technology globally [36]. The cost breakup of the FPV system (see Table 7) is similar to the conventional PV system, with the additional cost requirement of complete transportation and installation of a floating structure which includes pontoons, mooring cables, anchors, screws and tensors.
In the year 2019, the global weighted average LCOE and the total installation cost of solar photovoltaic technology was 0.068 USD/kWh and 995 USD/kW, respectively, which is 13.1% and 17.6% lower compared to its value in the previous year [36]. This fall in the average LCOE as well as in the installation cost is experienced every year due to the newly commissioned utility-scale renewable energy power of solar PV technology. The capacity factor of the solar PV system is defined as the weighted average capacity factor (CF) of the solar PV system, which gained a step ahead every year: it was 18% in the year 2019, which is 23.3% higher in the last ten years range [36].

7.2. Carbon Dioxide Analysis

The prime consideration in switching to renewables from fossil fuel is to reduce carbon emission. From 1970 to 2017, Egypt experienced 422 Mt of CO2 emission, which is a 72.95% increase, mainly through coal and oil. In Egypt, the replaced renewable energy generation system avoided 7.14 million tons of CO2 emission, particularly through hydro and solar technology [36].
To assess the environmental benefits of the FPV system, the equivalent carbon dioxide emissions involved directly and indirectly in the manufacturing, installation and delivery of the entire FPV system is analyzed first. As per the report of climate transparency in the year 2018 on the country-specific electricity factors, the CO2 emission per kWh of generated power in Africa was 0.9609 kg. Thus, the CO2 emission avoided for power generating capacity of the present study is calculated and listed in Table 8. The CO2 savings from the solar energy production from the FPV fixed mount system and FPV system with single-axis tracking in portrait orientation in all three types of PV panels are calculated for a service life of 20 years, considering the specific carbon emission rate to be 0.9609 kg CO2/kWh for Aswan High Dam and Aswan Reservoir with HEPP of 2.1 GW cumulative power generation capacity.
As the FPV system also has the added advantage of the reduction in water loss through evaporation, the reduction in carbon emission due to evaporation mitigation is also calculated, and the results are listed in Table 8. Besides this, the potential net/loss CO2 by reducing the water evaporation must also be taken into account. The specific energy (kWh/m3) is a potential energy use indicator of the embodied energy associated with water provision and storage in the irrigation reservoir and it is expressed as a ratio of energy consumption to water volume supplied [37]. The average value of specific electricity capacity (SEC) varies for different water sources [38], for the recycled water stored in the reservoir closer to the field location is an average of 0.5 kWh/m3 [38]. Therefore, the energy saving from the reduction in water evaporation is straightforwardly calculated for the lifetime of the project. The amount of water saved by covering Aswan High Dam and Aswan Reservoir is 42,731.56 m3/year. The energy saving from the reduction in water evaporation over the lifetime of 20 years is 427315.6 kWh, with a reduction of 410.61 t CO2. Taking this into account, the total potential CO2 saving by the FPV systems with tracking are estimated as 44,270.61 t CO2 and it is 11.70% higher than the fixed mount FPV system.

7.3. Water–Energy Nexus Analysis

The water–energy nexus regulation is the notorious advantage of FPV, i.e., mitigating the potential water loss through evaporation while generating highly efficient power from the renewable energy source. This saved water without being lost from evaporation can be effectively used for the purpose of hydroelectric generation, irrigation or drinking. By directing the amount of water saved from evaporation for hydropower generation, the FPV covering system acts as a virtual battery and increases the energy yield from the hydro plants of the installed reservoir [18,30,33]. Thus, the cumulative renewable energy generation of the nation increases.
The installed hydropower generation capacity of the Aswan High Dam is 2100 MW, which produces 10,042 GWh annually. In the present study, by covering the 0.5 km2 area of Aswan High Dam water surface, the annual water saving is about 137,252.86 m3, i.e., 0.1 million cubic meter (MCM) that increases by 63.56 MWh of hydropower production per year. Similarly, Aswan Reservoir has an installed hydropower plant of 592 MW capacity, and the average water saving by the FPV system increases by 21.76 MWh of hydropower annually.

8. Discussion on the Limitations of the Study

The present study analyzes the performance of the FPV system in reducing evaporation and hybrid power generation upon implementation in the HEPP reservoir. Being the first-ever study to analyze the FPV system in Egypt, the installed capacity of the system is limited to 5 MW to make it feasible for large scale analysis and real-time implementation. FPV projects covering entire reservoir areas in Agost, Spain and Silver Lake, USA results in a reduction in evaporation rate by 75% and 90%, respectively [21,39]. However, it is not advisable to cover the entire reservoir to completely eliminate the evaporation rate [40]. This is because the complete shading of the water surface with an FPV covering system affects the water quality and biodiversity [10,23,40]. As a trade-off, considering the water–energy demand, it is advisable to cover less than 40% of the entire surface of the water body [40]. In the present analysis, an average of 5000 m2 is required for installing an FPV system of 5 MW capacity. In such a case, covering 4% of the HD reservoir area of (5250 km2) by an FPV system tends to have an equal capacity as the hydroelectric power plant of 2.1 GW and it is possible to provide intermittent operation.
In the present study, the position of the FPV system is considered based on eliminating near and far shadows and area, which tends not to have the complete dry condition. However, proper mooring analysis on the water depth and soil type is essential to ensure the stability of the system. The FPV structure of the present study is considered as a single large structure and the cost of the mooring and anchoring system is calculated accordingly; however, for operational safety and maintenance, the existing system is divided into small capacities. The system is analyzed only for a single-axis tracking mechanism to obtain a high energy yield. This is because dual-axis tracking on an FPV system is still challenging to implement due to the continuous action of mild waves [10]. Besides focusing the PV panel toward a high irradiation point, the tracking mechanism has to endure the persistent disturbances of the floating from the action of waves. In both sensor-based and astronomically calculated tracking types, inappropriate controller designs fail to find the brightest spot in the sky. This hunting condition of the tracking device extracts more power from the motor. Considering this condition, the single-axis tracking mechanism is cost effective and efficient for the floating PV system [41].
The power generation capacity and environmental benefits such as carbon footprint and evaporation mitigation are analyzed and implemented worldwide. The progress of the present study is to mainly focus on the panel interconnection topologies and multilevel inverter connection. Being in the initial stage of development, research on the FPV system related to standards of the structural components used and their impacts on the water quality on large scale implementation is needed. Besides lakes, reservoirs and hydropower plants, the future of the FPV is on the offshore platform [27,28,42]. Thin film PV modules are the growing technology that is suitable for potential FPV implementation in marine regions. However, the harsh marine environment is still slowing down the offshore FPV implementation and experimental studies [10,28].

9. Conclusions

The paper shows the possibilities of establishing FPV in Egyptian dams in terms of High Dam and Aswan Reservoir. The study shows that installing FPV will lead to an increase in the power generation of the hybrid hydro PV system to an annual increase of up to 11.9 GWh for High Dam and 11.3 GWh for Aswan Reservoir. The hybrid system will lead to water saving by 0.1 MCM for both dams. Three alternatives are presented to select the type of the FPV in terms of mono-crystalline, polycrystalline, and thin film; the results show that polycrystalline is the best solution in Egypt for FPV. The study also proposed two different scenarios to mount FPV in terms of fixed mounting and single-axis tracking and the results show that single-axis tracking achieved a higher energy rate by 4.96%. Using FPV and a hydro hybrid system achieved carbon dioxide reduction by 44,270.61 tons.

Author Contributions

Conceptualization, H.H.F. and N.R.; methodology, H.H.F.; validation, N.R., H.H.F. and E.R.; formal analysis, N.R.; investigation, H.H.F.; resources, H.H.F.; data curation, N.R.; writing—original draft preparation, H.H.F.; writing—review and editing, H.H.F. and E.R.; visualization, N.R.; supervision, E.R.; project administration, H.H.F.; funding acquisition, E.R. All authors have read and agreed to the published version of the manuscript.

Funding

This work was carried out in the framework of the research project DREAM (Dynamics of the REsources and technological Advance in harvesting Marine renewable energy), supported by the Romanian Executive Agency for Higher Education, Research, Development and Innovation Funding—UEFISCDI, grant number PN-III-P4-ID-PCE-2020–0008.

Institutional Review Board Statement

Not the case this study does not involve humans or animals.

Informed Consent Statement

Not the case this study does not involve humans or animals.

Data Availability Statement

The data that support the findings of this study are available in NASA Prediction of Worldwide Energy Resource at https://power.larc.nasa.gov (accessed on 7 May 2021).

Conflicts of Interest

The authors declare no conflict of interest.

Nomenclature

ACAlternating current
ARAswan Reservoir
CFCapacity factor
DCDirect current
FPVFloating photovoltaic
HDHigh Dam
HEPPHydroelectric power plant
GERDGrand Ethiopian Renaissance Dam
GHIGlobal Horizontal Irradiance
LCOELevelized Cost of Energy
MCMMillion Cubic Meter
MtMetric Ton
NOCTNominal operating cell temperature
PETPotential Evapotranspiration
POAPlane of Array
PRPerformance ratio
PVphotovoltaic
RES Renewable Energy Sources
SAFsolar access factor
SECSpecific electricity consumption
STCStandard test conditions
TOFtilt orientation factor
βTilt angle

Appendix A. Electrical Specifications of PV Panels

Table A1. Panel types and description.
S.NoParametersPoly CrystallineMono CrystallineThin Film
1.ManufacturerCanadian SolarSolar WorldFirst Solar
2.Model NameCS6P-240PSW 235FS-6420 December 2017
3.Power output capacity (W)240235420
4.Dimensions (mm)1638 × 982 × 401001 × 1675 × 312009 × 1232 × 49
5.Weight (kg)2021.236
6.Temperature coefficient at maximum power (/°C)−0.43−0.45−0.35
7.Temperature coefficient open circuit voltage (/°C)−0.34−0.33−0.28
8.Temperature coefficient short circuit voltage (/°C)+0.065+0.042+0.04
9.Operating temperature (°C)−40 to +85−40 to +90−40 to +85
10.Module efficiency (%)14.6113.1217
11.Power tolerance (W)±5±3±5
12.Standard Test Conditions (STC)—Irradiance of 1000 W/m2, Temperature 25 °C & air mass AM1.5
13.peak power of PV module (W)240235420
14.maximum power voltage (V)29.930.3180.4
15.maximum power current (A)8.037.772.33
16.open circuit voltage (V)3737.5218.5
17.short circuit current (A)8.538.192.54
18.Nominal operating cell temperature (NOCT)—Irradiance of 800 W/m2 and ambient temperature of 20 °C
19.Peak power of PV module (W)170170.9317.2
20.Voltage at maximum power (V)27.027.5168.7
21.Current at maximum power (A)6.186.221.88
22.open circuit voltage (V)33.834.0206.3
23.Short circuit current (A)6.766.62.04

References

  1. Global Energy Review in 2020. Available online: https://www.iea.org/reports/global-energy-review-2020/renewables (accessed on 14 April 2021).
  2. United Nations. The Impact of Renewable Energy Technologies on Global Energy Efficiency. Available online: https://www.un.org/en/chronicle/article/impact-renewable-energy-technologies-global-energy-efficiency (accessed on 14 April 2021).
  3. Hydropower Status Report. Available online: https://www.hydropower.org/resources/status-report (accessed on 14 April 2021).
  4. Fayek, H.H.; Abdalla, O.H. Maximization of Renewable Power Generation for Optimal Operation of the Egyptian Grid. In Proceedings of the 2020 IEEE 29th International Symposium on Industrial Electronics (ISIE), Delft, The Netherlands, 17–19 June 2020; pp. 1033–1038. Available online: https://ieeexplore.ieee.org/document/9152450 (accessed on 14 April 2021). [CrossRef]
  5. Abdalla, O.H.; Fayek, H.H.; Ghany, A.A. Steady-State and Transient Performances of the Egyptian Grid with Benban Photovoltaic Park. In Proceedings of the Cigre Egypt 2019 Conference, The Future of Electricity Grids—Challenges and Opportunities, Cairo, Egypt, 6–8 March 2019; p. 205. Available online: https://www.researchgate.net/publication/342420850_Steady-State_and_Transient_Performances_of_the_Egyptian_Grid_with_Benban_Photovoltaic_Park (accessed on 14 April 2021).
  6. Abdelhaleem, F.S.; Helal, E.Y. Impacts of Grand Ethiopian Renaissance Dam on Different Water Usages in Upper Egypt. Br. J. Appl. Sci. Technol. 2015, 8, 461–483. [Google Scholar] [CrossRef]
  7. Hamed, K.H. Stochastic Investigation of the GERD-AHD Interaction through First Impoundment and Beyond. In Grand Ethiopian Renaissance Dam Versus Aswan High Dam; Negm, A.M., Abdel-Fattah, S., Eds.; The Handbook of Environmental Chemistry; Springer International Publishing AG: Berlin/Heidelberg, Germany, 2018. [Google Scholar] [CrossRef]
  8. Assouline, S.; Narkis, K.; Or, D. Evaporation suppression from water reservoirs: Efficiency considerations of partial covers. Water Resour. Res. 2011, 47. [Google Scholar] [CrossRef]
  9. Wurbs, R.A.; Ayala, R.A. Reservoir evaporation in Texas, USA. J. Hydrol. 2014, 510, 1–9. [Google Scholar] [CrossRef]
  10. Acharya, M.; Devraj, S. Floating Solar Photovoltaic (FSPV): A Third Pillar to Solar PV Sector? TERI Discussion Paper: Output of the ETC India Project; The Energy and Resources Institute: New Delhi, India, 2019. [Google Scholar]
  11. Sahu, A.; Yadav, N.; Sudhakar, K. Floating photovoltaic power plant: A review. Renew. Sustain. Energy Rev. 2016, 66, 815–824. [Google Scholar] [CrossRef]
  12. Ranjbaran, P.; Yousefi, H.; Gharehpetian, G.; Astaraei, F.R. A review on floating photovoltaic (FPV) power generation units. Renew. Sustain. Energy Rev. 2019, 110, 332–347. [Google Scholar] [CrossRef]
  13. Sukarso, A.P.; Kim, K.N. Cooling Effect on the Floating Solar PV: Performance and Economic Analysis on the Case of West Java Province in Indonesia. Energies 2020, 13, 2126. [Google Scholar] [CrossRef]
  14. Farfan, J.; Breyer, C. Combining floating solar photovoltaic power plants and hydropower reservoirs: A virtual battery of great global potential. Energy Procedia 2018, 155, 403–411. [Google Scholar] [CrossRef]
  15. Liu, L.; Sun, Q.; Li, H.; Yin, H.; Ren, X.; Wennersten, R. Evaluating the benefits of integrating floating photovoltaic and pumped storage power system. Energy Convers. Manag. 2019, 194, 173–185. [Google Scholar] [CrossRef]
  16. Nazififard, M.; Taheri, S.M.; Nazififardarani, K. Novel Floating Photovoltaic Cover Systems Generating Electricity and Prevent Evaporative Losses for Agriculture Industry in Iran. In Proceedings of the 3rd International Conference of IEA, Tehran, Iran, 28 February 2017; pp. 1–5. [Google Scholar]
  17. Lee, N.; Grunwald, U.; Rosenlieb, E.; Mirletz, H.; Aznar, A.; Spencer, R.; Cox, S. Hybrid floating solar photo-voltaics-hydropower systems: Benefits and global assessment of technical potential. Renew. Energy 2020, 162, 1415–1427. [Google Scholar] [CrossRef]
  18. Nagananthini, R.; Nagavinothini, R. Investigation on floating photovoltaic covering system in rural Indian reservoir to minimize evaporation loss. Int. J. Sustain. Energy 2021, 1–25. [Google Scholar] [CrossRef]
  19. Rosa-Clot, M.; Tina, G.M. Integration of PV Floating with Hydroelectric Power Plants (HPPs). In Floating PV Plants; Academic Press: Cambridge, MA, USA, 2020; pp. 89–100. [Google Scholar]
  20. Cazzaniga, R.; Rosa-Clot, M.; Rosa-Clot, P.; Tina, G.M. Integration of PV floating with hydroelectric power plants. Heliyon 2019, 5, e01918. [Google Scholar] [CrossRef] [PubMed] [Green Version]
  21. Mckay, A. Floatovoltaics: Quantifying the Benefits of a Hydro fits of a Hydro of a Hydro ydro f PV floating with hydroel. Bachelor’s Theses, Pomona College, Claremont, CA, USA, 2013; p. 74. Available online: https://scholarship.claremont.edu/pomona_theses/74 (accessed on 14 April 2021).
  22. Lopes, M.P.C.; Neto, S.D.A.; Branco, D.A.C.; de Freitas, M.A.V.; Fidelis, N.D.S. Water-energy nexus: Floating photovoltaic systems promoting water security and energy generation in the semiarid region of Brazil. J. Clean. Prod. 2020, 273, 122010. [Google Scholar] [CrossRef]
  23. Gorjian, S.; Sharon, H.; Ebadi, H.; Kant, K.; Scavo, F.B.; Tina, G.M. Recent technical advancements, economics and environmental impacts of floating photovoltaic solar energy conversion systems. J. Clean. Prod. 2021, 278, 124285. [Google Scholar] [CrossRef]
  24. Trapani, K.; Santafé, M.R. A review of floating photovoltaic installations: 2007–2013. Prog. Photovolt. Res. Appl. 2014, 23, 524–532. [Google Scholar] [CrossRef] [Green Version]
  25. World Bank. Floating PV Power Plants. Available online: http://documents1.worldbank.org/curated/en/579941540407455831/pdf/Floating-Solar-Market-Report-Executive-Summary.pdf (accessed on 14 April 2021).
  26. Grubišić-Čabo, F.; Nižetić, S.; Giuseppe Marco, T. Photovoltaic panels: A review of the cooling techniques. Trans. FAMENA 2016, 40, 63–74. [Google Scholar]
  27. Trapani, K.; Millar, D.L. Proposing offshore photovoltaic (PV) technology to the energy mix of the Maltese islands. Energy Convers. Manag. 2013, 67, 18–26. [Google Scholar] [CrossRef]
  28. Trapani, K.; Millar, D.L. The thin film flexible floating PV (T3F-PV) array: The concept and development of the prototype. Renew. Energy 2014, 71, 43–50. [Google Scholar] [CrossRef]
  29. Kim, S.H.; Yoon, S.J.; Choi, W. Design and construction of 1 MW class floating PV generation structural system using FRP members. Energies 2017, 10, 1142. [Google Scholar] [CrossRef] [Green Version]
  30. Rao, B.B.; Sandeep, V.M.; Rao, V.U.M.; Venkateswarlu, B. Potential Evapotranspiration Estimation for Indian Conditions: Improving Accuracy through Calibration Coefficients. 2012. Available online: http://nicra-icar.in/nicrarevised/images/Books/Potential%20Evapotranspiration%20estimation.pdf (accessed on 21 February 2021).
  31. Perakis, C.; El Shenawy, E.; El Ghetany, H.; Kyriakarakos, G. Design of autonomous PV/RO desalination systems—Case studies for Egypt and Greece. Desalination Water Treat. 2017, 74, 12–20. [Google Scholar] [CrossRef]
  32. Ferrer-Gisbert, C.; Ferrán-Gozálvez, J.J.; Redón-Santafé, M.; Gisbert, P.F.; Sánchez-Romero, F.J.; Torregrosa-Soler, J.B. A new photovoltaic floating cover system for water reservoirs. Renew. Energy 2013, 60, 63–70. [Google Scholar] [CrossRef] [Green Version]
  33. Nagananthini, R.; Nagavinothini, R.; Balamurugan, P. Floating Photovoltaic Thin Film Technology—A Review. In Intelligent Manufacturing and Energy Sustainability; Springer: Singapore, 2020; pp. 329–338. [Google Scholar]
  34. NASA Prediction of Worldwide Energy Resource. Available online: https://power.larc.nasa.gov (accessed on 2 February 2021).
  35. Folsom Labs. Helioscope Solar Design Software. 2020. Available online: https://help.helioscope.com/ (accessed on 9 March 2021).
  36. Renewable Energy Capacity Statistics 2021; The International Renewable Energy Agency (IRENA): Abu Dhabi, United Arab Emirates, 2021; ISBN 978-92-9260-342-7. Available online: https://www.irena.org/-/media/Files/IRENA/Agency/Publication/2021/Apr/IRENA_RE_Capacity_Statistics_2021.pdf (accessed on 14 April 2021).
  37. Allen, R.G.; Pereira, L.S.; Raes, D.; Smith, M. Crop Evapotranspiration-Guidelines for Computing Crop Water Requirements—FAO Irrigation and Drainage Paper 56; FAO: Rome, Italy, 1998; Volume 300, p. D05109. [Google Scholar]
  38. Wang, H.; Yang, Y.; Keller, A.A.; Li, X.; Feng, S.; Dong, Y.N.; Li, F. Comparative analysis of energy intensity and carbon emis-sions in wastewater treatment in USA, Germany, China and South Africa. Appl. Energy 2016, 84, 873–881. [Google Scholar] [CrossRef] [Green Version]
  39. Taboada, M.; Caceres, L.; Graber, T.; Galleguillos, H.; Cabeza, L.; Rojas, R. Solar water heating system and photovoltaic floating cover to reduce evaporation: Experimental results and modeling. Renew. Energy 2017, 105, 601–615. [Google Scholar] [CrossRef] [Green Version]
  40. Haas, J.; Khalighi, J.; de la Fuente, A.; Gerbersdorf, S.; Nowak, W.; Chen, P.-J. Floating photovoltaic plants: Ecological impacts versus hydropower operation flexibility. Energy Convers. Manag. 2020, 206, 112414. [Google Scholar] [CrossRef]
  41. Cazzaniga, R.; Cicu, M.; Rosa-Clot, M.; Tina, G.; Ventura, C. Floating photovoltaic plants: Performance analysis and design solutions. Renew. Sustain. Energy Rev. 2018, 81, 1730–1741. [Google Scholar] [CrossRef]
  42. Trapani, K.; Millar, D.L.; Smith, H.C. Novel offshore application of photovoltaics in comparison to conventional marine renewable energy technologies. Renew. Energy 2013, 50, 879–888. [Google Scholar] [CrossRef]
Figure 1. Key design elements for power generation through FPV system.
Processes 09 01005 g001
Figure 2. Evaporation rate in Egyptian dams among years in mm/day.
Processes 09 01005 g002
Figure 3. (a) Annual average of potential evaporation rate per day (b) annual water loss through evaporation (mm).
Processes 09 01005 g003
Figure 4. Sum of monthly potential evaporation rate over the period of (2000–2019).
Processes 09 01005 g004
Figure 5. Location FPV system on Aswan High Dam covering 50,000 m2.
Processes 09 01005 g005
Figure 6. Plane of array (POA) irradiance variation with and without tracking system.
Processes 09 01005 g006
Figure 7. Location of FPV on the Aswan Reservoir of 5MW capacity.
Processes 09 01005 g007
Table 1. Electrical performance of FPV system for various panel types and orientation of High Dam (constant area 50,000 m2).
S.NoMountingType of PV PanelOrientationPOA
Irradiance (kWh/m2)
PV Power
(MWp)
PV Energy
(GWh/year)
PR (%)Specific Yield
(kWhp/kWp)
1.Fixed Mount (β = 25°)Poly
crystalline
Portrait2491.15.189.7775.71884.8
Landscape2491.14.759.3478.81963.2
Mono
crystalline
Portrait2491.14.909.0874.31850.5
Landscape2491.14.508.7277.81937.1
Thin FilmPortrait2494.96.3011.9375.81892.0
Landscape2494.95.8711.7180.01995.9
2.Single-axis trackingPoly
crystalline
Portrait2616.64.9410.2879.62081.5
Landscape2732.24.559.8779.32166.4
Mono
crystalline
Portrait2612.14.679.5878.52049.5
Landscape2727.64.319.1878.12130.5
Thin FilmPortrait2582.86.0012.7082.02118.0
Landscape2683.85.6012.3081.82196.1
Table 2. Electrical performance of FPV system for various panel types and orientation of High Dam (constant area 50,000 m2).
S.NoMountingType of PV PanelOrientationModulesTOF (%)SAF (%)Operating Temperature (°C)Inverter AC
Nameplate (MW)
1.Fixed Mount (β = 25°)Poly
crystalline
Portrait21,60299.793.741.24.16
Landscape19,81299.797.841.73.83
Mono
crystalline
Portrait20,87299.793.441.23.95
Landscape19,14899.797.841.73.61
Thin FilmPortrait15,01099.991.441.05.05
Landscape13,97399.996.541.64.72
2.Single-axis trackingPoly
crystalline
Portrait18,339104.798.642.53.97
Landscape18,975107.498.443.03.66
Mono
crystalline
Portrait19,890104.698.742.53.75
Landscape18,339109.298.343.03.46
Thin FilmPortrait14,279103.498.842.34.81
Landscape13,339107.498.442.84.50
Table 3. Losses in the FPV system.
S.NoMountingType of PV PanelOrientationInverter Loss (%)Shading Loss (%)Irradiance Loss (%)Temperature Loss (%)
1.Fixed Mount
(β = 25°)
Poly
crystalline
Portrait1.96.30.210.2
Landscape2.02.20.210.2
Mono crystallinePortrait2.56.60.211.2
Landscape2.32.20.111.3
Thin FilmPortrait2.08.60.78.4
Landscape2.13.50.68.5
2.Single-axis trackingPoly
crystalline
Portrait2.01.40.110.7
Landscape1.91.70.010.8
Mono crystallinePortrait2.41.30.111.7
Landscape2.51.70.011.8
Thin FilmPortrait2.11.20.58.8
Landscape2.11.60.48.9
Table 4. Electrical performance of FPV system for various panel types and orientation of Aswan Reservoir—5 MW capacity.
S.NoMountingType of PV PanelOrientationArea (m2)POA Irradiance (kWh/m2)PV Energy
(GWh/year)
PR (%)Specific Yield
(kWhp/kWp)
1.Fixed Mount (β = 25°)Poly crystallinePortrait45,103.622491.19.56976.81913.8
Landscape52,142.542491.19.93479.81968.8
Mono crystallinePortrait54,677.372491.19.52776.51905.4
Landscape61,594.182491.19.72978.11945.9
Thin FilmPortrait42,288.172494.99.77778.41955.5
Landscape46,725.922494.910.1381.22026.7
2.Single-axis trackingPoly crystallinePortrait54,171.212678.410.6579.52129.5
Landscape60,782.672800.711.0979.22217.5
Mono crystallinePortrait57,322.462632.610.578.32093.8
Landscape64,078.022796.310.9178.02182.0
Thin FilmPortrait44,342.922639.510.8181.92161.9
Landscape49,455.602753.11.2681.82251.2
Table 5. Electrical performance of FPV system for various panel types and orientation of Aswan Reservoir—5 MW capacity.
S.NoMountingType of PV PanelOrientationNo.of
Modules
TOF (%)SAF (%)Operating Temperature (°C)Inverter Capacity (MW)Water Saving (m3)
1.Fixed Mount (β = 25°)Poly crystallinePortrait15,62599.794.641.34.02123,812.00
Landscape15,62599.798.641.84.02143,134.25
Mono crystallinePortrait21,27699.794.541.64.02150,092.50
Landscape21,27699.798.641.84.02169,079.53
Thin FilmPortrait11,90499.894.541.34.02116,083.45
Landscape11,90499.898.041.84.02128,265.31
2.Single-axis trackingPoly crystallinePortrait20,833107.298.542.84.02148,703.07
Landscape20,833112.198.043.44.02166,851.90
Mono crystallinePortrait21,276106.998.642.84.02157,353.57
Landscape21,276111.998.143.34.02175,897.84
Thin FilmPortrait11,904105.698.642.64.02121,723.84
Landscape11,904110.298.243.14.02135,758.44
Table 6. Losses in the FPV system in Aswan Reservoir.
Sl.NoMountingType of PV PanelOrientationInverter Loss (%)Shading Loss (%)Irradiance Loss (%)Temperature Loss (%)
1.Fixed MountPoly
crystalline
Portrait2.05.40.29.7
Landscape2.01.40.19.8
Mono crystallinePortrait2.43.70.111.2
Landscape2.41.40.111.3
Thin FilmPortrait2.15.50.68.4
Landscape2.12.00.68.5
2.Single-axis trackingPoly
crystalline
Portrait2.01.50.110.7
Landscape2.02.00.010.8
Mono crystallinePortrait2.51.50.011.8
Landscape2.51.90.011.9
Thin FilmPortrait2.11.40.48.9
Landscape2.11.80.39.0
Table 7. Floating PV system cost component of different PV panels.
S.NoCategoryCost ComponentCrystalline
(2019 USD/kW)
Thin Film
(2019 USD/kW)
1.Module and inverter Modules557.01360.57
Inverters89.889.8
2.BoSRacking and mounting108.5108.5
Grid connection53.453.4
Cabling/wiring47.847.8
Safety and security22.722.7
Monitoring and control25.325.3
3.InstallationMechanical installation46.146.1
Electrical installation31.431.4
Inspection3.33.3
4.Soft costsMargin104.0104.0
Financing costs60.660.6
System design79.579.5
Permitting58.158.1
Incentive application18.818.8
Costumer acquisition14.814.8
5.Floating structurePontoons1583.35-
Moorings178.76178.76
Installations608.61608.61
Project Management93.5693.56
Annual O & M2.261.58
Table 8. CO2 saving from fixed mount and single axis tracking FPV systems.
FPV SystemFPV Energy (MWh/Year)CO2 Saving from Solar Energy Production (Tons)CO2 Saving from Reduction in Evaporation (Tons)Total CO2 Saving (Tons)
Fixed mount193438,680.00410.6139,090.61
Single-axis tracking219343,860.00410.6144,270.61
Publisher’s Note: MDPI stays neutral with regard to jurisdictional claims in published maps and institutional affiliations.

