Article

Analysis of Diagnostic Methods and Energy of Production Systems Drives

1
Department of Automation and Production Systems, Faculty of Mechanical Engineering, University of Žilina, Univerzitná 8215/1, 010 26 Žilina, Slovakia
2
Mechatronic Systems Department, Kalashnikov Izhevsk State Technical University, 7, Studencheskaya Str., 426069 Izhevsk, Russia
3
Department of Production Engineering, Institute of Mechanical Engineering, Warsaw University of Life Sciences, Nowoursynowska Street 164, 02-787 Warsaw, Poland
*
Author to whom correspondence should be addressed.
Processes 2021, 9(5), 843; https://doi.org/10.3390/pr9050843
Submission received: 11 April 2021 / Revised: 27 April 2021 / Accepted: 7 May 2021 / Published: 12 May 2021
(This article belongs to the Section Automation Control Systems)

Abstract

:
This article deals with solving the urgent scientific problem of the diagnostics of drives of technological robotized workplaces with support of sensors. The dependence of diagnostic parameters on the technical state of drives of automated technological systems, which is of great economic importance for industrial enterprises, is being investigated. Diagnostic models have been developed based on sensory systems to diagnose drive models of technological robotized workplaces. The use of these models may also include monitoring systems in which it is possible to build a system for identifying detected changes. These systems identify many contradictory changes and thereby reduce the false alarm frequency of monitoring sensory systems. Numerous methods for solving technical diagnostics problems are often based on methods based on mathematical models describing work processes, as well as on spectral analysis of measured parameters, such as vibrations, noise, and electric current. A fuzzy inference system for assessing the technical condition, a system for estimating the residual resource of drives, and asystem for calculating diagnostic intervals based on fuzzy knowledge have been developed. Based on the historical trend of the diagnostic parameters, the intelligent diagnostic system determines the current technical condition of the actuator and predicts future technical condition changes, determines the remaining service life and the time intervals for diagnostics. The analysis of the time spent on planned preventive maintenance of technological equipment makes it possible to conclude that, after the modernization of equipment in 2018, the repair time was reduced from 350 h to 260 h per year (26%). Since 2019, there is a tendency to increase repair time by 30 h each year.

1. Introduction

Failure of drives leads to significant economic losses and can be dangerous to human life and health. For the timely detection of defects, assessment of the technical condition, and prediction of the resource of their work, effective systems for diagnosing and predicting the residual resource are required.
At present, the theoretical foundations for assessing the technical state of drives are insufficiently developed due to the complexity of degradation of physical processes occurring in such systems, the complexity of the mathematical formalization of the description of these processes and defects, with a limited number of measured diagnostic parameters, with measurement errors. Due to the above reasons, there are no descriptions of the regularities between the diagnostic parameters and the states of the drive systems of mechanical engineering objects. Therefore, it is not possible to systematically solve the problems of diagnosing and assessing the residual resource, and planning the maintenance and repair of drives.
Theoretical foundations of sensory systems for diagnosis of drive models of technological robotic workplaces are elaborated in works [1,2,3,4,5,6,7,8,9,10,11,12] and by several other authors. The principles of sensory systems for diagnostics of technological workplaces and parametric diagnostics of technological systems [13] are taken into account. Approaches to estimating the residual life of technical objects based on a model in the form of a system of differential equations are analyzed in [14,15].
According to the source of information for sensory systems of drive model diagnostics of technological robotic workplaces, a distinction is made between test and functional diagnostics. Diagnostic methods are classified according to the type of physical processes that occur in the object: mechanical, electrical, vibration, acoustic, ultrasonic, shock pulses, thermal, magnetic, photometric, etc.
Diagnostic methods are classified according to the following characteristics [16]:
  • The degree of information content;
  • Types of diagnostic information;
  • Degree of utilization of technical means;
  • Stages of operation;
  • Depth of diagnostics.
The following diagnostic methods are distinguished according to the level of awareness [16]:
  • The time interval method used to analyze downtime, determine reliability indicators, monitor the operation of the control system, and obtain cyclograms;
  • Reference module method based on comparison of experimental data or calculated values and quality indicators;
  • Method of reference dependencies based on comparison of measured diagnostic parameters with reference diagnostic parameters;
  • Spectral method based on measuring components of complex vibration or acoustic signals;
  • The correlation method used to detect variations in the nature of the relationship between the diagnostic parameters (cross correlation) or the change of the diagnostic parameters over time (autocorrelation).
The relevance of applying fuzzy logic is to automate the diagnostic process. There are many uncertainties in diagnostics. The variation in sensor readings is highly variable when influenced by external (e.g., changes in temperature and load resistance torque) and internal factors (e.g., changes in the magnetic flux of electric motors). Fuzzy logic provides an effective means of representing uncertainties and inaccuracies. A comparison between the traditional qualitative method and the fuzzy logic method is given in [17]. Fuzzy logic can overcome the imprecise nature of uncertainty based on the use of fuzzy membership function for dealing with uncertainty by providing a very precise approach [17].
The presence of mathematical means to reflect the fuzzy source information allows you to build a model that is adequate to reality. The article proposes a methodology for diagnosing technical systems and determining their residual life on the basis of fuzzy logic. Currently, such a system of technical diagnostics, which would estimate the current technical state of equipment and provide early detection of possible defects, as well as predict their development in the future, has not yet been created. Modern diagnostic methods are based on mathematical models, which do not reflect all possible signs of developing defects. Therefore, the task of using a heuristic approach based on artificial intelligence methods, namely, the theory of fuzzy sets becomes relevant. All of the above confirms the need to develop diagnostic models and methods for assessing the current technical state of equipment based on artificial intelligence technology.
Currently, a variety of mathematical models have been developed for the diagnostics of drives. The literature reflects the results of the development of dynamic models on differential, artificial neural networks and fuzzy logic. Dynamic models require for their implementation all parameters of the object, which are not always known [4,18,19,20,21]. Artificial neural networks are quite complex in their implementation [22,23]. As an alternative to these methods, the use of fuzzy logic is proposed. The use of linguistic systems, rules and rules of fuzzy logic, as well as approximate reasoning allows you to bring an expert’s experience into the diagnostic system [3,5]. In such systems, complex relationships between input and output are described by a set of rules of fuzzy logic, implying the use of linguistic numbers instead of a complicated dynamic model.
Previous studies [24,25,26,27,28,29,30,31,32,33,34,35,36,37,38,39,40,41,42,43,44,45,46,47,48,49,50,51,52,53,54,55,56,57,58,59,60,61,62,63] in this field have only used current diagnostic parameter values to determine the current technical condition of the actuators. This restriction is removed in this article. The intelligent diagnostic system examines the trend of the diagnostic parameters over the past period, determines the current technical state of the actuators and predicts changes in the technical state in future time, and determines the remaining service life and the time intervals for carrying out diagnostics. Details of the technical condition of actuators of automated technological systems: the technical condition of actuators is assessed as good. The equipment was upgraded and the electric motors of the automated process systems were replaced three years prior.
The scientific novelty of the work lies in the fact that a new diagnostic model for determining equipment defects and predicting its service life, based on a system of equations with fuzzy cause–effect relations, is developed. This article deals with solving the urgent scientific problem of the diagnostics of drives of technological robotized workplaces with full support of sensors.
The work is aimed at solving a topical scientific problem of great economic importance, which consists of the fact that, when using systems for assessing, predicting, and controlling the technical state of drives, the reliability and efficiency of operation increases, for example, downtime decreases, the volume of manufactured products increases, and technical costs decrease, as well as maintenance and repair, and the number of accidents is reduced.
The rest of this article is organized as follows. Section 2 describes a methodology—analysis of diagnostic methods for drives of technological systems. Section 3 is about the development of diagnostic models. In Section 4 describes the scheme of a fuzzy inference system for technical state evaluation with three input variables x, D, t. Section 5 is a system diagram of the fuzzy estimates of the derivate of the residual life of the input variables x, D, W, t. The development of a fuzzy inference system for calculating drive diagnostics intervals is described in Section 6. The experiments, conclusion, and summarization are drawn in Section 7 and Section 8.

2. Methodology—Analysis of Diagnostic Methods for Drives of Technological Systems

At present, sensor systems for diagnosing vibration diagnostics drives, which are de-signed and developed by experts from the company Vibroacoustic Systems and Technologies, are commonly used throughout the engineering world, replacing sensory methods for diagnosing working difficulties using the parameters of voltage, current, and electromagnetic field. Vibration detected almost all the errors with the drive, with the exception of faults in the electrical insulation. It is possible to detect the moment when an electric current flows through the damaged area.
The increasing complexity of diagnostic methods for operator and equipment always leads to an increase in the number of measurement points and, consequently, an increase in the cost of diagnostic systems, which include mainly sensors to record, as electrical and non-electrical quantities. The economically optimal stationary diagnostic system will be a system with a partial combination of sensory and diagnostic functions. Monitoring and diagnosis are therefore possible to select a limited number of checkpoints in the nodes, which are the strongest sources of vibration (noise) in the unit, but, to a large extent, deter-mine their life. Most often, these are points on the housing assemblies of rolling bearings. In the case of high-speed drives, in which bearings are the main sources of vibration, the case can be used for two or three control points that are outside of the bearing system.
Diagnostic and prediction methods for periodic vibration (noise) measurements use vibration and noise as a diagnostic parameter. Most nodal defects begin to affect vibration and noise many months before the onset of an emergency. The only exceptions are some manufacturing errors and errors resulting from a violation of the drive operating instructions. They can occur at any stage of the life cycle of the machine and can evolve to dangerous values in a short period of time [24]. Assuming such errors are missing, there is no need to monitor drives with short measurement intervals, and it is therefore possible to set up portable diagnostic systems for drives with measurement intervals of several weeks, or even months.
The group of diagnostic methods considered requires deep knowledge of defect development processes and their impact on vibration and noise parameters in all types of diagnosed drives.
Developing diagnostic methods for periodic vibration and noise measurements that automate diagnostics and prognosis has the same difficulties as developing methods that require operator decisions. The most difficult problem is selecting the results of those measurements whose reliability is beyond doubt, especially if they differ from the results of previous measurements. The complexity of this choice is compounded by the fact that the cause of the differences may not only be the occurrence of defects or a change in the operating modes of the machine, but also frequent operator errors when selecting the location of the sensor or the quality of its installation. In addition, it is virtually impossible to maintain the same operating mode in terms of load, rotational speed, and ambient temperature during measurements taken at long intervals of the order of several weeks or months.
Despite these difficulties, work is being done in many countries to develop methods for automatic machine diagnostics using periodic vibration measurements, and there are already many diagnostic systems in which they are used fairly effectively.
The most popular and complicated methods are the diagnostics and prediction of one-time vibration measurements (noise). They are built on the basis of a different combi-nation of the information technologies envisaged and are mostly used only by qualified professionals. A characteristic feature of these methods is the diagnostics of the machine nodes, or even individual elements if they are the source of oscillations. The highest efficiency will be achieved if experts make full use of the capabilities of spectral information technology.
A correct diagnosis of electrical circuits is very essential in industrial plants. For ex-ample, the patterns of acoustic signals of a specific induction motor were analyzed. Acoustic signals include information about motor state. The analysis of the patterns was conducted for three states of induction motor using fast Fourier transform (FFT), shortened method of frequencies selection (SMoFS-10), and linear support vector machine (LSVM). The results of calculations suggest that the method is efficient and can be also used for diagnostic purposes. Advantages are analyzed in [44].

3. Development of Diagnostic Models

Analysis of known diagnostic systems has shown that there is no general approach to the design of diagnostic systems for drives of technological systems based on artificial intelligence methods. The design of the diagnostic system for the drives of technological systems is usually based on the mathematical model of the diagnosed object. Such models are also very complex for simple assemblies, such as bearings. Moreover, in such a model, there is no mechanism for the appearance of defects and failures, and their impact on the target functions of the propulsion of technological systems is not taken into account [25,26,27].
The logic–linguistic model for diagnostics and prediction of residual lifetime of drives of technological systems, and for calculation of diagnostic intervals based on fuzzy logic represents a system of equations:
{ x ( t ) = F ( x ( t 0 ) , t ) , D ( t ) = G ( x ( t i ) , t ) , Z ( t ) = H ( x ( t ) , D ( t ) , t ) , R ( t ) = W ( x ( t ) , D ( t ) , Z ( t ) , t ) , Δ t = V ( x ( t ) , D ( t ) , R ( t ) , t ) ,
where x(t) = F(x(t0),t) is the equation of diagnostic parameters:
  • x(t) is a vector of diagnostic parameters;
  • t is an elaborated resource;
  • D ( t ) = G ( x ( t i ) , t ) is the equation to calculate the trend diagnostic vector of the diagnostic parameters;
  • ti is a set of moments of measurement of diagnostic parameters;
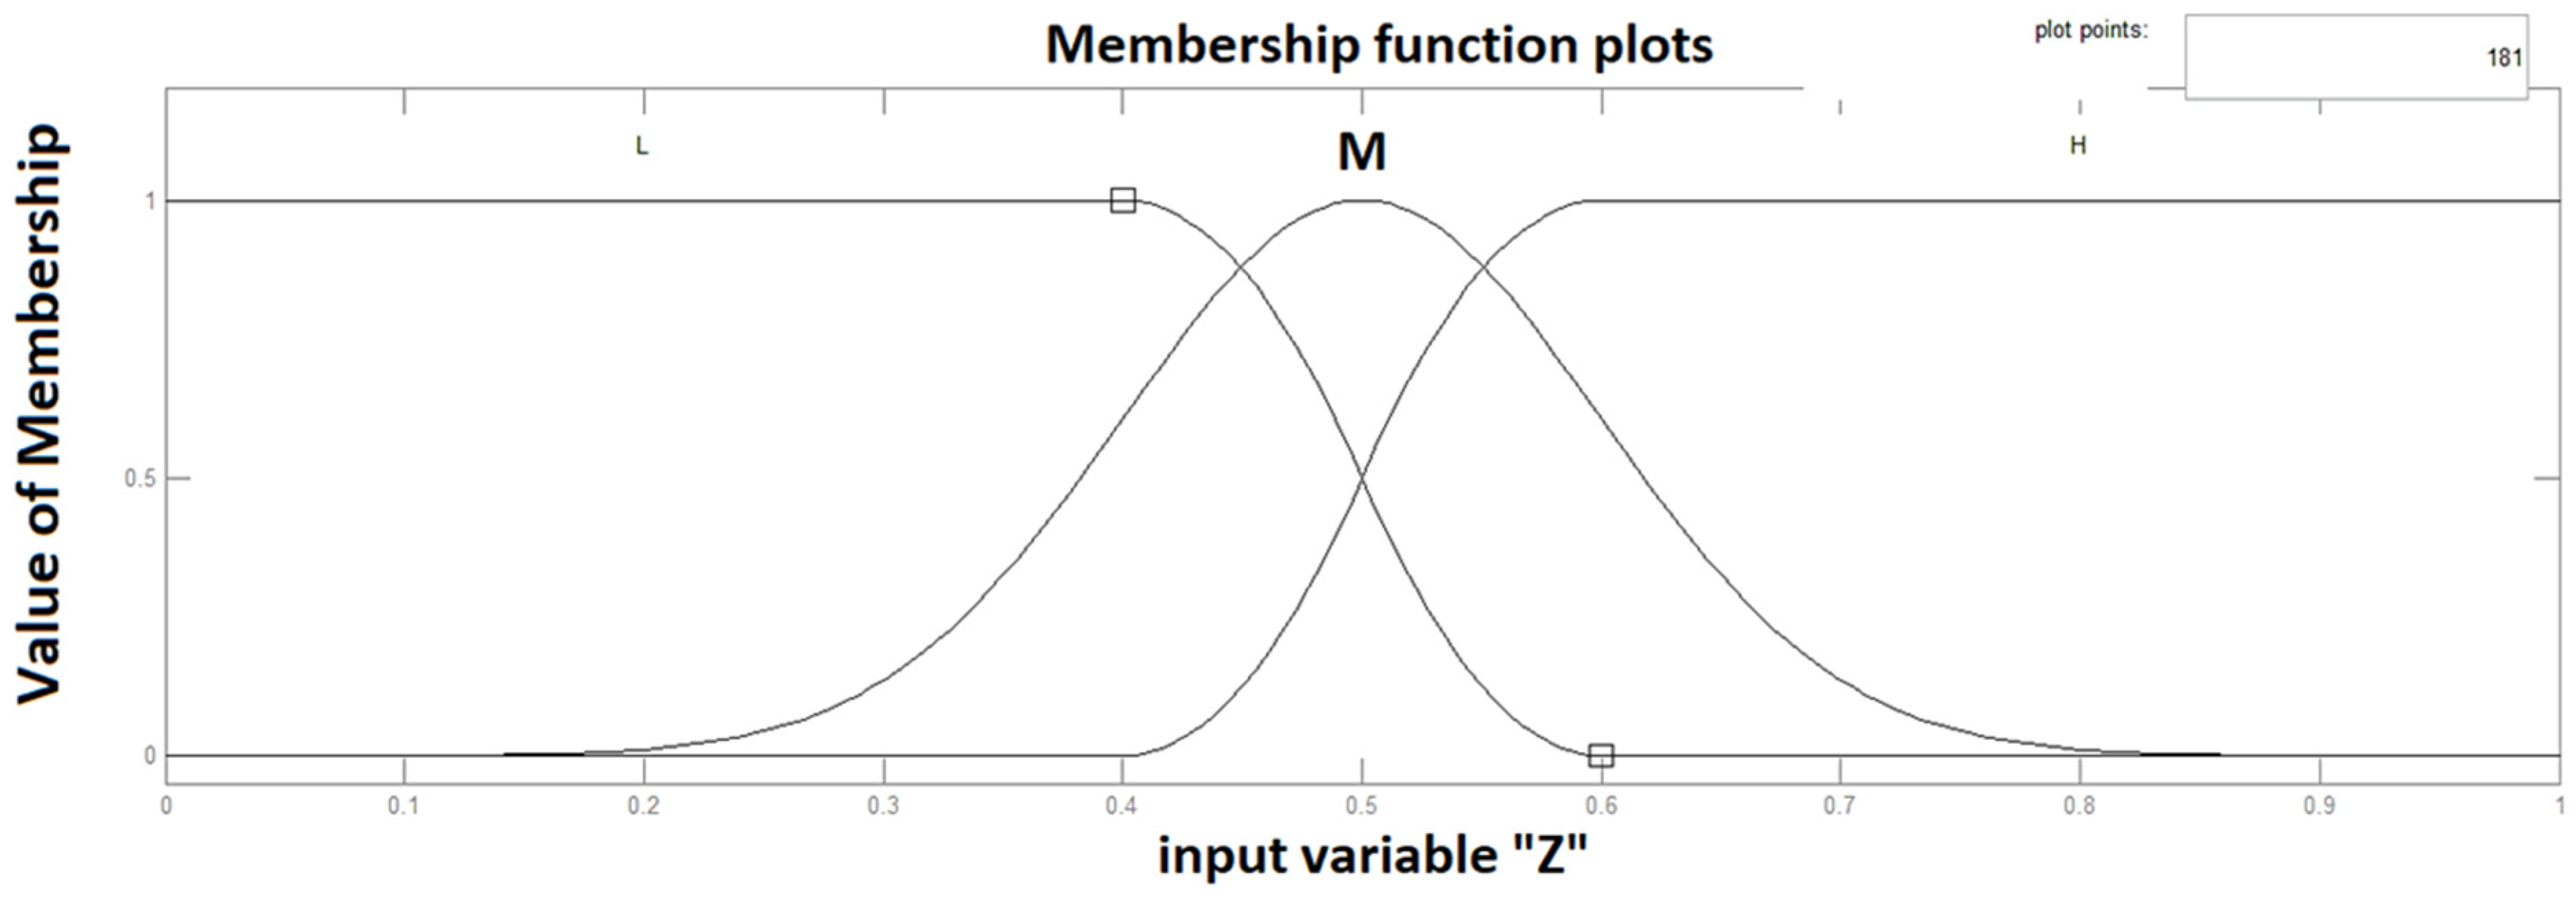
  • Z(t) = H(x(t), D(t), t) is the equation for assessment of technical condition;
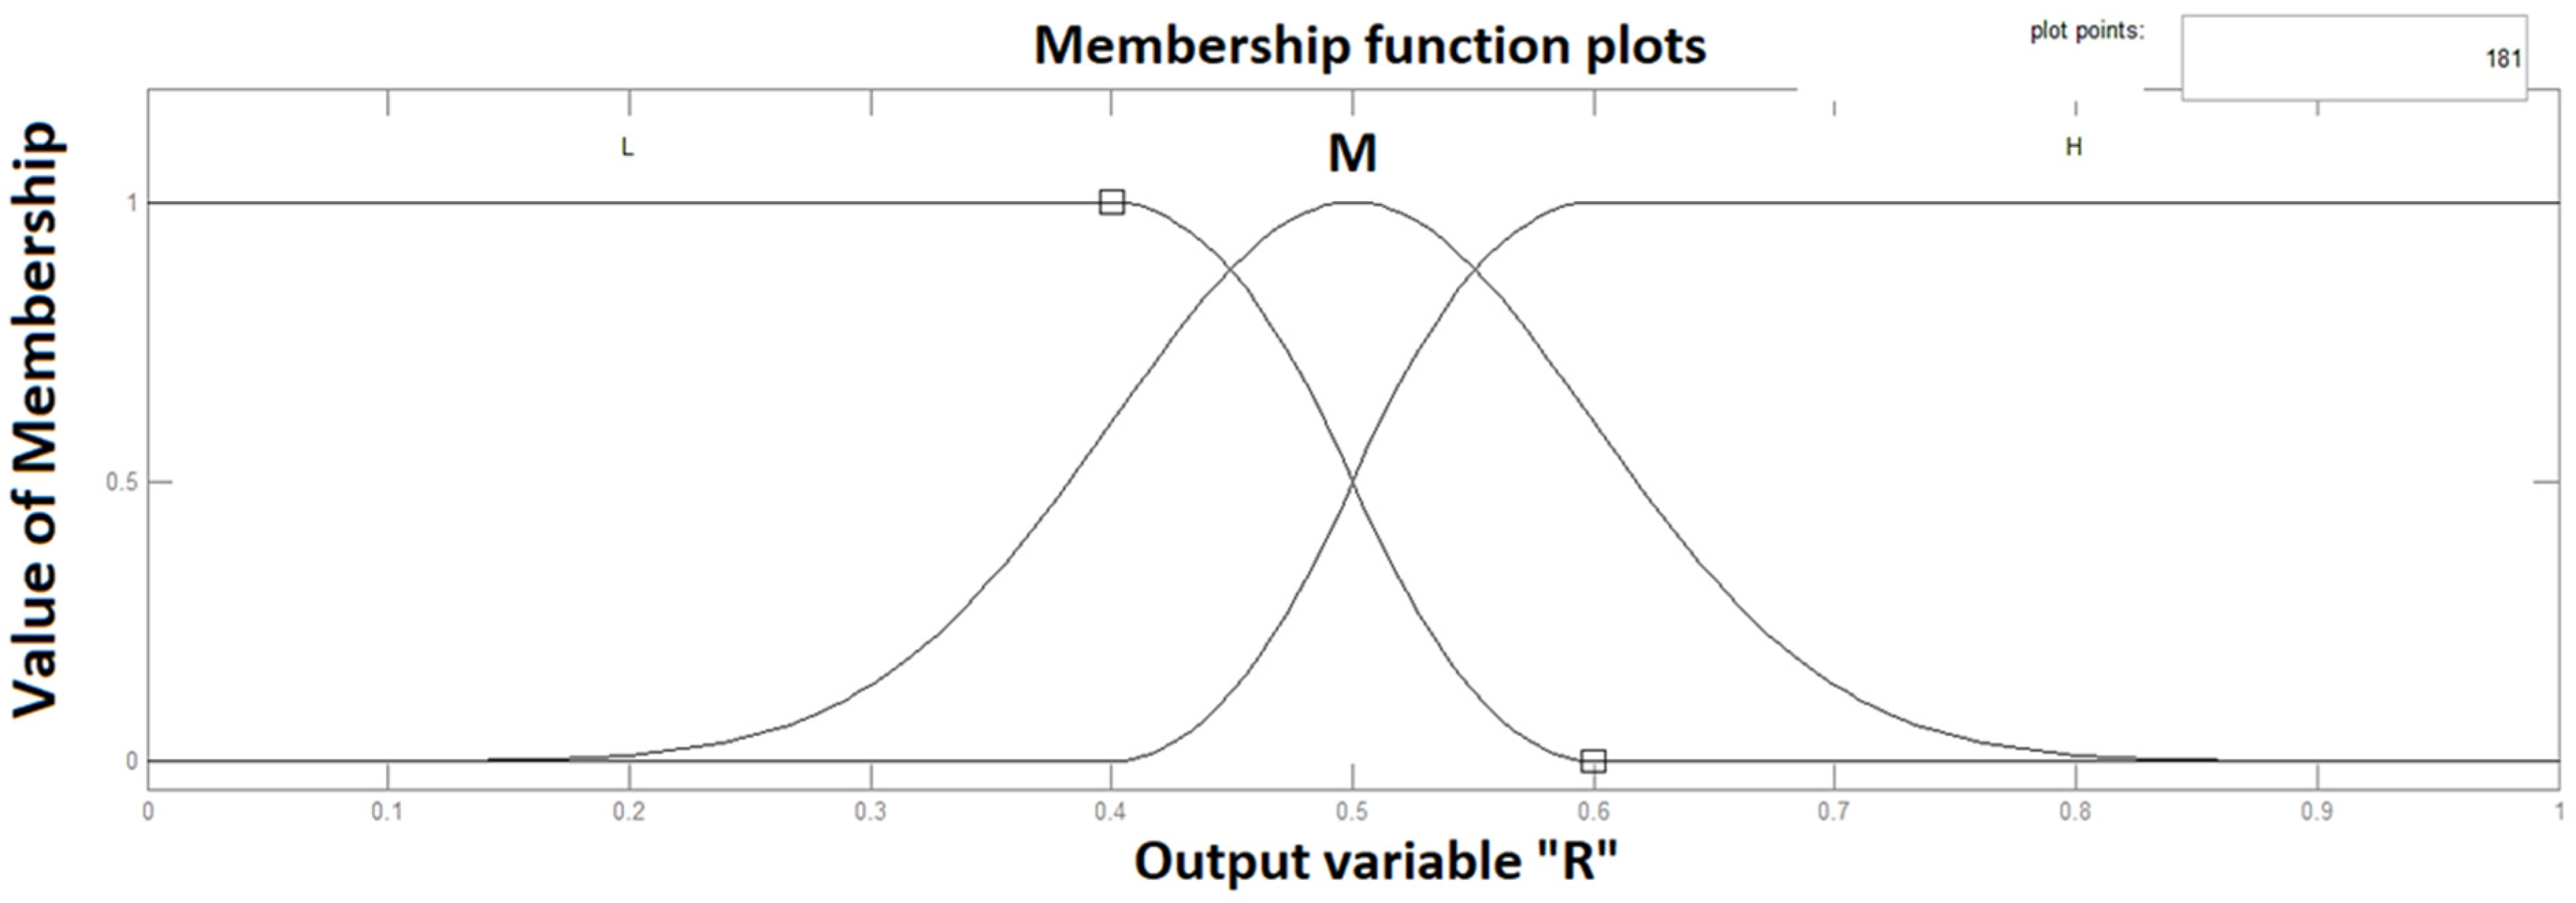
  • R(t) = W(x(t), D(t), Z(t), t) is the equation for estimating residual life at time t;
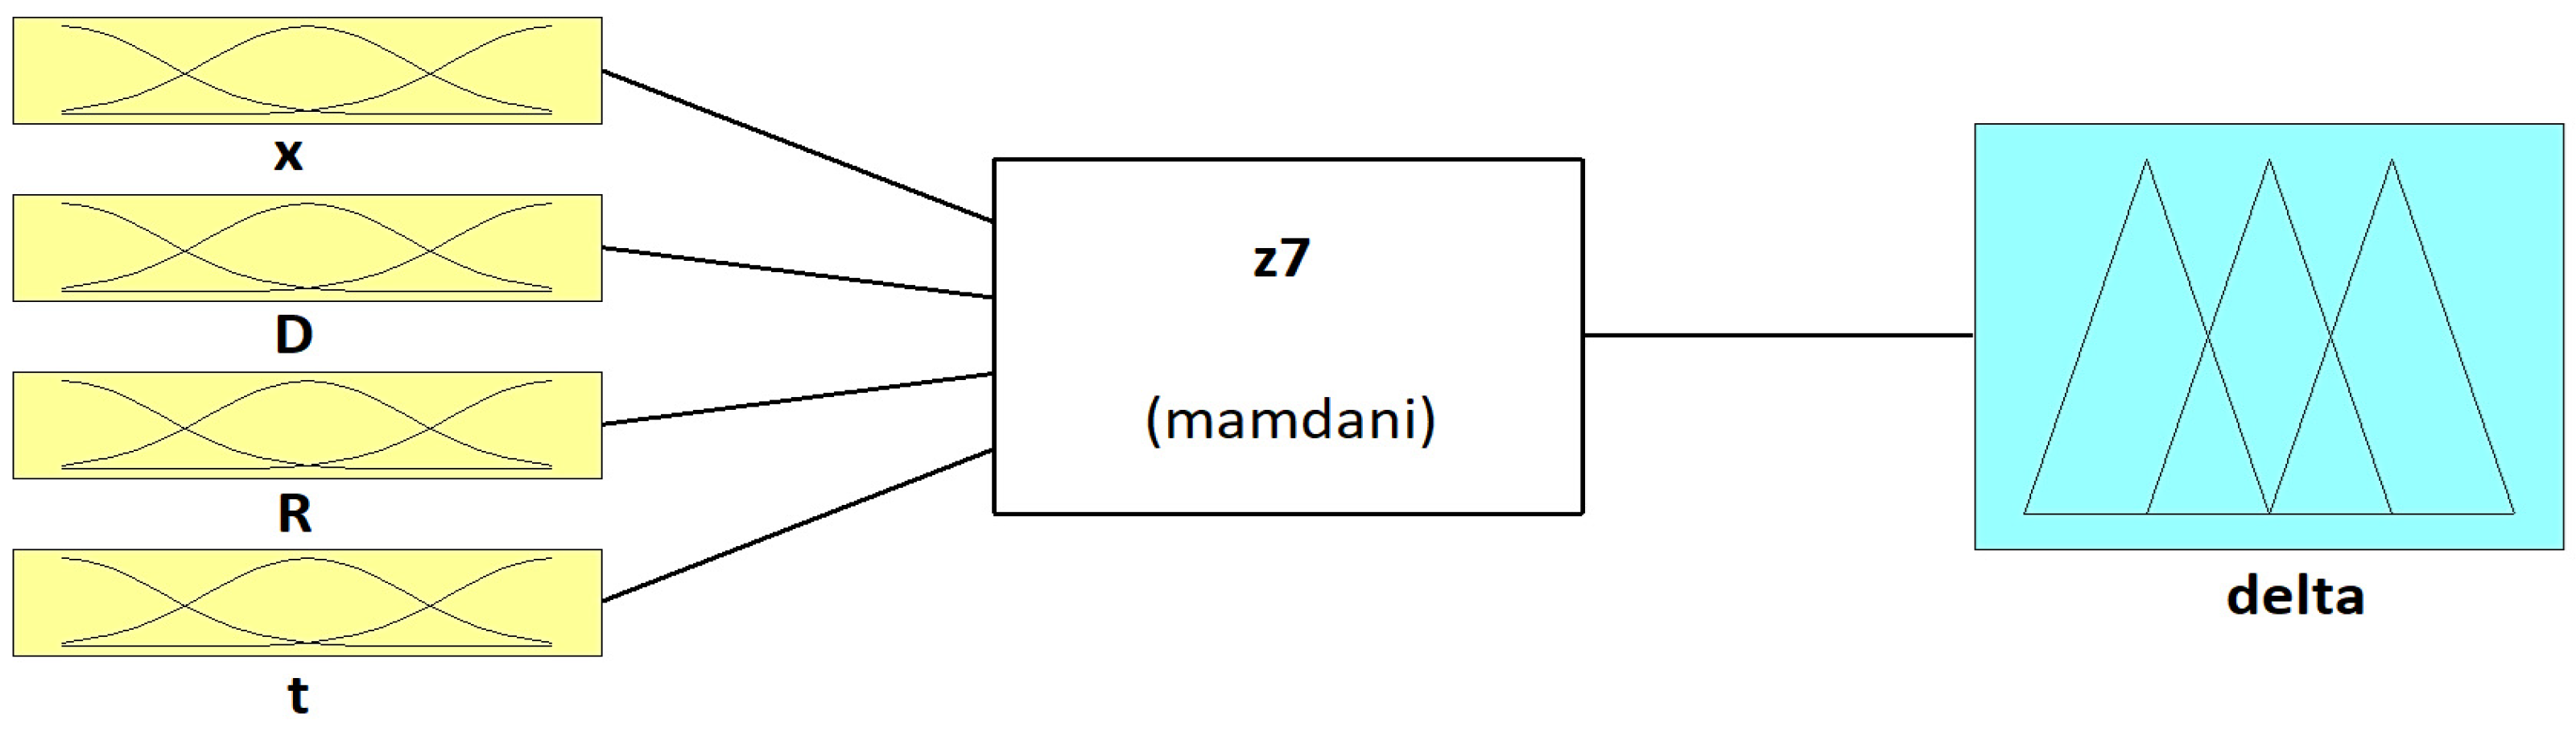
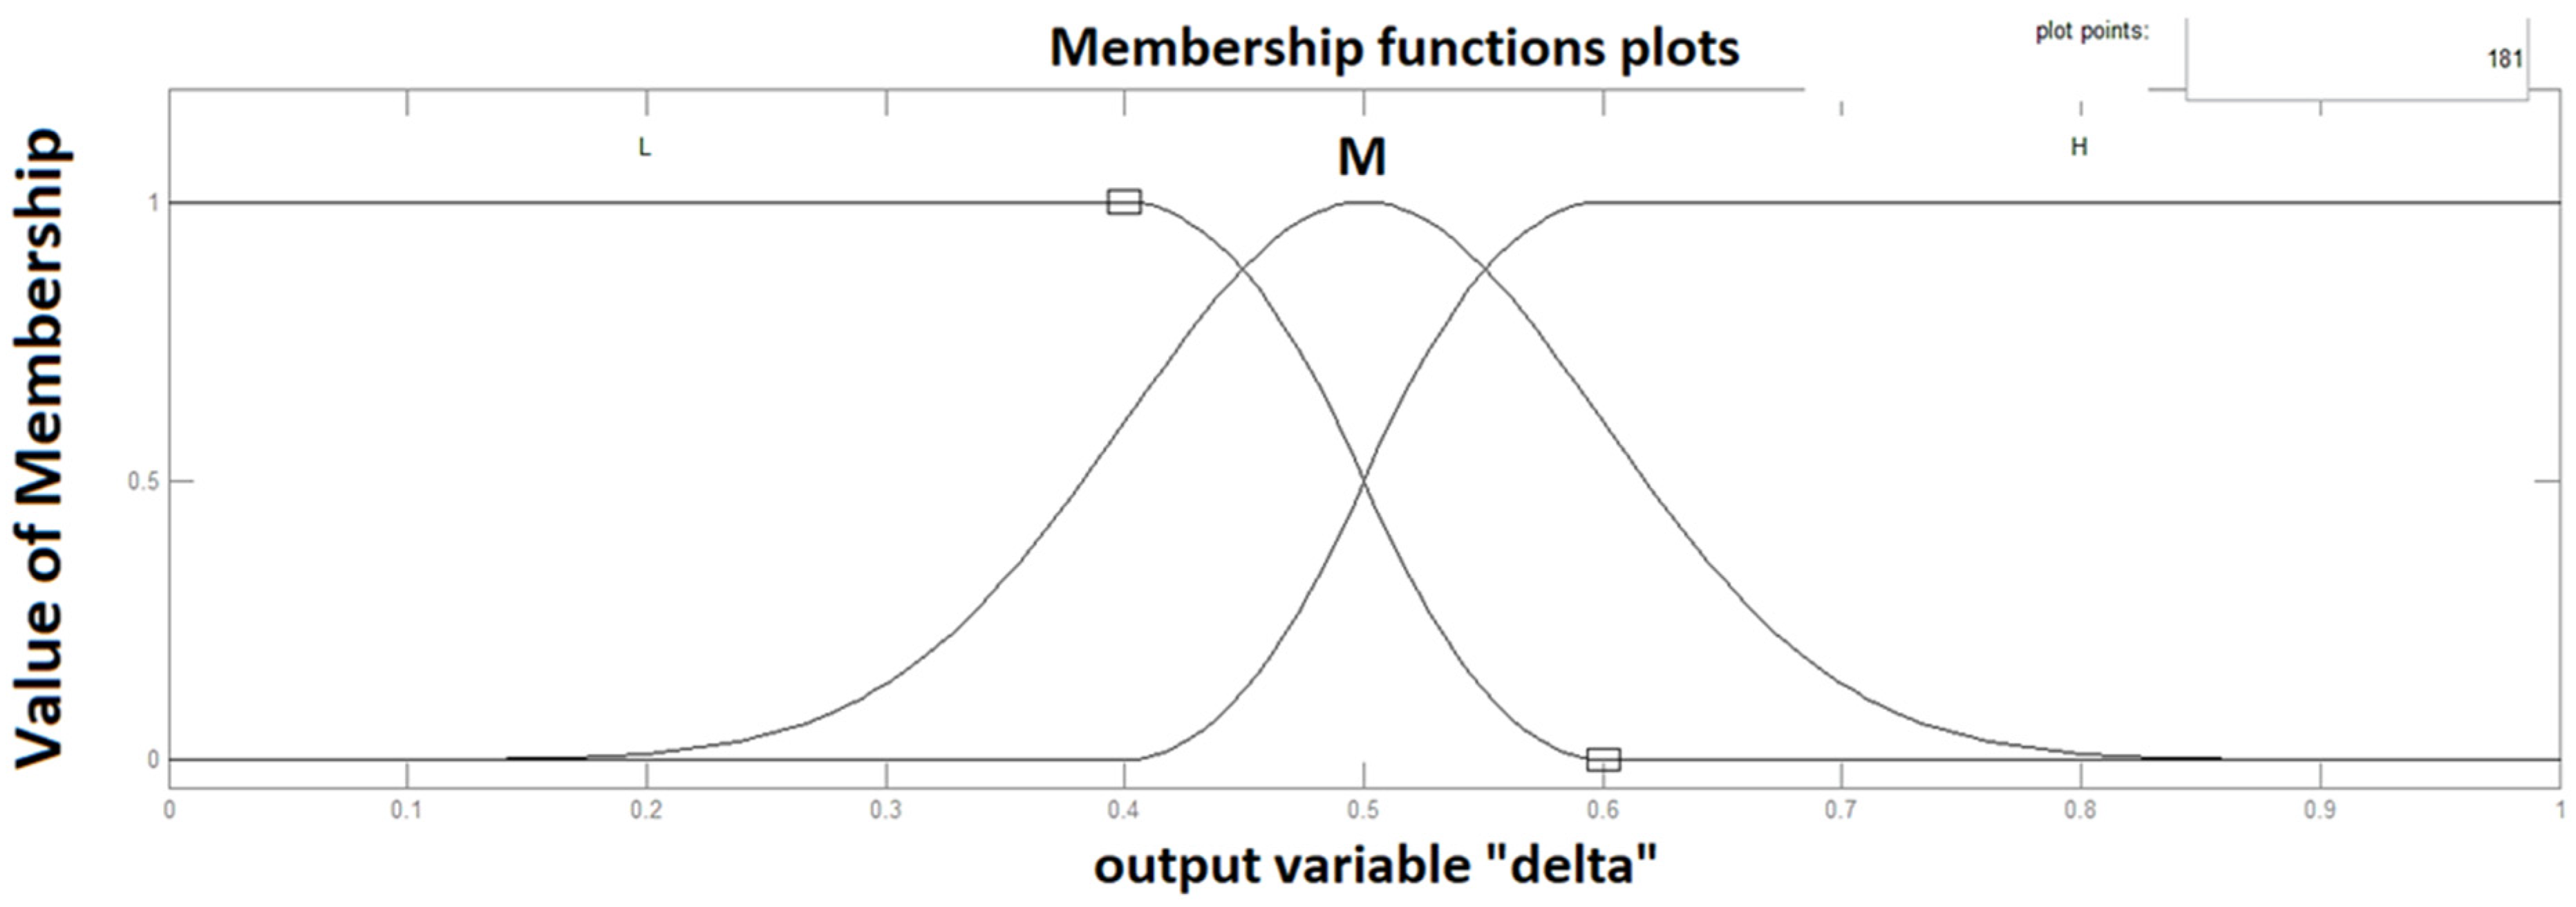
  • Δt = V(x(t), D(t), R(t), t) is the equation to calculate diagnostic intervals.
The diagnostic and prediction model of the technology system drives was implemented in the MatLab software product in the Fuzzy Logic Toolbox.

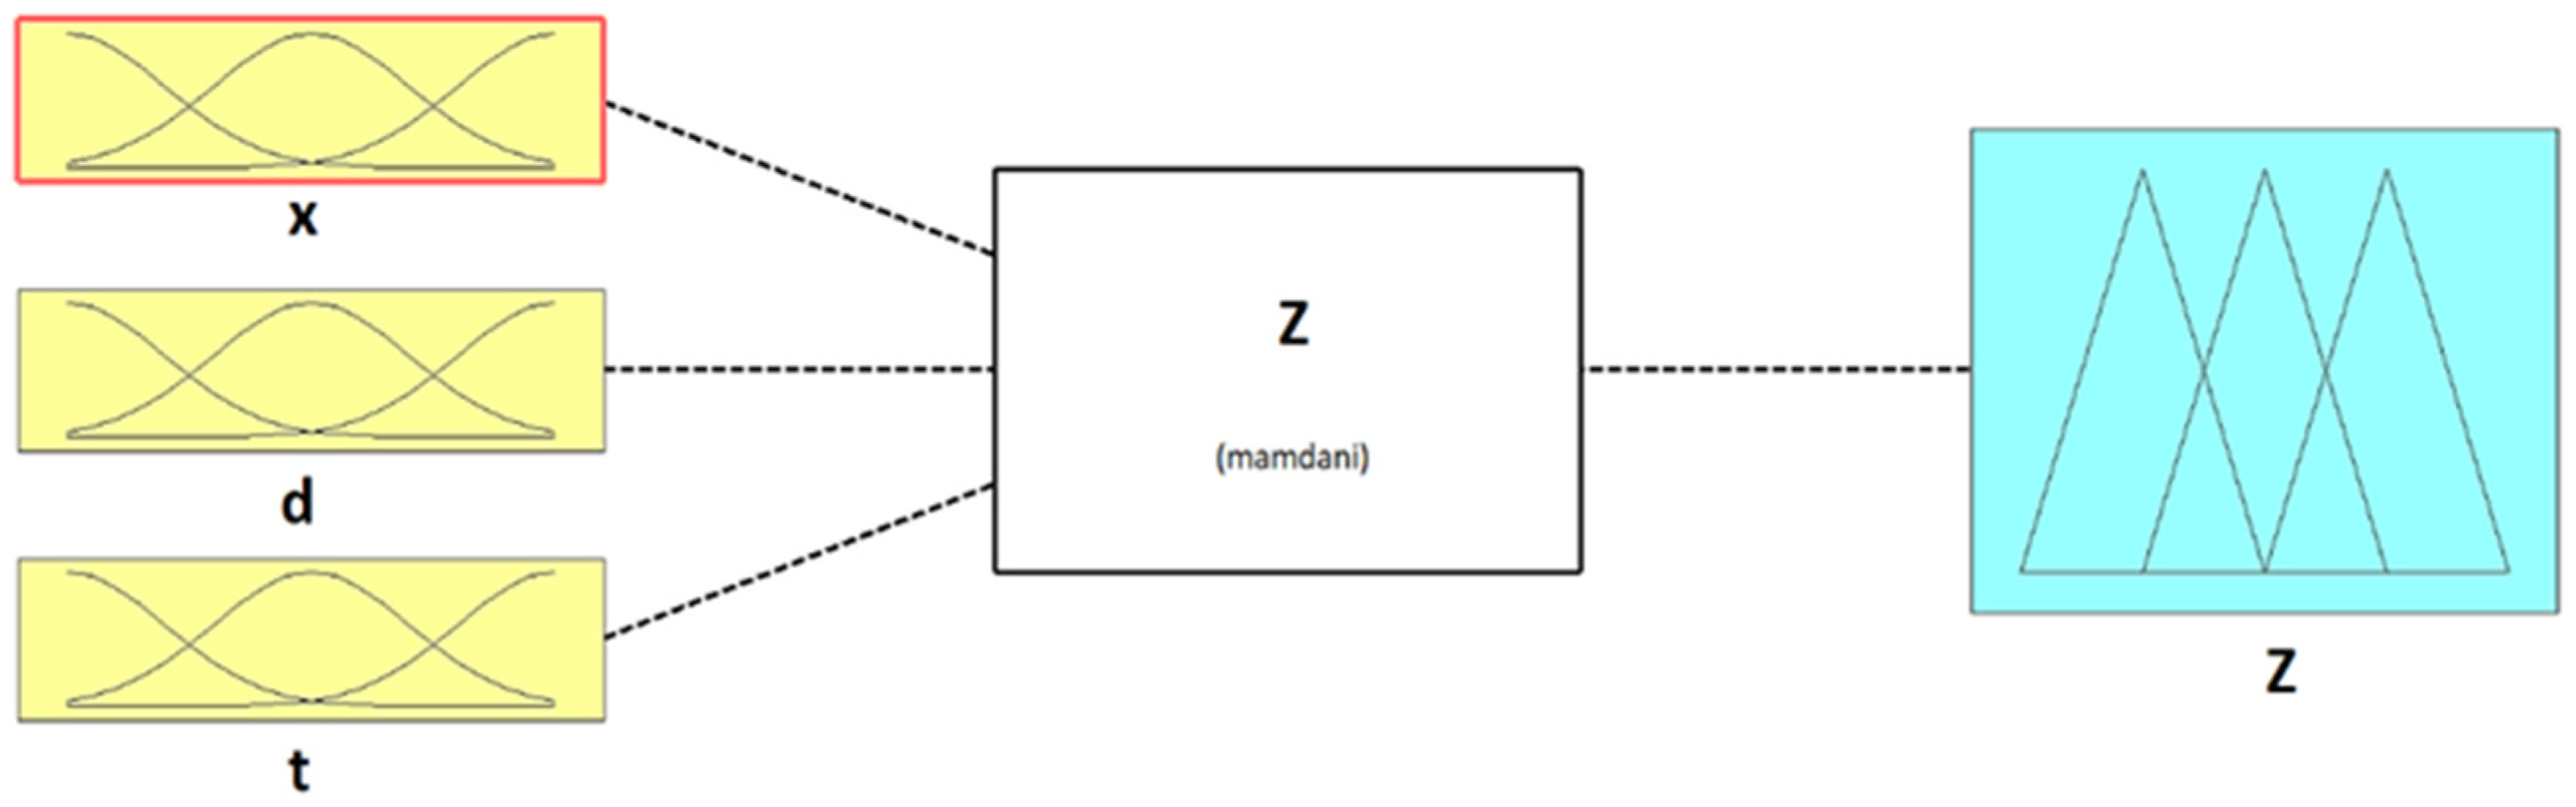
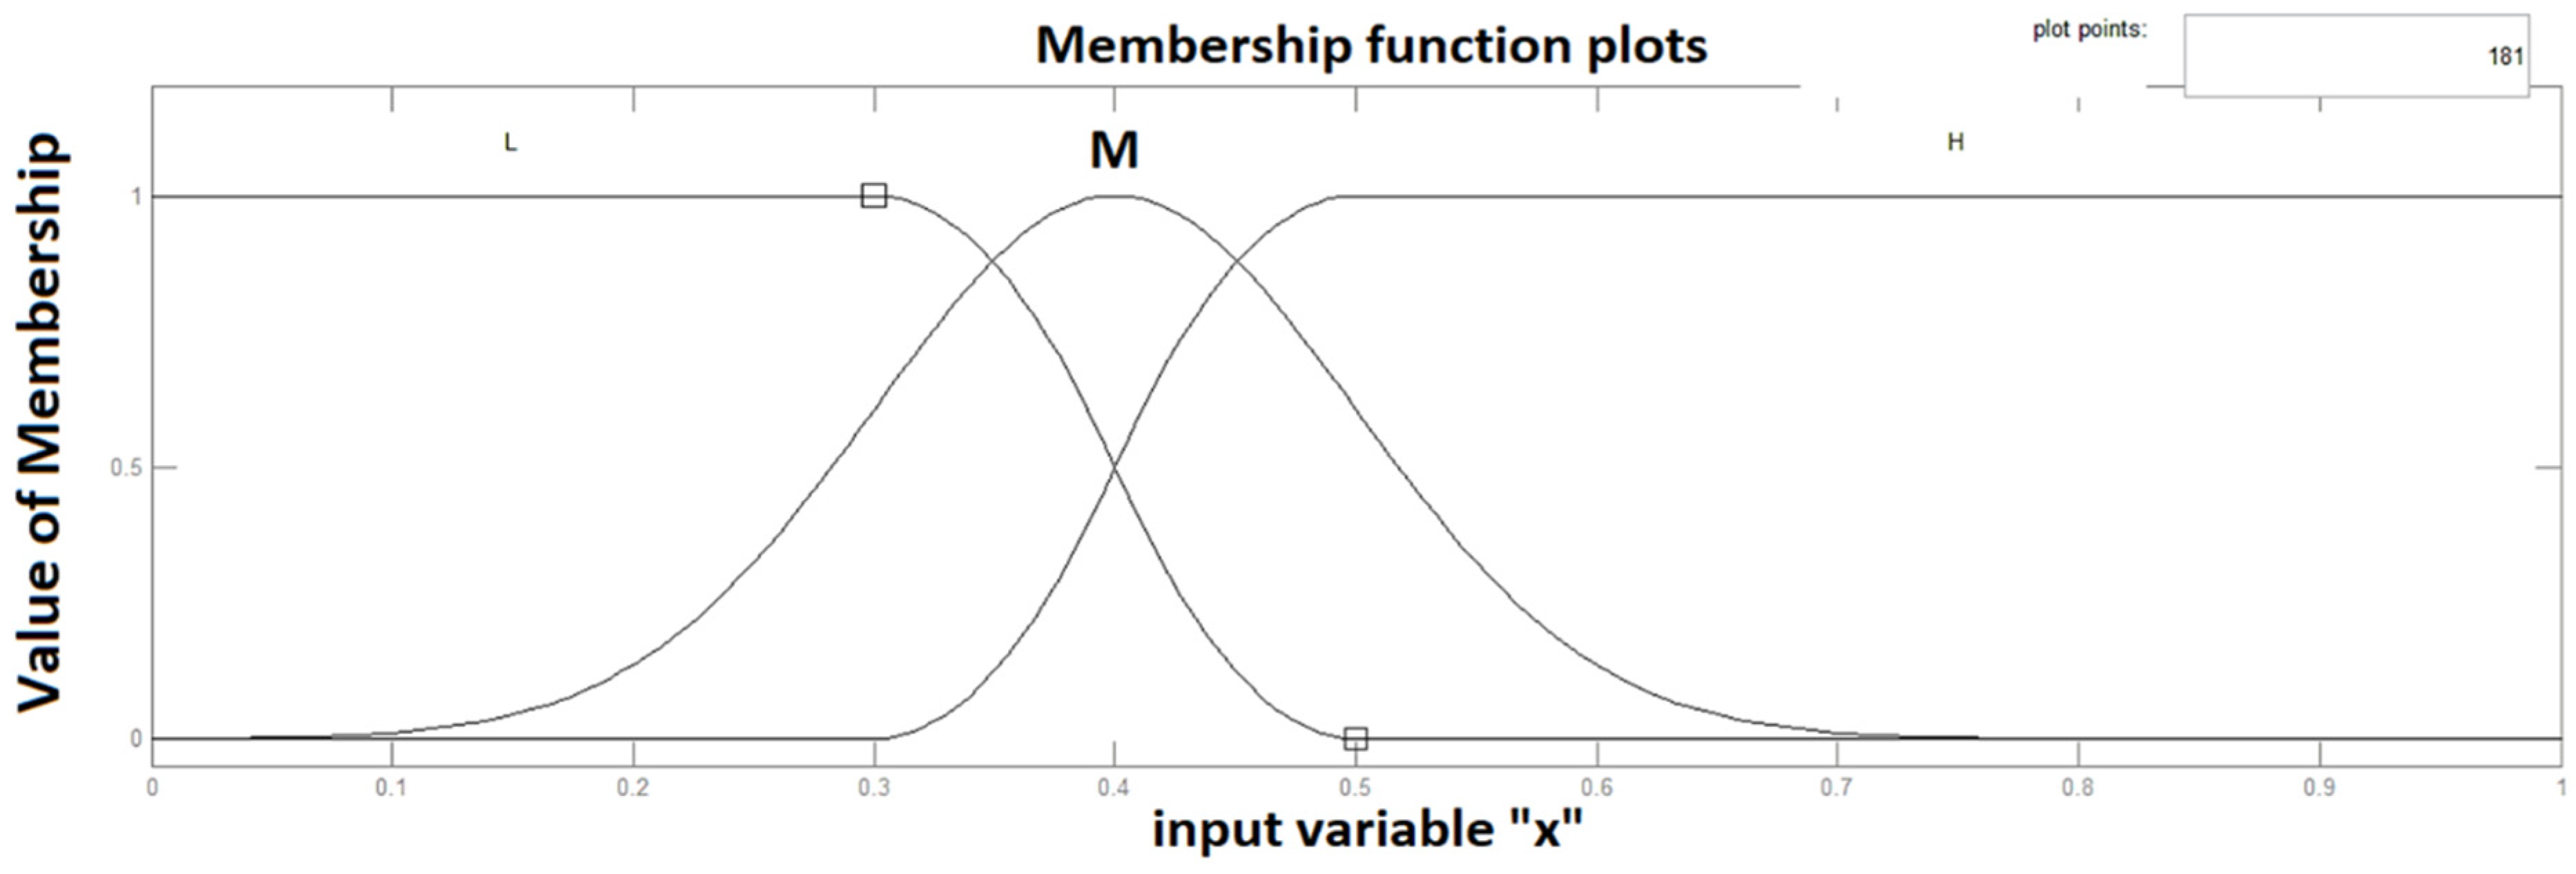
4. Development of a Fuzzy Inference System to Assess the Technical Condition of Drives

The fuzzy inference system for technical state assessment is implemented on the basis of a fuzzy knowledge, such as Mamdani, with three input variables: x, D, t. The diagram of the fuzzy inference system is shown in Figure 1.
The Gaussian function was chosen as the basic function of the term M language variable because it is relatively simple, differentiable, and it is defined by only two parameters, which allows for the reduction of the computational complexity of the algorithm. As a basic function of the L–H expressions of a language variable, they are selected from the function.
The selected Mamdani fuzzy inference, as the t-norm selected maximum defuzzification method, is performed by a method of importance as it provides good accuracy and fuzzy adjustment of the basic rate of knowledge. As adjustable weighting rule parameters are used, the location of the maximum duration function of the language variable M varies. The example of the function of the known input variables x, D, t is shown in Figure 2, Figure 3 and Figure 4.
The example of the function of the known output variable z is shown in Figure 5.
When using three linguistic variables with three terms in combination with logical operations (AND, OR), we obtained seven rules reflecting the dependence of the technical state on the values of diagnostic parameters, as shown in Figure 6.
The response of the surface of the fuzzy inference system to the state of the art is shown in Figure 7. Similar simulation results for mechatronic motion modules were obtained in [3], where the MVTU software was used. The input linguistic variables were specified using a Gaussian function, and the output linguistic variables were represented as triangular functions to reduce computational cost. The disadvantage of these results [3] is that there is no representation of the results in a three-dimensional space.

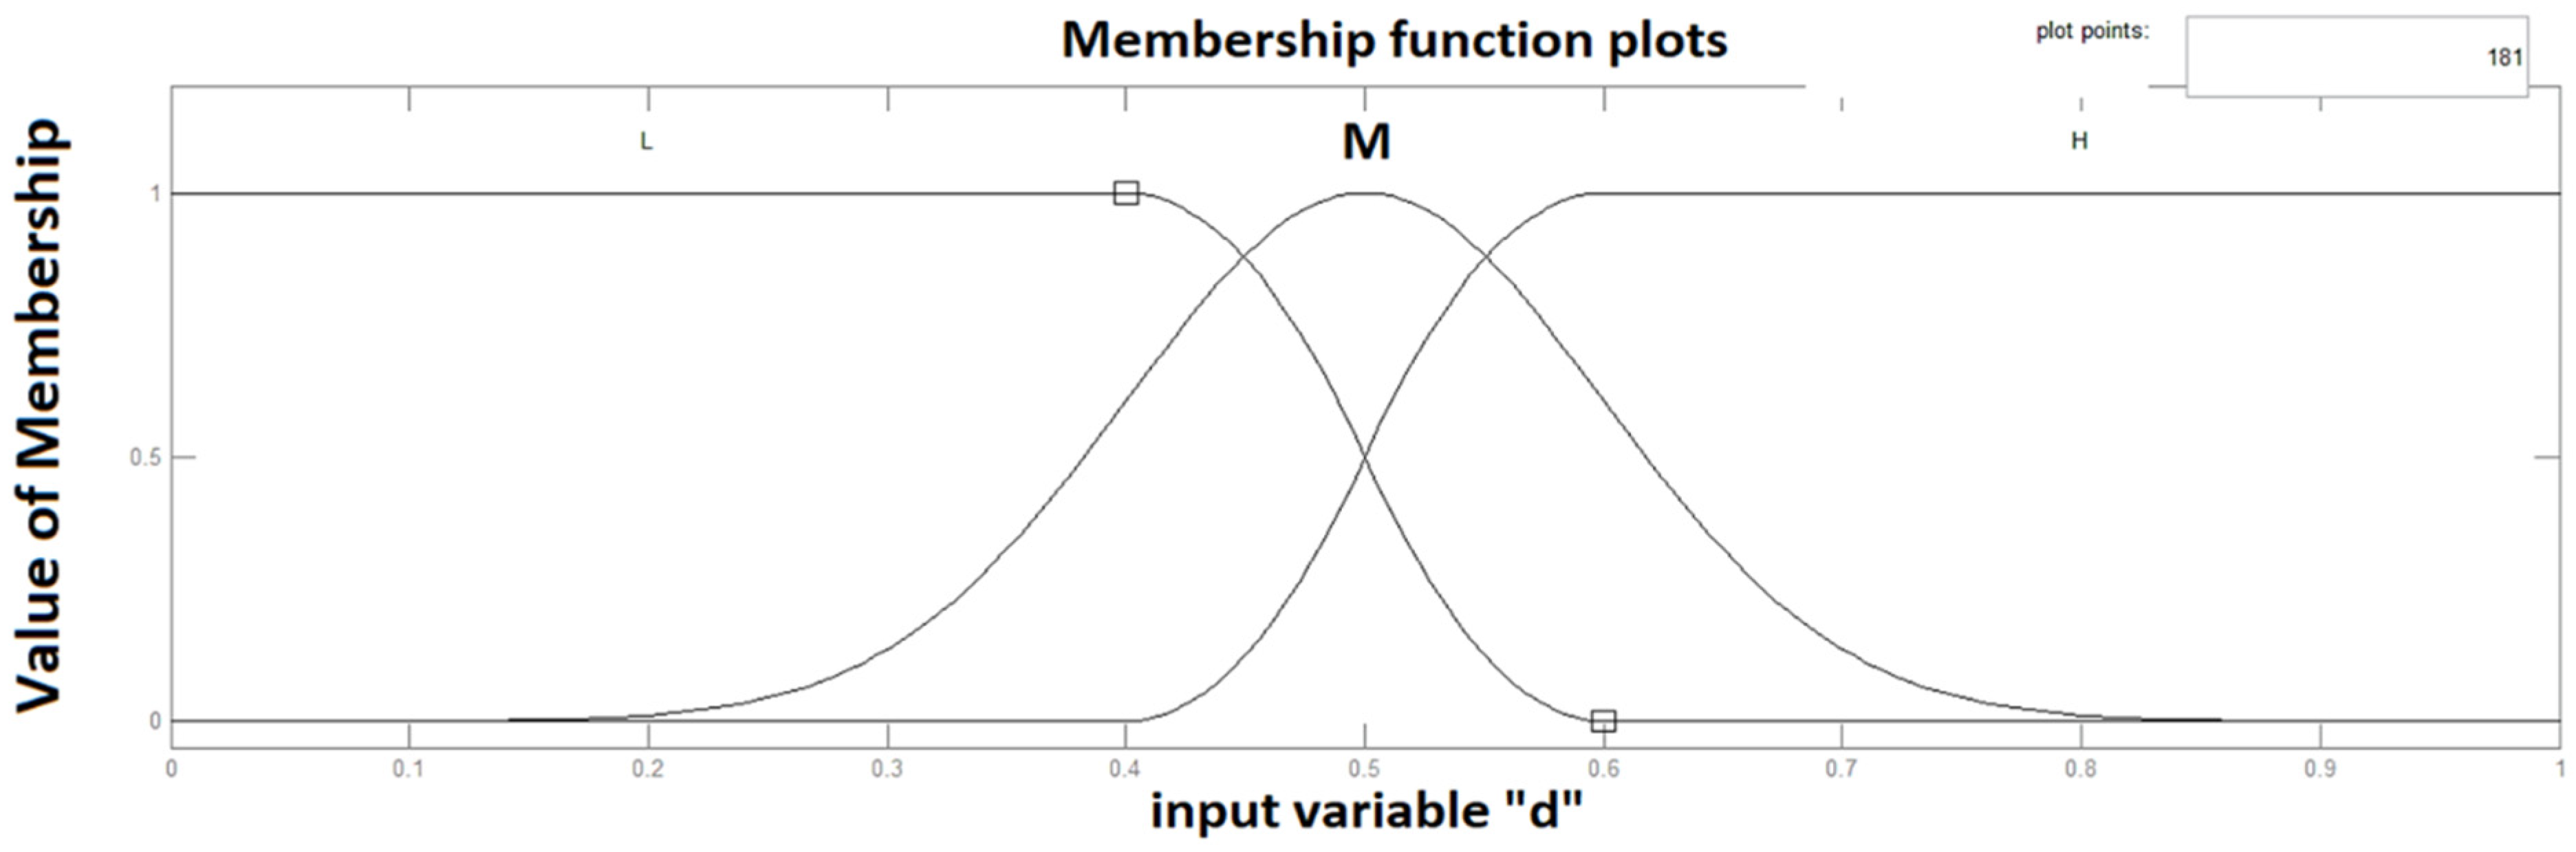
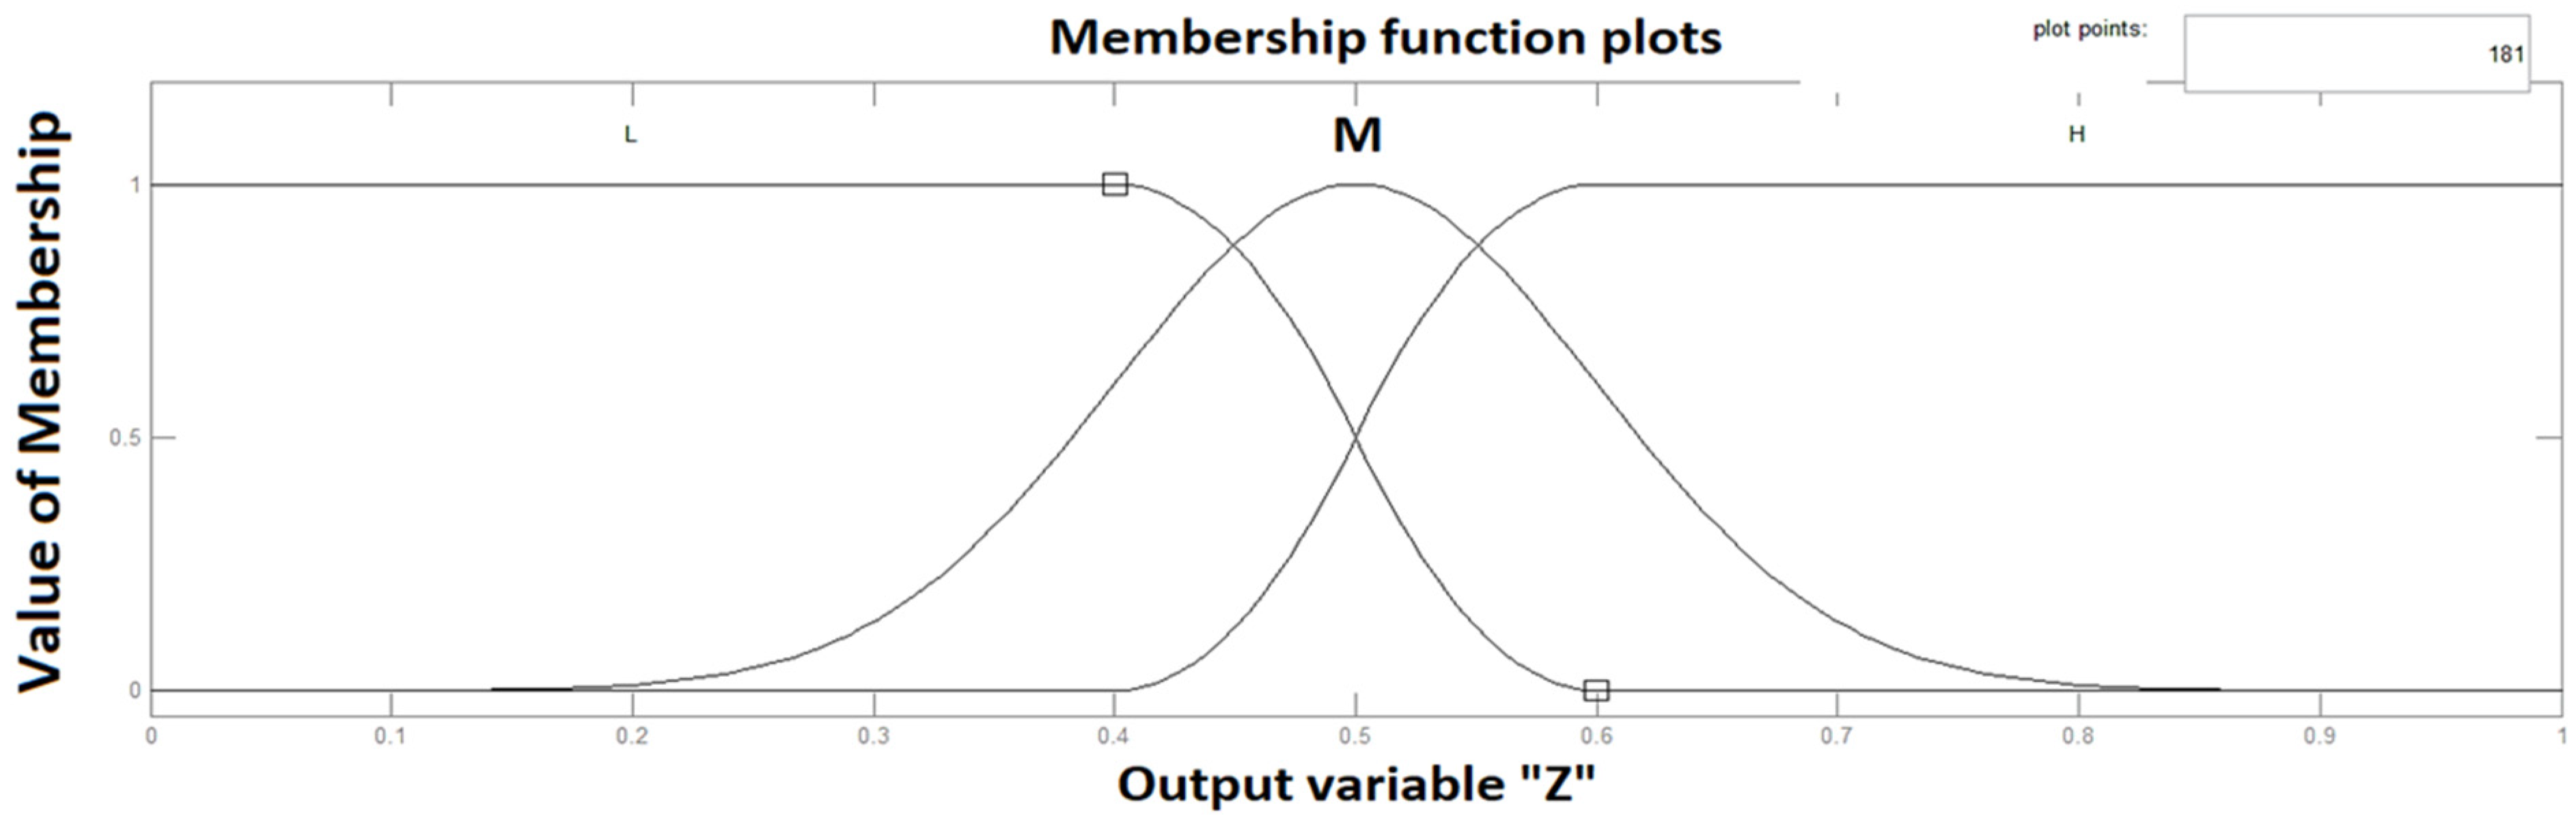
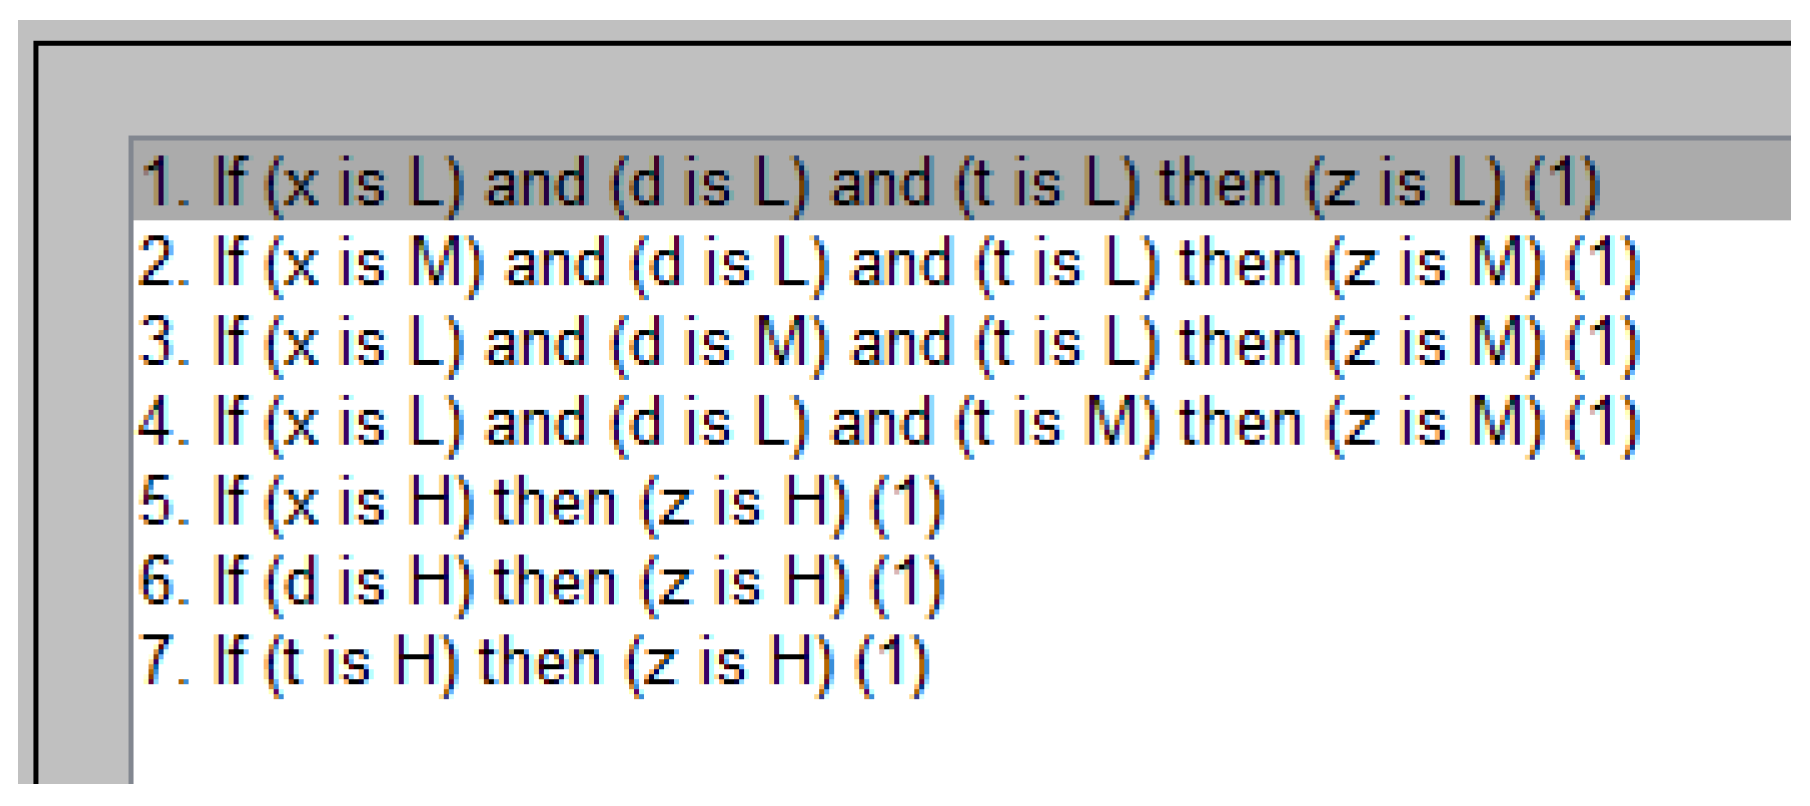
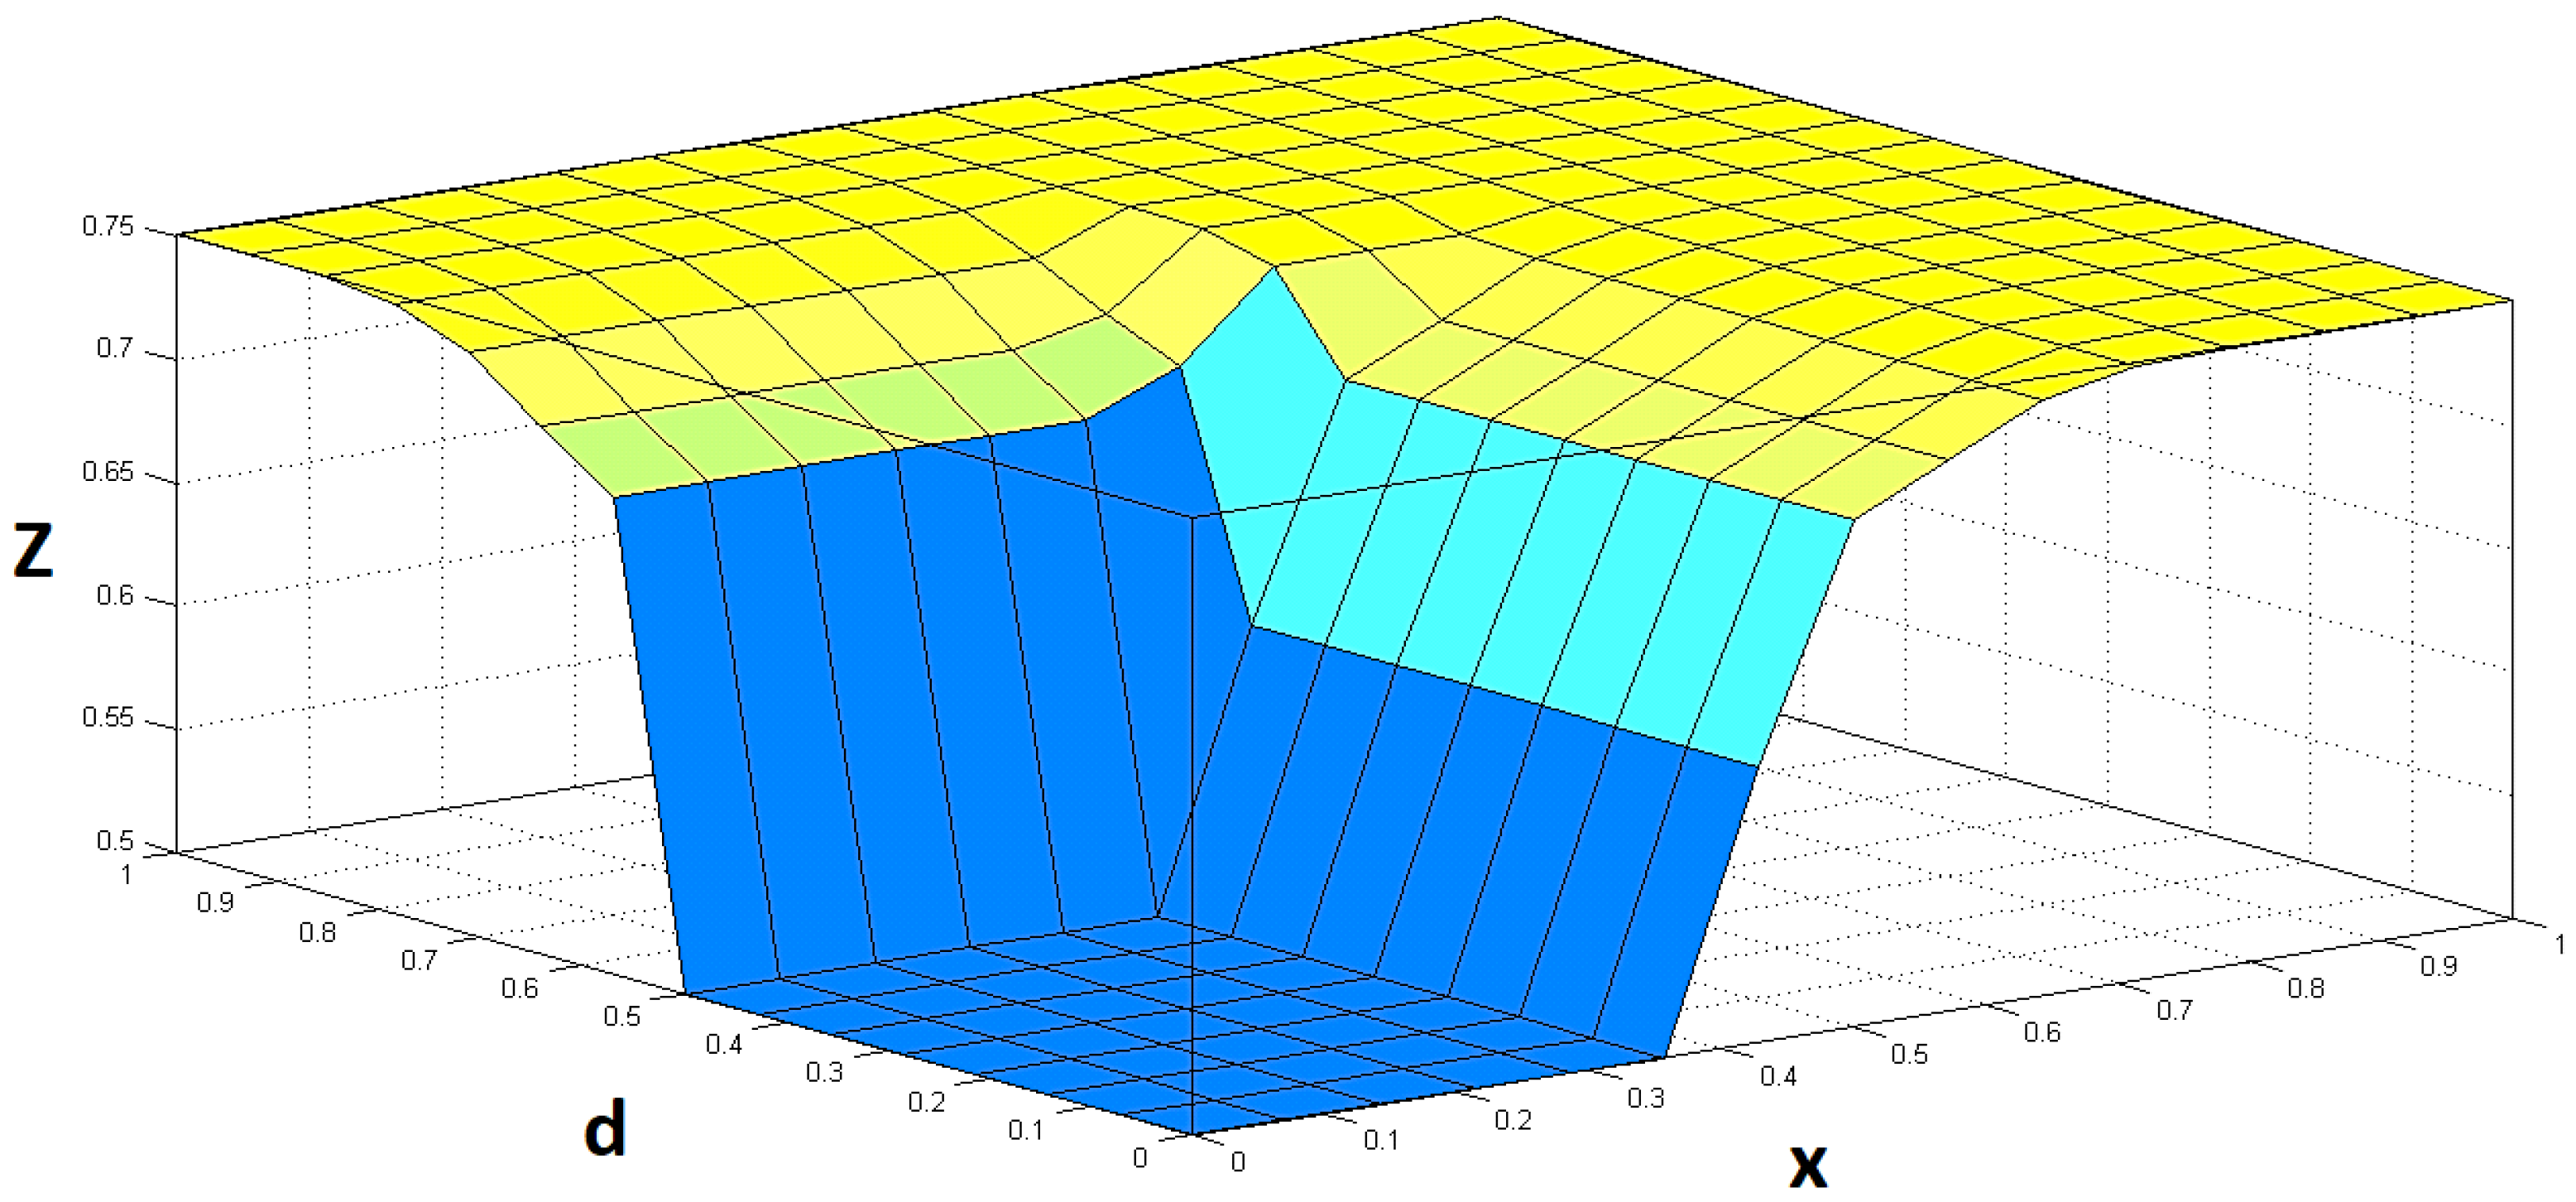
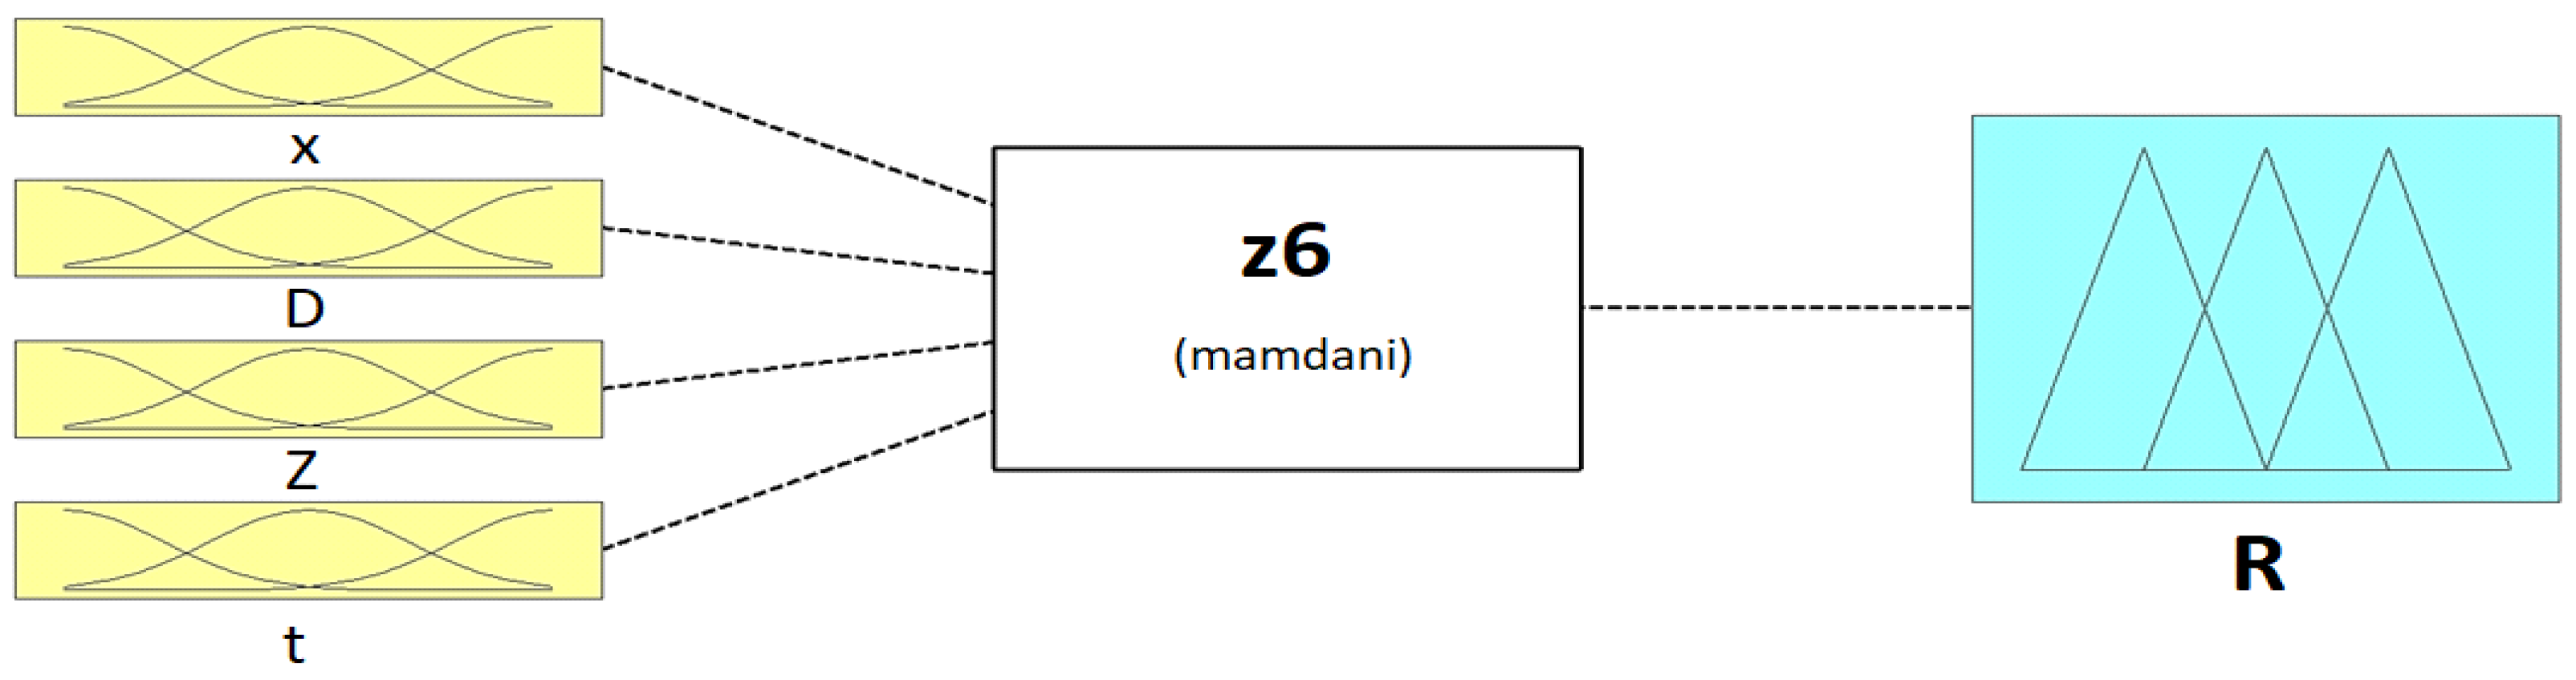
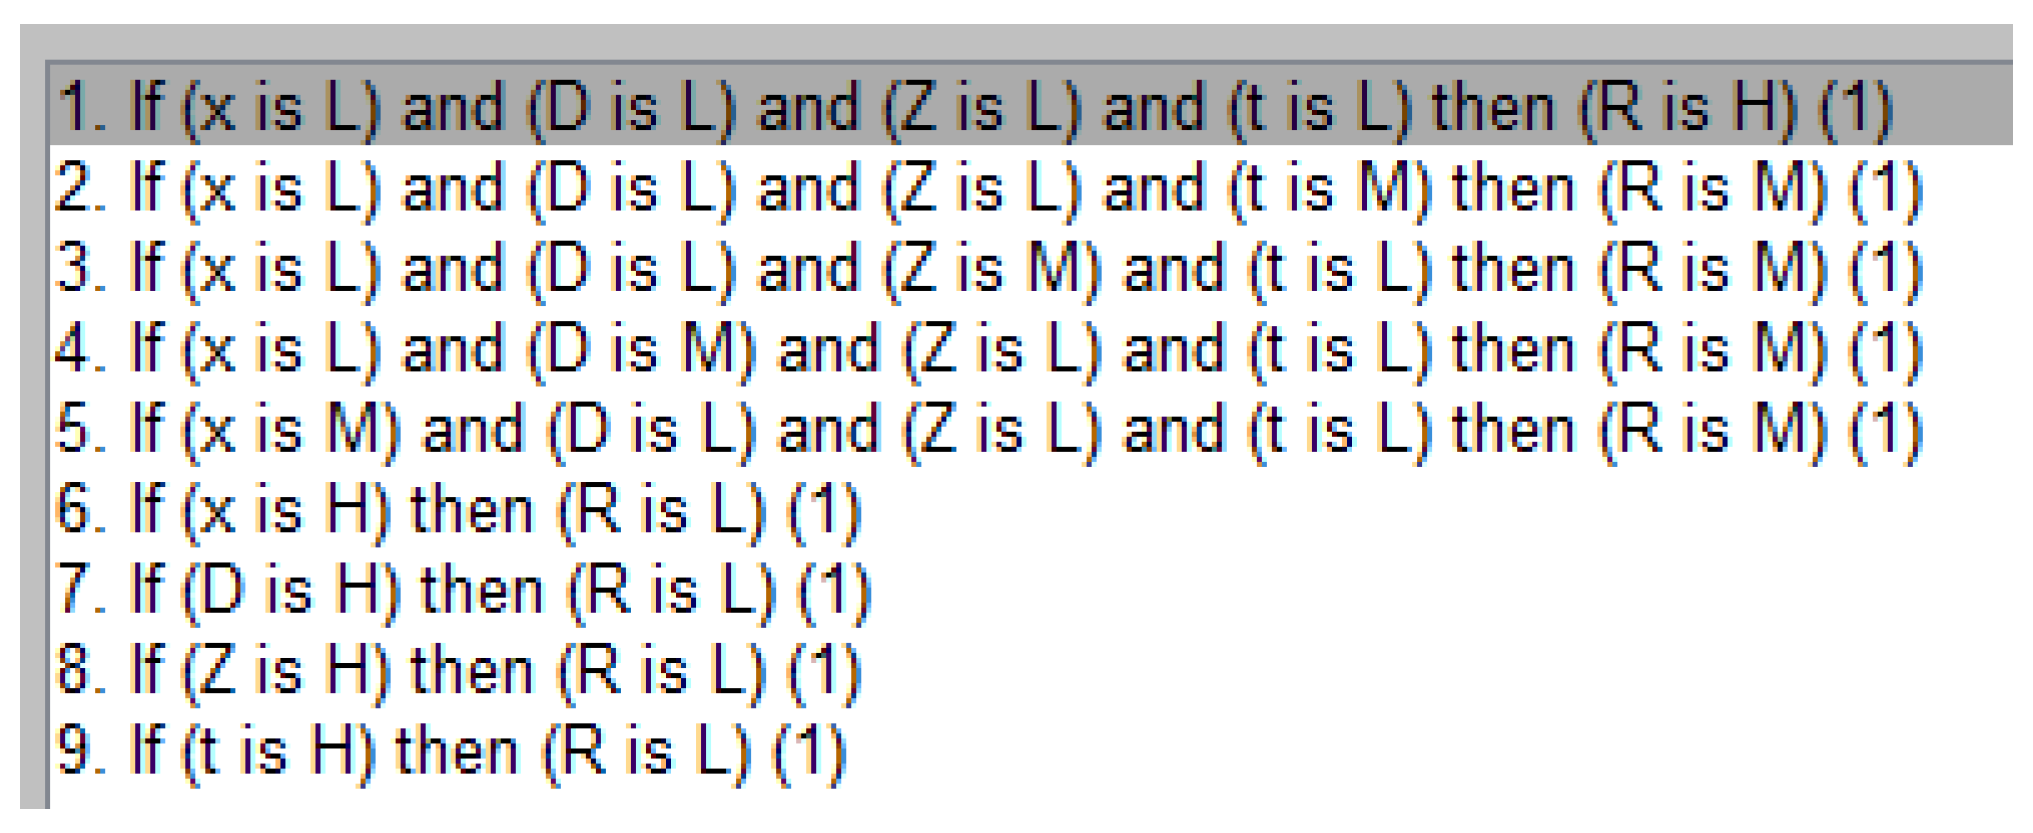
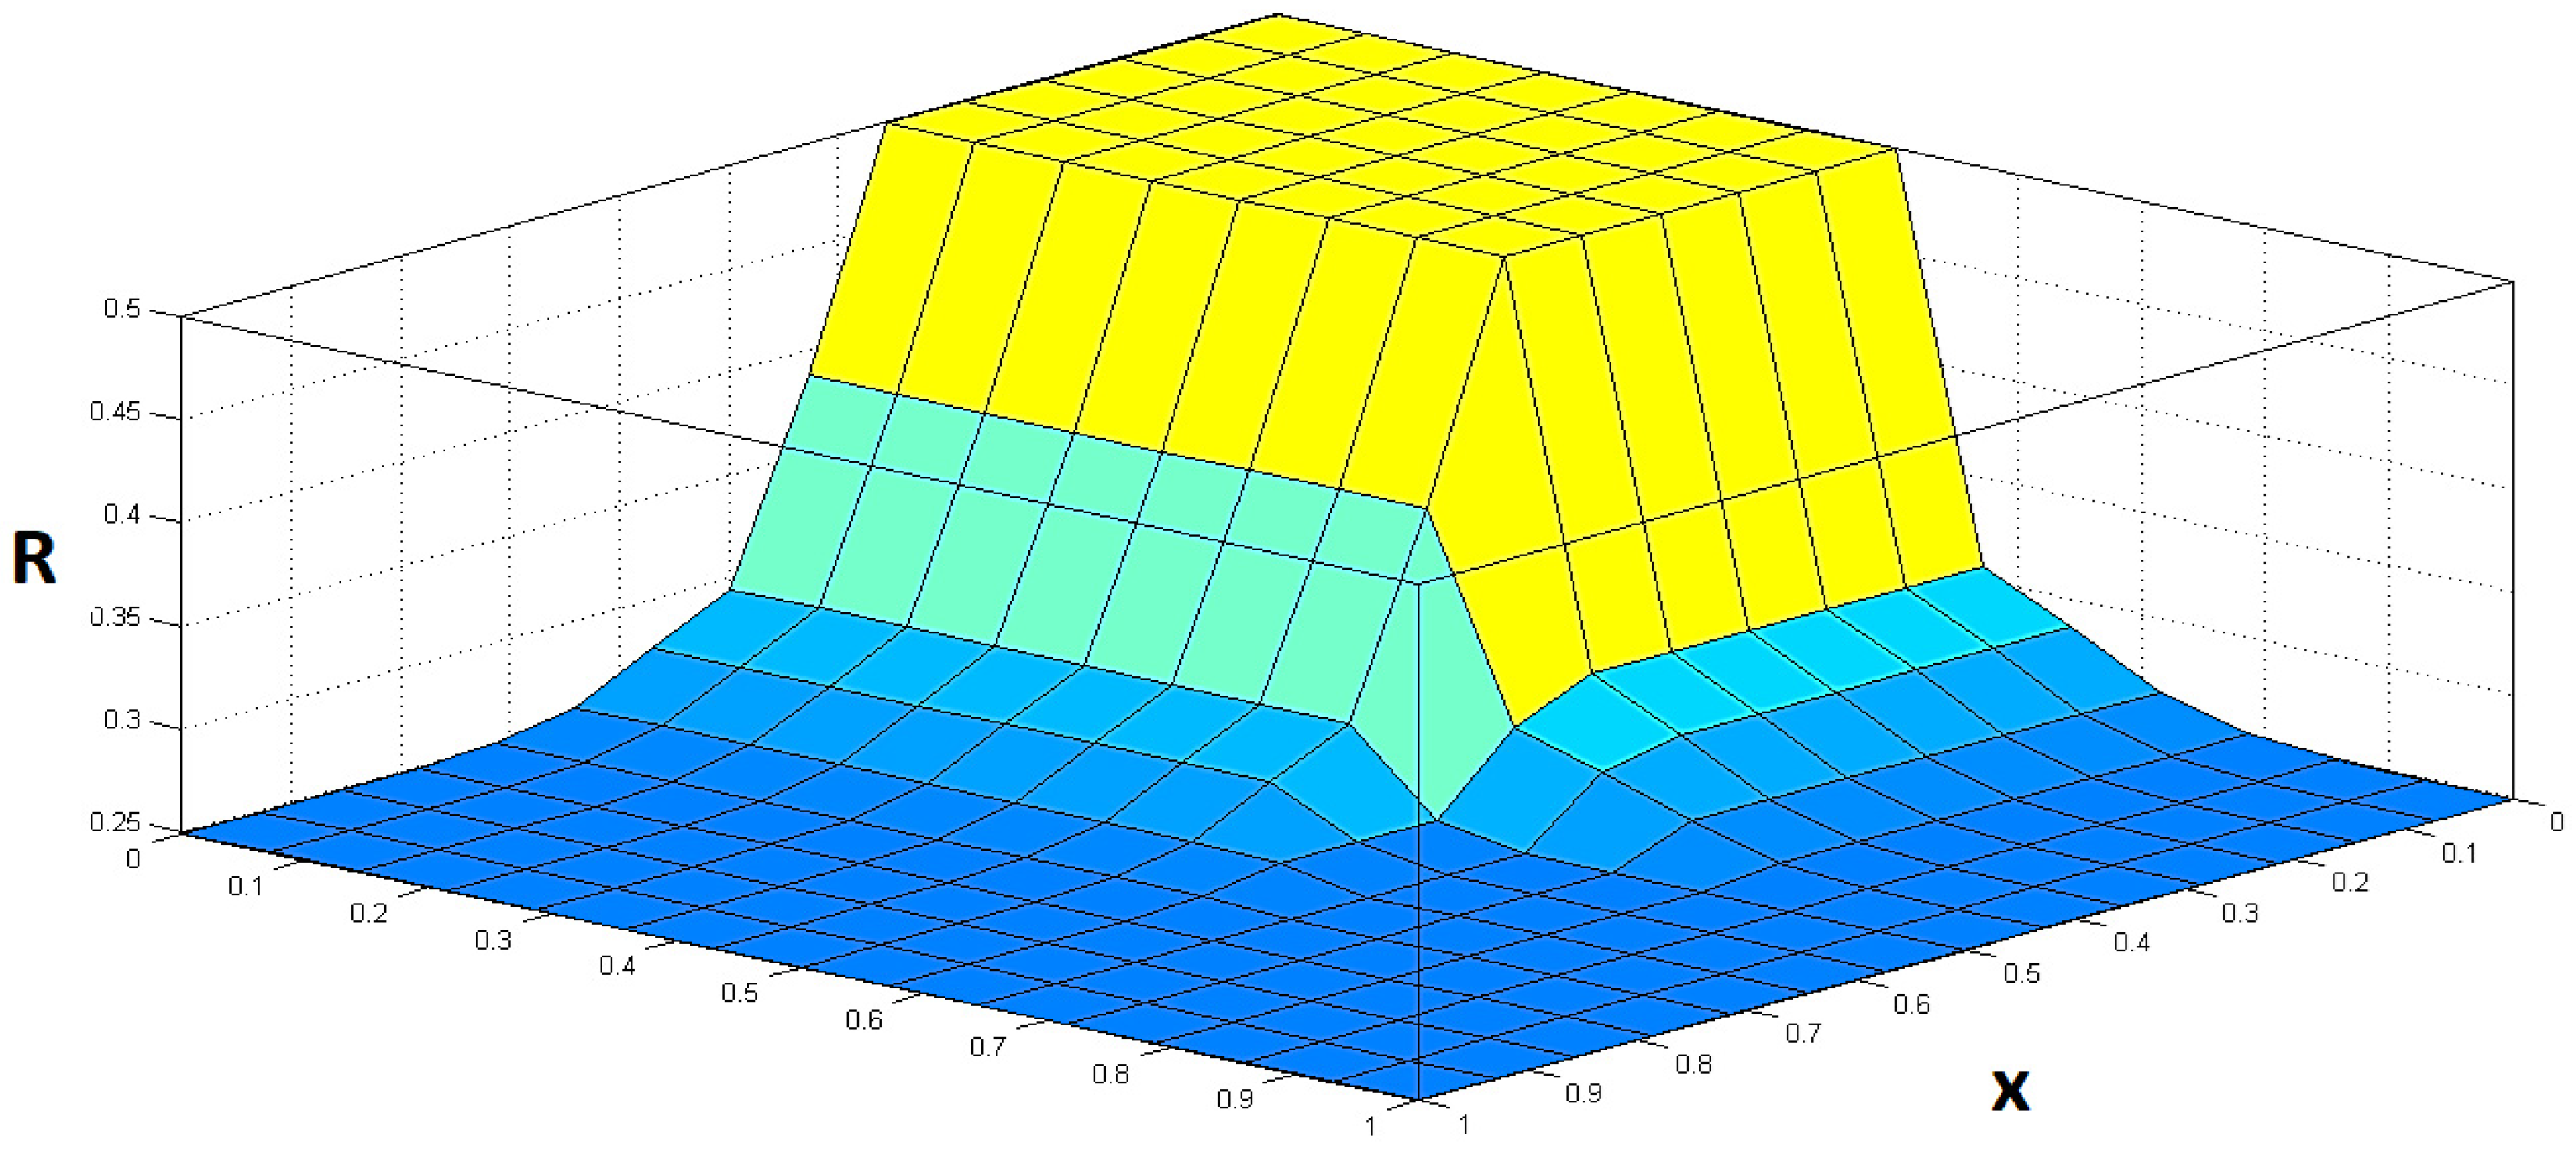
5. Development of a Fuzzy Inference System for Estimating the Residual Life

The fuzzy derivative system for estimating the residual resource is implemented on a fuzzy knowledge base of Mamdani type with input variables x, D, Z, and t. The scheme of the fuzzy inference system is shown in Figure 8.
The terms L, M, H of the input variables x, D, t are the same as in the fuzzy inference system for technical state evaluation. The example of the expressions L, M, H of the input variable Z is shown in Figure 9. The example of the expressions L, M, H of the output variable R is shown in Figure 10.
The system of fuzzy inference rules for the estimation of residual service life by combining the logical operators AND, OR is shown in Figure 11.
Figure 12 shows the response of the fuzzy surface derivation of the estimated residual life.

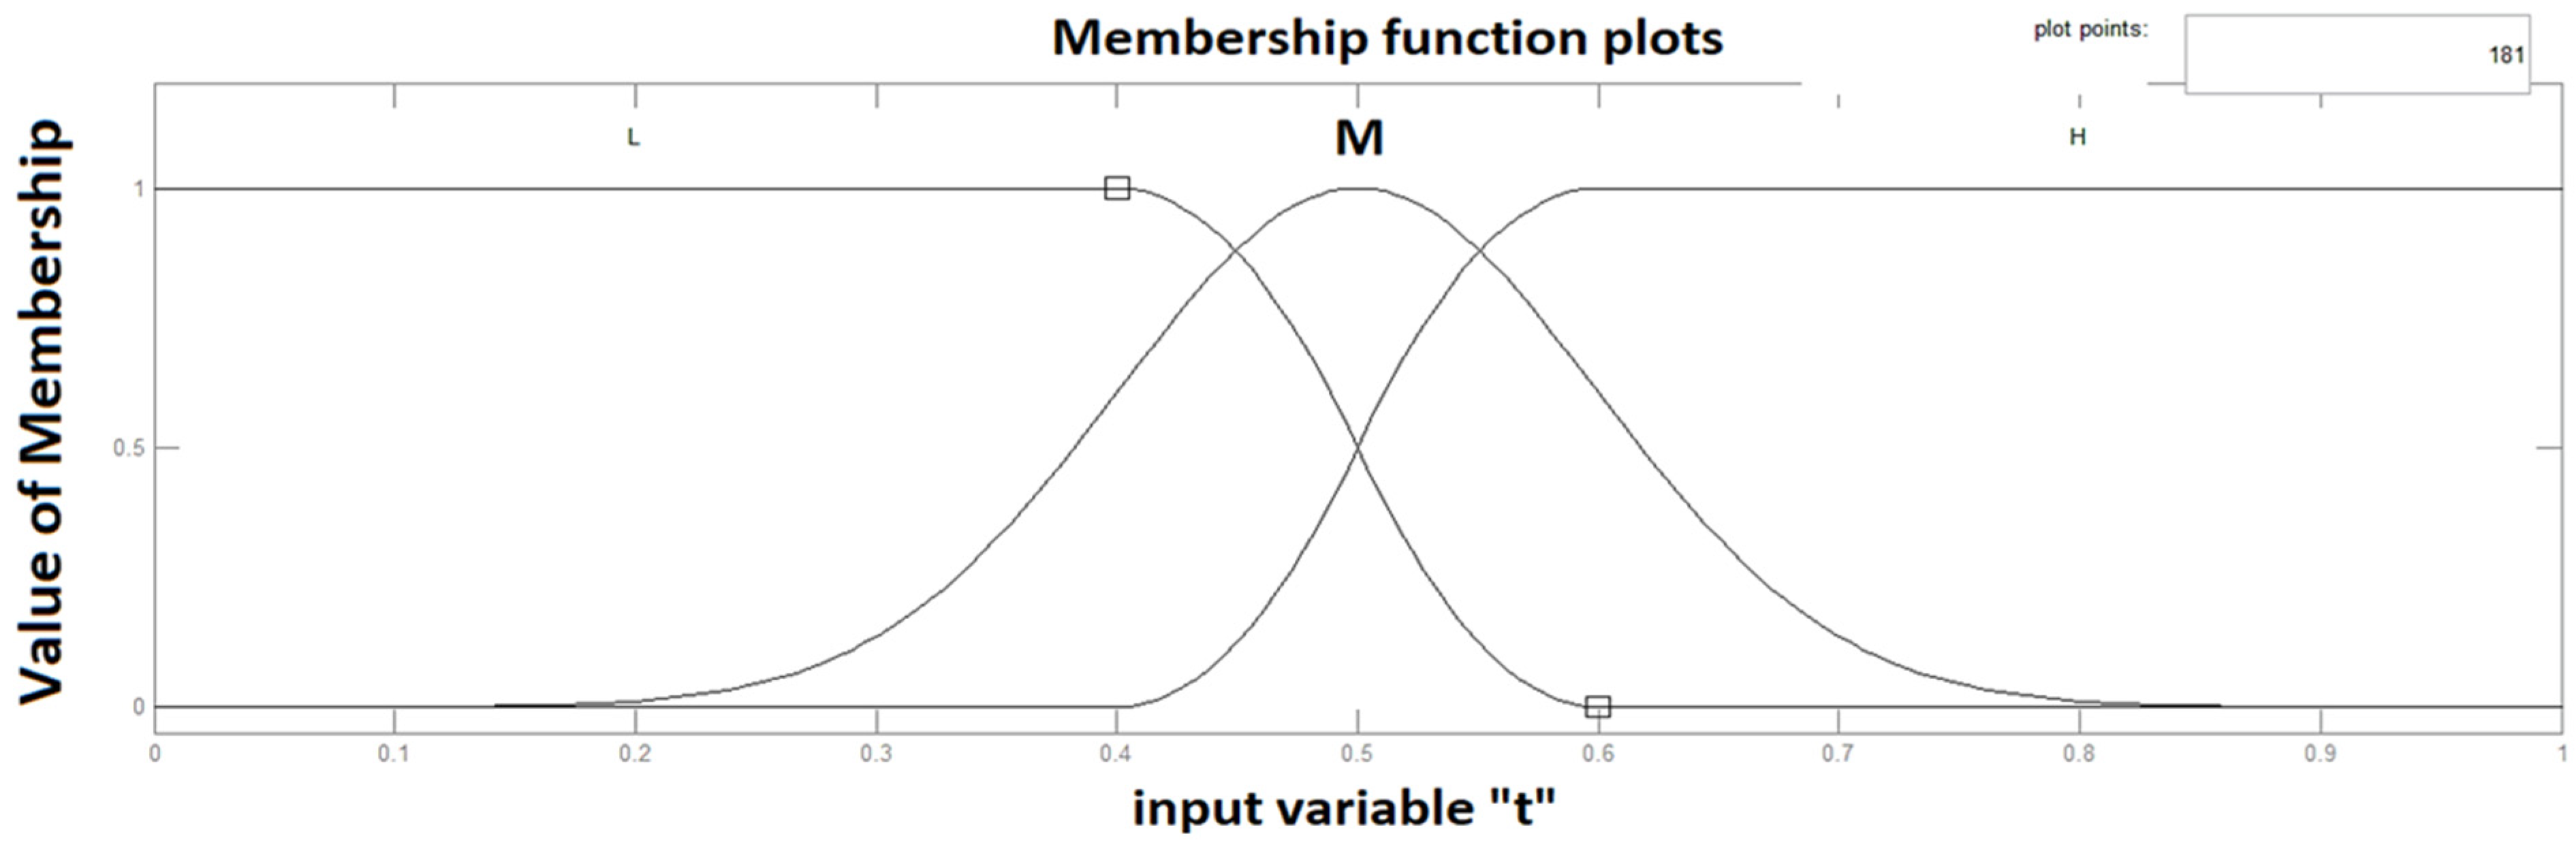
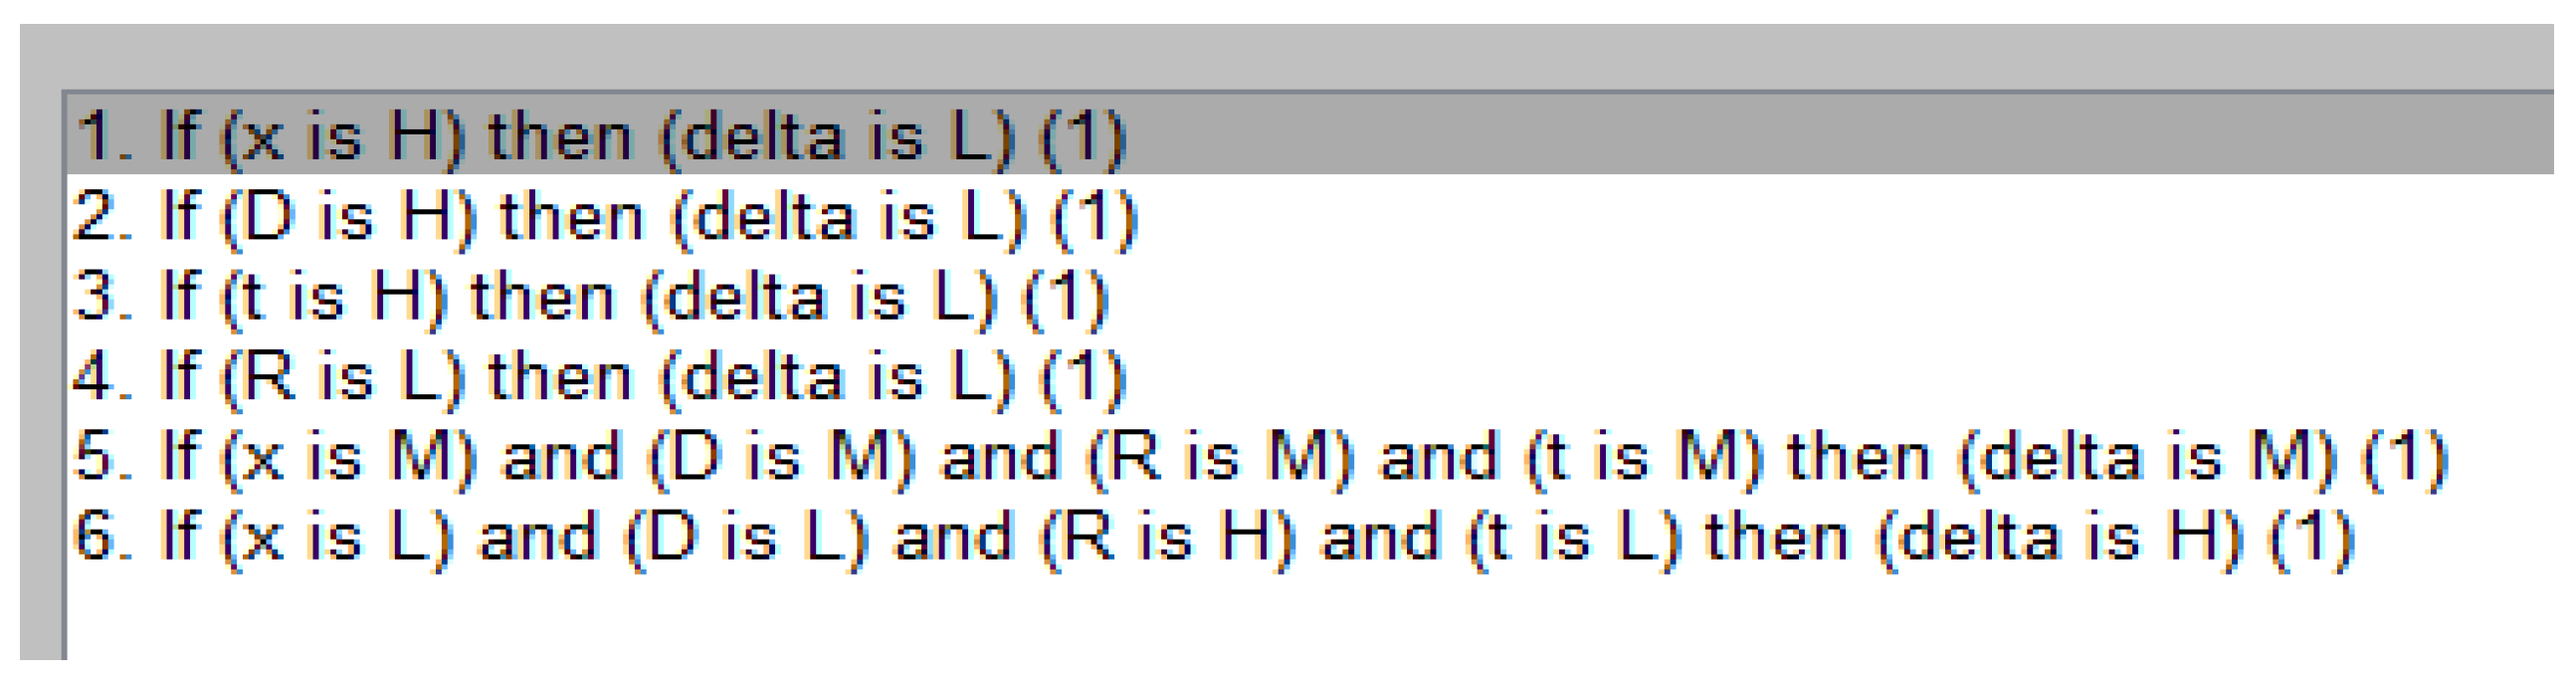
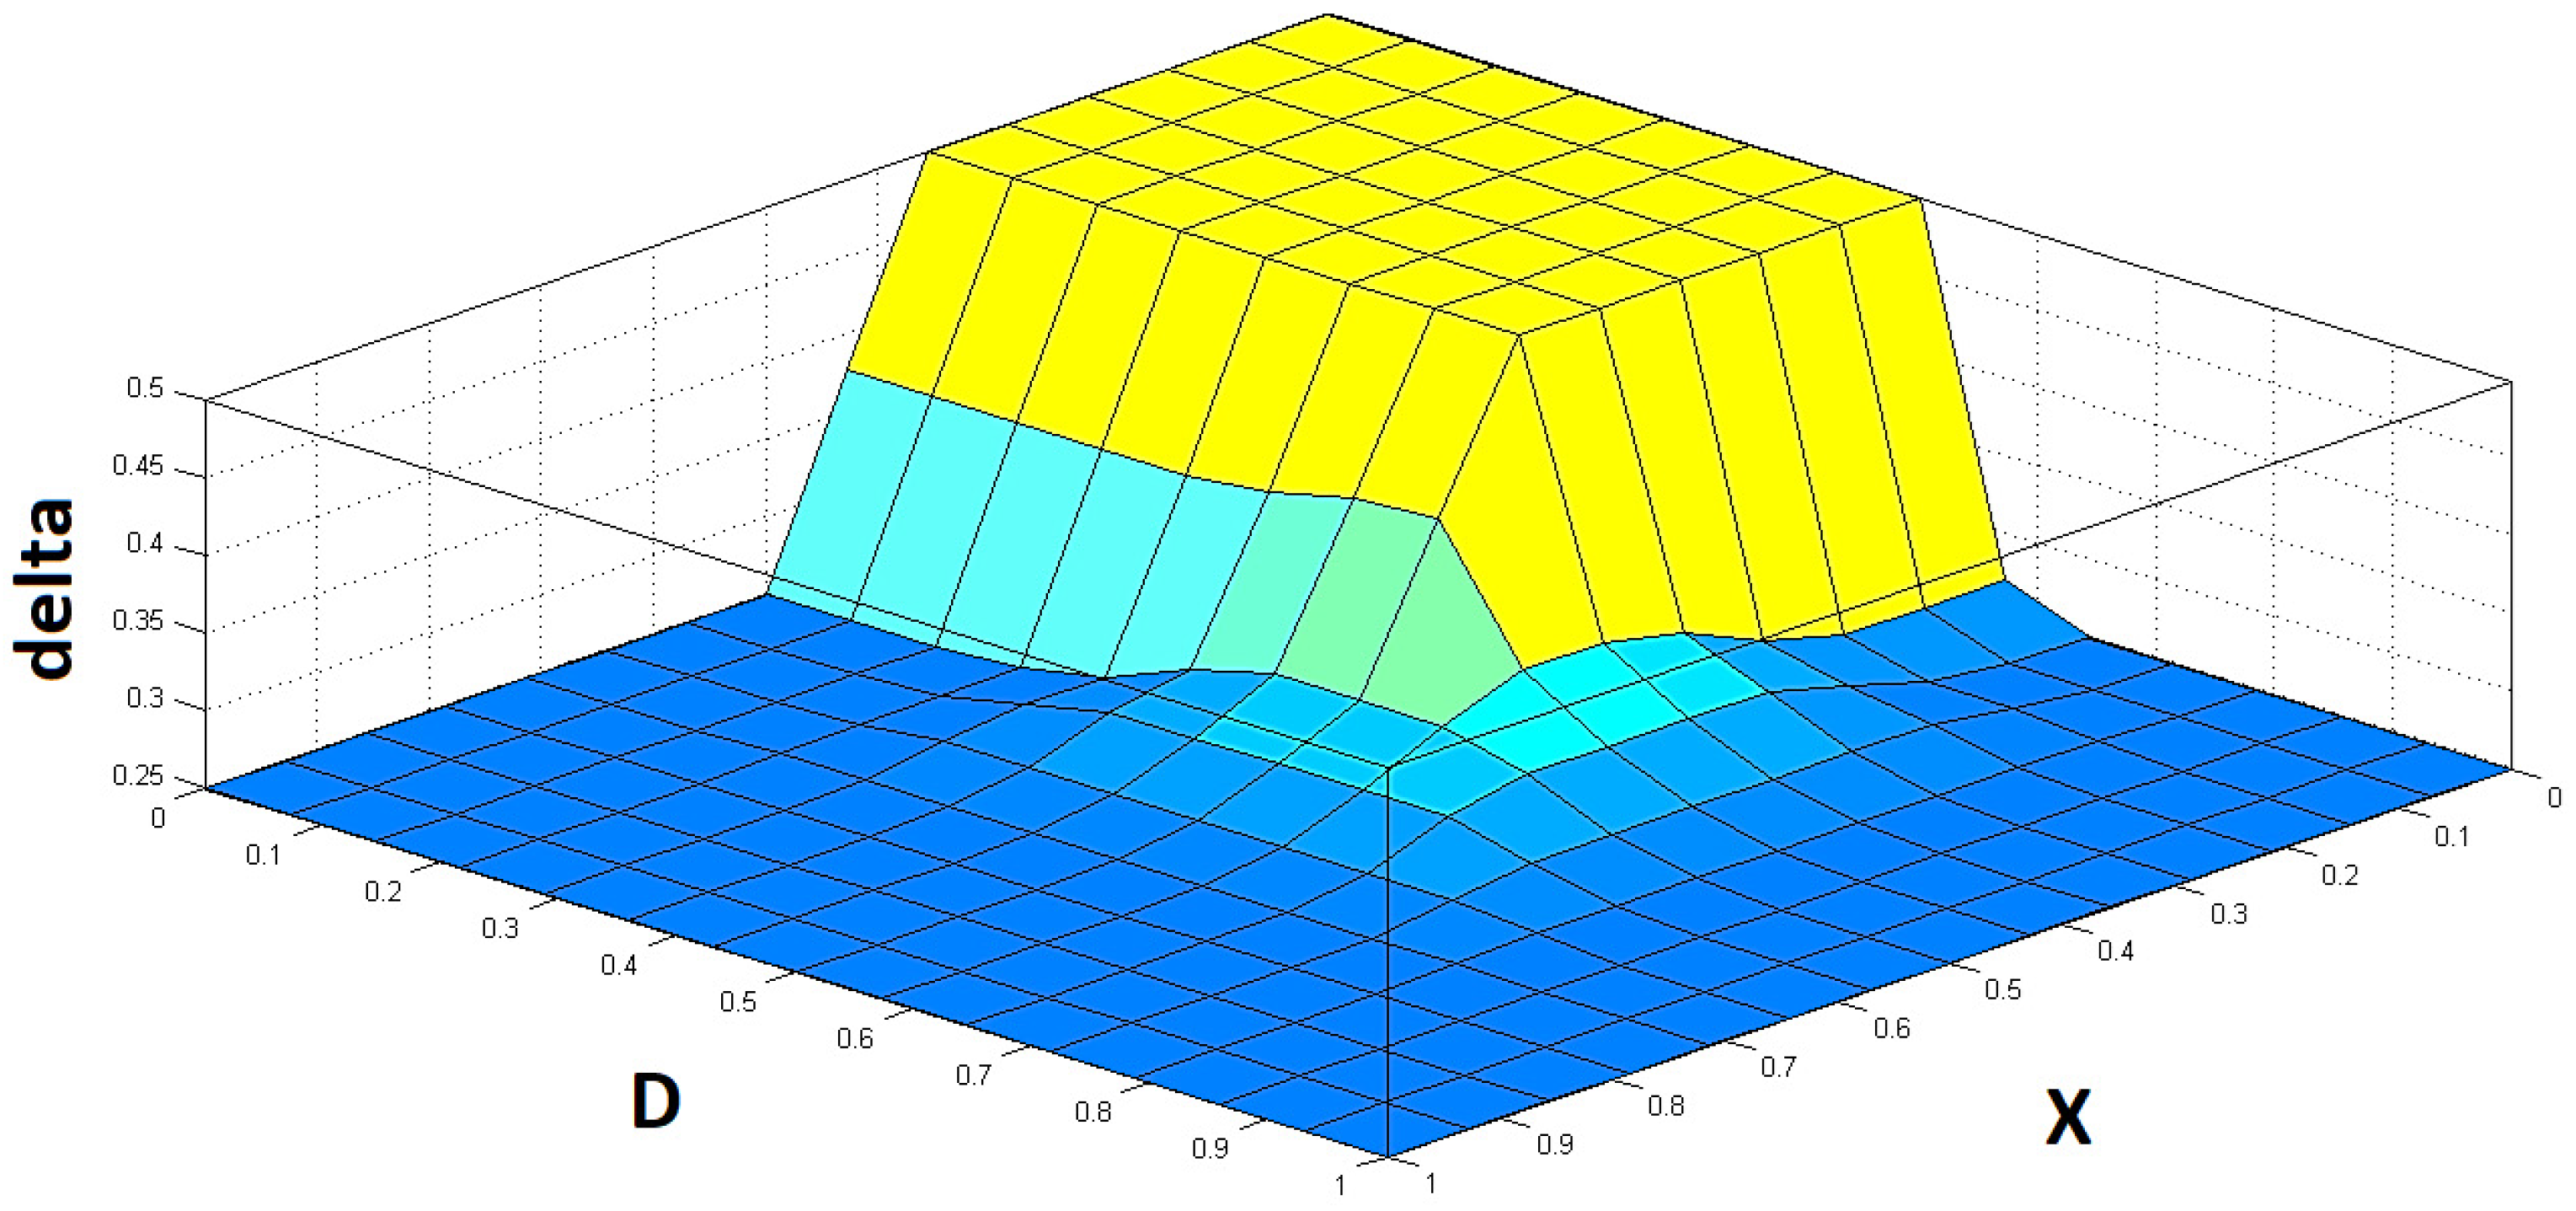
6. Development of a Fuzzy Inference System for Calculation of Drive Diagnostics Intervals

The fuzzy inference system for calculating diagnostic intervals is implemented on a fuzzy knowledge base, such as Mamdani, with input variables x, D, Z, and t. The schematic of the fuzzy inference system is shown in Figure 13.
The terms L, M, H of the input variables x, D, t are the same as in the fuzzy inference system for assessing the technical condition and residual life [29,30,31]. The example of the expressions L, M, H of the input variable R is shown in Figure 14. The example of the expressions L, M, H of the output variable delta is shown in Figure 15. The rules of fuzzy inference system to evaluate the diagnostic interval when combining logical operations AND, OR are shown in Figure 16. The response surface of the fuzzy inference system to evaluate the diagnostic intervals in combining logic operations AND, OR is shown in Figure 17.
Generally, obtained models for diagnostics and prediction of the residual lifetime of drives of technological systems and for calculation of diagnostic intervals based on fuzzy logic are tuned to each object. Creating a fuzzy base of rules (knowledge) with Mamdani consists of setting the variables of functions and weights of the rules and is done according to the methods of least squares, the fastest descent. The logic–linguistic model serves as a basis for the development of diagnostic algorithms [30,31].

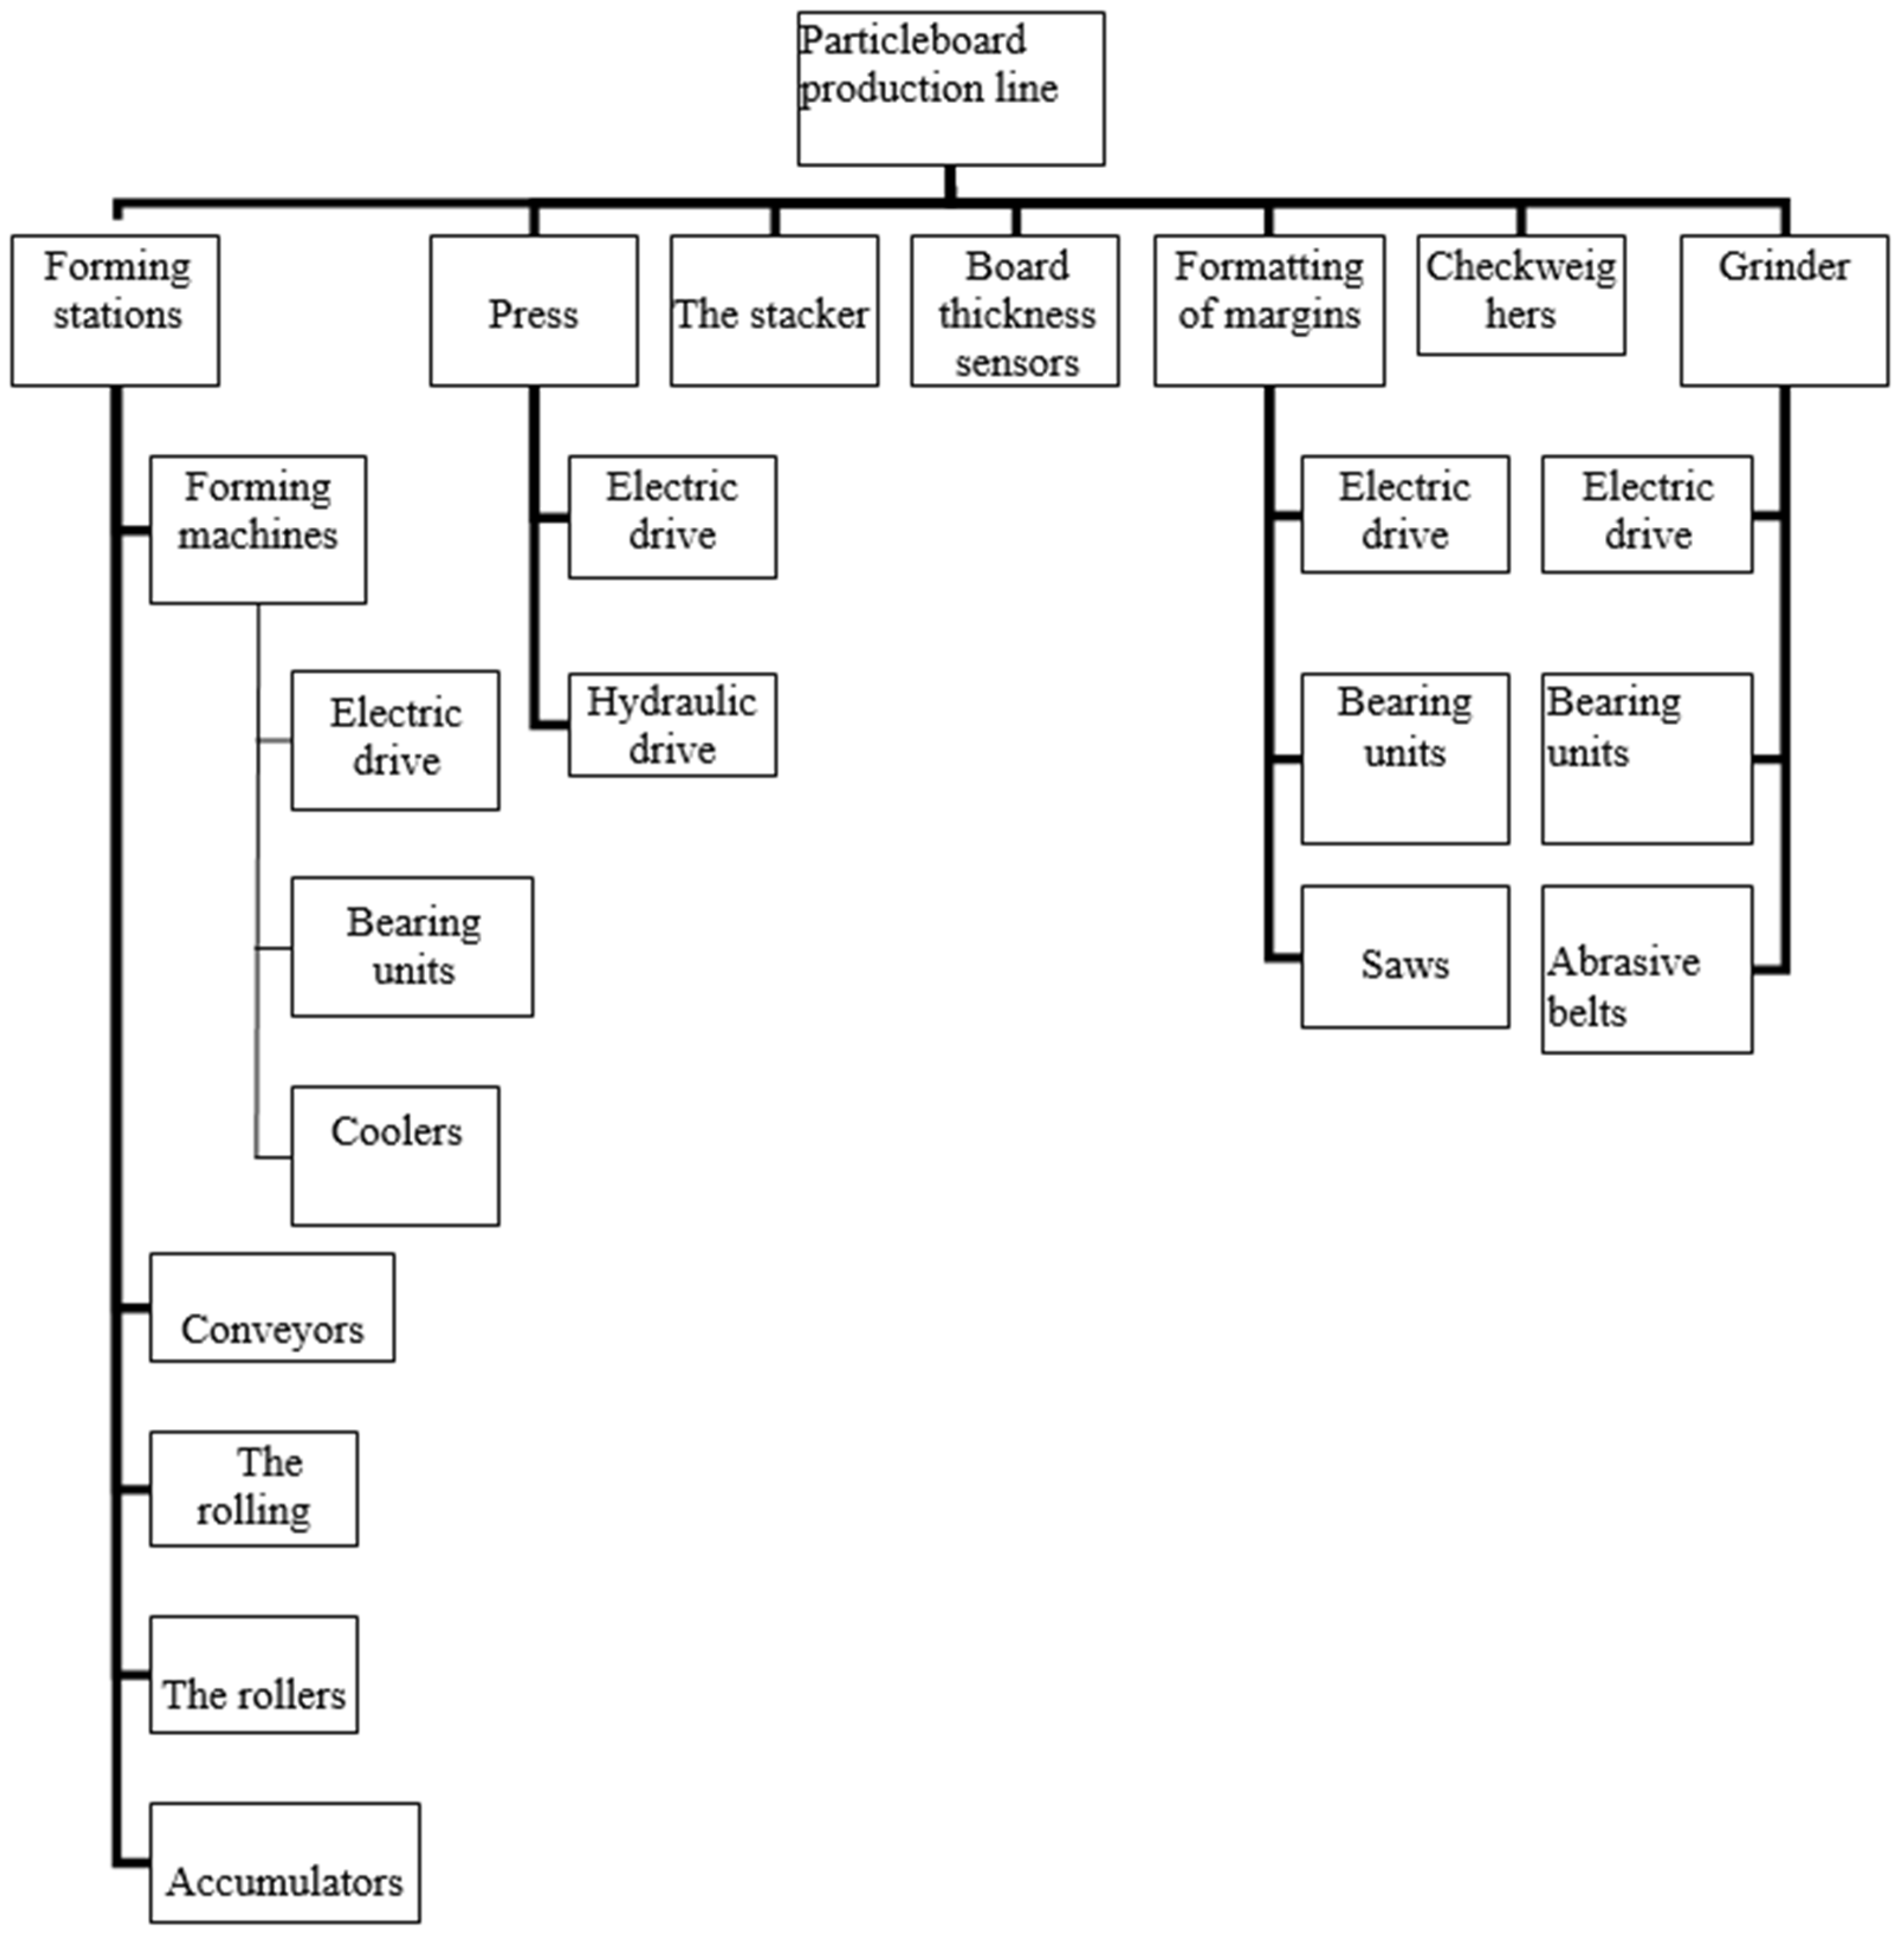
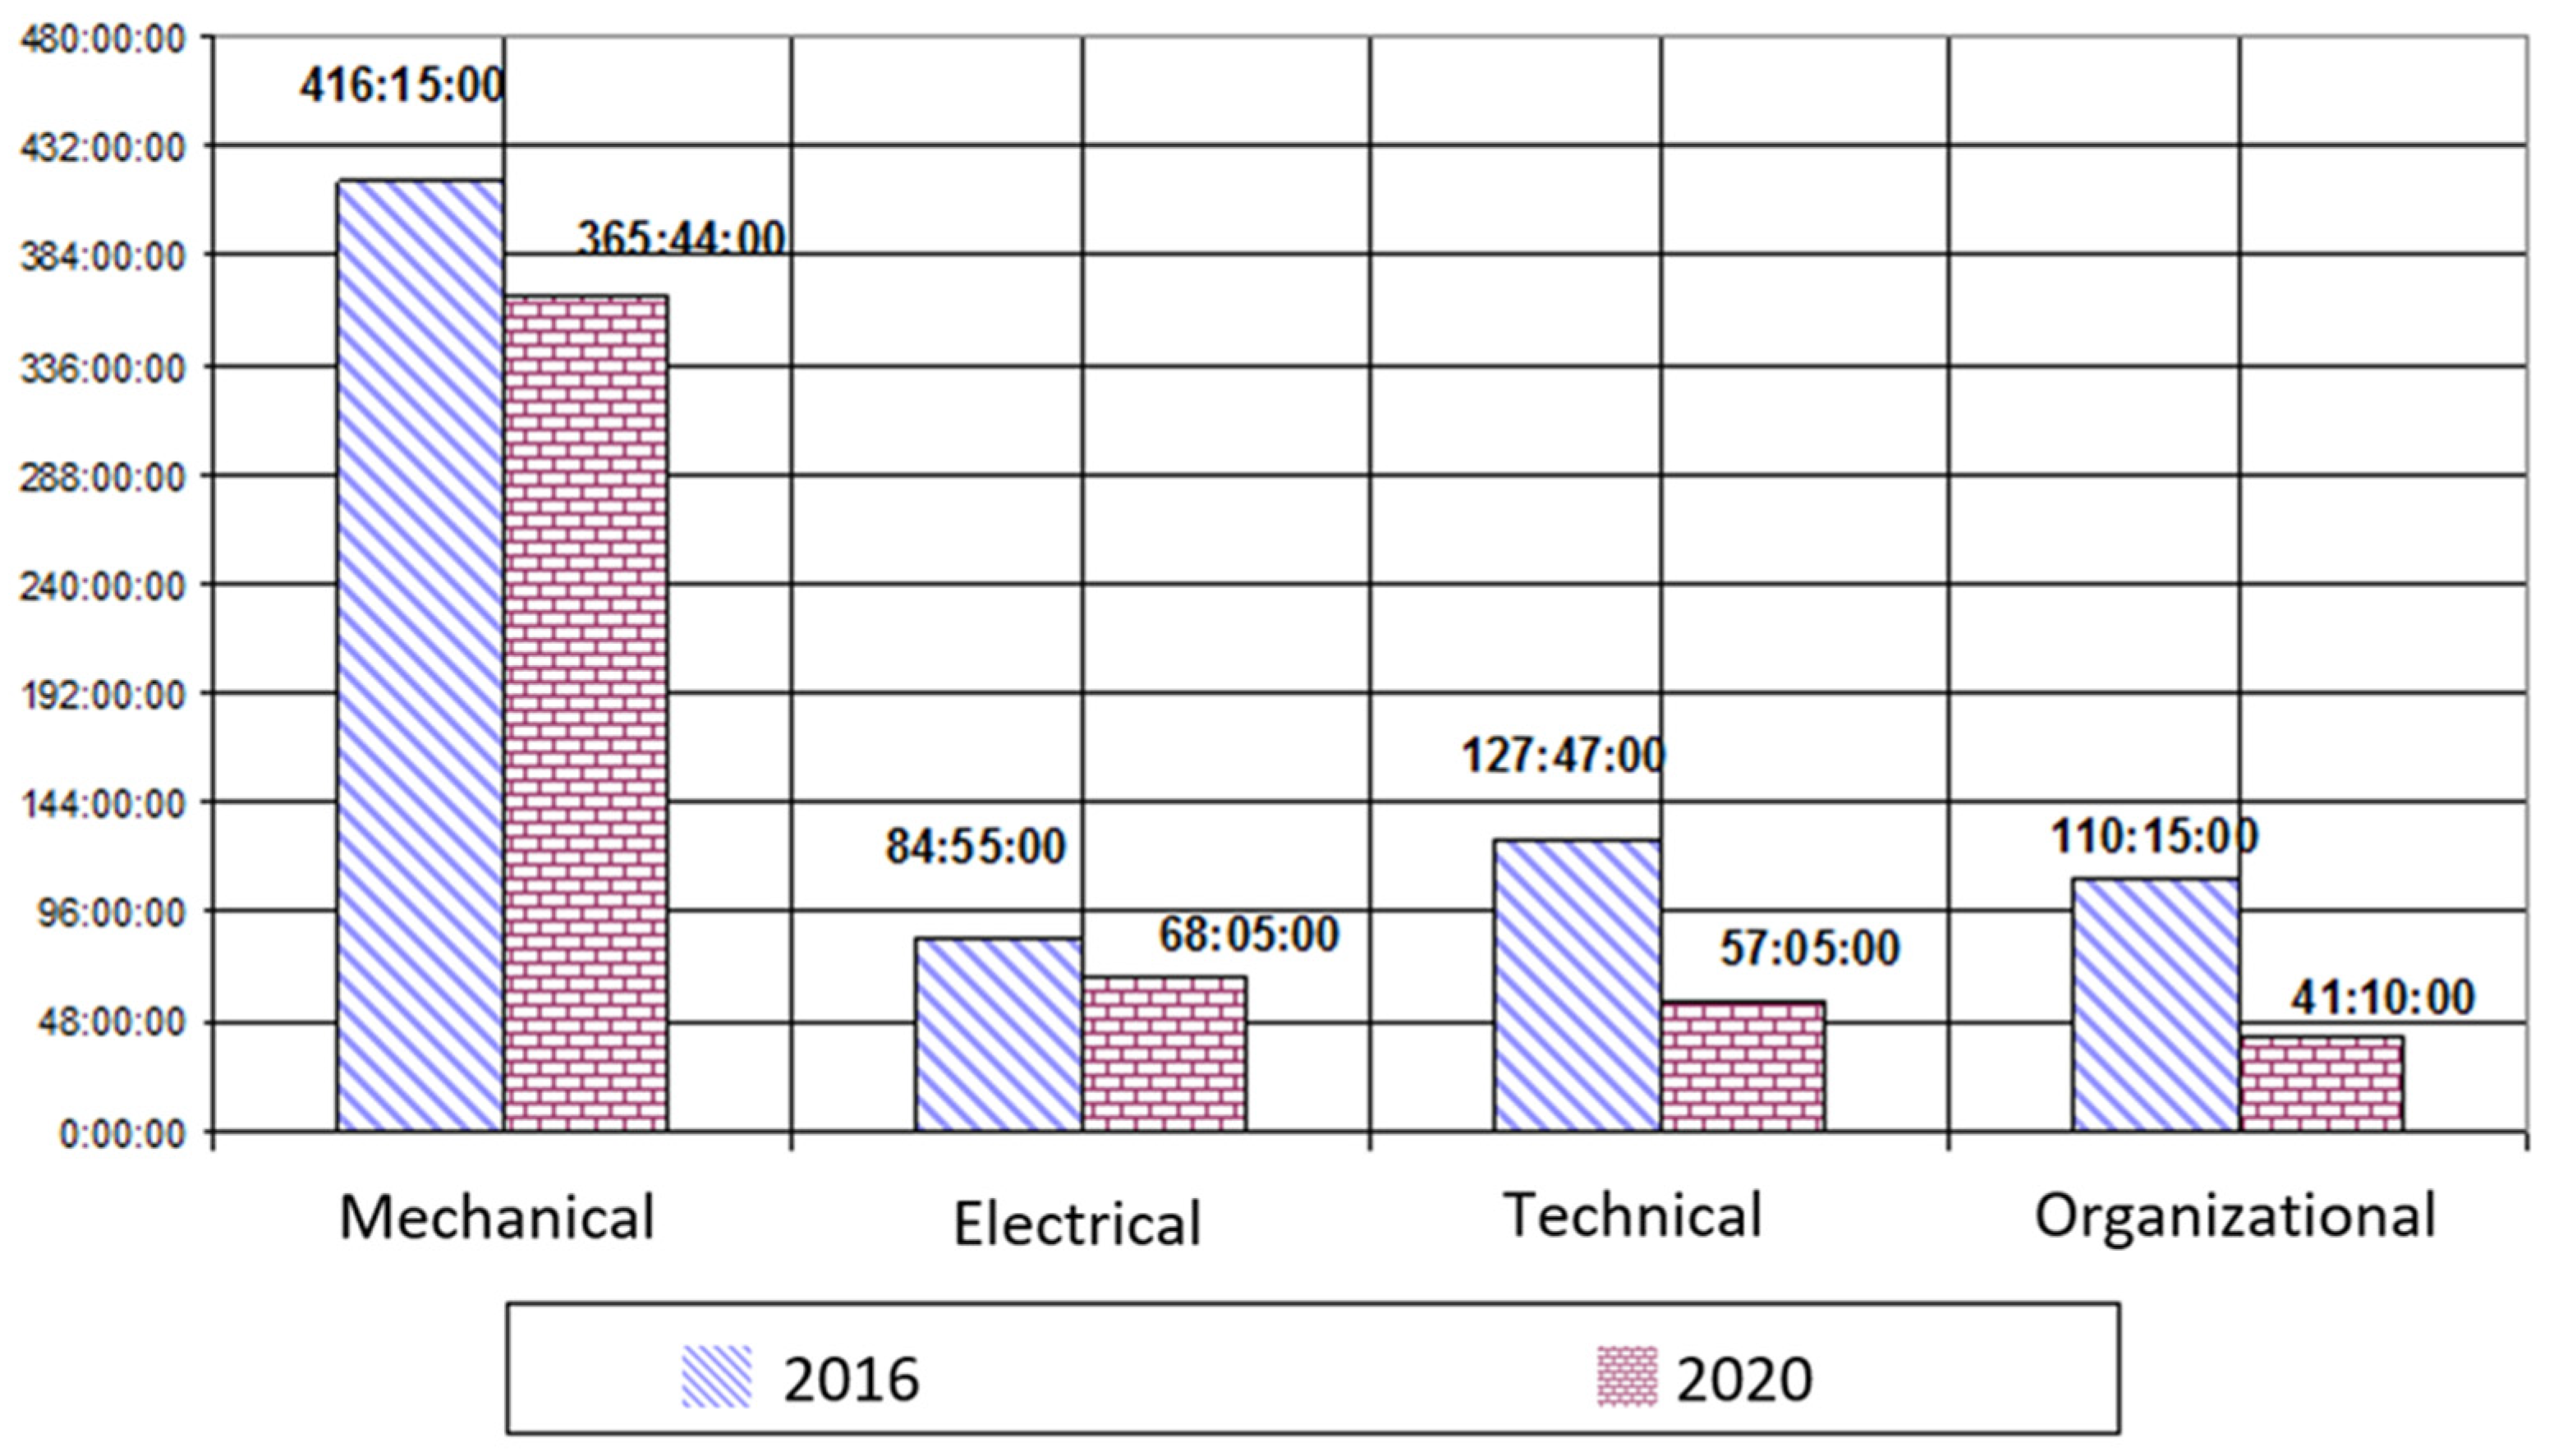
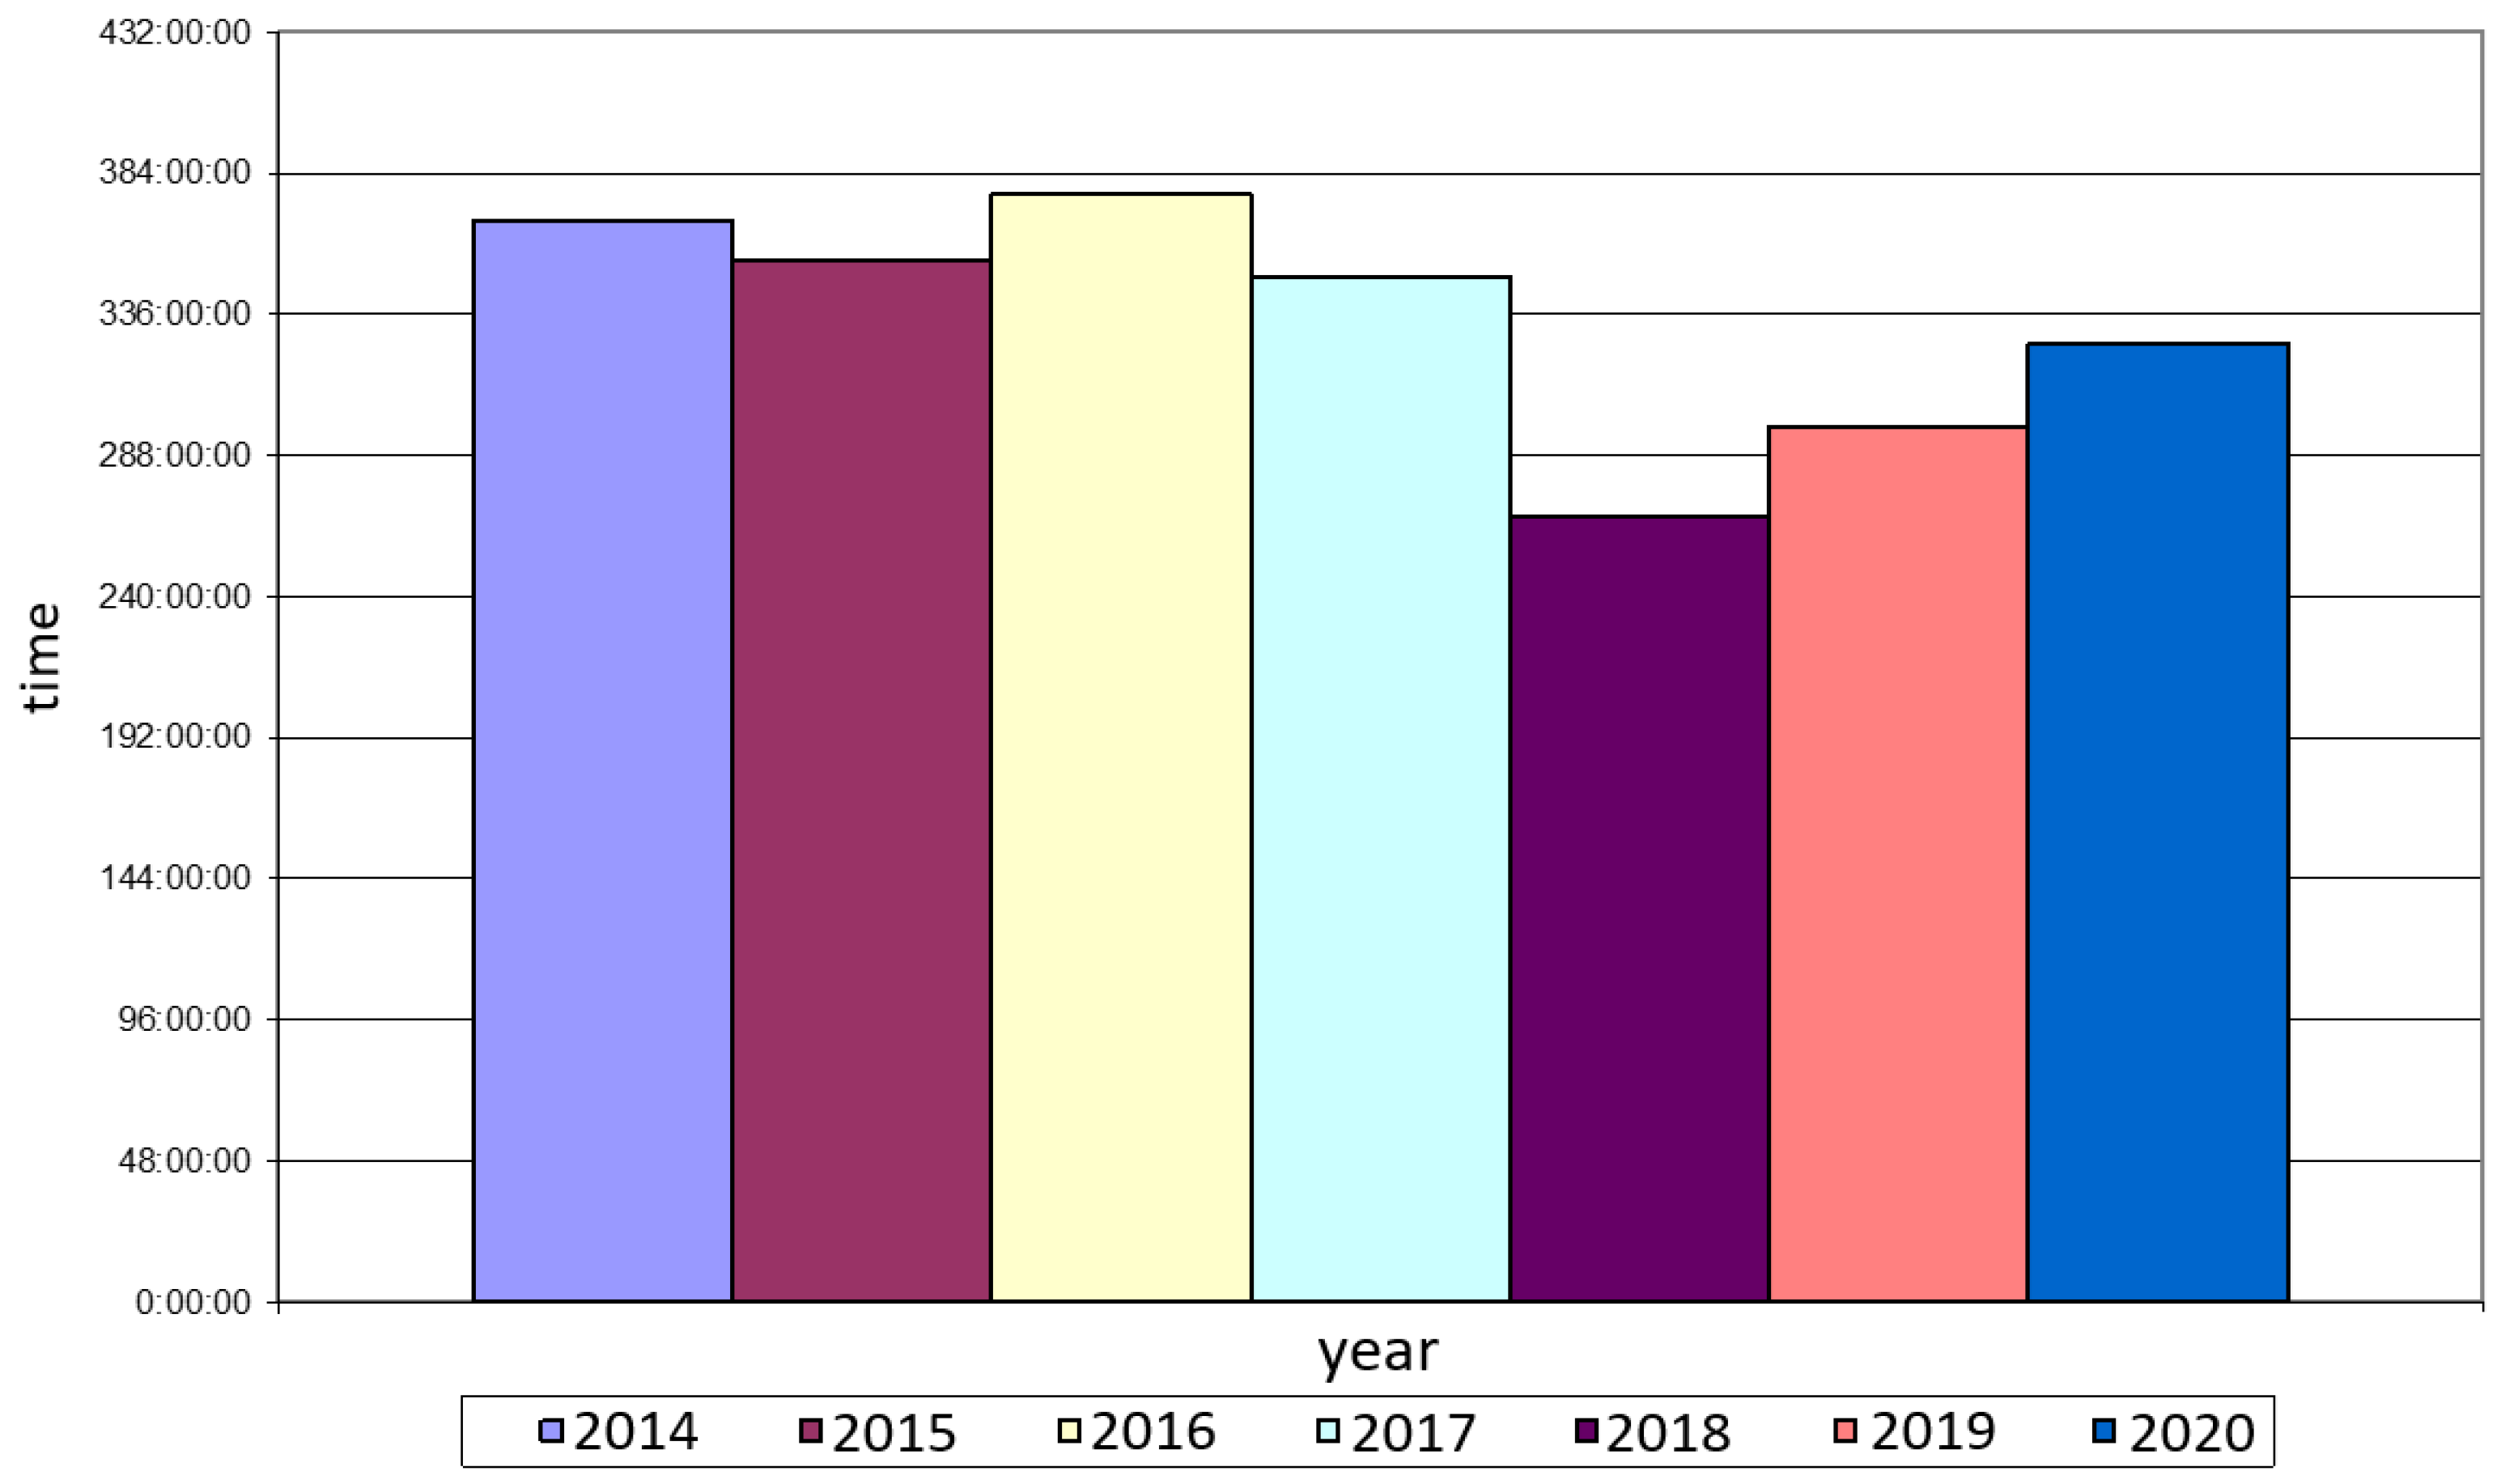
7. Experiments—Analysis of the Technological Equipment of the Line

The technological equipment of the chipboard production line at the plant Uvadrev-Holding represents the BISON WERKE automatic production line from Germany, which was put into production in the 1990s. In 2018, the production facilities were completely replaced [35].
The process of chipboard production begins with the production of a chipboard base, consisting of three layers of chips of different fractions. The plates already come together with a binder of a certain amount onto the conveyor belt from the molding machines, arranged one after the other. After the foundation has been formed, the upper layer is moistened by spraying with water and entering the two-level press to the upper level. The next layer enters the lower level of the press and the pressing is carried out according to a given program to achieve a certain thickness of slab [29]. When pressed, they exit the heater to the fan cooler where the hot plates are cooled in one cycle of the device. Furthermore, the finished board is fed to a molding machine, at the output of which the correct thickness is controlled by the sensors. The last operations are weighing the finished plate and grinding it on several grinders. The finished plate is sorted and stacked. For each operation, a certain device is used which is powered by electric drives, and which also consists of different units and parts. The flow chart of the production line is shown in Figure 18. The chipboard manufacturing process is controlled by the SCADA “Trace Mode 6” system [36]. At a lower control level, Omron programmable logic controllers are programmable. A series of inductive sensors, optical sensors, encoders, laser sensors, and temperature and weight sensors are used as feedback sensors. Frequency control is used to control electric induction motors.
A list of the drive equipment of the chipboard forming machine is shown in Table 1. The power and synchronous frequency of the electric motors are shown in Table 2.
The downtime tables show exactly which production failures occur during an emergency production stop. Figure 19 shows a comparison of downtime in 2016 and 2020 for the Bizon production line. Downtime analysis shows that they occur most often as a result of mechanical component accidents.
The basis of the analysis of the components of the chipboard production line was data from the log of performed work, in which information about the performed repair work was recorded. A sample including data from 2016 to 2020 was compiled.
An analysis of equipment reliability over a period of 5 years shows that, due to wear, a large proportion of failures occur: roller bearings, chain drives, electric motors, while nodes generate, on average, no more than 50% warranty and 18.2% overhaul life. At the same time, the operation of the equipment shows that, under favorable operating conditions of the drives (quality assembly, adherence to the rules of technical operation, etc.), they will fully develop warranty, repair, and even the total estimated service life [33,34]. The specificity of failures caused by the destruction of an element (rolling bearing, electric motor) is that such failures mean the replacement of whole units of the device without the possibility of further recovery, which is the most expensive operation. At the same time, product losses and labor costs during emergency shutdowns and failures in the general operating mode are unconditional. All this determines the urgency of the problem of drive diagnostics that determine the reliability and durability of technological equipment. Plant “Uvadrev” chose the scheduled preventive repair time once a week. At the same time, all equipment is stopped for repairs and maintenance. Repair is conducted by the workshop’s lead mechanic, who decides to replace one or the other part of the equipment. Any planned lubrication or cleaning work is also performed. At the end of each work, each shift performs a number of certain operations, such as cleaning the equipment, lubricating certain components, putting the equipment into operation, and all activities are also recorded. Figure 20 shows the time spent on planned preventive maintenance of the technological equipment between 2014 and 2020.
The analysis of the time spent on planned preventive maintenance of technological equipment makes it possible to conclude that, after the modernization of equipment in 2018, the repair time was reduced from 350 h to 260 h per year (26%). Since 2019, there is a tendency to increase repair time by 30 h each year.

8. Conclusions

In recent years, special attention has been paid to specialized methods that can be used to automatically diagnose machines or their components. First of all, these are methods of diagnosing rolling bearings according to the vibration mantle spectrum, which are excited by frictional forces in the diagnosed assembly. The first and most complete system of automatic rolling bearing diagnostics using these methods was developed in 2014 by experts from VibroAcoustical Systems and Technologies.
At present, automatic systems for the diagnosis of gears, especially gearboxes, are being developed based on individual vibration measurements. There are prerequisites for developing such diagnostic systems for pump and turbine impellers [38]. All of them are based on IT capabilities and complemented by information spectral technology. It is expected that diagnostic systems for AC machines will be developed in the near future using simple vibration measurements. Diagnostic rules are continually modified as information about a particular monitoring object is collected. Initially, all known diagnostic characteristics are used and, after the addition of statistical material, rules for qualitative changes to the most informative vibration characteristics and operating mode indicators for specific failures or group of failures are established [27,28]. After obtaining reference vibration characteristics and informative operating mode indicators for all major object status classes (for a possible list of operating mode change failures and structural parameters characterizing its technical condition), diagnosis can be performed by comparing the most current informative diagnostic parameters with standard and determining possible object conditions (i.e., determine the nature of the failure and the list of possible errors).
This article proposes a methodology for diagnosing technical systems and determining their residual life on the basis of fuzzy logic. Currently, such a system of technical diagnostics, which would estimate the current technical state of equipment and provide early detection of possible defects, as well as predict their development in the future, has not yet been created. Modern diagnostic methods are based on mathematical models, which do not reflect all possible signs of developing defects. Therefore, the task of using a heuristic approach based on artificial intelligence methods, namely, the theory of fuzzy sets becomes relevant. All of the above confirm the need to develop diagnostic models and methods for assessing the current technical state of equipment based on artificial intelligence technology.
The authors plan to develop a diagnostic system that works in real time, transmitting data from sensors to cloud storage, where this information is processed and analyzed. This approach involves creating digital twins of real drives, with which we can determine the current technical state of drivers, predict failures, and plan repairs.
The scientific novelty of the work lies in the fact that a new diagnostic model for determining equipment defects and predicting its service life, based on a system of equations with fuzzy cause–effect relations, is developed.

Author Contributions

Conceptualization, I.K. (Ivana Klačková) and I.K. (Ivan Kuric); methodology, all authors.; software, I.Z.; validation, I.K. (Ivana Klačková), M.C. and Y.R.N.; formal analysis, K.T.; resources, I.K. (Ivana Klačková); writing—original draft preparation, I.K. (Ivana Klačková); writing—review and editing, I.K. (Ivan Kuric) and K.T.; visualization, I.Z.; project administration, I.K. (Ivana Klačková); funding acquisition, M.C. All authors have read and agreed to the published version of the manuscript.

Funding

This work was supported by the Slovak Research and Development Agency under the contract No. APVV-16-0283.

Institutional Review Board Statement

Not applicable.

Informed Consent Statement

Not applicable.

Data Availability Statement

Not applicable.

Conflicts of Interest

The authors declare no conflict of interest.

References

  1. Turygin, Y.; Bozek, P.; Abaramov, I.; Nikitin, Y. Reliability Determination and Diagnostics of a Mechatronic System. Adv. Sci. Technol. 2018, 12, 274–290. [Google Scholar] [CrossRef]
  2. Pástor, M.; Živčák, J.; Púškár, M.; Lengvarský, P.; Klačková, I. Application of Advanced Measuring Methods for Identification of Stresses and Deformations of Automotive Structures. Appl. Sci. 2020, 10, 7510. [Google Scholar] [CrossRef]
  3. Božek, P.; Nikitin, Y.; Krenický, T. Diagnostics of Mechatronic Systems; Studies in Systems, Decision and Control; Springer Nature: Cham, Switzerland, 2021; 160p, ISBN 978-3-030-67055-9. [Google Scholar] [CrossRef]
  4. Nikitin, Y.R. Diagnostics of BLDC motor winding based on a model approach in the state space. IOP Conf. Ser. Mater. Sci. Eng. 2020, 971, 042101. [Google Scholar] [CrossRef]
  5. Nikitin, Y.; Božek, P.; Peterka, J. Logical-linguistic Model of Diagnostics of Electric Drivers with Sensors Support. Sensors 2020, 20, 4429. [Google Scholar] [CrossRef]
  6. Peterka, J.; Nikitin, Y.R.; Bozek, P. Diagnostics of automated technological devices. MM Sci. J. 2020, 2020, 4027–4034. [Google Scholar] [CrossRef]
  7. Kuric, I.; Císar, M.; Tlach, V.; Zajačko, I.; Gál, T.; Więcek, D. Technical Diagnostics at the Department of Automation and Production Systems. In Intelligent Systems in Production Engineering and Maintenance; Advances in Intelligent Systems and Computing; Springer: Cham, Switzerland, 2019; pp. 474–484. [Google Scholar]
  8. Sága, M.; Bulej, V.; Čuboňova, N.; Kuric, I.; Virgala, I.; Eberth, M. Case study: Performance analysis and development of robotized screwing application with integrated vision sensing system for automotive industry. Int. J. Adv. Robot. Syst. 2020, 17, 1–23. [Google Scholar] [CrossRef]
  9. Figiel, A.; Klačková, I. Safety requirements for mining complexes controlled in automatic mode. Acta Montan. Slovaca 2020, 25, 417–426. [Google Scholar]
  10. Ding, S.X.; Li, L.; Krüger, M. Application of randomized algorithms to assessment and design of observer-based fault detection systems. Automatica 2019, 107, 175–182. [Google Scholar] [CrossRef]
  11. Costa, B.S.J. Fuzzy Fault Detection and Diagnosis. In Handbook on Computational Intelligence: Volume 1: Fuzzy Logic, Systems, Artifical Neural Networks and Lerning Systems; World Scientific Publishing Co. Pte. Ltd.: Singapore, 2016; pp. 251–288. [Google Scholar]
  12. Kuric, I.; Tlach, V.; Císar, M.; Ságová, Z.; Zajačko, I. Examination of industrial robot performance parameters utilizing machine tool diagnostic methods. Int. J. Adv. Robot. Syst. 2020, 17. [Google Scholar] [CrossRef]
  13. Luo, H. Plug-and-Play Monitoring and Performance Optimization for Industrial Automation Processes; Springer Fachmedien Wiesbaden Gmb.: Wiesbaden, Germany, 2017; 158p. [Google Scholar]
  14. Nemeth, M.; Peterkova, A. Proposal of data acquisition method for industrial processes in automotive industry for data analysis according to Industry 4.0. In Proceedings of the 2018 IEEE 22nd International Conference on Intelligent Engineering Systems (INES), Las Palmas de Gran Canaria, Spain, 21–23 June 2018; pp. 157–161. [Google Scholar]
  15. Nemeth, M.; Nemethova, A.; Michalconok, G. Determination issues of data mining process of failures in the production systems. In Artificial Intelligence Methods in Intelligent Algorithms; Advance in Intelligent Systems and Computing; Springer: Cham, Switzerland, 2019; Volume 985, pp. 200–207. [Google Scholar]
  16. Qiu, C.; Wu, X.; Xu, C.; Qiu, X.; Xue, Z. An Approximate Estimation Approach of Fault Size for Spalled Ball Bearing in Induction Motor by Tracking Multiple Vibration Frequencies in Current. Sensors 2020, 20, 1631. [Google Scholar] [CrossRef] [Green Version]
  17. Iheukwumere-Esotu, L.; Yunusa-Kaltungo, A. Knowledge Criticality Assessment and Codification Framework for Major Maintenance Activities: A Case Study of Cement Rotary Kiln Plant. Sustainability 2021, 13, 4619. [Google Scholar] [CrossRef]
  18. Sivák, P.; Frankovský, P.; Delyová, I.; Bocko, J.; Kostka, J.; Schurger, B. Influence of Different Strain Hardening Models on the Behavior of Materials in the Elastic-Plastic Regime under Cyclic Loading. Materials 2020, 13, 5323. [Google Scholar] [CrossRef]
  19. Lekomtsev, P.V.; Nikitin, Y.R.; Trefilov, S.A. Simulation of Hybrid Step Motor by State Space at Variable Torque of Load]. Intellektual’nye sistemy v proizvodstve. Intell. Syst. Manuf. 2020, 18, 58–63. (In Russian) [Google Scholar] [CrossRef]
  20. Shaytor, N.M.; Gorpinchenko, A.V. Dynamic Modes of Asynchronous Motors in Drives of Power Systems and Complexes. Vestnik IzGTU Imeni MT Kalasnikova 2020, 23, 95–101. (In Russian) [Google Scholar] [CrossRef]
  21. Lekomtsev, P.V. Prediction of residual life of complex electromechanical systems based on small training samples. IOP Conf. Ser. Mater. Sci. Eng. 2020, 971, 052019. [Google Scholar] [CrossRef]
  22. Zhou, D.; Zhao, Y.; Wang, Z.; He, X.; Gao, M. Review on diagnosis techniques for intermittent faults in dynamic systems. IEEE Trans. Ind. Electron. 2019, 67, 2337–2347. [Google Scholar] [CrossRef]
  23. Zhang, Q.; Jiang, T.; Yan, J.D. Phase Synchrony Analysis of Rolling Bearing Vibrations and Its Application to Failure Identification. Sensors 2020, 20, 2964. [Google Scholar] [CrossRef] [PubMed]
  24. Burduk, A.; Wiecek, D.; Zajačko, I.; Jurdziak, L.; Blažej, R. Analysis and risk assessment of the supply of coper ore in the belt conveyor system in an underground mine. J. Acta Montan. Slovaca 2020, 25, 236–249. [Google Scholar]
  25. Nikitin, Y.R.; Lekomtsev, P.V.; Trefilov, S.A. Influence of Diagnostic Stepper Motor Parameters on Criterion of Identifiability for Nonlinear Discrete Model by State Space. Bull. Kalashnikov ISTU 2020, 23, 52–59. (In Russian) [Google Scholar] [CrossRef]
  26. Božek, P.; Lozhkin, A. The precision calculating method of robots moving by plane trajectories. Int. J. Adv. Robot. Syst. 2019, 16. [Google Scholar] [CrossRef] [Green Version]
  27. Toroková, M.; Pollak, M.; Torok, J.; Kočiško, M.; Kaščák, J. Augmented Reality as a Support Tool in Machining Process. TEM J. Technol. Educ. Manag. Inform. 2020, 9, 407–411. [Google Scholar]
  28. Ojaghi, M.; Sabouri, M.; Faiz, J. Analytic model for induction motors under localized bearing faults. IEEE Trans. Energy Convers. 2018, 33, 617–626. [Google Scholar] [CrossRef]
  29. Cui, L.; Huang, J.; Zhang, F. Quantitative and localization diagnosis of a defective ball bearing based on vertical–horizontal synchronization signal analysis. IEEE Trans. Ind. Electron. 2017, 64, 8695–8706. [Google Scholar] [CrossRef]
  30. Ahmadi, A.M.; Howard, C.Q.; Petersen, D. The path of rolling elements in defective bearings: Observations, analysis and methods to estimate spall size. J. Sound Vib. 2016, 366, 277–292. [Google Scholar] [CrossRef]
  31. Kuc, A.; Grubov, V.V.; Maksimenko, V.A.; Shusharina, N.; Pisarchik, A.N.; Hramov, A.E. Sensor-Level Wavelet Analysis Reveals EEG Biomarkers of Perceptual Decision-Making. Sensors 2021, 21, 2461. [Google Scholar] [CrossRef]
  32. Klačková, I.; Zajačko, I.; Lenhard, R.; Gritsuk, I.; Wiecek, D. Simulation of wood biomass combustion in hot water boiler. Mater. Sci. Eng. 2019, 776, 5. [Google Scholar]
  33. Ryaskov, Y.I.; Shaitor, N.M.; Gorpinchenko, A.V. Overview of Types of Protection of Asynchronous Motors Used in Power Systems and Complexes. Bull. Kalashnikov ISTU 2019, 22, 107–115. (In Russian) [Google Scholar] [CrossRef]
  34. Kutaj, M.; Boros, M. Development of a new generation of magnetic contact based on hall-effect sensor. In Proceedings of the International Conference of Central-Bohemia-University (CBUIC)—Innovations in Science and Education, Prague, Czech Republic, 22–24 March 2017; Volume 5, pp. 1154–1158. [Google Scholar]
  35. Boros, M.; Kutaj, M.; Maris, L.; Vel’as, A. Development of security at the local level through practical students training. In Proceedings of the 12th International Technology, Education and Development Conference (INTED), Valencia, Spain, 5–7 March 2018; pp. 725–729. [Google Scholar]
  36. Akatov, N.; Klačková, I.; Mingaleva, Z.; Galieva, G.; Shaidurova, N. Expert technology for risk management in the implementation of QRM in a high-tech industrial enterprise. Manag. Syst. Prod. Eng. 2019, 27, 250–254. [Google Scholar] [CrossRef] [Green Version]
  37. Nosek, R.; Bačka, A.; Ďurčanský, P.; Holubčík, M.; Jandačka, J. Effect of Paper Sludge and Dendromass on Properties of Phytomass Pellets. Appl. Sci. 2021, 11, 65. [Google Scholar] [CrossRef]
  38. Kuric, I. New methods and trends in product development and planning. In Proceedings of the 1st International Conference on Quality and Innovation in Engineering and Management (QIEM), Cluj Napoca, Romania, 17–19 March 2011; pp. 453–456. [Google Scholar]
  39. Dodok, T.; Čuboňová, N.; Císar, M.; Kuric, I.; Zajačko, I. Utilization of strategies to generate and optimize machining sequences in CAD/CAM. Procedia Eng. 2017, 192, 113–118. [Google Scholar] [CrossRef]
  40. Tlach, V.; Císar, M.; Kuric, I.; Zajačko, I. Determination of the Industrial Robot Positioning Performance. In Modern Technologies in Manufacturing. MATEC Web Conf. 2017, 137, 01004. [Google Scholar] [CrossRef] [Green Version]
  41. Holubčík, M.; Klačková, I.; Ďurčanský, P. Pyrolysis Conversion of Polymer Wastes to Noble Fuels in Conditions of the Slovak Republic. Energies 2020, 13, 4849. [Google Scholar] [CrossRef]
  42. Kopas, P.; Sága, M.; Baniari, V.; Vaško, M.; Handrik, M. A plastic strain and stress analysis of bending and torsion fatigue specimens in the low-cycle fatigue region using the finite element methods. Procedia Eng. 2017, 177, 526–531. [Google Scholar] [CrossRef]
  43. Jančárik, V.; Harťanský, R.; Slížik, J.; Mierka, M.; Halgoš, J.; Hallon, J.; Hricko, J. Autonomous sensor of electromagnetic field. Rev. Sci. Instrum. 2019, 90, 064705. [Google Scholar] [CrossRef]
  44. Glowacz, A. Fault diagnosis of electric impact drills using thermal imaging. Measurement 2021, 171, 108815. [Google Scholar] [CrossRef]
  45. Harťanský, R.; Smieško, V.; Rafaj, M. Modifying and accelerating the method of moments calculation. Comput. Inform. 2017, 36, 664–682. [Google Scholar] [CrossRef]
  46. Harťanský, R.; Mierka, M.; Bittera, M.; Hallon, J.; Halgoš, J.; Hricko, J.; Andok, R.; Rafaj, M. Novel method of contactless sensing of mechanical quantities. Meas. Sci. Rev. 2020, 20, 150–156. [Google Scholar] [CrossRef]
  47. Lei, Y.; Yang, B.; Jiang, X.; Jia, F.; Li, N.; Nandi, A.K. Applications of machine learning to machine fault diagnosis: A review and roadmap. Mech. Syst. Signal Process. 2020, 138, 1–39. [Google Scholar] [CrossRef]
  48. Li, L.; Ding, S.X.; Qiu, J.; Yang, Y.; Xu, D. Fuzzy observer-based fault detection design approach for nonlinear processes. IEEE Trans. Syst. Man Cybern. Syst. 2017, 47, 1941–1952. [Google Scholar] [CrossRef]
  49. Li, L.; Ding, S.X.; Qiu, J.; Yang, Y. Real-time fault detection approach for nonlinear systems and its asynchronous T-S fuzzy observer-based implementation. IEEE Trans. Cybern. 2017, 47, 283–294. [Google Scholar] [CrossRef] [PubMed]
  50. Luo, H.; Yin, S.; Liu, T.; Khan, A.Q. A data-driven realization of the control-performance oriented process monitoring system. IEEE Trans. Ind. Electron. 2019, 67, 521–530. [Google Scholar] [CrossRef]
  51. Wang, D.; Fu, F.Z.; Liu, C.R.; Li, W.B.; Liu, W.J.; He, Y.Z.; Xing, Y. Connotation and research status of diagnosability of control systems: A review. Acta Autom. Sin. 2018, 44, 1537–1553. [Google Scholar]
  52. Xue, T.; Zhong, M.; Ding, S.X.; Ye, H. Stationary wavelet transform aided design of parity space vectors for fault detection in LDTV systems. IET Control Theory Appl. 2018, 12, 857–864. [Google Scholar] [CrossRef]
  53. Yang, Y.; Ding, S.X.; Li, L. Parametrization of nonlinear observer-based fault detection systems. IEEE Trans. Autom. Control 2016, 61, 3687–3692. [Google Scholar] [CrossRef]
  54. Zhong, M.; Ding, S.X.; Zhou, D. A new scheme of fault detection for linear discrete time-varying systems. IEEE Trans. Autom. Control 2016, 61, 2597–2602. [Google Scholar] [CrossRef]
  55. Zhong, M.; Zhang, L.; Ding, S.X.; Zhou, D. A probabilistic approach to robust fault detection for a class of nonlinear systems. IEEE Trans. Ind. Electron. 2016, 64, 3930–3939. [Google Scholar] [CrossRef]
  56. Zhong, M.; Xue, T.; Ding, S.X. A survey on model-based fault diagnosis for linear discrete time varying systems. Neurocomputing 2018, 306, 51–60. [Google Scholar] [CrossRef]
  57. Yin, S.; Xiao, B.; Ding, S.X.; Zhou, D. A Review on Recent Development of Spacecraft Attitude Fault Tolerant Control System. IEEE Trans. Ind. Electron. 2016, 63, 3311–3320. [Google Scholar] [CrossRef]
  58. Zhou, J.; Yang, Y.; Zhao, Z.; Ding, S.X. A fault detection scheme for ship propulsion systems using randomized algorithm techniques. Control Eng. Pract. 2018, 81, 65–72. [Google Scholar] [CrossRef]
  59. Leite, V.C.M.N.; Da Silva, J.G.B.; Veloso, G.F.C.; Da Silva, L.E.B.; Lambert-Torres, G.; Bonaldi, E.L.; Oliveira, L.E.D.L.D. Detection of Localized Bearing Faults in Induction Machines by Spectral Kurtosis and Envelope Analysis of Stator Current. IEEE Trans. Ind. Electron. 2014, 62, 1855–1865. [Google Scholar] [CrossRef]
  60. Xu, L.; Chatterton, S.; Pennacchi, P. A Novel Method of Frequency Band Selection for Squared Envelope Analysis for Fault Diagnosing of Rolling Element Bearings in a Locomotive Powertrain. Sensors 2018, 18, 4344. [Google Scholar] [CrossRef] [PubMed] [Green Version]
  61. Sohaib, M.; Kim, C.-H.; Kim, J.-M. A Hybrid Feature Model and Deep-Learning-Based Bearing Fault Diagnosis. Sensors 2017, 17, 2876. [Google Scholar] [CrossRef] [Green Version]
  62. Ruiz-Arenas, S.; Rusák, Z.; Mejía-Gutiérrez, R.; Horváth, I. Implementation of System Operation Modes for Health Management and Failure Prognosis in Cyber-Physical Systems. Sensors 2020, 20, 2429. [Google Scholar] [CrossRef]
  63. Ou, J.; Li, H.; Huang, G.; Zhou, Q. A Novel Order Analysis and Stacked Sparse Auto-Encoder Feature Learning Method for Milling Tool Wear Condition Monitoring. Sensors 2020, 20, 2878. [Google Scholar] [CrossRef]
Figure 1. Scheme of a fuzzy inference system for technical state evaluation with three input variables, x, D, t.
Processes 09 00843 g001
Figure 2. The example of expressions L, M, H of input variable x.
Processes 09 00843 g002
Figure 3. The example of expressions L, M, H of input variable d.
Processes 09 00843 g003
Figure 4. The example of expressions L, M, H, the input of the variable t.
Processes 09 00843 g004
Figure 5. The example of expressions L, M, H of the output variable Z.
Processes 09 00843 g005
Figure 6. The rules of the fuzzy inference system for assessing the technical condition when combining logic operations AND or OR.
Processes 09 00843 g006
Figure 7. Surface response of the fuzzy inference system for assessing the technical condition when combining logical operations AND, OR.
Processes 09 00843 g007
Figure 8. The system diagram of the fuzzy estimates of the derivative of the residual life of the input variables x, D, W, t.
Processes 09 00843 g008
Figure 9. The example of expressions L, M, H, the input of the variable Z.
Processes 09 00843 g009
Figure 10. The example of expressions L, M, H of the output variable R.
Processes 09 00843 g010
Figure 11. The system of fuzzy inference rules for the estimation of residual service life by combining the logical operators AND, OR.
Processes 09 00843 g011
Figure 12. The response of the fuzzy surface of the estimate of the derivative of the residual life of the combining logic operations AND, OR.
Processes 09 00843 g012
Figure 13. Diagram of the fuzzy inference system for calculation of diagnostic intervals with input variables x, D, R, t.
Processes 09 00843 g013
Figure 14. The example of expressions L, M, H of input variable Z.
Processes 09 00843 g014
Figure 15. The example of expressions L, M, H output variable delta.
Processes 09 00843 g015
Figure 16. The rules of fuzzy inference system to evaluate the diagnostic interval when combining logical operations AND, OR.
Processes 09 00843 g016
Figure 17. The response surface of the fuzzy inference system to evaluate the diagnostic intervals in combining logic operations AND, OR.
Processes 09 00843 g017
Figure 18. Block diagram of the technological line for the production of chipboard.
Processes 09 00843 g018
Figure 19. Schematic diagram of the production line downtime.
Processes 09 00843 g019
Figure 20. Time spent on preventive maintenance from 2014 to 2020.
Processes 09 00843 g020
Table 1. List of drive equipment for chipboard forming machine.
Type of driveDevice NameFacility NameAvailability of Mechanical Gears and Sensors
231M1—geared motor (asynchronous motor with frequency converter)Belt conveyor for a large chipsBelt conveyor for a large chipsRotary encoder, capacitive level sensors for mold filling (8 pcs.)
231M2, 231M3—gear motor (asynchronous motor with frequency converter)Conveyor cleaning screw driveConveyor cleaning screwsSpeed sensor
231M4—gear motor (asynchronous motor with frequency converter)Large bristle cleaning beltLarge brush cleaning beltSpeed sensor
233M1—geared motor (asynchronous motor with frequency converter)Worm drive with coarse chipsTip drill with thick chipsSpeed sensor
234M1—geared motor (induction motor with frequency converter)Belt conveyor of large chipsBelt conveyor of large chipsSpeed sensor
235 M1—gear motor (asynchronous motor with frequency converter)Oscillation of large chip conveyor beltBelt conveyor of large chipsChain transfer. Extreme position sensors, rotation sensor
236M1, 237M1, 238M1—geared motor (asynchronous motor with frequency converter)Chips drive “rake”Pressing machineChain drive. Rotation sensors
251M1—gear motor (asynchronous motor with frequency converter)Belt conveyor for fine chipsBelt conveyor for small chipsRotary encoder, capacitive level sensors for mold filling (8 × 2 pcs.)
251M2, 251M3—gear motor (asynchronous motor with frequency converter)Conveyor cleaning screw driveCleaning screw conveyorSpeed sensor
251M4—geared motor (asynchronous motor with frequency converter)Cleaning of small particles using a brush conveyor belt cleaning small particles using a brush conveyor beltCleaning of small particles using a brush conveyor beltSpeed sensor
252—pneumatic cylinderPartition damper drive (fine chip flow distribution) Machine face.
Capacitive level sensors for mold filling (8 × 2 pcs.)
Forming machineCapacitive level sensor for filling forms (8 × 2 pcs.)
253M1, 254M1—geared motor (asynchronous motor with frequency converter)Drive of fine chip feeding screwsForming machineSpeed sensor
255M1, 256M1—geared motor (asynchronous motor with frequency converter)Distributor screw driveForming machineSpeed sensor
257M1, 258M1—geared motor (asynchronous motor with frequency converter)Switchgear driveForming machineChain drive. Extreme position sensors
302M1,312M1, 322M1 gear motors (asynchronous motors with frequency inverters)Needle shaft driveForming machineDrive belts.
Speed sensors for each shaft
303M1, 313M1, 323M1—gearmotors (asynchronous motors with frequency converters)Lower belt driveForming machineChain drive. Speed sensors for each belt
304M1, 314M1, 324M1—gearmotors (asynchronous motors with frequency converters)Lower brush driveForming machineSensor of weight gain 1 on the shaft
305M1, 306M1, 315M1, 316M1—low voltage electric motors“Vibrator” on the filter gridForming machineBalancing, adjustable plates
325M1, 326MH, 327MH, 328MH, 329MH, 330MH1—geared motors (asynchronous motors with frequency converters) Conventional drive shaft driveThe drive of the classic drive shaftForming machineTiming belt, speed sensor
308M1, 318M1—geared motors (asynchronous motors with frequency converters)Conveyor belt driveForming machineSpeed sensor
331M1, 332M1The drive of the conveyor beltForming machineSpeed sensor
321M1—geared motor (asynchronous motor with frequency converter)Forming machine—drive of height adjustable secondary driveForming machineShaft with asterisk at the end, connector adapter based on the two-row chain, gear
364M1—gear motor (asynchronous motor with frequency converter)Drive main conveyorThe main conveyorChain transmission (two-row chain). Rotation sensor, pallet availability sensor
365M1—geared motor (asynchronous motor with frequency converter)Pallet brush driveThe main conveyorSpeed sensor
Table 2. Power and synchronous frequency of electric motors.
Name of EnginePower kWThe Synchronous Frequency of rpm
Coarse chip mixing motor901000
Fine motor for mixing chips301500
Electric motor of the first grinder901500
Electric motor of second grinder901500
Electric motor of the third grinder901500
Electric motor of the first molding machine221500
Electric motor of the third forming machine221500
Electric motor shredder751500
Electric motor of pneumatic sorting machine451500
Self-cutting machine with electric motor451500
Publisher’s Note: MDPI stays neutral with regard to jurisdictional claims in published maps and institutional affiliations.

