1. Introduction
Nowadays, there is a surplus of glycerin on the market as glycerin is the main byproduct of biodiesel production. Biodiesel is commonly produced by transesterification of vegetable oils or animal fats and approximately
of crude glycerin to
of biofuel is produced this way [
1,
2]. This is the reason behind ongoing research and growing interest towards suitable utilization of glycerin. It can be used as a biobased and ecological solvent [
3,
4]. Pure or even crude glycerin might be fermented to valuable products like 1,3-Propanediol [
5]. Catalytic conversion or pyrolysis to other valuable chemicals such as syngas is also possible [
6,
7]. However, in order to find reasonable applications, the behavior of glycerin in various apparatuses and conditions have to be thoroughly studied and described together with its thermophysical, chemical and transport properties.
Glycerin is one of the most effective substances which are able to completely suppress the azeotropic behavior of ethanol-water mixtures [
1,
8]. Glycerin mass fraction of about
is needed for complete suppression of the azeotrope [
3]. Furthermore, presence of glycerin increases relative volatility of ethanol to water [
3]. It is, therefore, employed as an entrainer for extractive distillation of ethanol-water mixtures. Glycerin is more effective and cheaper than commonly used entrainers such as ionic liquids or ethylene glycol, which is also toxic and harmful [
1,
9]. Extractive distillation is the most widely used method for the production of anhydrous ethanol [
10] and glycerin is able to increase the purity of the produced ethanol [
9]. The product is free of glycerin and might be used in chemical industry or as a clean-burning fuel [
1]. Similar entraining capabilities of glycerin were also reported for 1-propanol–water and 2-propanol–water mixtures [
11,
12]. Regeneration of the entrainer is usually done in a recovery distillation column. Flash evaporators are usually employed as subatmospheric pressures are required in the column to reduce possible thermal degradation of glycerin [
1,
6,
13]. For example, Gil et al. [
13] set operating pressure of
at the top of recovery column for their simulations of extractive distillation of ethanol.
Mixtures of water and glycerin might be used for absorption of ethanol vapor carried by
. They improve the rate of absorption compared with pure water, at least for lower concentration of glycerin in the mixture, and they have higher boiling point relative to water which is beneficial as it enables more efficient regeneration of the solvent. Ethanol is separated from the mixture in a distillation column [
8].
Pure glycerin is usually manufactured by purification of lower-grade glycerin or by chlorination of propylene [
14]. In order to increase the concentration of glycerin, distillation might be used. Distillation also follows after various purifying processes such as neutralization, crystallization, filtration or centrifugation [
6]. In order to produce pure glycerin, distillation has to be performed at high vacuum from about 4 to
and unwanted chemical reactions have to be suppressed [
6]. Vacuum distillation is capable of producing pharmaceutical grade glycerin with purity higher than 99.9% [
2]. It is also possible to use distillation as a single step of purification. The purity of produced glycerin is lower, yet still meets the technical grade. Alternative energy saving methods for purification such as reverse osmosis or membrane distillation have been also proposed [
14]. However, it should be a priority to find some suitable applications for crude glycerin so that purification steps would become unnecessary [
4].
The aim of this work is to investigate heat transfer during pool boiling of water–glycerin mixtures at atmospheric pressure on a horizontal flat copper surface, which is the most often studied surface in the literature dealing with pool boiling. To our best knowledge, the data for water–glycerin mixtures boiling on a flat copper surface have not yet been reported in the literature. Although distillation of binary and ternary mixtures of glycerin is a regular industrial process, the literature dealing with heat transfer of various glycerin mixtures during pool boiling is rather scarce. In this work, results of measurement of heat transfer coefficient (HTC) are presented for a wide range of concentrations of the boiling mixture and wide range of heat fluxes. HTCs were measured for mixtures with water mass fractions from (pure water) to at heat fluxes from approximately 25 up to . Since the commonly employed static method of measurement is time demanding, a dynamic method was proposed and tested. This method enables the measurement of HTC for various compositions of boiling mixture in a single experimental run.
1.1. Phase Diagram of Water–Glycerin Mixtures
Although glycerin is a common and thoroughly described substance miscible with water [
15], thermophysical properties and phase equilibriums of water–glycerin mixtures are rarely addressed. Thermophysical properties listed in
Table 1 and two empirical models of phase equilibrium presented in Mokbel et al. [
16] and Soujanya et al. [
17] were employed into calculations presented in this work. Both of these models take real behavior of liquid phase into account by its activity.
Mokbel et al. [
16] investigated vapor–liquid equilibriums and saturated vapor pressure of water–glycerin mixtures at pressures from 32 to
. They fitted saturated vapor pressure with the Antoine equation
and employed
non-random two-liquid (NRTL) model for calculation of phase equilibriums. They published the following empirical parameters for water–glycerin mixture:
,
,
,
,
. Usually, only the first three parameters are required for a three-parametric NRTL models. Two additional parameters
and
are used to include the effect of temperature on two so-called
interaction parameters of the model. Parameters of NRTL model should be independent of composition and temperature [
18].
Soujanya et al. [
17] performed ebulliometry in order to measure the boiling temperature of water–glycerin mixture and also to find parameters of Wilson model for given and maintained concentration of the mixture at various fixed pressures in the range from
to
. For instance, for pressure of
, which is the value closest to the standard atmospheric pressure, they present parameters
,
. Values of
and
vary with pressure without any evident trend. In addition, these parameters might also weakly depend on temperature [
18]. The temperature dependence is, however, usually neglected. They also report coefficients of Antoine equation, which are listed in
Table 2. Mokbel et al. [
16] consider ebulliometry to be inappropriate for mixtures with high difference between boiling temperatures of its components such as the case of water–glycerin mixture.
The models of Mokbel et al. [
16] and Soujanya et al. [
17] were used to calculate vapor and liquid equilibriums close to the standard atmospheric pressure for various temperatures. Comparison between both models and experimental sets of Carr et al. [
21] and Watkins [
20] is shown in
Figure 1. Both sets were measured at atmospheric pressure. Carr et al. [
21] interpolated the boiling points from Dühring lines constructed from their experimental measurements with a slightly modified apparatus of Baker and Waite [
22]. Watkins [
20] used a modified Othmer apparatus for his measurements. However, these sets do not favor one model over the other.
For both models, saturated vapor pressures of pure components were calculated with coefficients of Antoine equation reported by Soujanya et al. [
17], see
Table 2. Both models predict almost the same composition of vapor phase with mass fractions of water
higher than
, see
Figure 1. However, models differ for the liquid phase. For
, model of Mokbel et al. predicts higher boiling temperatures in average by 1.6
C. For
, higher temperatures were obtained with the model of Soujanya et al. in average by 10.8
C. Nevertheless, both models give an important prediction that vapor phase consists almost entirely of water even for lower mass fractions of water in the corresponding liquid equilibrium, as documented numerically in
Table 3 which lists bubble-point temperature and composition of vapor phase
in equilibrium with liquid phase of composition
predicted with both models.
1.2. Boiling Behavior of Water–Glycerin Mixtures
Mixtures of water and glycerin exhibit Newtonian behavior. They are characterized by a great difference between viscosities of both components [
23]. The fact that vapor phase is almost
water for a wide range of composition of the liquid phase makes the mixture suitable for direct comparison between the boiling performance of water–glycerin mixtures and the boiling performance of pure water without additional modifications of experimental apparatus, which might significantly affect the boiling process. Furthermore, these mixtures evince a weak dependence of surface tension on their composition [
24] with a small negative deviation from values interpolated between both pure components [
23]. This is beneficial for researchers as effects of surface tension often coincide with so-called
mixture effects [
25,
26] or with fundamental boiling mechanisms [
27].
Boiling of water–glycerin mixtures is significantly affected by three main factors noticeable from the look at
Figure 1: (1) Water–glycerin mixtures have wide boiling range of about 190
C at atmospheric pressure. (2) For a wide range of concentrations, vapor phase is composed almost solely of water. (3) Even a significant change of composition of liquid phase might not lead to a significant change of boiling temperature. These factors are securely valid for water mass fractions
and significantly affect boiling performance of the mixture as well as important boiling parameters. For instance, bubble departure diameters are approximately constant for water–glycerin mixtures at
, which is a consequence of the mentioned factors [
24].
Table 4 gives an overview of pool boiling experiments with water–glycerin mixtures from the literature. Works in
Table 4 report a reduction of HTC with increasing concentration of glycerin in the boiling mixture. Reduced HTC was attributed either to changes in thermodynamic properties due to addition of glycerin [
28,
29], drop of effective temperature difference [
30] or mass-transfer resistance due to preferential evaporation of more volatile component [
29,
31]. However, minor enhancement of HTC for very low concentration of glycerin in the mixture was reported as well. This is not exclusive for water–glycerin mixtures as it was also observed for small amounts of alcohols in water [
32], oil in water or refrigerants [
33], water-ethylene glycol mixtures [
34] or amine–water solutions [
35]. The improved heat transfer is usually related to decreased surface tension of the mixture [
35] or to changes in wettability [
30]. For water–glycerin mixtures, Alavi Fazel et al. [
30] report that HTCs obtained during pool boiling on a stainless steel rod were enhanced by approximately 15 or
for concentrations
at heat fluxes lower than
. Enhancement was also observed by Yang et al. [
36] during flow boiling inside microchannels with a maximum enhancement of
at concentrations
of about
for heat fluxes lower than
. Alavi Fazel et al. [
30] suggest that at low concentrations of less volatile component in a binary mixture with wide boiling range, mass transfer resistance does not play a significant role and ideal boiling HTC (which is calculated assuming that the mixture behaves like a single-component fluid) is equal to the mixture HTC at low or medium heat fluxes. They observed this during experiments with water–glycerin mixtures boiling at atmospheric pressure for water mass fractions
and heat fluxes below
. They also propose that for water–glycerin mixtures, only water gets vaporized and glycerin moves away from the heating surface into the liquid bulk during formation of bubbles [
30].
McNeil et al. [
29] performed experiments with subcooled boiling of water–glycerin mixtures on tube bundles at local pressure of about
. They observed lower heat flux required for the onset of nucleate boiling (ONB) from about 10 to
compared with heat fluxes from 25 to
required for ONB with pure water. Superheat required for ONB was
for water–glycerin mixtures and
for water. Kuo [
28] observed rising critical heat flux with increasing concentration of glycerin in highly concentrated mixtures. He reports critical heat flux of
and
for
and
, respectively.
Sarafraz and Peyghambarzadeh [
31] discuss the impact of thermophysical properties on HTCs calculated for water–glycerin, water–monoethylene glycol and water–diethylene glycol mixtures. They state that authors of heat transfer correlations often do not specify which properties or methods for their estimation should be used together with their correlations. Sarafraz and Peyghambarzadeh calculated HTCs with the combination of Stephan and Abdelsalam [
39] and Schlünder [
40] correlations. For mixture of water and glycerin, they report average deviation of about
between their experimental data and predictions made by Schlünder correlation with properties being evaluated with Peng–Robinson equation of state. However, for the same dataset, they obtained average deviation of about
when they employed Redlich–Kwong equation of state [
31]. The model of Kandlikar [
41] should be applicable for highly nonideal binary mixtures characterized by nonlinear dependence of their thermophysical properties on composition. In the first step, average HTC and average thermophysical properties are interpolated between values corresponding to pure components using molar fractions as weighting coefficients. Average HTC is then corrected using actual and average interpolated thermophysical properties of the boiling mixture. Finally, deterioration of HTC due to mass diffusion resistance in the liquid phase is taken into account. For this, vapor–liquid equilibriums and binary diffusion coefficients have to be known. The application of Kandlikar’s model requires an iterative solution of a system of four equations.
According to Tolubinsky et al. [
24], water–glycerin mixtures are stable and boiling should not lead to the decomposition of glycerin for water mass fractions
. They were somehow able to perform measurements of HTCs during boiling of mixture with
of
, but the decomposition made it impossible to measure HTCs for pure glycerin.
2. Materials and Methods
2.1. Experimental Apparatus
Pool boiling experiments were performed with the experimental apparatus shown in
Figure 2. The apparatus consists of a glass cylinder with inner diameter of
which stands on a stainless steel bottom. Cubic copper block is inserted through the cut made in the bottom. The block is heated by five vertically oriented cartridge heaters with diameter of
, length of
and nominal power of
. Power to the cartridge heaters is supplied by
TWINTEX PPW-1560 laboratory power supply. The top face of the block with area of
serves as the boiling surface, see
Figure 3. The surface was ground to roughness
of
.
Silicon Ceresit CS 28 and epoxy EPO-TEK 302-3M-R were used to fill the gap between the block and the bottom. The block is insulated with five plates of cellular glass Foamglas Perinsul S to reduce heat losses. Auxiliary heater in the shape of a spiral made of Inconel 800 with nominal power of is used to maintain the saturation temperature of the boiling liquid. Variable autotransformer is used for powering the auxiliary heater. The liquid pool above the boiling surface is separated from the vicinity of the auxiliary heater by a stainless steel tube and a glass funnel, which eliminates possible influence of the auxiliary heater on the boiling process and helps with maintenance of saturation temperature above the heating surface.
Apparatus is opened to the surroundings. Ambient pressure was measured with pressure sensor Comet T7510. Water was continuously pumped into the apparatus with a dosing pump ProMinent BT4a to maintain constant composition and constant level of the boiling mixture during measurements. This configuration allows to switch between static and dynamic methods of measurement, which are described below.
2.2. Calculation of HTC
Temperatures inside the heated block were measured with six sheathed K-type thermocouples (TCs)
Omega GKMQSS-M100U-150. TCs were inserted into holes with diameter of
and length of
, which were drilled in two lines and three rows. Heat flux is calculated with Fourier’s law
where
is the temperature difference between two lines of TCs.
and
are the average temperatures in the bottom and upper line, respectively. Length
is the distance between both lines of TCs, see
Figure 3. Constant thermal conductivity of copper
and linear temperature gradient (
) inside the block were assumed. The temperature of the heating surface
is linearly extrapolated. Temperature of the boiling mixture
is measured with two sheathed TC probes
Omega TJ2-CPSS-M15U-600 submerged into the boiling liquid. HTC might then be defined as
2.3. Static Method and Measurement Procedure
Steady states of boiling were reached for the static method of measurement. The criterion for judging the steadiness was the maximum temperature difference taken from differences between all temperatures measured at a certain time and the same temperatures measured one minute earlier. Boiling was considered to be steady when the maximum difference continuously oscillated around zero and its magnitude stayed lower than approximately 0.3 C. The steady state of boiling was usually reached after approximately 15 min from the moment the voltage supplied to the heating cartridges was altered.
For each run of measurements, water and glycerin were weighted and mixed together at room temperature. Volume of approximately five liters of mixture was prepared and poured into the apparatus. Cartridge and auxiliary heaters were then turned on and liquid was heated until it started to boil. Dosing pump was switched on. After reaching a steady state of boiling, this state was maintained for approximately 15 min. Then the electrical power supplied to the cartridge heaters was altered and another steady state was reached. Power supplied to the auxiliary heater was kept constant throughout the whole run.
Usually, highest power was supplied to the cartridge heaters at the start of each run to obtain the first steady point at the highest heat flux. Then, for other steady points, heat flux was decreased in a step-by-step manner. This procedure is recommended to reduce hysteresis of the boiling phenomenon [
30]. For some data points, the heat flux was increased to move from one steady state to another, but these points did not exhibit any noticeable effect of hysteresis.
Before the first experimental run, the heating surface was cleaned with acetone and left for five days. The surface was then passivized by boiling in water for ten hours. The heating surface was neither cleaned nor treated between consecutive runs to prevent possible interaction of cleaned surface with the boiling liquid.
The time period of about half an hour, which was required for reaching the first steady state of each run, was found to be sufficient for degassing of the boiling liquid as there were no discrepancies observed between data points obtained at the beginning of each run and remaining data points.
One hundred and nine data points were obtained in total. Each of nine presented runs was conducted in a single day and took approximately 9 or 10 h. After each run, the apparatus was cooled down and liquid was pumped out. The apparatus was left in this state overnight and new run was started in the morning. The apparatus was never disassembled for all presented runs to achieve the highest possible repeatability.
2.4. Dynamic Method
Može et al. [
42,
43] came up with a dynamic method of measurement of HTCs during a continuous increase of heat flux to speed up their experiments and to reduce the impact of surface degradation on their results. They experimentally verified that gradual increase of heat flux at rate lower than
for the regime of nucleate boiling and lower than
for the regime of natural convection does not lead to deviations from steady state measurements. The rates are, however, only valid for their experimental apparatus. Može et al. [
44] performed numerical simulation to estimate an error of heat flux measurement for the dynamic method. They simulated unsteady heat conduction inside an aluminum sample placed on the top of an copper block and obtained the difference between the actual heat flux at the boiling surface and measured heat flux of about
which was lower than the uncertainty of heat flux measurements.
A dynamic method was developed by the present authors for mixtures which allows one to obtain HTC as a function of concentration of the boiling mixture in a single experimental run and provides faster measurements compared with the ordinary static method. Opened apparatus was utilized and the concentration of the boiling liquid was allowed to change in time as vapor was escaping from the apparatus during measurements. Constant voltage was set and supplied to cartridge heaters. The auxiliary heater was turned on for the whole measurement. Mixture was boiled until the liquid level dropped close to the heating section. At that moment, the experimental run was stopped to prevent air contact with the heater.
Actual composition of the boiling mixture might be determined by sampling or estimated from the boiling temperature. In this work, the actual composition was calculated from boiling temperature with models of phase equilibriums presented in
Section 1.1. The advantage of this approach is that neither the liquid composition nor the amount of released vapor nor the vapor composition have to be directly measured. However, for mixtures with a flat dependence of temperature on composition, precise measurements of temperature are required to reduce the uncertainty of the measurements.
2.5. Measurement Uncertainties
Theory of propagation of uncertainty was used to estimate the uncertainty of heat transfer coefficient for the measurements. Following maximum deviations were presumed: for temperature = 0.5 C, for length or distance , for thermal conductivity . For all of these deviations, uniform rectangular distribution was assumed. Standard deviations were then calculated as .
Experiments were done in the range of heat flux from around 20 up to
. Since the uncertainty of HTC depends on the value of heat flux and on the values of measured temperatures, directly and indirectly measured values were employed to calculate
. This was done for three different heat fluxes (low, medium and high) measured during pool boiling of pure water which are given in
Table 5 together with measured temperatures
and
, atmospheric pressure and the corresponding heat transfer coefficient, see Equation (
3). Values of
q,
and
listed in
Table 5 were employed into the calculation of uncertainty
.
For measurement performed at high heat flux, represented by the first line of
Table 5, the resulting uncertainty
, which gives the relative uncertainty of
. For medium heat fluxes, represented by the second point in
Table 5, uncertainty
, and the relative uncertainty is of about
. For the lowest heat flux in
Table 5, uncertainty
was obtained, which means relative error of about
. One can deduce that in order to lower the uncertainty below
, measurements should be performed at heat fluxes higher than approximately
.
3. Results and Discussion
Four experimental runs were performed to verify reliability and repeatability of performed measurements. Two runs were done with pure water and two runs with water–glycerin mixture of water mass fraction
. Boiling liquid was replaced for both repeated runs. Results are shown in
Figure 4 together with correlations of Rohsenow [
45] and Yagov [
46] which are presented in
Table 6. Both pure-fluid correlations were evaluated for pool boiling of pure water and
water–glycerin mixture at the standard atmospheric pressure. Thermophysical properties were adopted from
Table 1.
For both pure-fluid correlations, standard error of the estimate
was calculated, where
i is the ordinal number of one of the measured data points,
is measured HTC,
is HTC estimated by the correlation and
N is the number of measured data points. Mean relative error between the measured and correlated HTCs
was also evaluated. For pure water data, Rohsenow correlation gave
of about
and
around
. With Yagov correlation,
of
and MRE around
were obtained for pure water. Yagov correlation gives higher
and simultaneously lower
, because it is in better agreement to the water data for low heat fluxes. Rohsenow correlation gives higher relative errors for low heat fluxes but provides satisfying results for heat fluxes higher than approximately
. Course of Rohsenow correlation is also in better agreement with the measured data. Although both correlations were formed for pure fluids, decrease of Rohsenow correlation seems to cover the deterioration of HTC measured for the
mixture. Yagov correlation, on the other hand, overlaps for pure water and the
mixture and predicts more or less constant HTCs for both boiling liquids.
According to
Figure 4, measured HTCs are slightly lower for the second run with water–glycerin mixture. Relative difference between obtained values and the corresponding arithmetic mean of both runs remains below
. The observed difference might be caused by underlying boiling mechanisms responsible for randomness of the boiling process such as activation of different nucleation sites for each run. In addition, stability of the copper surface due to prolonged exposure to glycerin might have been affected.
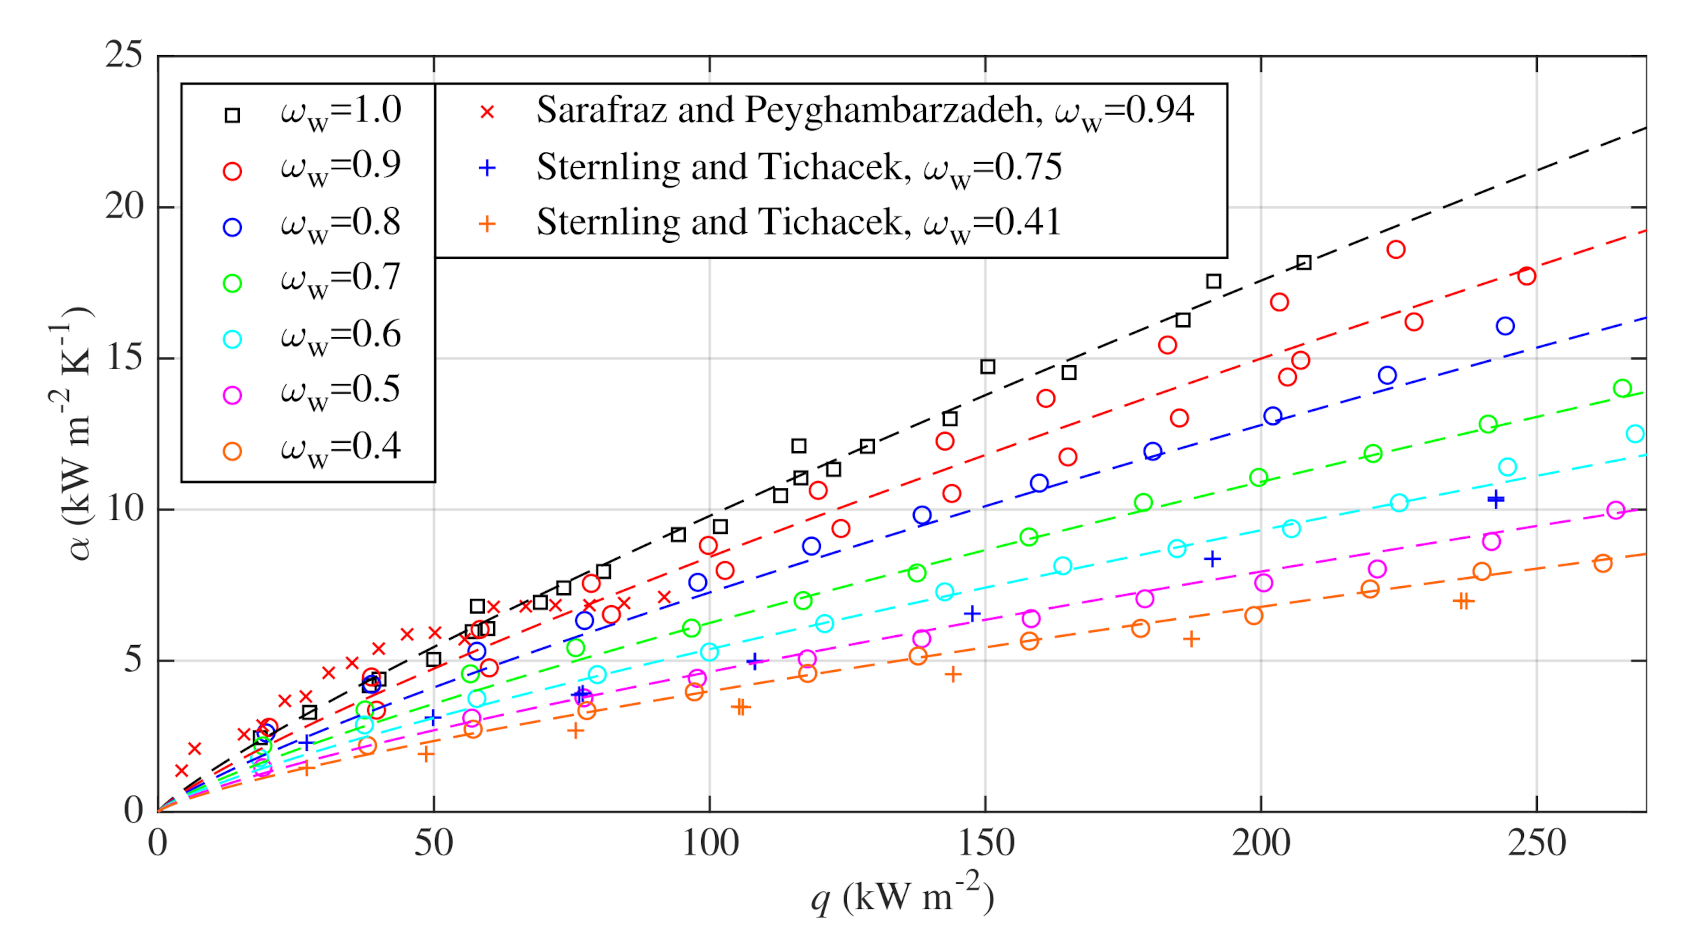
HTCs measured during saturated nucleate pool boiling of water–glycerin binary mixtures at water mass fractions
of
,
,
,
,
,
and
are shown in
Figure 5. Corresponding boiling curves are plotted in
Figure 6. All experiments were performed at atmospheric pressure. Experimental data of Sternling and Tichacek [
37] and Sarafraz and Peyghambarzadeh [
31] are presented in
Figure 5 for comparison. However, it should be noted that their experiments were performed on a different surface and different geometry, see
Table 4. Some discrepancies between their datasets and the presented datasets are thus expected. Furthermore, Sarafraz and Peyghambarzadeh [
31] do not report the boiling pressure and it is also possible that their data evince the enhancement of HTC, which was discussed in
Section 1.2.
The obtained HTCs were correlated with power-law functions
which were separately fitted for each investigated concentration
. Obtained values of parameters
K and
m are listed in
Table 7 together with their
confidence intervals, measured average boiling temperatures and pressures. Values of
m lie close to the upper limit of the range
often stated in literature, for instance in [
47], as a range typical for nucleate pool boiling of various liquids.
Results of two
F-tests and
Akaike information criterion showed that parameter
K of Equation (
6) might be considered to be independent of concentration of the boiling mixture and that for parameter
m of Equation (
6), linear dependence might be assumed. Therefore, the whole dataset was fitted with empirical correlation
Following values and
confidence intervals were obtained for parameters of correlation (
7):
,
,
. Correlation
might thus be used to calculate HTCs for all investigated heat fluxes
q and water mass fractions
. Equation (
8) is only valid for
q in (
) and the resulting
is in (
). SEE for correlation (
8) is of about
and
is below
. The predictions made with the correlation (
8) are the dashed lines depicted in
Figure 5. Dashed boiling curves in
Figure 6 were obtained with Equation (
8) using definition of
, see Equation (
3).
In
Figure 7, measured boiling temperatures are compared with models of Mokbel et al. [
16] and Soujanya et al. [
17] as well as with datasets of Carr et al. [
21] and Watkins [
20].
between the model of Mokbel et al. and the measured values is 0.7
C and
is of about
. For the model of Soujanya et al., values of
of approximately 1.2
C and
of
were obtained.
Relative fractions of
are depicted in
Figure 8 as functions of heat flux for all investigated concentrations. HTCs calculated with correlation (
8) for pure water were used as reference values
. For comparison, ratios
calculated with correlation (
8) are also shown as solid lines in
Figure 8. One might observe that ratio
decreases with increasing heat flux which is common for various mixtures [
48]. This decrease is more significant in the region of lower heat fluxes. For high heat fluxes, the ratio
is more flat and might be eventually considered as a constant. In addition, the effect of concentration on HTC is stronger for mixtures with higher water content.
3.1. Mixture Effects and HTC Deterioration
Stephan and Abdelsalam universal correlation [
39], see
Table 6, should be valid for water, hydrocarbons, cryogenic fluids and refrigerants boiling on various surfaces in the range of reduced pressure from
to
. For these single-component liquids and conditions, the stated mean error of the correlation is around
[
39]. One can use the correlation to predict HTCs for pool boiling of hypothetical pure liquid with the same thermophysical properties as those of a boiling mixture. HTCs predicted this way are called
ideal. For boiling of mixtures, ideal HTCs have to be corrected with a suitable correlation to take
mixture effects into account [
25]. In a typical correlation prescribed for pool boiling of binary mixtures, one has to lower the ideal heat transfer coefficient by a correction factor
F. Schlünder correlation [
40], see
Table 6, enables the calculation of
F and HTC of boiling mixture. The correlation requires two empirical parameters: scaling factor
and mass transfer coefficient inside the liquid phase
. Schlünder himself recommends using values
and
. The value of
is based on an assumption that all of the heat is transferred into emerging vapor bubbles. The value of
was obtained from a fit of his theoretical model to experimental data which were obtained for mixtures of SF
6 and refrigerant R-12. Hewitt [
49] mentions that scaling factor
might have to be adjusted in order to fit experimental data. Thome and Shakir [
50] claim that it is usually assumed that
and that coefficient
usually lies in the range
.
Alavi Fazel et al. [
30] suggest that HTCs correspond to ideal values calculated with Stephan and Abdelsalam correlation for certain concentrations and heat fluxes, see
Section 1.2 for details. It was therefore tested whether it is possible to predict the data presented in this work solely with Stephan and Abdelsalam correlation.
Figure 9 shows the data and results of the correlation for all investigated mixtures. The difference between measured and ideal HTCs increases with rising concentration of glycerin in the mixture which is a consequence of enhanced
mixture effects and heat transfer deterioration. Measured and ideal HTCs are not equal even for lower heat fluxes and higher water mass fractions. The hypothesis of Alavi Fazel et al. [
30] is thus not valid for the presented measurements and ideal HTCs have to be corrected for all investigated mixtures and heat fluxes.
Alavi Fazel et al. [
30] used Stephan and Abdelsalam correlation [
39] together with Schlünder correlation [
40] to correlate their pool boiling data obtained for water–glycerin mixtures with concentrations
from
to
and heat fluxes up to
. It was analyzed whether these correlations give acceptable results for wider ranges of concentration and heat flux. The
and
, see Equations (
4) and (
5), were evaluated between the values estimated by the Schlünder correlation and the measured data points.
of about
and
of about
were obtained. It was also tested whether it is possible to improve the accuracy of the Schlünder correlation with custom parameters
and
. It was assumed that the scaling factor
and the optimal mass transfer coefficient
, which provides the lowest
, was found. The best fit was obtained for
of approximately
. With this coefficient,
of
was obtained, whereas
stayed at about
. Since the optimal and original coefficients remain very close to each other and improvement of accuracy is negligible, the coefficients given by Schlünder are considered to be appropriate for the presented dataset.
Figure 10 shows comparison of measured data and Schlünder correlation calculated with values of
and
according to Schlünder’s recommendations.
The calculated
for Schlünder correlation of about
is comparable with the average error of
reported by Alavi Fazel et al. [
30]. Although slightly higher
was obtained for the presented data, the investigated concentration and heat flux ranges were wider. Therefore, Schlünder correlation is considered to be appropriate for the investigated water–glycerin mixtures.
3.2. Results of the Dynamic Measurements
The dynamic method was proposed which enables HTC measurement during continuous change of composition of the boiling mixture with constant voltage supplied to the heating cartridges. The method was speculatively tested on water–glycerin mixture with the initial water mass fraction of and the final of . Evaluated HTCs were compared with the results of the static method. Average atmospheric pressure during the experiment was .
During the measurement, heat flux gradually decreased as concentration of glycerin in the boiling mixture rose and heat transfer deteriorated. This is noticeable in
Figure 11 which shows decrease of heat flux from approximately 164 to
during the time period of the whole experiment. The jumps of heat flux in
Figure 11 at time of about 1900 and
were caused by nonuniform current at the output of the power supply.
Actual concentration of the liquid bulk was calculated using the model of Soujanya et al. [
17], see
Section 1.1, from the boiling temperature measured with submerged TC probes. The model of Mokbel et al. [
16] was found to be unsuitable as it was overpredicting the actual concentration of the boiling mixture. For illustration, the initial concentration calculated with the model of Soujanya et al. and the model of Mokbel et al. is
and
, respectively.
The comparison between HTCs obtained with the dynamic method and HTCs obtained with the static method, which were correlated using Equation (
8), is shown in
Figure 12. The experimental data obtained with the dynamic method correspond very well to correlation (
8) for
in the range from
down to the final concentration of
. For higher
, HTCs obtained with the dynamic method are lower than the results of the static method correlated with Equation (
8). The difference between the static and the dynamic method is caused by a flat dependence of boiling temperature on concentration of the boiling mixture. To overcome this, continuous sampling of the boiling mixture or precise temperature measurements and accurate models of phase equilibriums are required. However, the difference between measured and correlated values remains acceptable. For instance, for
, the ratio between measured and correlated HTCs is of about
. For the highest
, this ratio slightly decreases to approximately
. The dynamic method can be further improved using power supply with adaptive control to maintain a constant heat flux level throughout a single experimental run.


