Article

Analysis the Drivers of Environmental Responsibility of Chinese Auto Manufacturing Industry Based on Triple Bottom Line

1
Academy of Green Manufacturing Engineering, Wuhan University of Science and Technology, Wuhan 430081, China
2
Key Laboratory of Metallurgical Equipment and Control Technology, Ministry of Education, Wuhan University of Science and Technology, Wuhan 430081, China
3
Hubei Key Laboratory of Mechanical Transmission and Manufacturing Engineering, Wuhan University of Science and Technology, Wuhan 430081, China
4
School of Automobile and Traffic Engineering, Wuhan University of Science & Technology, Wuhan 430081, China
5
Institute of Mechanical and Manufacturing Engineering, School of Engineering, Cardiff University, Cardiff CF10 3XQ, UK
*
Author to whom correspondence should be addressed.
Processes 2021, 9(5), 751; https://doi.org/10.3390/pr9050751
Submission received: 2 April 2021 / Revised: 18 April 2021 / Accepted: 22 April 2021 / Published: 24 April 2021
(This article belongs to the Special Issue Green Technologies for Production Processes)

Abstract

:
The rapid increasing number of automobile products has brought great convenience to people’s living, but it has also caused serious environmental issues, waste of resources and energy shortage during its whole lifecycle. Corporate Environmental Responsibility (CER) refers to the company’s responsibility to avoid damage to the natural environment derived from its corporate social responsibility (CSR), and it plays an important role in solving resource and environmental problems. However, due to various internal and external reasons, it is difficult for the automobile manufacturing industry to find the key drivers for the implementation of CER. This research proposes a model framework that uses the fuzzy decision-making test and evaluation laboratory (fuzzy DEMATEL) method to analyze the drivers of CER from the perspective of the triple bottom line (TBL) of economy, environment and society. Firstly, the common drivers of CER are collected using literature review and questionnaire survey methods. Secondly, the key drivers are analyzed by using the fuzzy DEMATEL. Finally, the proposed approach was verified through a case study. The research results show that some effective measures to implement CER can be provided for the government, the automobile manufacturing industry and the public to promote sustainable development of Chinese Auto Manufacturing Industry (CAMI).

1. Introduction

According to relevant survey reports, the number of Chinese new automobiles almost exceeded 25.76 million, and the amount of Chinese vehicle ownership reached more than 260 million up to 2019. The rapid growth of the number of automobiles has brought a series of environmental issues. In the process of automobile production, use, recycling and disposal, air, soil, water, etc., will be polluted to a certain extent, resulting in waste of resources and energy shortage [1]. These environmental issues have aroused widespread concern from the government, enterprises and scholars. While the Chinese government is strengthening environmental supervision of the automotive industry, the extension of the production responsibility and Corporate Environmental Responsibility (CER) have become hot topics of concern to many automotive industry units. Therefore, many Chinese auto companies are aware of the importance of sustainable development, and have implemented some sustainable development strategies, such as CER, remanufacturing, green manufacturing and cleaner production [2,3,4,5,6].
In fact, due to various reasons, it is difficult for them to effectively implement sustainable development strategies, especially CER. The main reason is that some automobile companies are worried that the implementation of CER may affect their financial interests, so they are unwilling to implement CER. In addition, some companies voluntarily implement CER, but they do not know what measures should be taken. Therefore, by analyzing the drivers of CER, the fundamental reason why enterprises cannot effectively implement CER can be found, thereby promoting the change of development strategy of Chinese Auto Manufacturing Industry (CAMI) and achieving coordinated development of economic and environmental benefits.
At present, some studies focus on the combination of CER and sustainable practices, such as integrating CER into the supply chain, and the combination of sustainable development and CER. As many automobile companies pay more attention to economic interests, compared with well-known foreign automobile companies, the efficiency of CER implementation by Chinese automobile manufacturers is relatively low. So far, only a few studies have focused on the drivers of CER for Chinese automobile manufacturers and revealed the internal connection between the corporate environmental responsibility and the corporate economic benefits. The “Triple Bottom Line” was proposed by John Elkington [7], a well-known British management consultant and sustainability expert, and used it to measure his company’s performance in the United States. Triple Bottom Line (TBL) theory believes that there should be three bottom lines: profit, people and the earth. TBL aims to assess the level of corporate commitment to social responsibility and its impact on the environment over time. Additionally, CER is concerned about the impact of the development of the enterprise on the environment. There is a close relationship between TBL and CER. The influencing factors of enterprises implementing CER can be analyzed from the perspective of TBL. The purpose of both is to achieve a balanced development of economic and environmental benefits. Therefore, this study attempts to identify and analyze the CER drivers of Chinese automakers from the perspective of TBL to bridge the gap. In this study, first, based on a comprehensive analysis of the existing literature, expert opinions and the opinions of Chinese auto industry managers, common drivers were identified. Second, we sent questionnaires to some automobile companies. Third, based on the results of the questionnaire survey, a quantitative and the fuzzy decision-making test and evaluation laboratory (fuzzy DEMATEL) analysis was used to determine the key drivers and classifications.
The rest of this paper is arranged as follows: Section 2 reports a literature review related to the research topic and proposes the main innovations of this paper based on comparative analysis. Section 3 describes the problem. Section 4 introduces the method used in this research, namely fuzzy DEMATEL, and proposes a model framework for analyzing the CER drivers of the Chinese automobile industry. Section 5 verifies the proposed model through case studies. Section 6 discusses in detail. Finally, Section 7 gives conclusions and future work.

2. Literature Review

2.1. Corporate Environmental Responsibility and Triple Bottom Line

CER, called corporate environmental responsibility, refers to a company’s duties to abstain from damaging natural environments, which derives from corporate social responsibility (CSR) [8]. In recent years, CER has become an important concept and has received extensive attention from relevant researchers. This is because the implementation of CER can enhance the sustainable development ability of enterprises, improve the natural environment, and solve various social and ecological problems such as climate change and biodiversity loss [9,10]. Gunningham [11] described the development of the concept of CER and studied the debate about the relationship between CER and competitive advantage. On the basis of Carroll’s CSR pyramid model, Wang Hong [12] explored the system characteristics of CER and sorted out its elements, structure and functions. Studies have shown that the implementation of CER can promote the green and sustainable development of manufacturing to a certain extent [13], and the improvement of the company’s market competitiveness and profitability can be tracked through the implementation of environmental management activities [14]. The results of the study were verified by listed company A [15,16], which showed that the performance of corporate environmental responsibility (CER) by company A has a significant positive impact on the company’s financial performance, but it has a lag effect, and higher environmental investment can bring higher profitability. Furthermore, many firms are discovering that there is an advantage to advocating for environmental regulations and preparing for them to be implemented before they become law. In a recent study, the researcher found that firms support climate change legislation as a means of gaining power over their competitors. Essentially, even if a new regulation hurts a firm in the short term, the firm may embrace it because they know that it will hurt their competitors even more. This allows them to come out on top in the long run [17].
The TBL proposed by Elkington [7] is an accounting framework that includes three aspects: economic (profit), social (people), and environmental (planet). It is used by many researchers to solve various problems [18,19]. The TBL considers profit using traditional measures for evaluating company profits, evaluating the company’s environmental responsibility, evaluating the company’s sustainability pillars [20,21], and citizens’ concerns about corporate social responsibility as indicated by the company’s operations [22,23]. Ahi and Searcy [24] claim that sustainability is the ability to maintain long-term welfare responsibly, manage resources so that the company can meet current needs without compromising the ability of future generations to meet their own needs. The TBL has been widely applied in many domains to promote sustainable development that also provides a co-benefit. Wu et al. [25] suggested that firms should consider stakeholders, resilience, long-term goals and current operations when evaluating sustainability strategies. Previous research also emphasized that TBL is not sufficient to achieve complete sustainability, and we must take greater steps to discuss socioeconomics, social environment and ecological efficiency [26,27]. Moreover, several studies noted that relations, resource consumption and policies must be integrated with sustainable practices to ensure the cobenefit [28].
Many scholars have conducted case studies from the perspective of TBL. Bergenwall [29] studied the differences in process design between American automakers and Toyota on the three aspects of sustainability. Gimenez [30] studied the impact of TBL on sustainable management. They proposed that the internal environmental plan has a positive impact on the three components of TBL, while internal social activities only have a positive impact on the two components of social and environmental performance. Neri et al. [31] designed a triple bottom line balanced key performance indicator set to measure the sustainability performance of industrial supply chains. Agrawal et al. [32] discussed the deployment decisions of sustainable reverse logistics in the Indian electronics industry, and studied the impact of disposal decisions on TBL, that is, the economic, environmental and social performance of reverse logistics. Hussain et al. [33] studied the relationship between corporate governance and triple bottom line sustainability performance through the perspectives of agency theory and stakeholder theory.

2.2. Drivers of CER in the Automotive Industry

The rapid growth of automobile ownership has caused a series of problems, such as climate change, emissions, pollution, etc. [34]. For CAMI, the factors that promote the effective implementation of CER through some sustainable development practices (such as CER, green manufacturing, sustainable supply chain management, manufacturer extension responsibility, life cycle analysis, and environmental certification, etc.) are called drivers. Therefore, many researchers have paid attention to the CER problem and conducted some extended studies.
Some studies discuss the relationship and importance of TBL principles and strategic decisions from the perspective of sustainable supply chains in the automotive industry. The successful implementation of sustainable supply chains can promote the implementation of CER [35,36,37]. Other studies illustrate the important indicators of CER implementation from the perspective of the green evaluation system of the automobile manufacturing industry [38]. There are also some studies that mainly elaborated the relationship between the implementation of CER and legislation from the aspect of government legislation. Studies have shown that government legislation is the most critical driver for the implementation of CER [39,40]. There are also other explorations of the relationship between energy certification, changes in corporate management strategies and the implementation of CER, including Cai et al. [41], which explored energy performance certification in the machinery manufacturing industry, and provided information for the implementation of energy performance certification strategies. The theoretical foundation is thus promoted to promote the active implementation of CER by automakers. Nunes [42] focuses on investigating and benchmarking the green operating plans of the automotive industry as documented in the environmental reports of selected companies. Research by Yu Cheng et al. [43] shows that Chinese automakers still have much room for improvement in terms of consumer satisfaction, resource conservation, community services and low-carbon activities. Kehbila et al. [40] systematically analyzed the motivations, obstacles and benefits of South African automobile companies participating in environmental change and provided some suggestions that may promote the effective implementation of strategic corporate environmental management. The research results show that achieving consistent compliance, reducing the daily impact on the environment, improving the working and living conditions of employees, and improving image and reputation are the most important driving forces. Babiak and Trendafilova [44] studied the motivations and pressures reported by senior managers to adopt sustainable practices in the industry. The research results show that strategic motivation and institutional pressure are the main reasons for adopting environmental management measures. Lee et al. [45] studied the driving forces for the implementation of CER and green practices in the Korean logistics industry, and pointed out that social expectations, organizational support and stakeholder pressure are important driving forces for the implementation of CER and green practices. Goli et al. [46] explained that corporate environmental responsibility (CER) involves key solutions for the success of corporate innovation.
By reviewing the existing literature, we know that domestic and foreign scholars have conducted CER research from different aspects. Based on the TBL method, some studies have been conducted on the sustainable development of the automotive industry, but mainly focus on the TBL analysis of the automotive industry supply chain order optimization, supply chain management or supplier sustainability. However, there are few studies on the implementation of CER in CAMI. From the perspective of TBL, there are fewer drivers for CER in automobile companies. This has led to companies not paying attention to the implementation of CER, and the effect of CER implementation is poor and difficult.
Therefore, this paper aims to analyze the key drivers of CAMI’s implementation of CER from the perspective of TBL, and then analyze the promotion effect of key drivers on economy, environment and society, so as to improve the effect of CER implementation, and realize the coordination and sustainability development of economic and environmental benefits.

3. Identify Common Drivers of CER

As environmental problems have become more prominent, the public’s awareness of environmental protection has continued to increase. When consumers buy automobiles, green features have become one of their important choices [47,48]. Some automakers realize that they should implement CER throughout the product life cycle to minimize the negative impact on the environment to meet consumer’s demand for environmentally friendly products [49]. However, they do not know how to effectively implement CER to promote the sustainable development and green development of enterprises, and the implementation of CER in CAMI has always been controversial, so there is an urgent need to improve the effectiveness of CER implementation.
Therefore, this paper analyzes the drivers of CER in CAMI from the perspective of TBL (economic, social and environmental). Based on relevant literature, expert opinions and the opinions of Chinese auto industry managers, we jointly determine the common drivers for CER in China’s auto industry. First, we collect CER drivers from relevant literature, and use “corporate environmental responsibility”, “corporate environmental responsibility drivers” and “Chinese automobile manufacturer environmental responsibility” as search keywords. Secondly, we inquired about the main motivations for Chinese automakers to implement CER in 120 Chinese auto industry units through e-mail and telephone. We finally received replies from 82 Chinese auto companies. Third, on the basis of the above process of determining common drivers, we held an online seminar, inviting CAMI experts and managers to participate in order to solve these classifications. After discussion, we got the final result on the classification of common drivers. Through the above process, the common CER drivers in CAMI were identified and classified, as shown in Table 1. The main drivers identified include policy drivers, technology drivers, corporate internal motivations and corporate external pressure. Finally, a case verification was carried out through a Chinese automobile manufacturer.

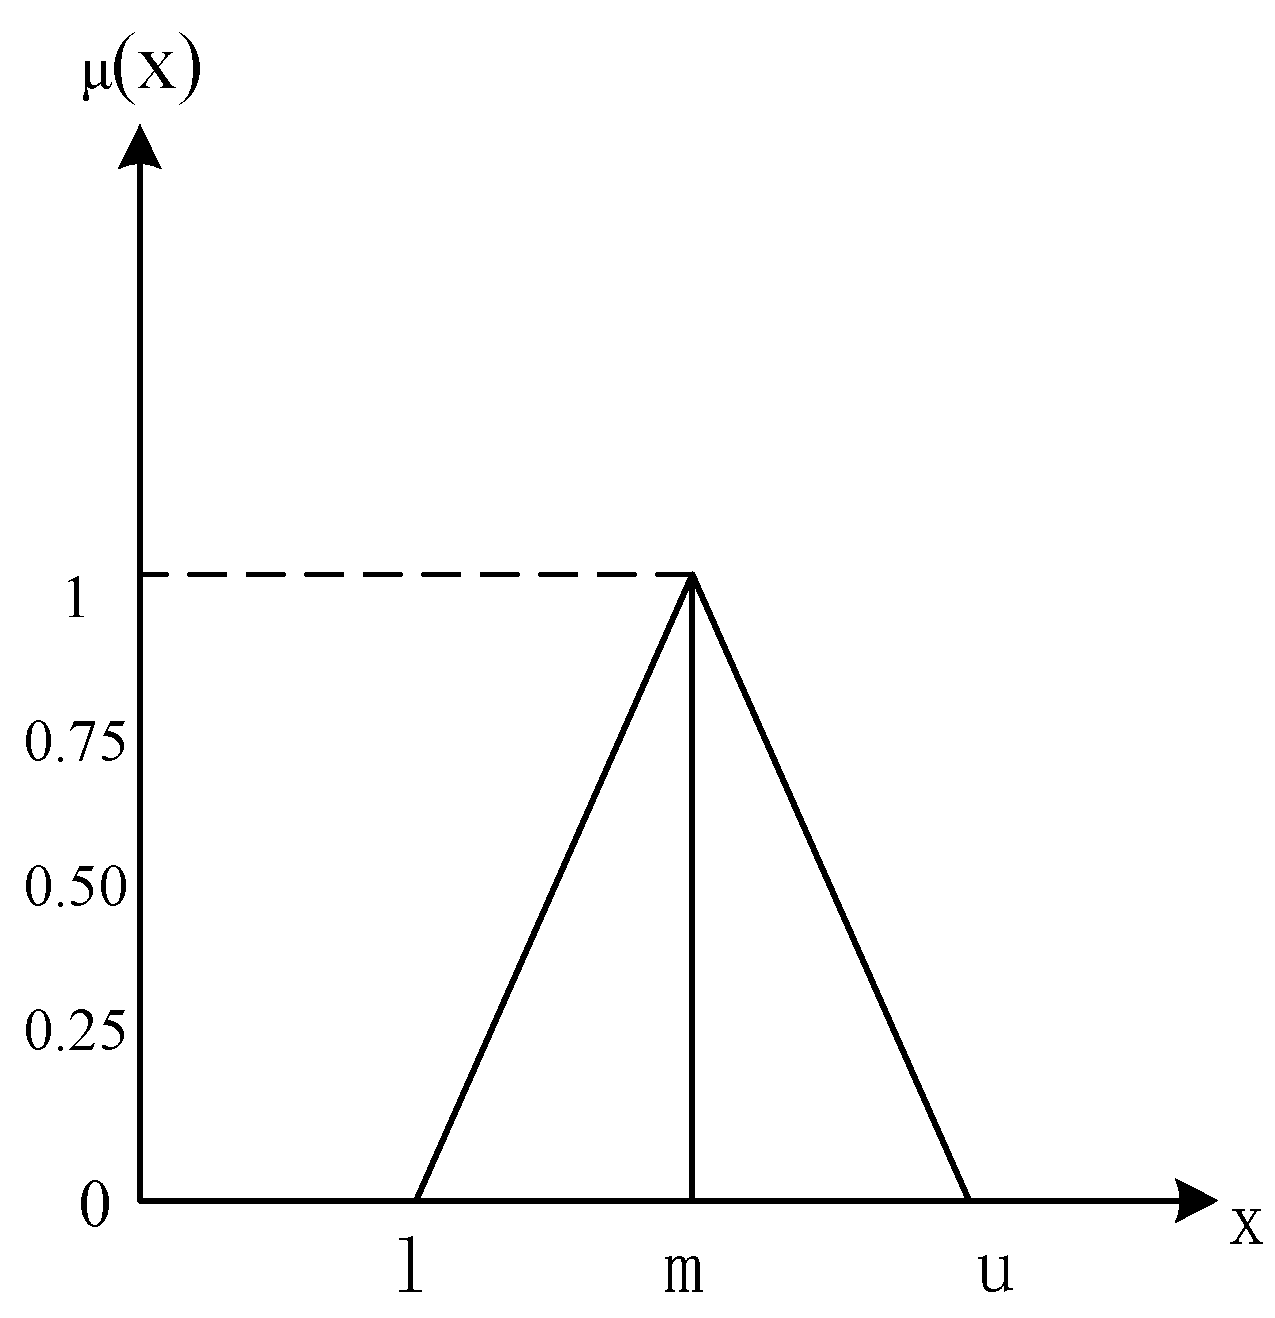
4. The Fuzzy DEMATEL Method of Key Drivers

The proposed model framework for analyzing the drivers of CER in China’s automobile industry is shown in Figure 1. First of all, with the help of existing literature, expert opinions and industry managers’ opinions, most of the drivers were collected. Second, a questionnaire containing the drivers of the five-point Likert scale was distributed to Chinese automobile companies. For the collected valid questionnaires, we averaged the survey results, discussed with experts, and finally identified and classified 16 common driving factors. Then, based on the TBL, a fuzzy direct relationship matrix was established, and the key drivers of CER in CAMI were analyzed using the DEMATEL program. Finally, the results were verified in a medium-sized automobile company through feedback from the automotive industry managers and comparison with existing literature.
Since the drivers for the implementation of environmental responsibility in CAMI is a complex decision-making problem, it is a common method to use multicriteria decision-making (MCDM) [50,51] method or fuzzy analytic hierarchy process [52] to make decisions. DEMATEL, as one of the MCDM approaches, firstly used by The Battelle Memorial Institute at its Geneva Research Centre in 1973, is utilized as a solution method in this paper [53]. The DEMATEL method can visualize complex causal structures by establishing and analyzing structural models between complex factors. Furthermore, it can analyze the influence relationship between complex criteria and separate the factors into cause group and effect group in which the cause group affects the effect group thus reckoning the relative weights of criteria. In this paper, since the interaction between all the drivers of CER in CAMI is relatively complex, it is necessary to use DEMATEL to help us better understand the interaction between drivers.
Although DEMATEL is a good way to deal with complex decision-making problems, the degree of mutual influence between systems is usually ambiguous, which will make language information unsuitable for expression. In order to reduce uncertainty and increase accuracy, DEMATEL is combined with fuzzy logic proposed by Zadeh [54]. It is rather effective to measure the ambiguous concepts related to human’s subjective judgments with fuzzy logic [55]. Therefore, this paper uses fuzzy DEMATEL with triangular fuzzy numbers to evaluate the driving factors of CER in CAMI.
A triangular fuzzy number can be defined as a triplet A ˜ = ( l , m , u ) , where l , m and u denote lower, medium, and upper numbers, respectively, to describe a fuzzy event. Additionally, the membership function μ A ˜ of a triangular fuzzy number can be expressed as follows:
μ A ˜ ( x ) = { 0 x < l ( x l ) ( m l ) l x m ( u x ) ( u m ) m x u 0 x > u
where l , m and u are real numbers and l m u .
In view of above, the model of triangular fuzzy numbers is shown in Figure 2. The correspondence between the linguistic terms and triangular fuzzy numbers can be determined by Table 2. For any of two triangular fuzzy numbers A = ( l 1 , m 1 , u 1 ) and B = ( l 2 , m 2 , u 2 ) , the operational laws of the two triangular numbers are as shown below:
{ A ˜ 1 + A ˜ 2 = ( l 1 + l 2 , m 1 + m 2 , u 1 + u 2 ) A ˜ 1 A ˜ 2 = ( l 1 l 2 , m 1 m 2 , u 1 u 2 ) A ˜ 1 × A ˜ 2 = ( l 1 × l 2 , m 1 × m 2 , u 1 × u 2 ) A ˜ 1 ÷ A ˜ 2 = ( l 1 ÷ l 2 , m 1 ÷ m 2 , u 1 ÷ u 2 ) λ A ˜ 1 = ( λ l 1 , λ m 1 , λ u 1 ) , ( k > 0 ) A ˜ λ = ( l 1 λ , m 1 λ , u 1 λ ) , ( k > 0 )
where l 1 , m 1 and u 1 are real numbers and l 1 m 1 u 1 .
This section is not mandatory but may be added if there are patents resulting from the work reported in this manuscript.
The main steps of the fuzzy DEMATEL method are briefly described as follows:
Step 1: Establish the fuzzy direct relation matrix T with fuzzy linguistic terms.
Step 2: Defuzzified-Initial relation matrix F . In this step, the fuzzy direct relation matrix T is defuzzified, namely the triangular fuzzy numbers are converted to crisp numbers by centroid method, a kind of defuzzification approach. Correspondingly, the Defuzzified-Initial relation matrix F can be established by Equation (3).
F g ( x ) = i = 1 n x i μ A ˜ ( x i ) i = 1 n μ A ˜ ( x i )
Step 3: Establish the normalized direct-relation matrix X . In this step, the initial direct-relation matrix F is normalized by utilizing Equations (4) and (5). Consequently, the normalized direct-relation matrix X can be obtained.
K = 1 max 1 i n j = 1 n a i j
X = K × F
Step 4: Establish the total relation matrix M . In this step, the total relation matrix M is calculated through Equation (6) where I denotes identity matrix. The element m i j denotes the indirect effects that criterion i have on criterion j , and the matrix M gives the total relationship among the each pair of factors.
M = X ( I X ) 1
Step 5: Get the sum of rows and columns. In this step, the sum of rows and columns of matrix M are calculated through Equations (7) and (8). In the two equations, r i denotes all direct and indirect influence given by criterion i to all other factors, c j denotes the degree of influenced impact.
r i = 1 j n t i j
c j = 1 i n t i j
When i = j , ( r i + c j ) denotes all effects that are given and received by criterion i . ( r i + c j ) can show the degree of importance that criterion i , in the total system, namely the centrality of the element i in the problem group. Meanwhile, ( r i c j ) represents the net effect that criterion i has on the system. If ( r i c j ) > 0, the element i will be classified into cause group. By contrast, if ( r i c j ) < 0, it will be classified into effect group.
Step 6: Establish the cause–effect relation diagram. In the final step, the cause and effect relationship diagram is depicted according to the dataset of ( r i c j ) . The horizontal axis (R + C) is obtained by adding R to C, and the vertical axis (R − C) is obtained by subtracting C from R.
Step 7: According to the results of the step 6, the cause group of the key drivers are ranked again to determine the most critical drivers. The calculation formula is:
R g = ( r i c j ) ( r i c j ) max × 100 %

5. Case Study: An Explanation

5.1. Case Background

Due to the expanding trend of economic globalization, as well as the continuous development of smart and green technologies, CAMI must be able to respond to the market in a timely manner while taking into account economic growth, environmental protection, and the realization of social expectations. K Company is a medium-scale automobile manufacturing company in China, which has been committed to manufacturing energy-saving and environmentally friendly vehicles. However, the automobile company found that the effect of implementing CER on energy conservation and emission reduction is far behind that of well-known foreign automobile manufacturing companies. Therefore, the company realized the need to evaluate the drivers of CER to ensure the effective implementation of its CER. The main research goals of the automobile company are as follows: (1) The automobile company hopes to understand the common drivers and key drivers of CER. (2) The company hopes to understand the comprehensive impact of implementing CER on economic, environmental and social benefits. (3) Last but not least, automobile companies hope to achieve their own green development and sustainable development by effectively implementing CER throughout the entire life cycle of the car.

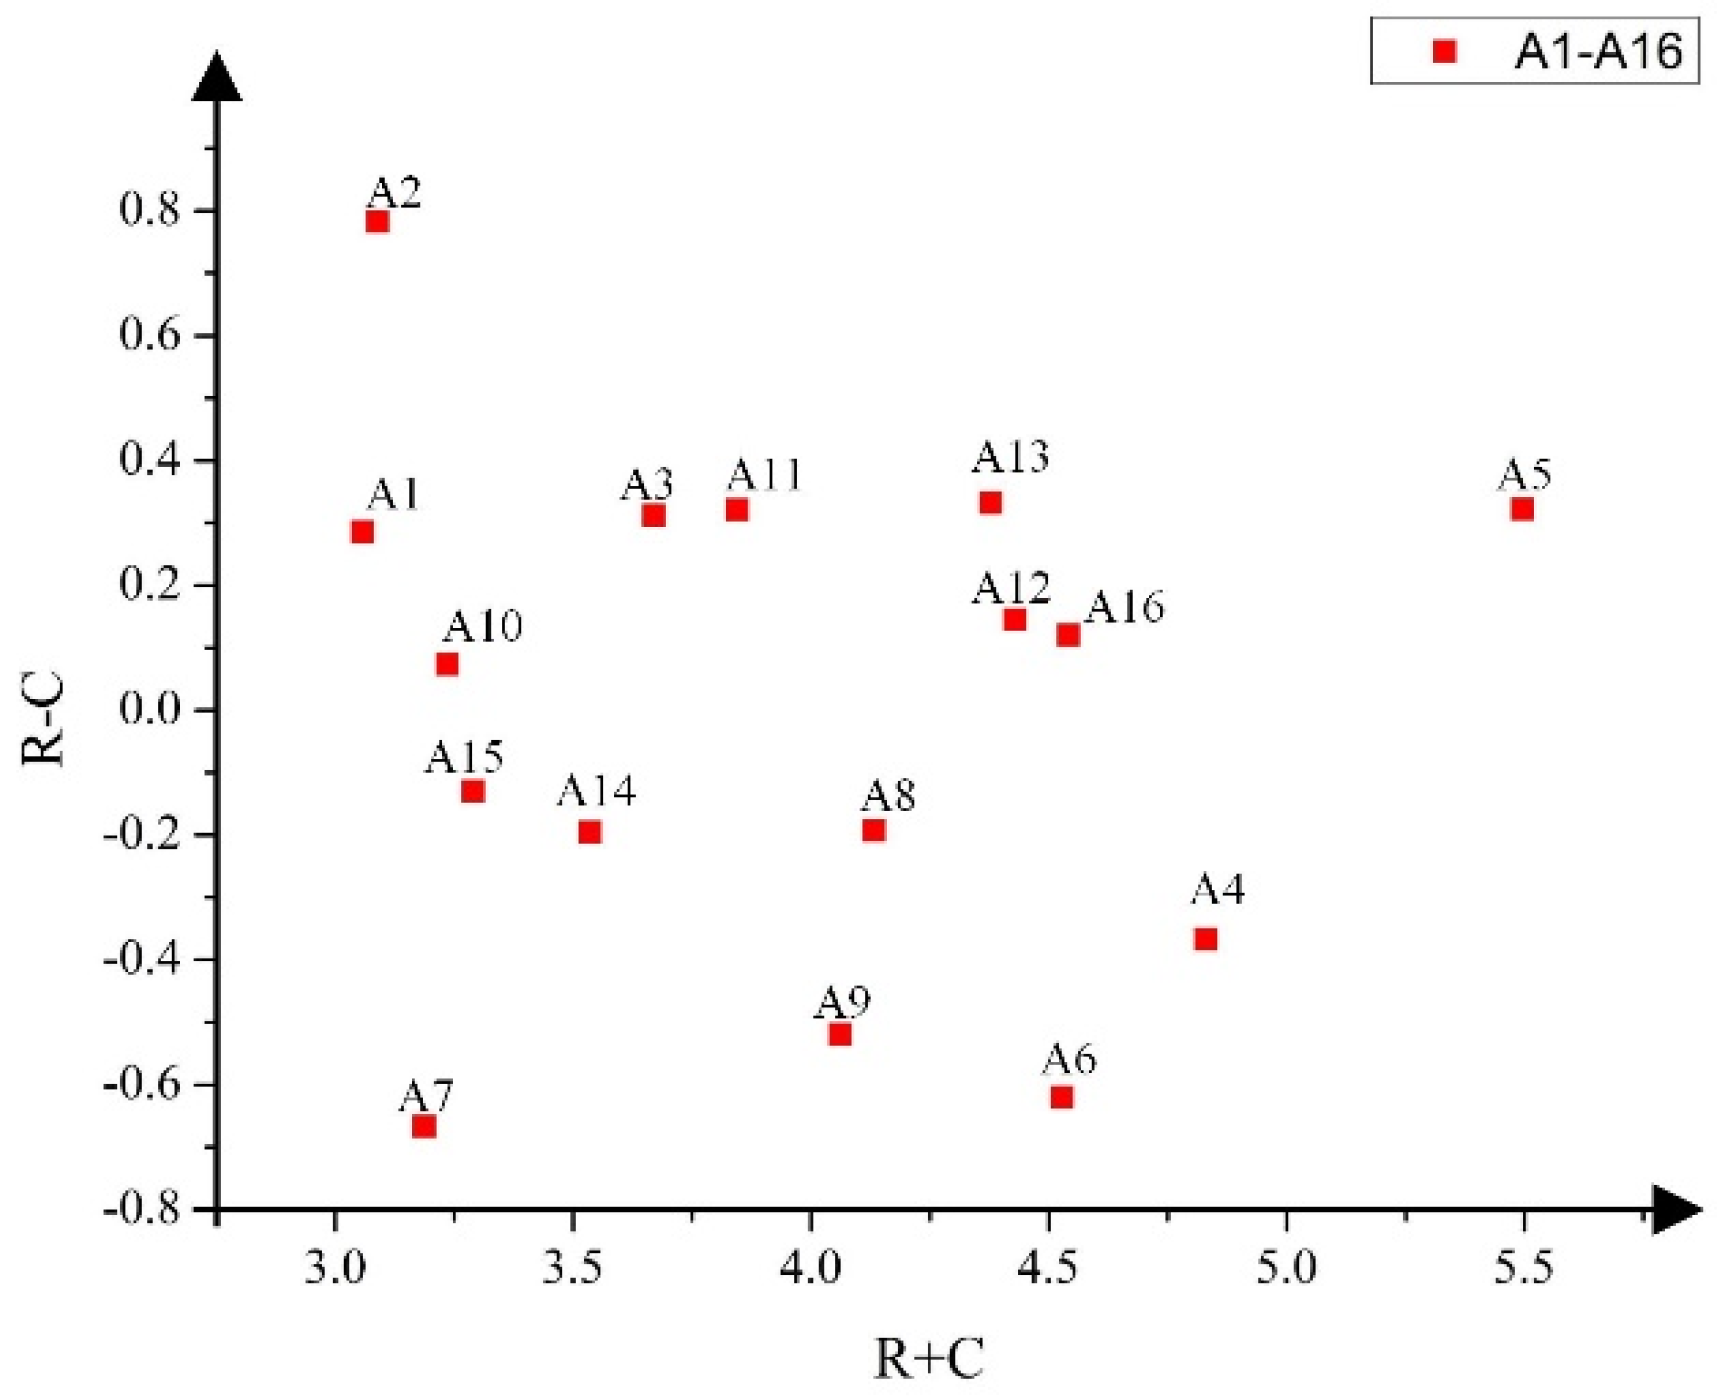
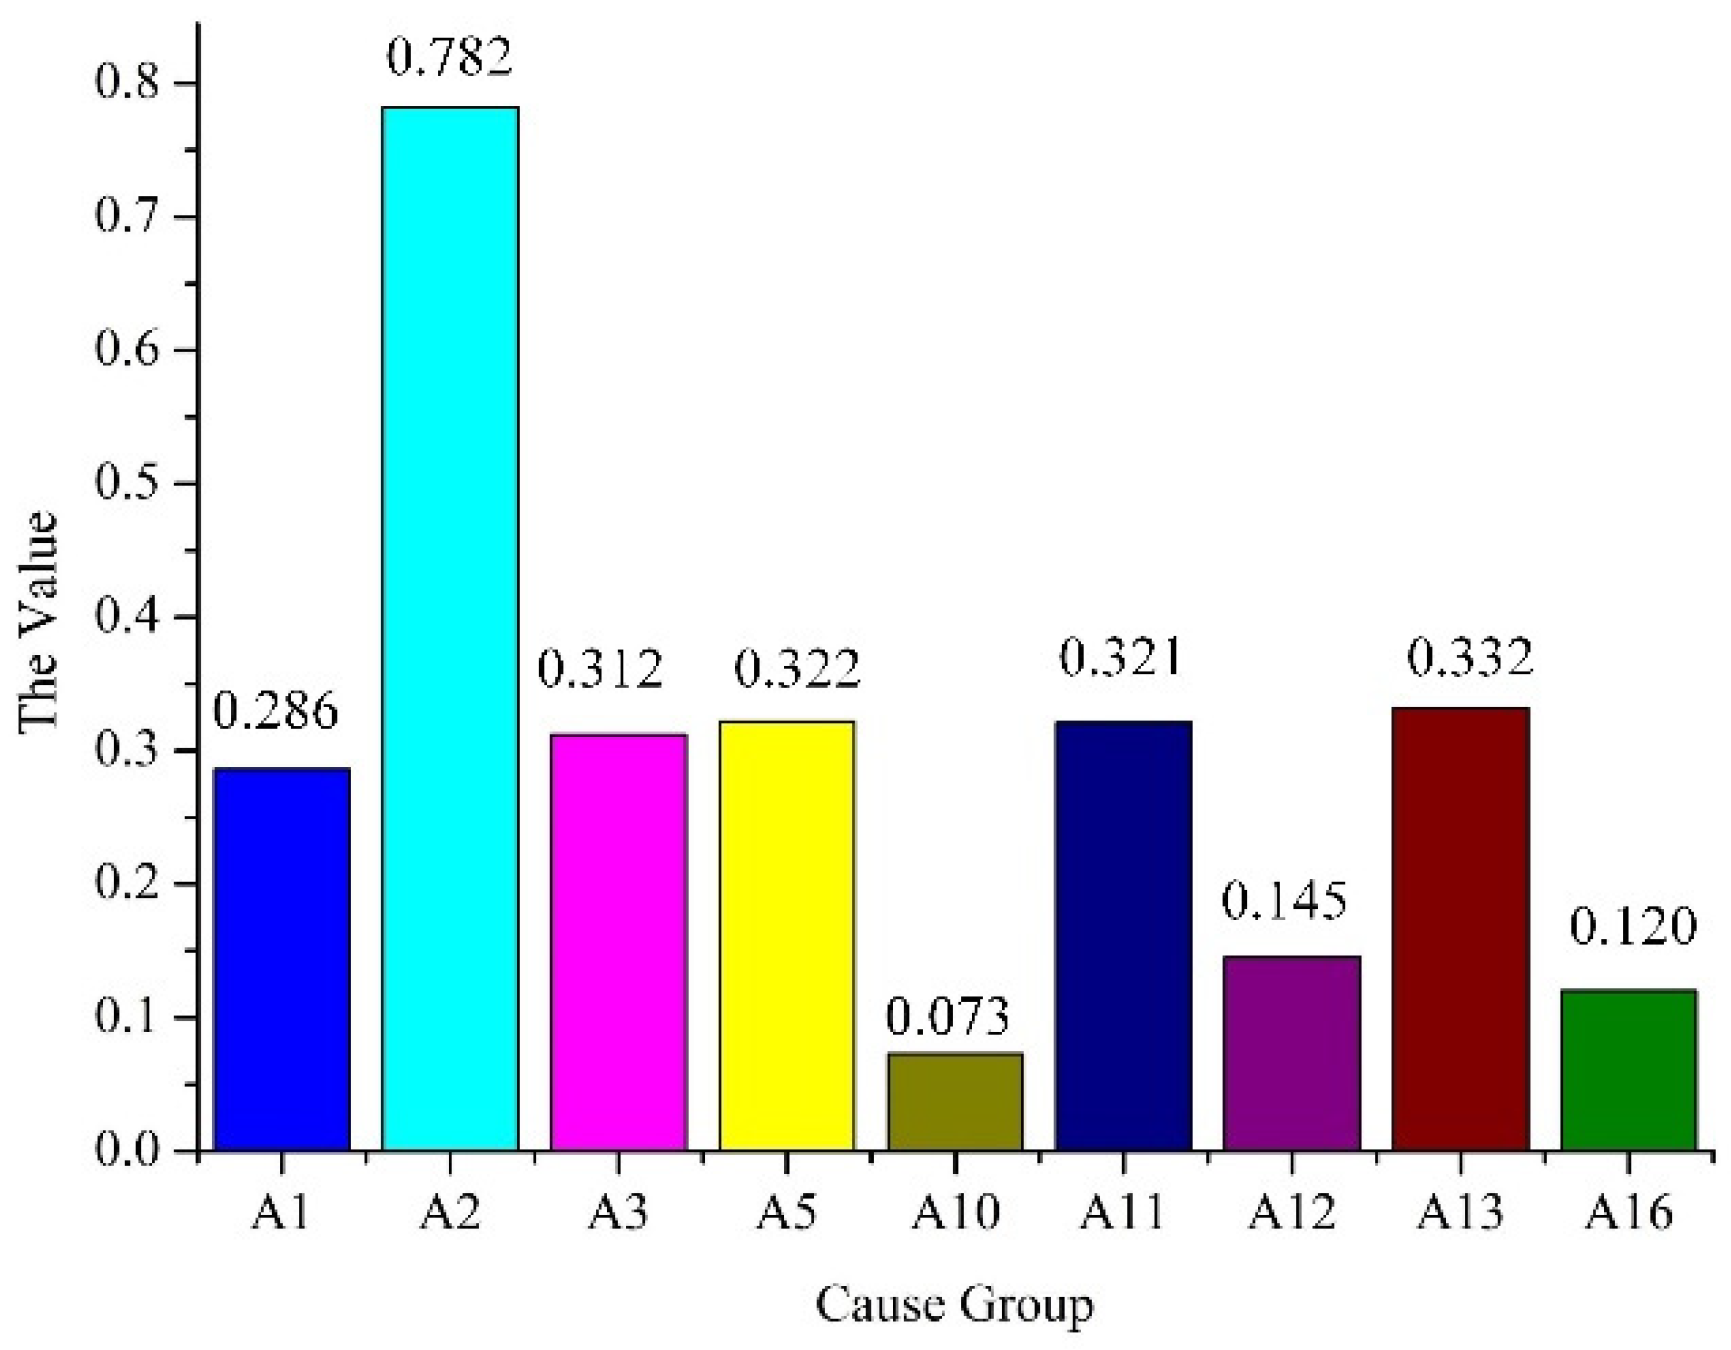
5.2. Results and Analysis

According to the results of the questionnaire, a fuzzy direct relationship matrix T in the form of fuzzy linguistic terms can be established. The fuzzy direct relationship matrix T is shown in Table 3. Using the centroid method, the fuzzy direct relationship matrix T is defuzzified into clear numbers, and transformed into the initial matrix F (Table 4), and the normalized direct relationship matrix X (Table 5) is established according to F , and then the total relationship matrix M is established (Table 6), and the row sum and column sum of the total relationship matrix M are calculated. Finally, a causality diagram is established, the results of (R + C) and (R − C) (Table 7) are calculated and used as the horizontal and vertical axes of the causality diagram, as shown in Figure 3.
The final results of our research are shown in Table 7 and Figure 3. According to Equations (7) and (8), we can know the elements in the cause group and the result group. The cause group includes drivers A1, A2, A3, A5, A10, A11, A12, A13, A16, and the effect group includes drivers A4, A6, A7, A8, A9, A14, A15. The results show that government regulations (A2), competitive advantage (A11), green supply chain pressure (A13) and green technology innovation (A5), incentive measures (A1) and standards (A3) are the six key drivers that promote the effective implementation of CER in the automotive industry. The most important driver is government regulations (A2). Half of the six key drivers are policy drivers. The fact is also true. The effective implementation of CER requires the government to formulate and supervise the implementation of environmental protection regulations and standards. Green supply chain pressure (A13), green technology innovation (A5) and competitive advantage (A11) rank second, third, and fourth among all important drivers. From the perspective of the effect group, it can be seen that media pressure (A15) ranks first in the effect group, and employee demand (A7) ranks last in the effect group.
As far as we know, there is no relevant analysis on the research directions involved in this paper, so it is impossible to give appropriate horizontal comparison results, but we have found similar experimental results in papermaking enterprises, industrial enterprises and the fashion industry. Among them, papermaking enterprises provide internal and external drivers for the company’s green and sustainable development [56]. External drivers include government pressure, social pressure and economic pressure. Internal drivers include management, employees, corporate culture, the size of the company, and the financial situation. Experimental results show that economic pressure is the first driving force, and internal management and employee environmental awareness are the second driving force. The external factors for the green development of industrial enterprises [57] include policy and institutional environment, market environment and public supervision, and internal factors include the tangible and intangible resources of the enterprise. In the fashion industry [58], there are similar results. The driving factors of the sustainable fashion industry are attributed to internal driving factors (entrepreneurial direction and founder culture, integration between different companies, innovation) and external driving factors (regulation, consumer awareness, competitiveness). Obviously, these have confirmed that government supervision, policies and regulations are the most important external driving factors for the manufacturing industry to fulfill its environmental responsibilities and implement environmental behaviors, which is basically consistent with the research results of this paper.
The verification is based on feedback from experts in the CAMI and references to relevant existing literature. After verification, our research results will be submitted to K Company.

6. Discussion

According to the research results, we drew a histogram of the key drivers and sorted the key drivers according to formula (9), as shown in Figure 4 and Table 8. It can be seen from Figure 4 and Table 8 that government regulations (A2) is the most important driver, ranking first. Only when the government and regulatory agencies jointly promote the automobile manufacturing industry to perform environmental responsibilities in strict accordance with regulations and standards can the company’s environmental and economic interests achieve balanced development. In addition, green supply chain pressure (A13), green technology innovation (A5), and competitive advantage (A11) rank second, third, and fourth. These are the key drivers for the company to implement CER. These identified key drivers are interrelated: the implementation of government regulations (A2) is conducive to the improvement of enterprises’ green technology innovation (A5), and promotes the improvement of enterprises’ competitive advantage (A11), and the green supply chain pressure (A13) can also promote enterprises to comply with the laws and regulations of higher-level government departments, and improve their compliance and compliance. The other five drivers, including standards (A3), incentives (A1), consumers demand (A12), market trend (A16), and company image (A10), are also important for implementation of CER, and they all have different degrees of each other. The following research will conduct a correlation analysis of the importance of all these key drivers.
In this study, we discussed the conclusions of the study and the importance of implementing CER, and drew some management implications including:
First of all, in order to accelerate the effective implementation of CER in CAMI, the government needs to improve the implementation and supervision of environmental protection policies and regulations, and increase the penalties for violations of environmental protection regulations. At the same time, it also encourages and praises companies that effectively implement CER and promote environmental improvements to promote its excellent practices. Second, the pressure of the upstream and downstream supply chains of automobile manufacturers also provides a strong impetus to promote the implementation of CER, because downstream consumers are more inclined to choose environmentally friendly products and are willing to pay for environmental protection. Upstream suppliers need to promote the design and development of more environmentally friendly and green products in the automobile manufacturing industry, thereby promoting the green innovation of upstream suppliers. Third, the green technological innovation of CAMI is also a very key driver, which is fundamentally the way for the enterprise to improve environmental performance and economic efficiency. Innovation is the source of all development; enterprises need to improve the construction of green technology innovation talent teams and increase the investment of green innovation costs. Fourth, the establishment of high-level environmental protection standards by the government and local governments is also a driving factor for enterprises to effectively implement CER. Finally, corporate incentives, public awareness of environmental protection, market trends, and corporate image can all have a positive impact on the implementation of CER by companies.

7. Conclusions and Future Work

Based on the perspective of TBL, and through the fuzzy DEMATEL method, we identified six key drivers from 16 common drivers, including government regulations (A2), green supply chain pressure (A13), green technological innovation (A5), competitive advantage (A11), standards (A3), and incentive measures (A1). These six key drivers are critical to the implementation of CER in CAMI. The main measures include the following: automobile manufacturers should improve the level of green technology innovation, pay attention to the needs of the upstream and downstream supply chain, improve the level of standard implementation, pay attention to competitive advantages, and formulate internal incentive mechanisms on the premise of meeting the requirements of government regulations. Only by continuing to meet the needs of all relevant parties can the company’s environmental and economic benefits be comprehensively improved, and the company’s green and sustainable development can be promoted. Through this research, K company can better understand the importance of CER practice to its own green development and sustainable development, and it is feasible to realize the coordinated development of economy, environment and society.
The work of this paper provides a valuable reference for the research and practice of CER in CAMI, finds the key drivers for the implementation of CER, and gives some management enlightenment. It is worth noting that this study still has certain limitations. First of all, in the process of identifying and evaluating drivers, the number of questionnaires is relatively limited. Secondly, due to the limited amount of data, the proposed method cannot be further and extensively verified. The verified situation of a small and medium-sized automobile manufacturing industry cannot fully represent the situation of China’s entire automobile manufacturing industry. The research conclusions cannot be widely applied to all automobile manufacturing industries, automobile sales companies, etc. These may constitute the basic elements of future research.
Therefore, the future research direction is from the perspective of the impact of the development of artificial intelligence and smart manufacturing technology on CAMI. The research perspective of CAMI’s implementation of CER can also be shifted from the perspective of TBL to other perspectives, such as technology and multiple stakeholders. Regarding model construction and selection of multicriteria decision-making methods, the existing fuzzy decision-making can be extended to more advanced intelligent decision-making models and decision-making algorithms. In addition, it may be very interesting to study the relationship between CAMI’s implementation of CER on corporate sustainable development and green development, and how to improve the company’s image and increase profitability.

Author Contributions

M.Z. and S.L. received the research, collected data, performed the analyses and wrote the paper. H.Z., W.Y., Z.J. and Y.L. provided support and helpful suggestions in setting up and revising the manuscript. All authors have read and agreed to the published version of the manuscript.

Funding

The authors are grateful for the research support from the National Natural Science Foundation of China (No. 51975432, 52075396).

Institutional Review Board Statement

Not applicable.

Informed Consent Statement

Informed consent was obtained from all subjects involved in the study.

Data Availability Statement

The datasets used and/or analyzed during the current study are available from the corresponding author on reasonable request.

Conflicts of Interest

The authors declare no conflict of interest.

References

  1. Zhao, F.W.; Zhao, B.J. Research on the Development Strategies of New Energy Automotive Industry Based on Car Charging Stations. Appl. Mech. Mater. 2015, 740, 985–988. [Google Scholar] [CrossRef]
  2. He, M.; Chen, J. Sustainable Development and Corporate Environmental Responsibility: Evidence from Chinese Corporations. J. Agric. Environ. Ethic 2009, 22, 323–339. [Google Scholar] [CrossRef]
  3. Li, P.C.; Zhang, H.M. Application Situation and Development Strategies of Green Manufacturing in China’s Automobile Industry. Adv. Mater. Res. 2014, 1049–1050, 945–948. [Google Scholar] [CrossRef]
  4. Severo, E.A.; de Guimarães, J.C.F.; Dorion, E.C.H. Cleaner production, social responsibility and eco-innovation: Generations’ perception for a sustainable future. J. Clean. Prod. 2018, 186, 91–103. [Google Scholar] [CrossRef]
  5. Jiang, Z.; Jiang, Y.; Wang, Y.; Zhang, H.; Cao, H.; Tian, G. A hybrid approach of rough set and case-based reasoning to remanufacturing process planning. J. Intell. Manuf. 2019, 30, 19–32. [Google Scholar] [CrossRef]
  6. Ding, Z.; Jiang, Z.; Zhang, H.; Cai, W.; Liu, Y. An integrated decision-making method for selecting machine tool guideways considering remanufacturability. Int. J. Comput. Integr. Manuf. 2018, 33, 686–700. [Google Scholar] [CrossRef]
  7. Elkington, J. Accounting for The Triple Bottom Line. Meas. Bus. Excel. 1998, 2, 18–22. [Google Scholar] [CrossRef]
  8. Mazurkiewicz, P. Corporate Environmental Responsibility: Is a Common CSR Framework Possible; World Bank: Washington, DC, USA, 2004; pp. 1–18. [Google Scholar]
  9. González-Rodríguez, M.R.; Díaz-Fernández, M.C.; Biagio, S. The perception of socially and environmentally responsible practices based on values and cultural environment from a customer perspective. J. Clean. Prod. 2019, 216, 88–98. [Google Scholar] [CrossRef]
  10. Nawaz, W.; Linke, P.; Koҫ, M. Safety and sustainability nexus: A review and appraisal. J. Clean. Prod. 2019, 216, 74–87. [Google Scholar] [CrossRef]
  11. Gunningham, N. Shaping corporate environmental performance: A review. Environ. Policy Gov. 2009, 19, 215–231. [Google Scholar] [CrossRef]
  12. Wang, H. Systematic analysis of corporate environmental responsibility: Elements, structure, function, and principles. Chin. J. Popul. Resour. Environ. 2016, 14, 96–104. [Google Scholar] [CrossRef]
  13. Cai, W.; Liu, C.; Lai, K.-H.; Li, L.; Cunha, J.; Hu, L. Energy performance certification in mechanical manufacturing industry: A review and analysis. Energy Convers. Manag. 2019, 186, 415–432. [Google Scholar] [CrossRef]
  14. Fujii, H.; Managi, S. Trends in corporate environmental management studies and databases. Environ. Econ. Policy Stud. 2016, 18, 265–272. [Google Scholar] [CrossRef] [Green Version]
  15. Liu, Y.; Xi, B.; Wang, G. The impact of corporate environmental responsibility on financial performance—Based on Chinese listed companies. Environ. Sci. Pollut. Res. 2021, 28, 7840–7853. [Google Scholar] [CrossRef] [PubMed]
  16. Shabbir, M.S.; Wisdom, O. The relationship between corporate social responsibility, environmental investments and financial performance: Evidence from manufacturing companies. Environ. Sci. Pollut. Res. 2020, 27, 39946–39957. [Google Scholar] [CrossRef] [PubMed]
  17. Kennard, A. The Enemy of My Enemy: When Firms Support Climate Change Regulation. Int. Organ. 2020, 74, 187–221. [Google Scholar] [CrossRef] [Green Version]
  18. Gong, J.Z.Y.; Wang, G. An Investigation into Triple Bottom Line Assessment of Eco-Friendly Office Supplies: File Folders; University of British Columbia: Vancouver, BC, Canada, 2014. [Google Scholar]
  19. Casey, E.; Beaini, S.; Pabi, S.; Zammit, K.; Amarnath, A. The Triple Bottom Line for Efficiency: Integrating Systems Within Water and Energy Networks. IEEE Power Energy Mag. 2017, 15, 34–42. [Google Scholar] [CrossRef]
  20. Fairley, S.; Tyler, B.D.; Kellett, P.; D’Elia, K. The Formula One Australian Grand Prix: Exploring the triple bottom line. Sport Manag. Rev. 2011, 14, 141–152. [Google Scholar] [CrossRef]
  21. Wise, N. Outlining triple bottom line contexts in urban tourism regeneration. Cities 2016, 53, 30–34. [Google Scholar] [CrossRef]
  22. Depken, D.; Zeman, C. Small business challenges and the triple bottom line, TBL: Needs assessment in a Midwest State, U.S.A. Technol. Forecast. Soc. Chang. 2018, 135, 44–50. [Google Scholar] [CrossRef]
  23. Tseng, M.-L.; Wu, K.-J.; Ma, L.; Kuo, T.C.; Sai, F. A hierarchical framework for assessing corporate sustainability performance using a hybrid fuzzy synthetic method-DEMATEL. Technol. Forecast. Soc. Chang. 2019, 144, 524–533. [Google Scholar] [CrossRef]
  24. Ahi, P.; Searcy, C. A stochastic approach for sustainability analysis under the green economics paradigm. Stoch. Environ. Res. Risk Assess. 2013, 28, 1743–1753. [Google Scholar] [CrossRef]
  25. Wu, K.-J.; Liao, C.-J.; Tseng, M.; Chiu, K.K.-S. Multi-Attribute Approach to Sustainable Supply Chain Management Under Un-Certainty. Ind. Manag. Data Syst. 2016, 116, 777–800. [Google Scholar] [CrossRef]
  26. Esquer-Peralta, J.; Velazquez, L.; Munguia, N. Perceptions of core elements for sustainability management systems (SMS). Manag. Decis. 2008, 46, 1027–1038. [Google Scholar] [CrossRef]
  27. Palvia, P.; Baqir, N.; Nemati, H. ICT for socio-economic development: A citizens’ perspective. Inf. Manag. 2018, 55, 160–176. [Google Scholar] [CrossRef]
  28. Tseng, M.-L.; Chiu, A.S.; Liang, D. Sustainable consumption and production in business decision-making models. Resour. Conserv. Recycl. 2018, 128, 118–121. [Google Scholar] [CrossRef]
  29. Bergenwall, A.L.; Chen, C.; White, R.E. TPS’s process design in American automotive plants and its effects on the triple bottom line and sustainability. Int. J. Prod. Econ. 2012, 140, 374–384. [Google Scholar] [CrossRef]
  30. Gimenez, C.; Sierra, V.; Rodon, J. Sustainable operations: Their impact on the triple bottom line. Int. J. Prod. Econ. 2012, 140, 149–159. [Google Scholar] [CrossRef]
  31. Neri, A.; Cagno, E.; Lepri, M.; Trianni, A. A triple bottom line balanced set of key performance indicators to measure the sustainability performance of industrial supply chains. Sustain. Prod. Consum. 2021, 26, 648–691. [Google Scholar] [CrossRef]
  32. Agrawal, S.; Singh, R.K. Analyzing disposition decisions for sustainable reverse logistics: Triple Bottom Line approach. Resour. Conserv. Recycl. 2019, 150, 104448. [Google Scholar] [CrossRef]
  33. Hussain, N.; Rigoni, U.; Orij, R.P. Corporate Governance and Sustainability Performance: Analysis of Triple Bottom Line Performance. J. Bus. Ethics 2018, 149, 411–432. [Google Scholar] [CrossRef]
  34. Chen, Y.; Lawell, C.-Y.C.L.; Muehlegger, E.J.; Wilen, J.E. Modeling Supply and Demand in the Chinese Automobile Industry. In Proceedings of the 2017 Annual Meeting, Chicago, IL, USA, 30 July–1 August 2017. [Google Scholar]
  35. Azevedo, S.; Barros, M. The application of the triple bottom line approach to sustainability assessment: The case study of the UK automotive supply chain. J. Ind. Eng. Manag. 2017, 10, 286–322. [Google Scholar] [CrossRef] [Green Version]
  36. Kumar, D.; Rahman, Z.; Chan, F.T.S. A fuzzy AHP and fuzzy multi-objective linear programming model for order allocation in a sustainable supply chain: A case study. Int. J. Comput. Integr. Manuf. 2017, 30, 535–551. [Google Scholar] [CrossRef]
  37. Mathivathanan, D.; Kannan, D.; Haq, A.N. Sustainable supply chain management practices in Indian automotive industry: A multi-stakeholder view. Resour. Conserv. Recycl. 2018, 128, 284–305. [Google Scholar] [CrossRef]
  38. Wang, H. Factor analysis of corporate environmental responsibility. Environ. Dev. Sustain. 2009, 12, 481–490. [Google Scholar] [CrossRef]
  39. Dummett, K. Drivers for Corporate Environmental Responsibility (CER). Environ. Dev. Sustain. 2006, 8, 375–389. [Google Scholar] [CrossRef]
  40. Kehbila, A.G.; Ertel, J.; Brent, A.C. Strategic corporate environmental management within the South African automotive industry: Motivations, benefits, hurdles. Corp. Soc. Responsib. Environ. Manag. 2009, 16, 310–323. [Google Scholar] [CrossRef]
  41. Cai, W.; Lai, K.-H.; Liu, C.; Wei, F.; Ma, M.; Jia, S.; Jiang, Z.; Lv, L. Promoting sustainability of manufacturing industry through the lean energy-saving and emission-reduction strategy. Sci. Total Environ. 2019, 665, 23–32. [Google Scholar] [CrossRef]
  42. Nunes, B.; Bennett, D. Green operations initiatives in the automotive industry: An environmental reports analysis and benchmarking study. Benchmarking: Int. J. 2010, 17, 396–420. [Google Scholar] [CrossRef]
  43. Yucheng, C.; You, J.; Wang, R.; Shi, Y. Designing a mixed evaluating system for green manufacturing of automotive industry. Probl. Ekorozwoju 2016, 11, 73–86. [Google Scholar]
  44. Babiak, K.; Trendafilova, S. CSR and environmental responsibility: Motives and pressures to adopt green management practices. Corp. Soc. Responsib. Environ. Manag. 2011, 18, 11–24. [Google Scholar] [CrossRef]
  45. Lee, J.W.; Kim, Y.M. Antecedents of Adopting Corporate Environmental Responsibility and Green Practices. J. Bus. Ethics 2016, 148, 397–409. [Google Scholar] [CrossRef]
  46. Goli, Y.S.; Ye, J.; Ye, Y.; Kalgora, B. Impact of Ecological Related Innovations Enhancing the Efficiency of Corporate Environmental Responsibility. Am. J. Ind. Bus. Manag. 2020, 10, 191–217. [Google Scholar] [CrossRef] [Green Version]
  47. Chen, Y.-S. The Drivers of Green Brand Equity: Green Brand Image, Green Satisfaction, and Green Trust. J. Bus. Ethics 2009, 93, 307–319. [Google Scholar] [CrossRef]
  48. Ho, C.-W. Does Practicing CSR Makes Consumers Like Your Shop More? Consumer-Retailer Love Mediates CSR and Behavioral Intentions. Int. J. Environ. Res. Public Heal. 2017, 14, 1558. [Google Scholar] [CrossRef] [PubMed] [Green Version]
  49. Jahanshahi, A.A.; Brem, A. Antecedents of Corporate Environmental Commitments: The Role of Customers. Int. J. Environ. Res. Public Heal. 2018, 15, 1191. [Google Scholar] [CrossRef] [Green Version]
  50. Sevinç, A.; Eren, T. Determination of KOSGEB Support Models for Small- and Medium-Scale Enterprises by Means of Data Envelopment Analysis and Multi-Criteria Decision Making Methods. Process 2019, 7, 130. [Google Scholar] [CrossRef] [Green Version]
  51. Wang, H.; Jiang, Z.; Zhang, H.; Wang, Y.; Yang, Y.; Li, Y. An integrated MCDM approach considering demands-matching for reverse logistics. J. Clean. Prod. 2019, 208, 199–210. [Google Scholar] [CrossRef]
  52. Hamdia, K.M.; Arafa, M.; Alqedra, M. Structural damage assessment criteria for reinforced concrete buildings by using a Fuzzy Analytic Hierarchy process. Undergr. Space 2018, 3, 243–249. [Google Scholar] [CrossRef]
  53. Wu, W.; Lan, L.W.; Lee, Y. Factors hindering acceptance of using cloud services in university: A case study. Electron. Libr. 2013, 31, 84–98. [Google Scholar] [CrossRef] [Green Version]
  54. Zadeh, L.A. Fuzzy Sets, Fuzzy Logic, and Fuzzy Systems: Selected Papers by Lotfi A Zadeh; State University of New York at Binghamton: New York, NY, USA, 1996; pp. 394–432. [Google Scholar] [CrossRef]
  55. Lin, R.-J. Using fuzzy DEMATEL to evaluate the green supply chain management practices. J. Clean. Prod. 2013, 40, 32–39. [Google Scholar] [CrossRef]
  56. He, Z.-X.; Shen, W.-X.; Li, Q.-B.; Xu, S.-C.; Zhao, B.; Long, R.-Y.; Chen, H. Investigating external and internal pressures on corporate environmental behavior in papermaking enterprises of China. J. Clean. Prod. 2018, 172, 1193–1211. [Google Scholar] [CrossRef]
  57. Li, X.; Du, J.; Long, H. Green Development Behavior and Performance of Industrial Enterprises Based on Grounded Theory Study: Evidence from China. Sustainability 2019, 11, 4133. [Google Scholar] [CrossRef] [Green Version]
  58. Dicuonzo, G.; Galeone, G.; Ranaldo, S.; Turco, M. The Key Drivers of Born-Sustainable Businesses: Evidence from the Italian Fashion Industry. Sustainability 2020, 12, 10237. [Google Scholar] [CrossRef]
Figure 1. The model framework for analyzing the drivers of CER in Chinese auto industry.
Processes 09 00751 g001
Figure 2. Triangular fuzzy number.
Processes 09 00751 g002
Figure 3. Cause–effect relation diagram.
Processes 09 00751 g003
Figure 4. Causes group histogram.
Processes 09 00751 g004
Table 1. Common drivers of corporate environment responsibility.
No.Main DriersExplanationCommon Drivers
1Policy driversPolicy drivers can be categorized into two areas, namely compulsory aspect (regulations, standards, etc.) and incentive aspect.Incentives (A1)
Government regulations (A2)
Standards (A3)
2Technological driversTechnological drivers can help corporate achieve the sustainable development.Green technology import (A4)
Green technology innovation (A5)
3Corporate internal motivationsThese motivations mainly focus on company level, such as its own development and the demand of company’s internal staff, etc.Top management commitment (A6)
Employee demand (A7)
Financial benefits (A8)
Shareholders motivation (A9)
Company image (A10)
Competitive advantage (A11)
4Corporate external pressureCompanies need to do things that they are unwilling to do but must do to meet the needs of the public.Consumers demand (A12)
Green supply chain pressure (A13)
Societal expectation (A14)
Media pressure (A15)
Market trend (A16)
Table 2. Correspondence between the linguistic terms and triangular fuzzy numbers.
Linguistic TermsTriangular Fuzzy Numbers
No influence (N)(0,0,0.25)
Very low influence (VL)(0,0.25,0.5)
Low influence (L)(0.25,0.5,0.75)
High influence (H)(0.5,0.75,1)
Very high influence (VH)(0.75,1,1)
Table 3. The fuzzy direct matrix T—the TBL’s perspective.
CriteriaA1A2A3A4A5A6A7A8A9A10A11A12A13A14A15A16
A1NVLVLHHHNHHNNNVLNVLH
A2LNVHLLHNLLNNVLHNHL
A3VLHNVLVLVLHLLNLLHLHL
A4LLVLNHHHLVLHHLHVLVLH
A5HLLVHNHVHVHHHVHLLHLH
A6LVLVLHHNHVLHHVLVLLLVLVL
A7NNVLLNHNVLLVLNNVLNVLN
A8VLVLLHVHHHNVHHLVLHNNL
A9VLVLNHHHLVLNNLVLVLHNVL
A10NNVLVLVLHLHNNHLNHHN
A11NNVLLHHNVHHHNHVLNNH
A12NVLHHVHHNHHVLLNVHLVLVH
A13VLVLHHHVLLLLNLHNHHH
A14NNVLVLHLNNVLVLNHLNHH
A15VLNLLLLLNNVLNHVLHNVL
A16LVLVLHHLNHHNVLHHHLN
Table 4. Initial relation matrix F—the TBL’s perspective.
CriteriaA1A2A3A4A5A6A7A8A9A10A11A12A13A14A15A16
A10.0820.250.250.750.750.50.0820.750.750.0820.0820.0820.250.0820.250.75
A20.50.0820.9280.50.50.750.0820.50.50.0820.0820.250.750.0820.750.5
A30.250.750.0820.250.250.250.750.50.50.0820.50.50.750.50.750.5
A40.50.50.250.0820.750.750.250.50.250.750.750.50.750.250.250.75
A50.750.50.50.9180.0820.750.9280.9280.750.750.9280.50.50.750.50.75
A60.50.250.250.750.750.0820.750.250.750.750.250.250.50.50.250.25
A70.0820.0820.250.50.0820.750.0820.250.50.250.0820.0820.250.0820.250.082
A80.250.250.50.750.9280.750.750.0820.9280.750.50.250.750.0820.0820.5
A90.250.250.0820.750.750.750.50.250.0820.0820.50.250.250.750.0820.25
A100.0820.0820.250.250.250.750.50.750.0820.0820.750.50.0820.750.750.082
A110.0820.0820.250.50.750.750.0820.9280.750.750.0820.750.250.0820.0820.75
A120.0820.250.750.750.9280.750.0820.750.750.250.50.0820.9280.50.250.928
A130.250.250.750.750.750.250.50.50.50.0820.50.750.0820.750.750.75
A140.0820.0820.250.250.750.50.0820.0820.250.250.0820.750.50.0820.750.75
A150.250.0820.50.50.50.50.50.0820.0820.250.0820.750.250.750.0820.25
A160.50.250.250.750.750.50.0820.750.750.0820.250.750.750.750.50.082
Table 5. The normalized direct-relation matrix X—the TBL’s perspective (×10−2).
CriteriaA1A2A3A4A5A6A7A8A9A10A11A12A13A14A15A16
A10.82.32.30.70.74.70.8770.80.80.82.30.82.37
A24.70.88.54.74.770.84.74.70.80.82.37874.7
A32.370.82.32.32.374.74.70.84.74.774.774.7
A44.74.72.38774.74.72.3774.770.22.37
A574.74.78.50.878.58.5778.54.74.774.77
A64.72.32.3770.872.3772.32.34.74.72.32.3
A70.80.82.34.74.770.82.372.30.80.82.30.82.30.8
A82.32.32.372.3770.84.774.72.370.80.84.7
A9 2.32.34.77774.72.38.50.84.72.32.370.82.3
A100.80.80.84.72.374.770.80.874.70.8770.8
A110.80.82.34.7770.88.5770.874.70.80.87
A120.82.3778.570.8772.34.70.88.54.72.38.5
A132.32.37772.34.74.74.70.84.78.50.8777
A140.80.82.32.374.70.80.82.32.30.88.54.70.877
A152.30.84.74.74.74.7470.80.82.30.88.52.370.82.3
A1672.32.3774.70.8770.32.38.5774.70.8
Table 6. The total relation matrix M—the TBL’s perspective (×10−2).
CriteriaA1A2A3A4A5A6A7A8A9A10A11A12A13A14A15A16
A16.26.78.216.315.913.87.714.515.16.77.38.310.37.58.114.6
A210.55.915.315.315.116.98.813.214.07.28.011.215.98.813.913.6
A38.011.48.113.113.213.014.113.214.07.114.413.616.012.313.913.7
A411.39.910.213.419.019.013.315.313.514.515.214.617.19.310.417.2
A515.211.514.524.216.822.819.421.520.916.818.817.618.017.914.820.2
A610.37.19.117.517.411.614.611.316.013.49.811.013.312.39.411.3
A74.43.76.311.010.913.115.87.510.16.65.35.97.65.56.36.0
A88.17.19.117.713.217.614.69.817.713.512.111.015.78.77.713.4
A9 7.76.810.716.416.616.411.610.49.57.211.210.310.713.67.210.8
A105.44.56.413.511.415.911.014.08.87.012.712.28.613.012.48.6
A117.16.09.616.518.218.39.418.117.214.29.116.114.49.58.116.5
A128.58.715.620.521.820.010.918.219.010.914.112.42.114.711.320.0
A139.38.315.319.719.815.213.615.316.08.713.319.312.216.215.218.1
A146.04.98.511.816.113.57.48.610.57.97.116.312.68.112.914.8
A156.94.810.213.113.413.110.68.08.57.66.715.59.913.16.610.0
A1613.78.110.819.919.917.29.917.418.38.811.118.917.916.112.812.3
Table 7. The values of R, C, (R + C), (R − C)—the TBL’s perspective.
CriteriaRCR + CR − C
A11.672 1.3863.058 0.286
A21.936 1.1543.090 0.782
A31.991 1.6793.670 0.312
A42.232 2.5994.831 −0.367
A52.909 2.5875.496 0.322
A61.954 2.5744.528 −0.620
A71.260 1.9273.187 −0.667
A81.970 2.1634.133 −0.193
A91.771 2.2914.062 −0.520
A101.654 1.5813.235 0.073
A112.083 1.7623.845 0.321
A122.287 2.1424.429 0.145
A132.355 2.0234.378 0.332
A141.670 1.8663.536 −0.196
A151.580 1.710 3.290 −0.130
A162.331 2.2114.542 0.120
Table 8. The sequencing of the key drivers.
Key DriversR − CRgRanking
Incentives (A1)0.286 36.576
Government regulations (A2)0.782 100.001
Standards (A3)0.312 39.895
Green technology innovation (A5)0.322 41.183
Company image (A10)0.073 9.349
Competitive advantage (A11)0.321 41.044
Consumers demand (A12)0.145 18.547
Green supply chain pressure (A13)0.332 42.462
Market trend (A16)0.120 15.358
Publisher’s Note: MDPI stays neutral with regard to jurisdictional claims in published maps and institutional affiliations.

