Article

Performance of Commercially Open Refrigerated Showcases with and without Ice Storage—A Case Study

1
Department of Refrigeration, Air Conditioning, and Energy Engineering, National Chin-Yi University of Technology, Taichung 411, Taiwan
2
Green Energy & Environment Research Laboratories, Industrial Technology Research Institute, Hsinchu 310, Taiwan
3
Department of Mechanical Engineering, National Yang Ming Chiao Tung University, Hsinchu 300, Taiwan
*
Author to whom correspondence should be addressed.
Processes 2021, 9(4), 683; https://doi.org/10.3390/pr9040683
Submission received: 28 March 2021 / Revised: 7 April 2021 / Accepted: 9 April 2021 / Published: 13 April 2021

Abstract

:
This study examines the applicability of the ice storage systems in the small commercial refrigerated showcases through experimental analysis. R-404A is used as the working fluid and various influence of parameter settings and improvements, are discussed in details. In the ice storage system, the condenser is changed from air-cooling (refrigeration mode) to an immersion type that is placed in an ice storage tank, the corresponding condensing temperature and pressure are reduced appreciably. This increased the efficiency and can effectively reduce the peak power consumption. The reduction of the condensing temperature and pressure increased the coefficient of performance (COP) from 3.6 (refrigeration mode) to 6.35 (melting mode), effectively enhancing the refrigeration efficiency. The results indicated that the ice storage system could effectively increase the coefficient of performance from 3.6 to 6.35 during ice melting when compared to the conventional refrigeration system. It also can shift approximately 35% of the power during peak hours and lower the energy cost by USD$ 17.13 per month.

1. Introduction

Effective energy management is a must-have upon nowadays energy technology. Among the available management approaches, thermal energy storage technology can manage and adjust the energy supply demand, thereby offering efficient power management on demand. As a result, flexible and economical energy usage becomes feasible. This is especially viable for subtropical or tropical climate where high temperatures prevails during summer, and accordingly it requires an extremely high power demand for the refrigeration and air-conditioning systems. However, the massive energy demand during peak hours impact the power grid appreciably and raises serious concerns for the risk of circuit breaker trips. Hence, it is quite imperative for shifting the peak load of the power grid. Some potential Heating, Ventilation, Air conditioning and refrigerating (HVAC&R) equipment that can offer peak load shifting includes chillers, refrigerator, and showcases. Note that commercial refrigerators and showcases have become an indispensable appliance in food sales. In the meantime, their corresponding high penetration usage rates also incurs gigantic energy consumption that needs to be tailored and improved. This is especially important when operating at peak loading period. Hence one of the possible means is to employ cold storage at the off-peak period and relive the peak loading with the cold storage during peak hours.
Yau and Rismanchi [1] explained that the thermal storage systems can substantially reduce the difference of power usage between peak and off-peak hours and transfer part of the peak load from peak hours to off-peak hours to balance the power demand. This prevents power generation equipment from being idle and eases the severe problem of power shortages during peak hours. Power companies in various countries have implemented different electricity rate structures [2] to shift the peak power demand to off-peak power load. This can be made available by raising or lowering the electricity bill during peak hours and off-peak hours, respectively. Hence, users can benefit from the time-of-use (TOU) rate and preferential policies established by power companies. The incentives issued by countries worldwide have encouraged the installation of thermal storage systems in medium-sized and large office buildings [2], schools [3], and hospitals [4], respectively.
In conventional air-conditioning/refrigeration systems, the cooling demand is supplied only when required [5]. However, in thermal storage systems, the refrigeration system may be still functional even without cooling demand. In essence, it generates and stores cold energy during off-peak hours and relieve the cooling capacity during the daytime. This so called “ice-storage” technology and has been successfully applied to many existing systems. Research results indicated that the technology not only transfers the peak power consumption, but also can offer some advantages such as reducing the energy cost, improving the efficiency and effectiveness of equipment utilization, and enhancing the operational flexibility [5]. Cold storage systems can store a large amount of cold energy through phase change of the cold storage materials. Zhong et al. [6] provided an overview of various phase-change materials for thermal energy storage and their applications for the business and industrial cold storage systems. In their comprehensive demonstration of current thermal storage technologies, Dincer [7] and Wood et al. [8] highlighted the promising opportunities for the industrial application of thermal storage systems, which can generate thermal energy though the produced stored power during off-peak hours to reduce the cooling load during peak hours and to lower the electricity bill accordingly.
Farid et al. [9] suggested employing different applications and technology innovations of the phase-change thermal storage method. Oró et al. [10] illustrated that all latent heat storage systems should consist of the following three components: (1) thermal storage materials that initiate the solid–liquid phase change within the operation temperature range, with most of the stored thermal energy being used as the latent heat during phase changes; (2) material storage containers; and (3) a heat exchange surface that transfers thermal energy from the heat source to the thermal storage materials and from the materials to the heat dissipator. Hasnain [11] listed the applicable temperature range of phase-change materials and introduced a potential application of phase-change materials to thermal storage technology.
For latent heat storage amid solid–vapor, liquid–vapor transitions, and solid–liquid transition, the latter is more preferable because of small volume changes. Solid–vapor and liquid–vapor transitions for cold storage is not economical due to their complexity and large volume changes [12]. Hasnain [13] studied the latent heat storage amid cold water, ice, and eutectic salt storage systems. Upon low-temperature refrigerant evaporation, an ice maker can effectively freeze water in the ice storage tank for storing a massive amount of cold energy. The cost of the system depended on the deployed size of the system, location, and geographic and economic conditions of the implementation site. Hajiah and Krarti [14] inspected latent heat storage systems for typical office building models under different climate conditions, the effects of different design options on the cost issue were examined and discussed, and a proper optimization design is proposed. Their findings indicated that the application of the cooling system could yield up to 40% saving of the total operating cost.
Regarding the design of an ice storage tank, Ahmadi et al. [15] ran a numerical simulation for a solenoid thermal storage system. Spiral heat exchanger is used as freezer as compared to those commonly used straight tube. The geometric and operating parameters were analyzed (e.g., the influence of the diameters of the solenoids and tubes, mass and flow of the working fluid, and inlet temperature on the performance). Esapour et al. [16] evaluated the influence of different parameters (i.e., the number of inner tubes, inlet temperature of the working fluid, and mass flow rate) on the ice storage procedure of a tube-in-tube heat exchanger with multi-tube configurations. The results revealed that the total melting time could be reduced as much as 29% when the number of inner tubes is increased from one to four. Yan et al. [17] employed heat pipes into the cold storage system to examine the influence of a seasonal ice-storage technology that stores cold energy during winter and melts ice during summer, and conducted the experiment in a building in Beijing. The results indicated that proper combination of the two types of cold storage system was capable of utilizing seasonal cold energy effectively, thereby reducing the system’s life cycle cost by 40%.
Lemort [18] demonstrated that the use of ice storage systems greatly increases power consumption. However, such problem could be tailored through the rate difference charged by power companies in different periods and the incentive electricity rate for ice storage systems. In essence, the operating costs can be effectively reduced with TOU rate plans. Henze et al. [19] mentioned that infrastructure of electricity bill determines the return of invest of an ice storage system.
Ice storage systems can generally be operated using two strategies, namely, full storage or partial storage. Chaichana et al. [20] compared the total energy consumption of full and partial-storage systems with that of a conventional cooling system. Either full or partial systems are both economically attractive upon using the TOU rate plans. The full-storage technology reduces the cost by 55%, while 15% reduction in attainable via partial-storage.
From the aforementioned literatures, thermal storage systems can effectively improve the power supply imbalance problem caused by excessive cold-storage power consumption during peak hours as well as lowering the electricity bills. Commercial refrigerators and showcases have become an indispensable appliance in food sales, and their high penetration and utilization rates also result in extremely high energy consumption; and the equipment is running in both off-peak and peak hours. Therefore, they contain the potential to shift electrical bill in the peak hours by employing the cold storage concept. However, there were virtually no studies regarding ice storage systems in such small refrigerated showcases. Consequently, it is the purpose of this study to demonstrate the feasibility of a small cold storage system. The system stored cold energy during off-peak hours and released it during peak hours to relax the required peak load.

2. Equipment and Methods

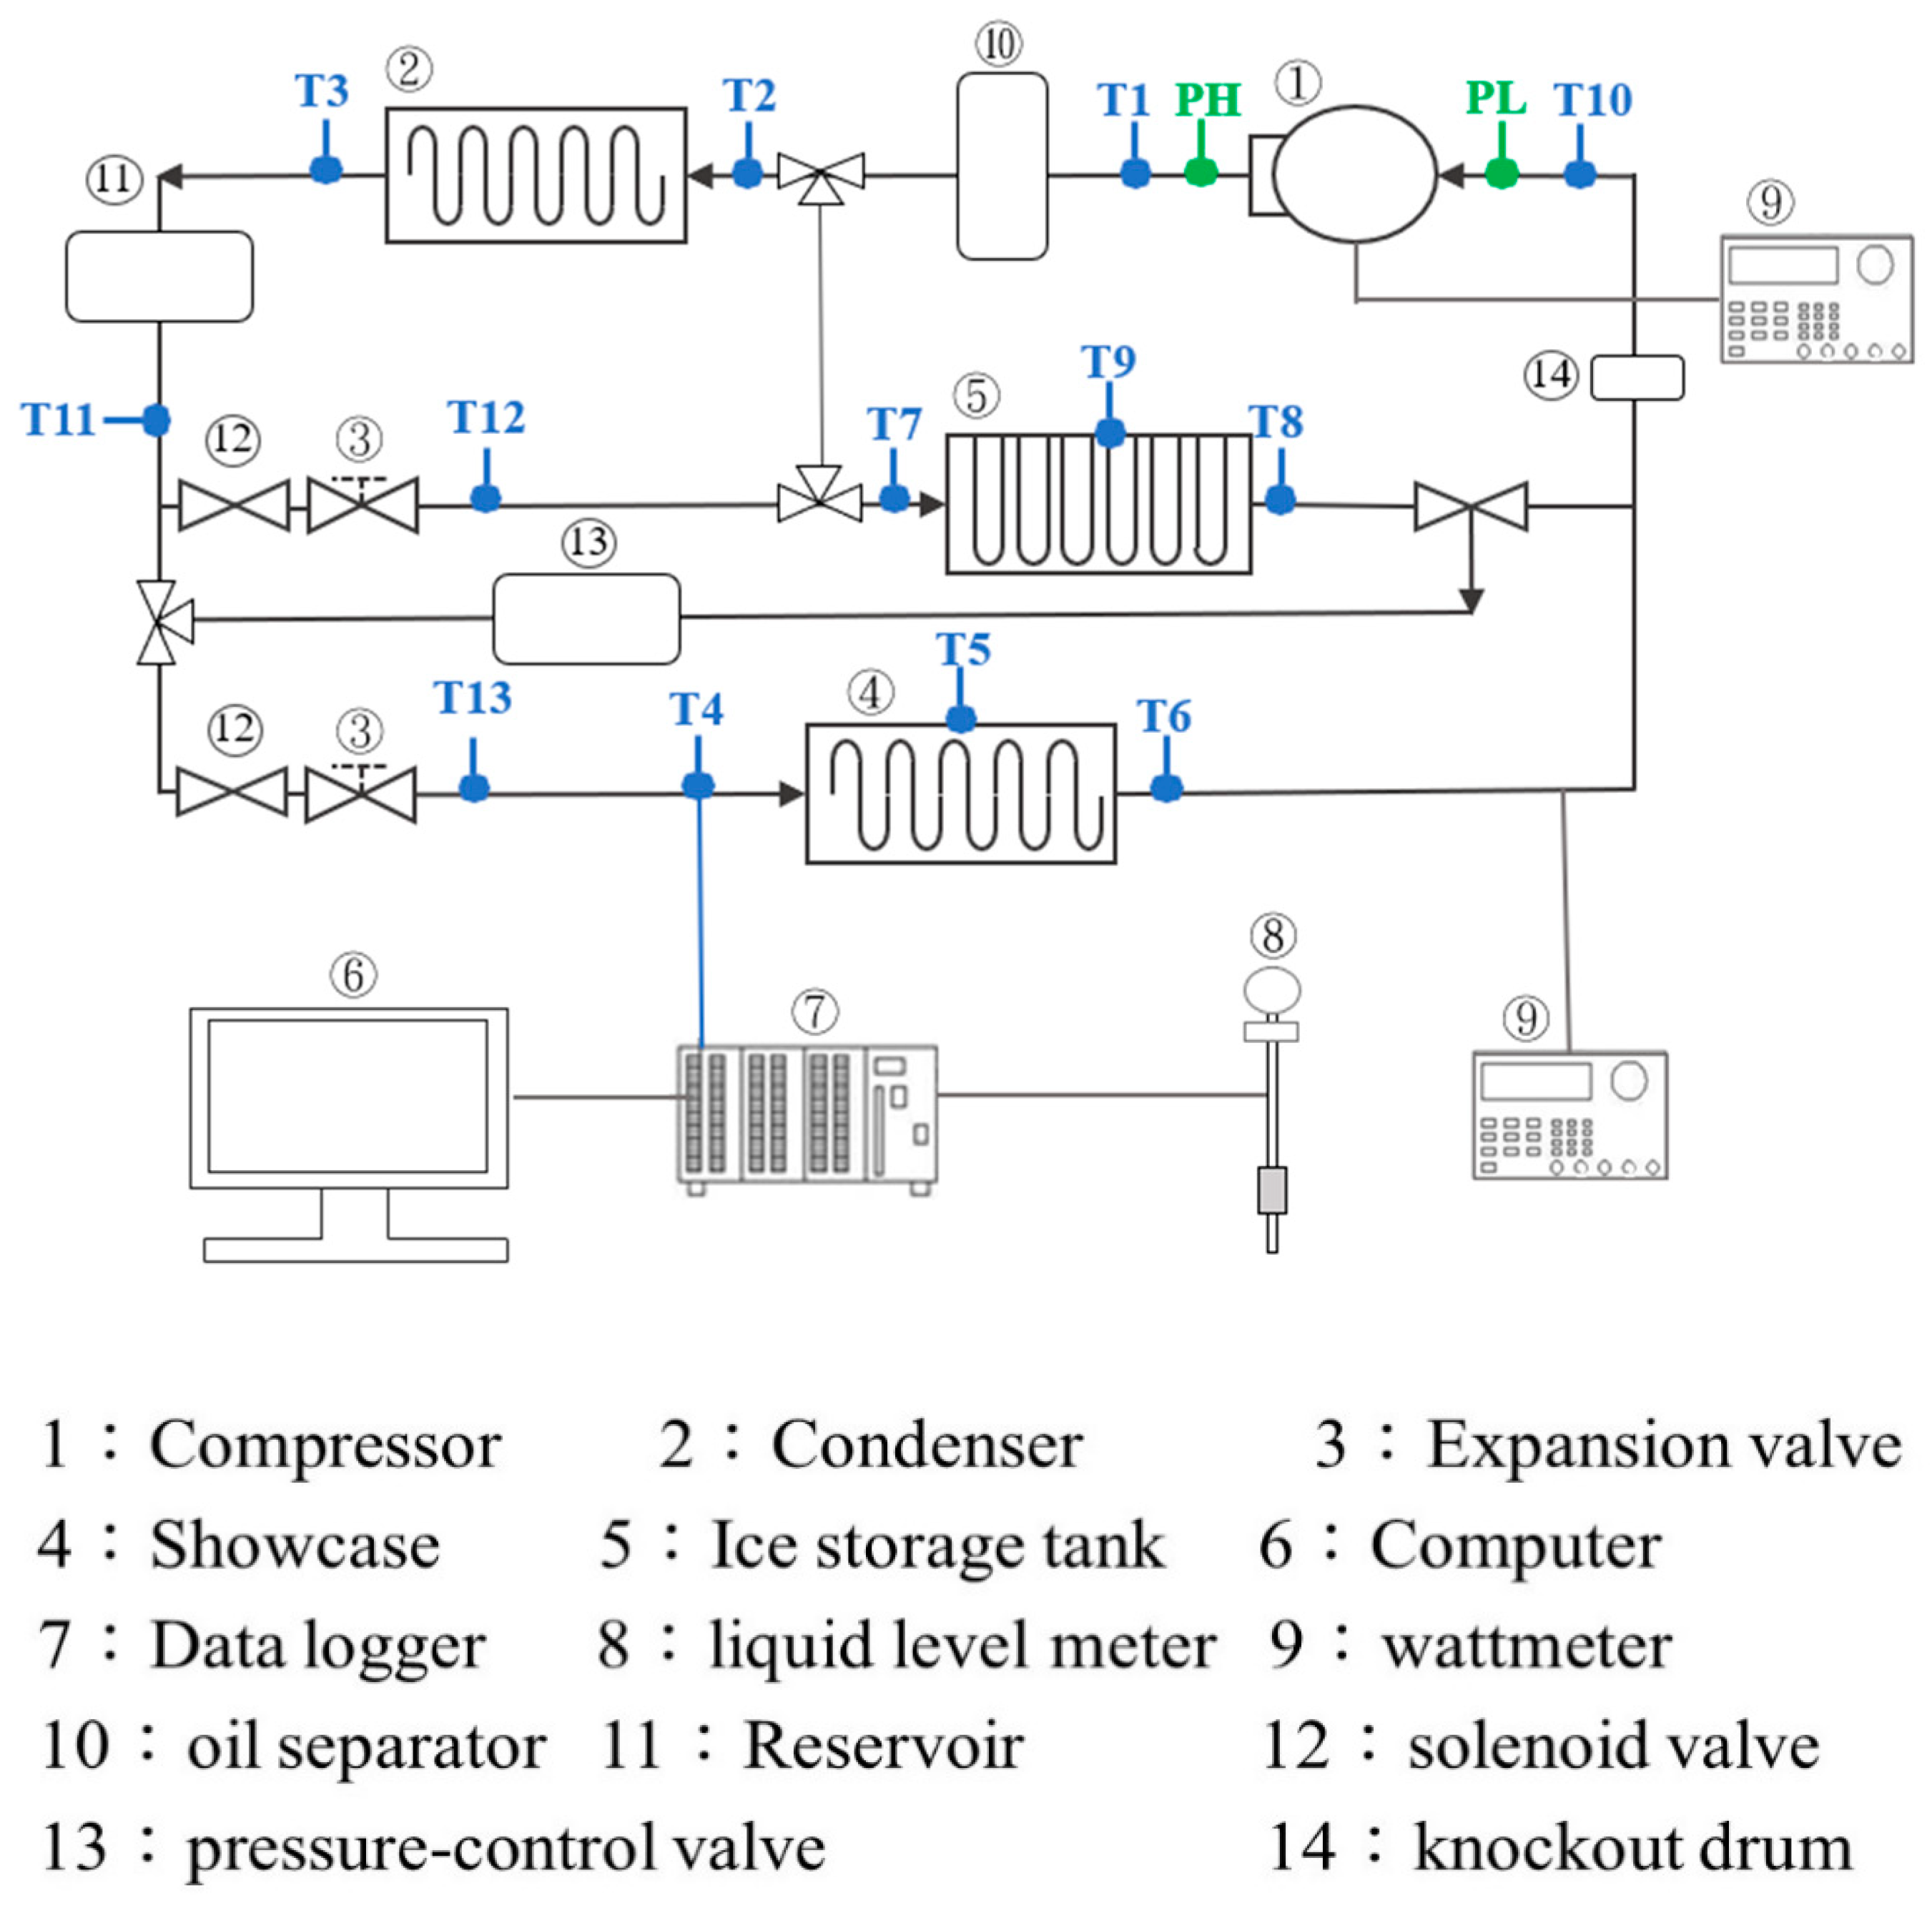
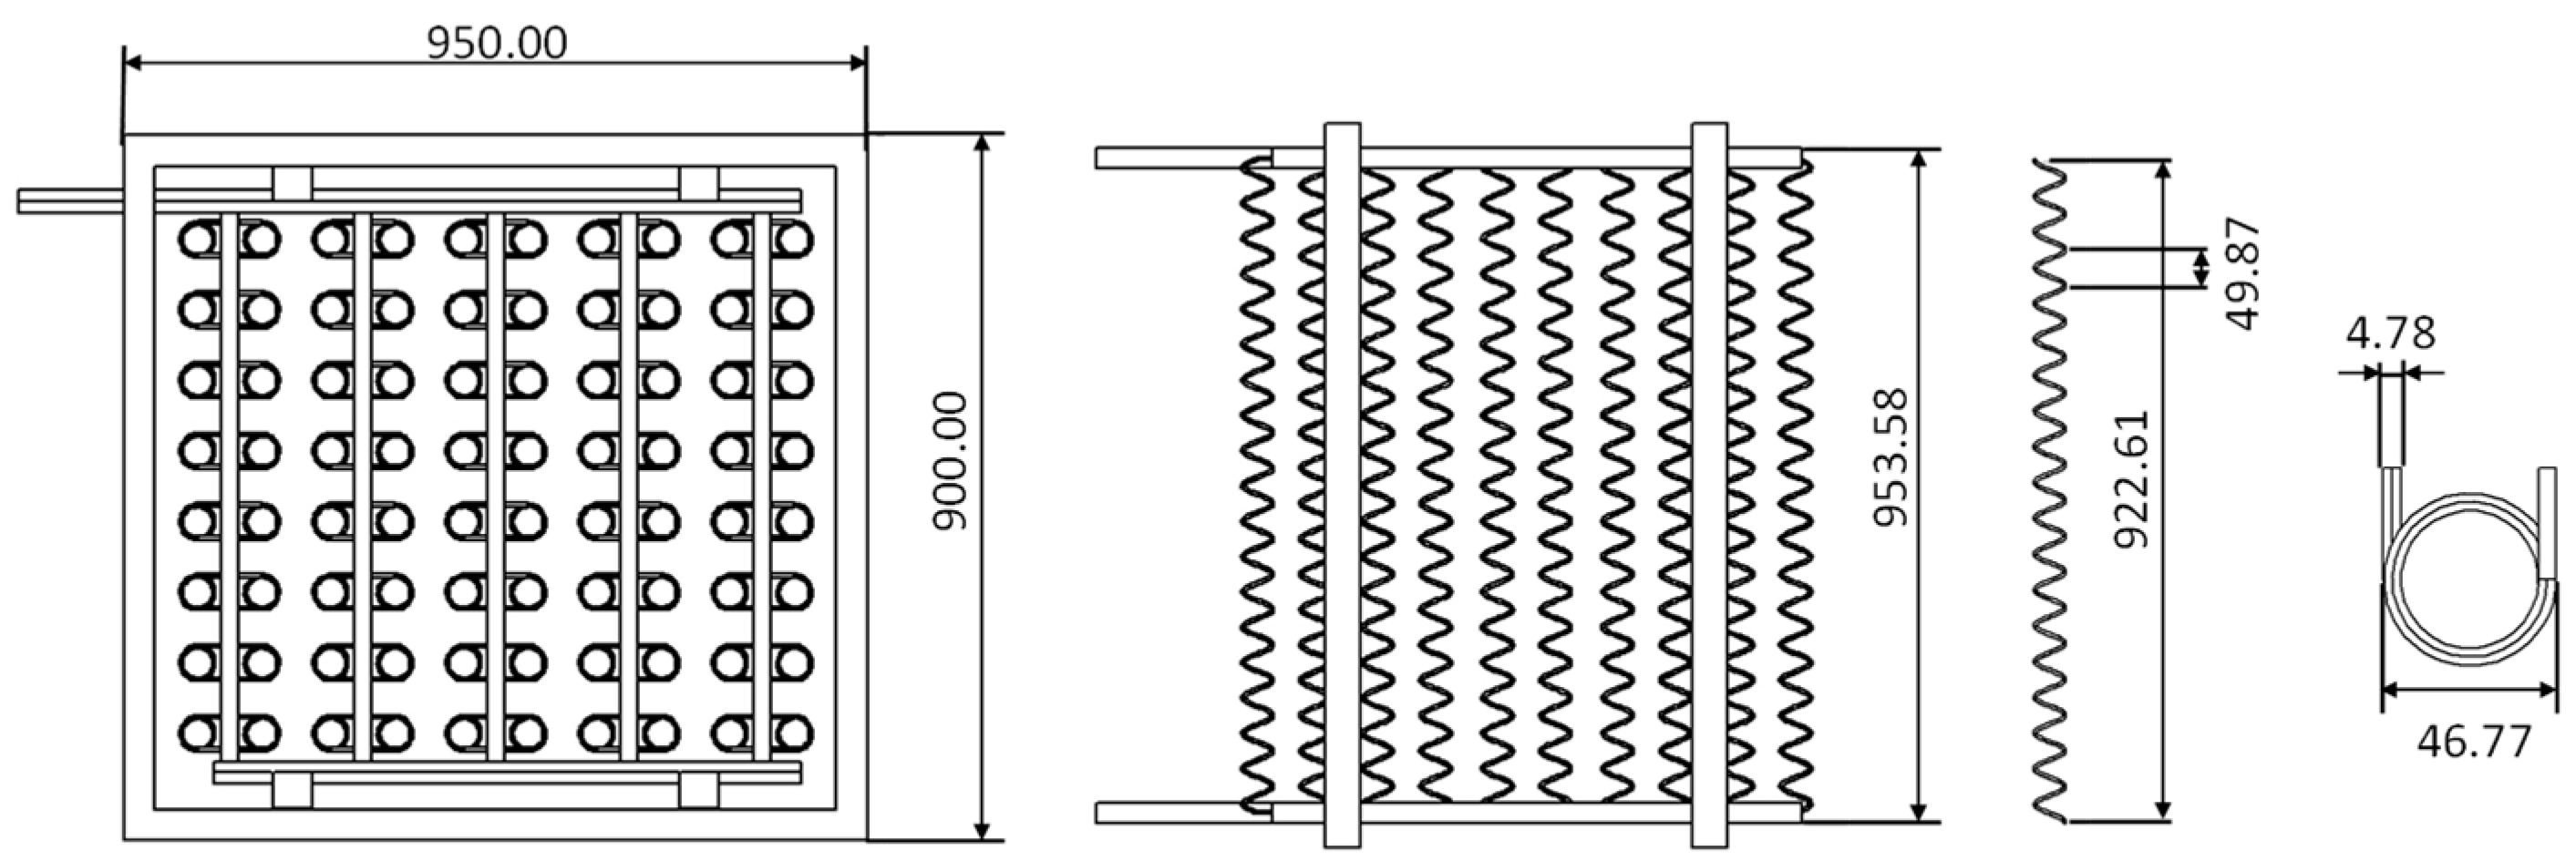
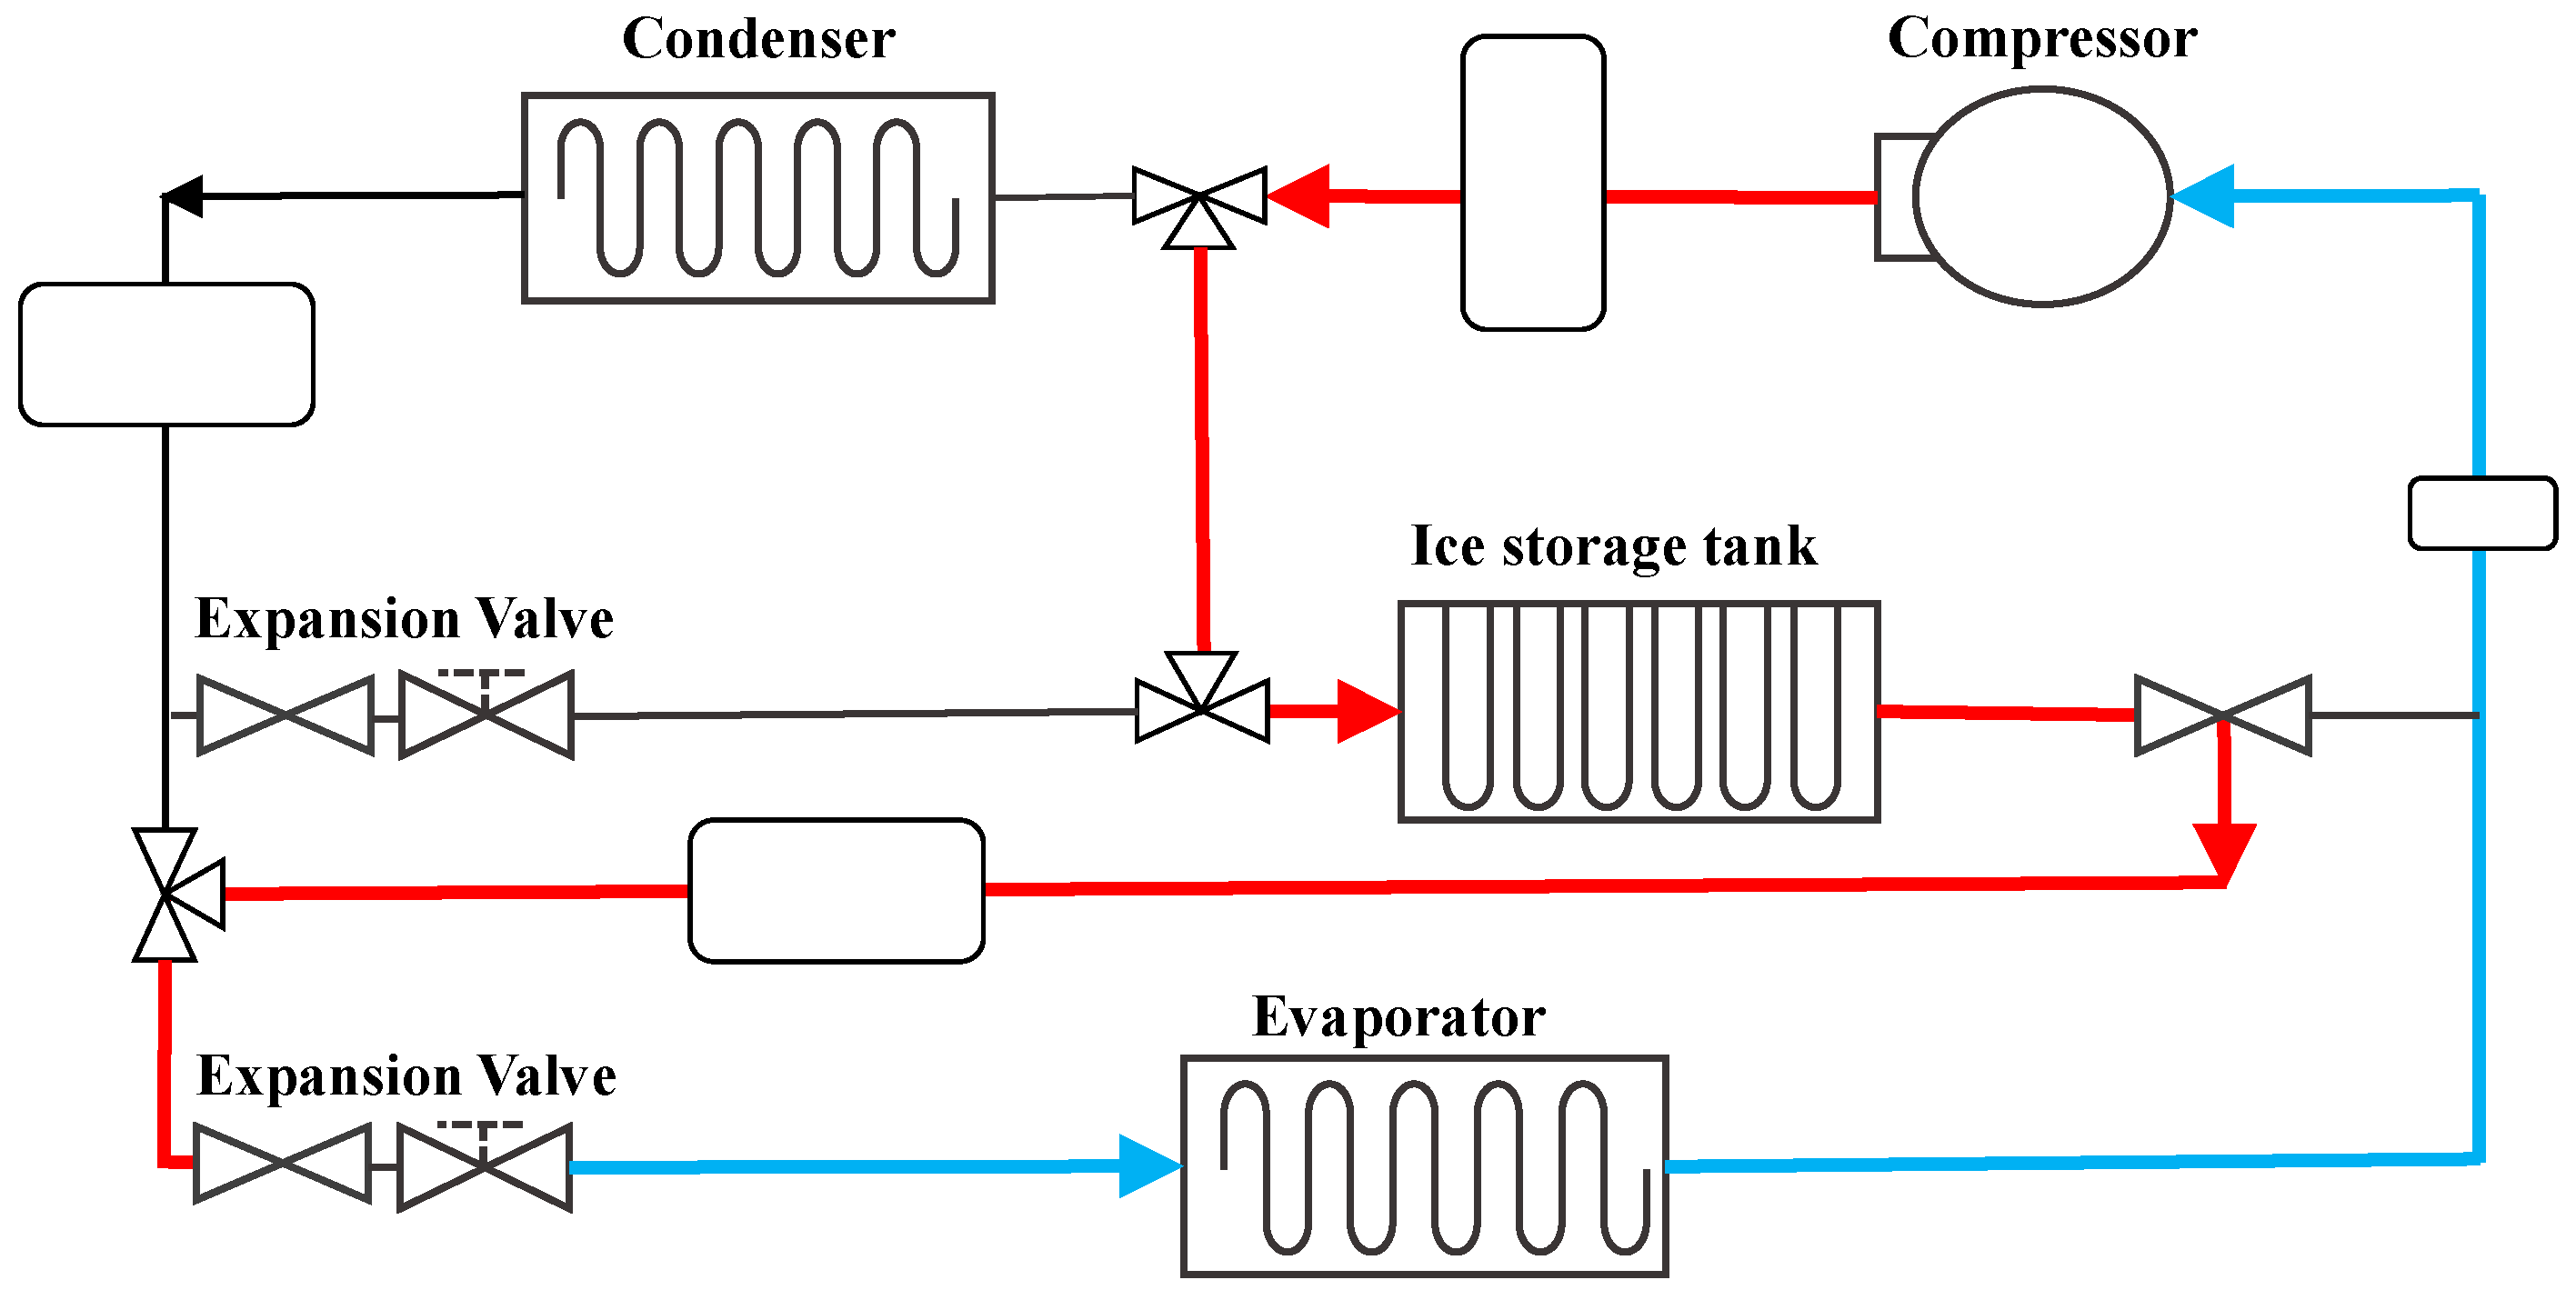
2.1. Experimental Equipment

The experimental equipment used in this study is illustrated in Figure 1. The equipment was composed of a compressor refrigeration system, an ice storage tank, an oil separator, a reservoir, a solenoid valve, a control valve, a liquid level meter, and a wattmeter. The cold storage is implemented via an internal melt ice-on-coil storage method and containing a SANYO C-SB263H6B compressor (Taipei, Taiwan) with R-404A refrigerant (Taipei, Taiwan) for the ice storage system. The refrigerant circuit is made by cooper tubes. A 6-foot, back slant, open showcase (OP-MFS75604P), (Taichung, Taiwan) with dimensions of 1830 (W) × 750 (D) × 1900 (H) mm having an effective volume of 900 L with a nominal refrigeration capacity of 3.54 kW, was used as an evaporator. The design of the ice storage tank is shown in Figure 2. The dimensions were 870 (W) × 820 (D) × 1060 (H) mm. However, spiral copper tubes were used for further heat transfer augmentation. The spiral heat exchanger contains a total of 12 manifolds and 80 spiral copper tubes.
T-type thermocouples were used and attached to the inlet/outlet of the compressor, condenser, expansion valves, and ice storage tank for temperature measurement. The measured temperatures were recorded individually. The variations of the thermocouples were within 0.2 °C. Prior to the isothermal test, they were calibrated using a quartz thermometer with an accuracy of 0.01 °C. A pressure sensor (Gems 3100) (Taichung, Taiwan) was installed at the inlet/outlet of the compressor to record the pressure changes of the system, and a float-type liquid level meter (Dwyer CLT-CS3F1) (Michigan City, IN, USA) with a measuring range of 0–30 cm was employed to measure the changes in liquid level and then to calculate the ice storage rate. All relevant data were converted by a data acquisition system (Yokogawa MX100) (Musashino City, Tokyo, Japan) and sent to a computer through the network interface for further analysis. A three-phase analyzer (HIOKI PW3360) (Japan-Ueda City, Nagano Prefecture) was used to detect the power consumption with measurement of once in every 10 s. The voltage accuracy was ±0.3%, and the current accuracy was ±0.3%.

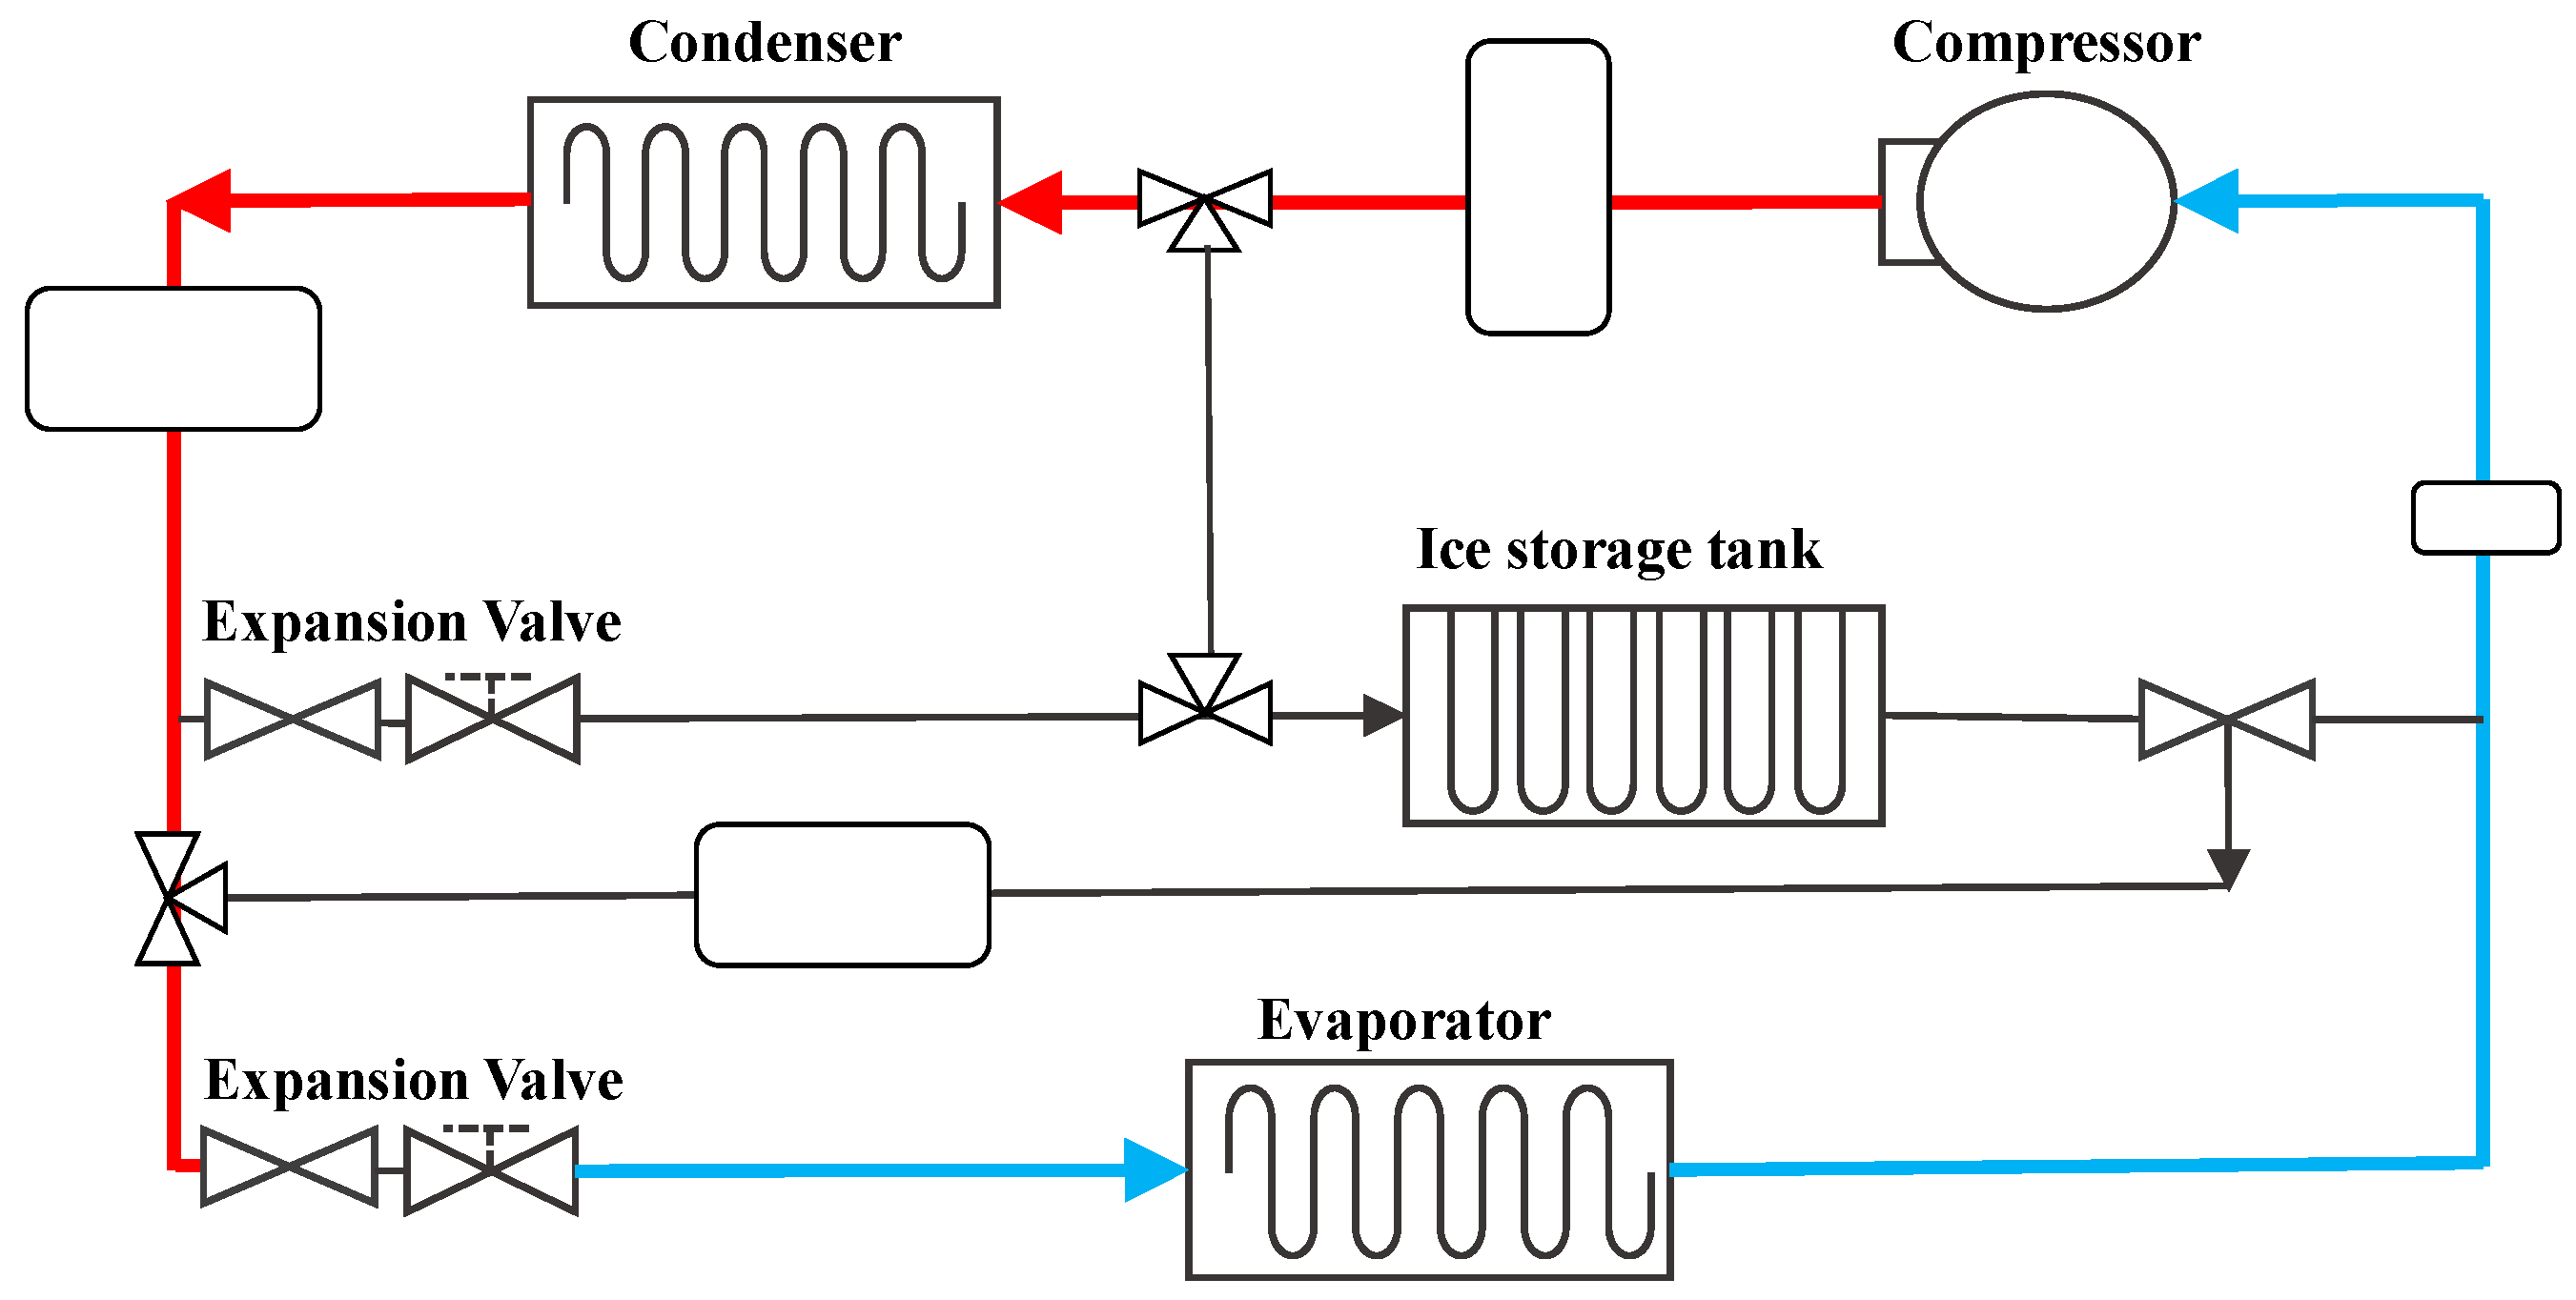
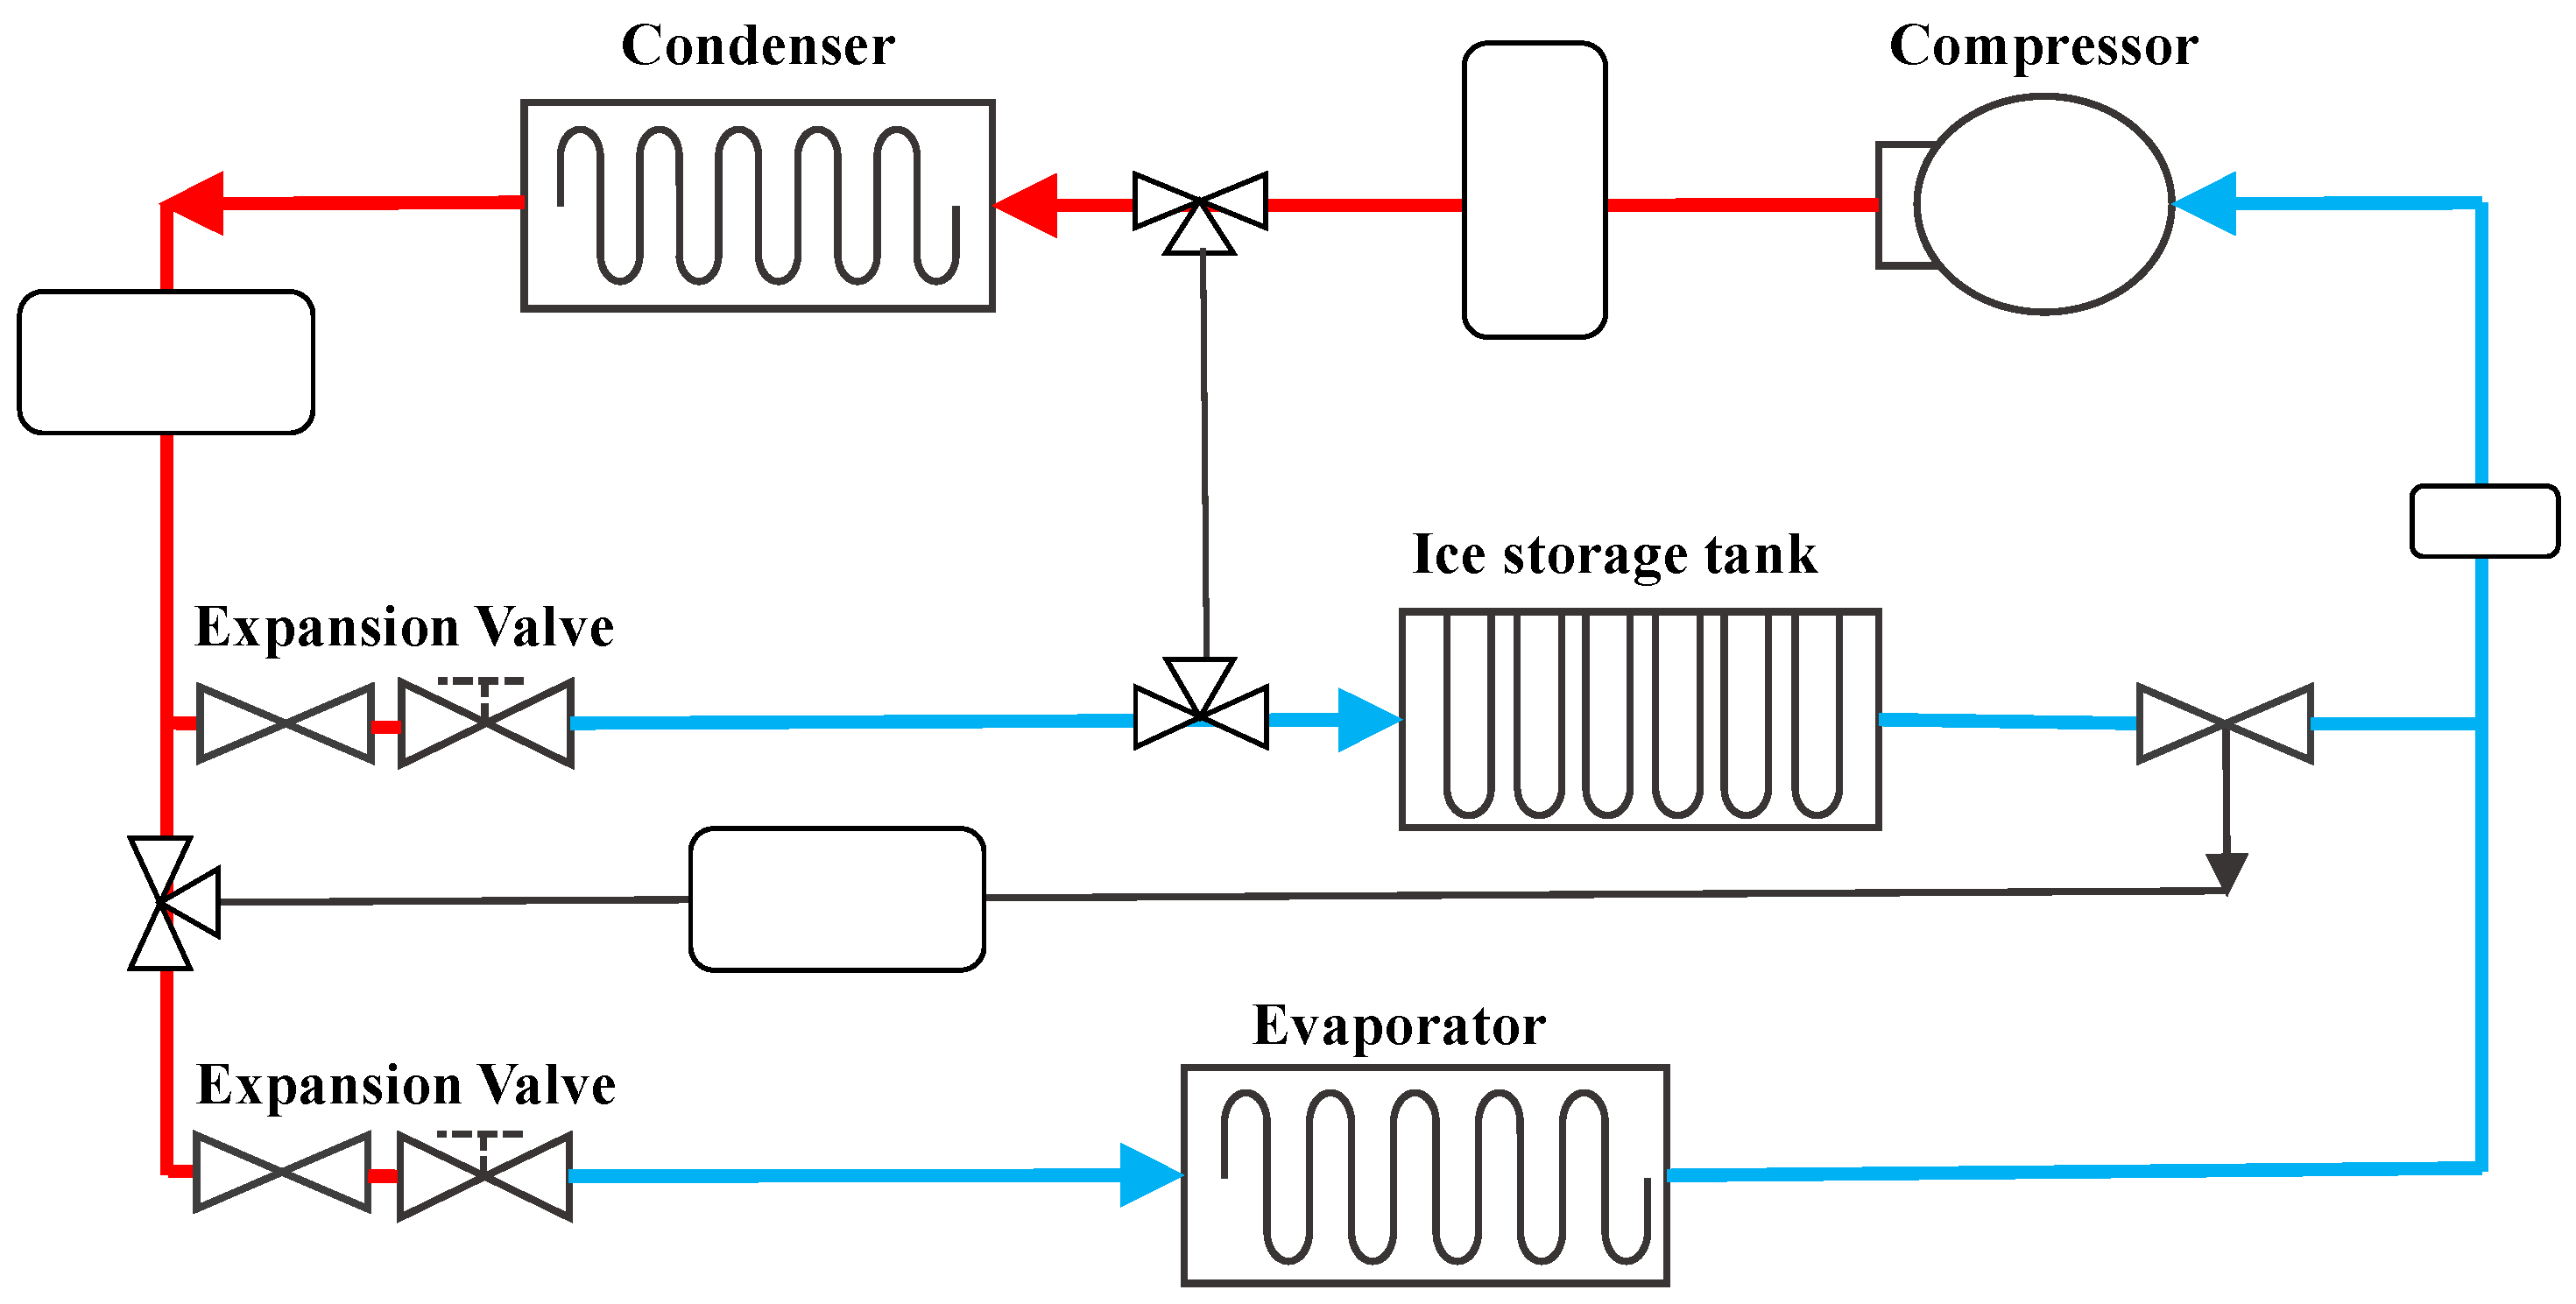
2.2. Operation Modes

The experimental system had three operation modes, namely, the ice-storage refrigeration, melting, and refrigeration modes. In the experimental system, the operating periods of the ice-storage refrigeration and melting modes are scheduled before the operation. For comparison with the general refrigeration systems, only refrigeration mode is set in advance. Different parametric settings were designed to test the performance of the experimental system, including the operating periods of the three modes, lower limit of the tank temperature during ice storage, upper limit of the tank temperature during ice melting, temperature range in the showcase, the number of load blocks in the showcase, and the application of night curtain to the showcase to simulate the actual situation in convenience stores at night. In addition, the difference between the required time of the ice formation and melting periods, power consumption, and changes in the icing condition in the ice storage tank are also investigated in details.
The operation process (i.e., the operation of the four major refrigeration components) of the refrigeration mode is depicted in Figure 3. The high temperature/pressure refrigerant discharged from the compressor is cooled by the condenser; its pressure is reduced further by an expansion valve to a lower temperature to the circulated cool air in the showcase. The rest of the refrigerant tube circuits are closed.
The operation process of the ice storage mode is illustrated in Figure 4. The high temperature/pressure refrigerant is cooled by the condenser, and the condensed refrigerant is directed into two pipelines by the control valve. Part of the refrigerant passes through one of the expansion valves into the showcase to maintain the temperature within. The remaining refrigerant passes through another expansion valve and then enters into the ice storage tank to facilitate cold energy storage. When the ice storage tank reaches the setting temperature, the control valve closes the refrigerant circuit into the tank. In the meantime, once the showcase reaches the setting temperature, the refrigerant circuit to the showcase is closed while only the circuitry to the ice storage tank is left open.
The operation process of the melting mode is illustrated in Figure 5. The high temperature/pressure refrigerant from the compressor enters into the ice storage tank. It is then condensed by the cold energy stored in the tank and subsequently decompressed by an expansion valve and then released the cold energy into the showcase. Once the ice storage tank reaches the setting temperature, the system automatically switches to the general refrigeration mode.

2.3. Data Analysis

The analysis was divided into two parts: heat transfer and operating cost. Firstly, to estimate heat transfer efficiency, the coefficient of performance (COP) was calculated based on the enthalpy at the inlet/outlet of the four major refrigeration components. The relation is displayed in Equation (1):
COP = ( h 1 h 4 ) / ( h 2 h 1 )
where
  • COP: Coefficient of Performance
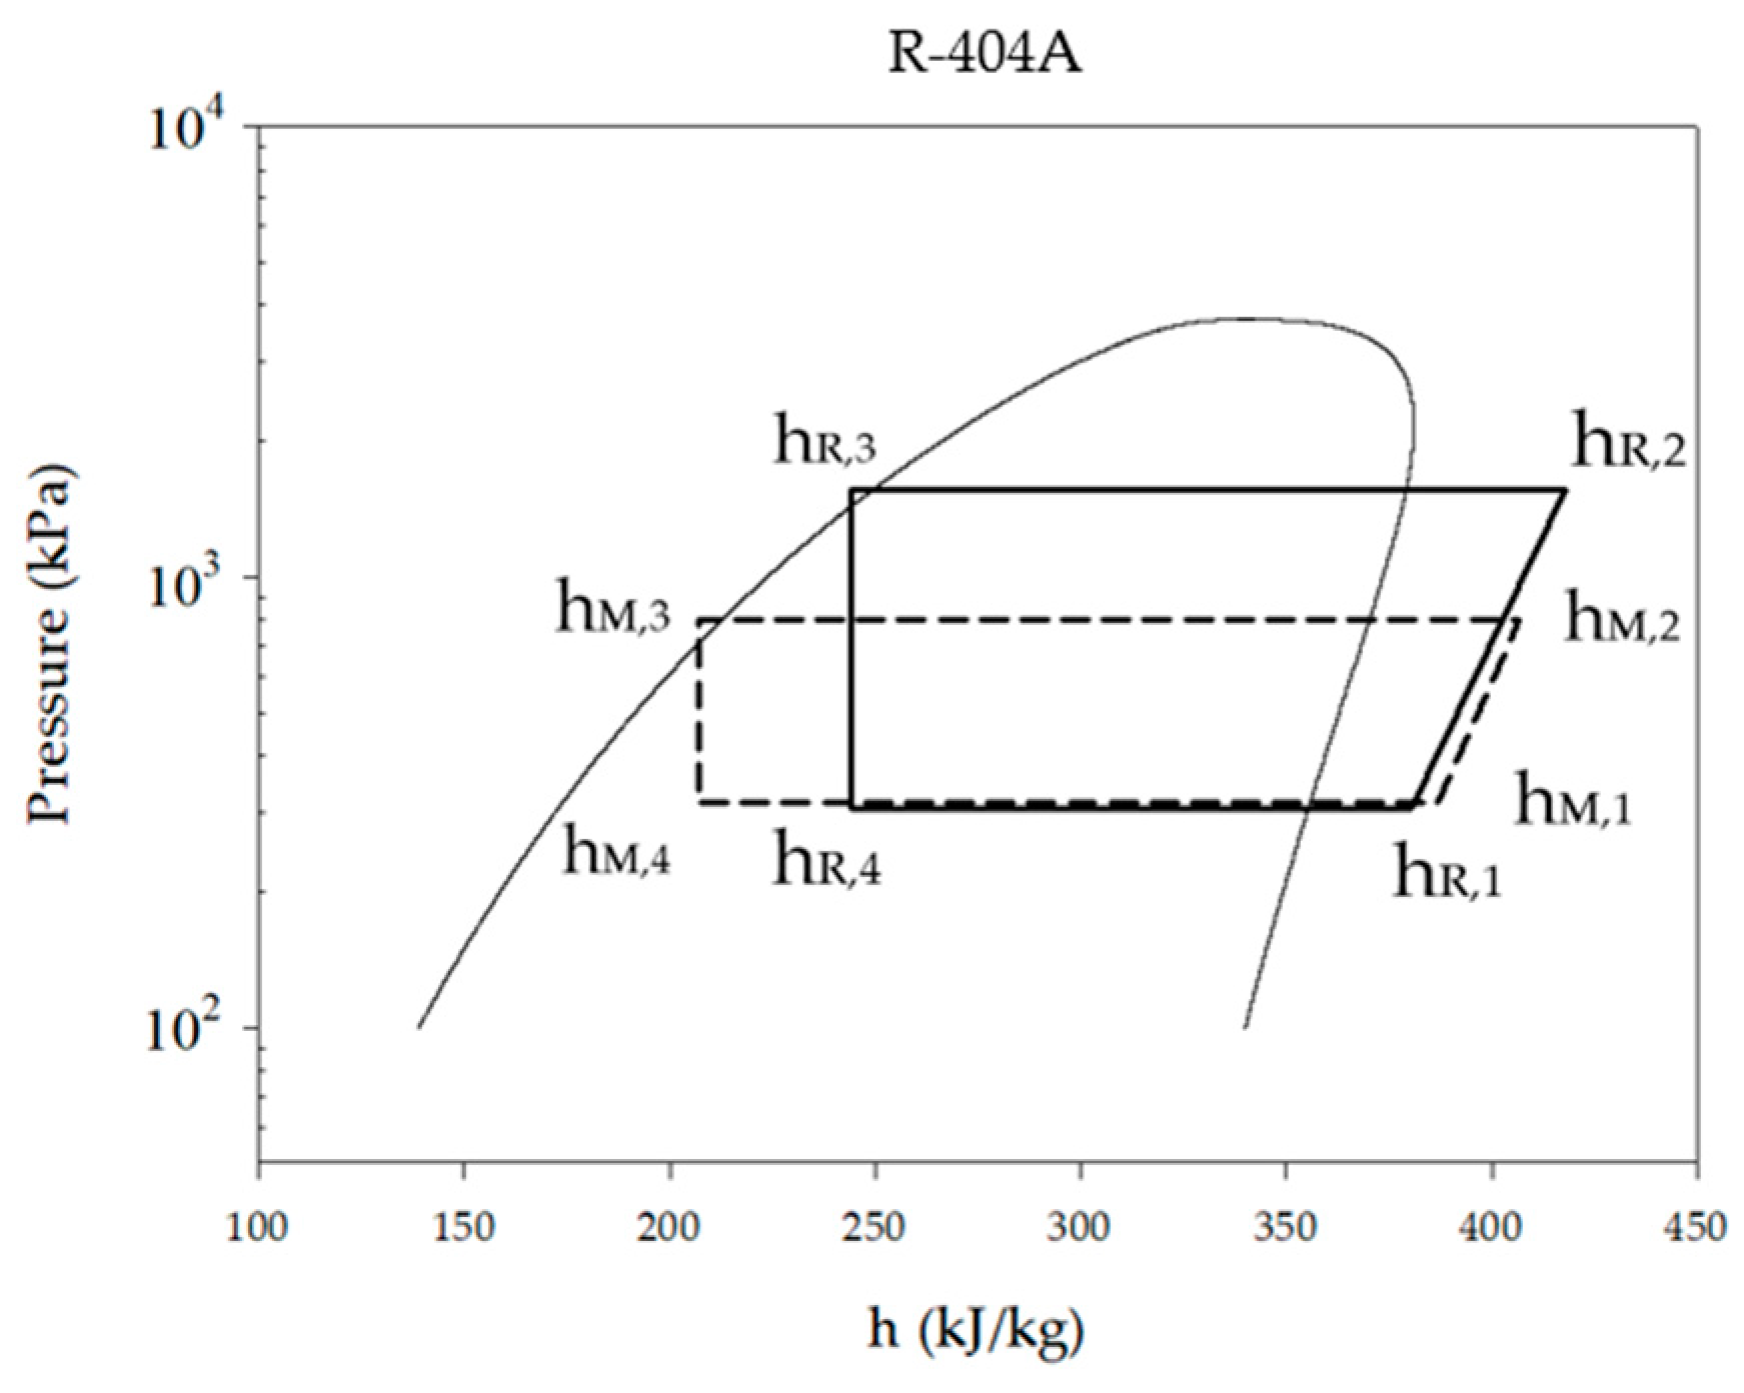
  • h4: Condenser outlet enthalpy (kJ⁄kg)
  • h2: Compressor outlet enthalpy (kJ⁄kg)
  • h1: Compressor inlet enthalpy (kJ⁄kg)
The operating cost primarily evaluates the energy consumption of the system and the electricity bill. The relations are presented in Equations (2) and (3):
k W × 24   h / day = kWh / day
NTD = kWh × Rate
where
  • kW: Compressor power consumption (kW)
  • kWh: kilowatt-hour
  • NTD: Operating cost
  • Rate: Taiwan Electric Power Rate

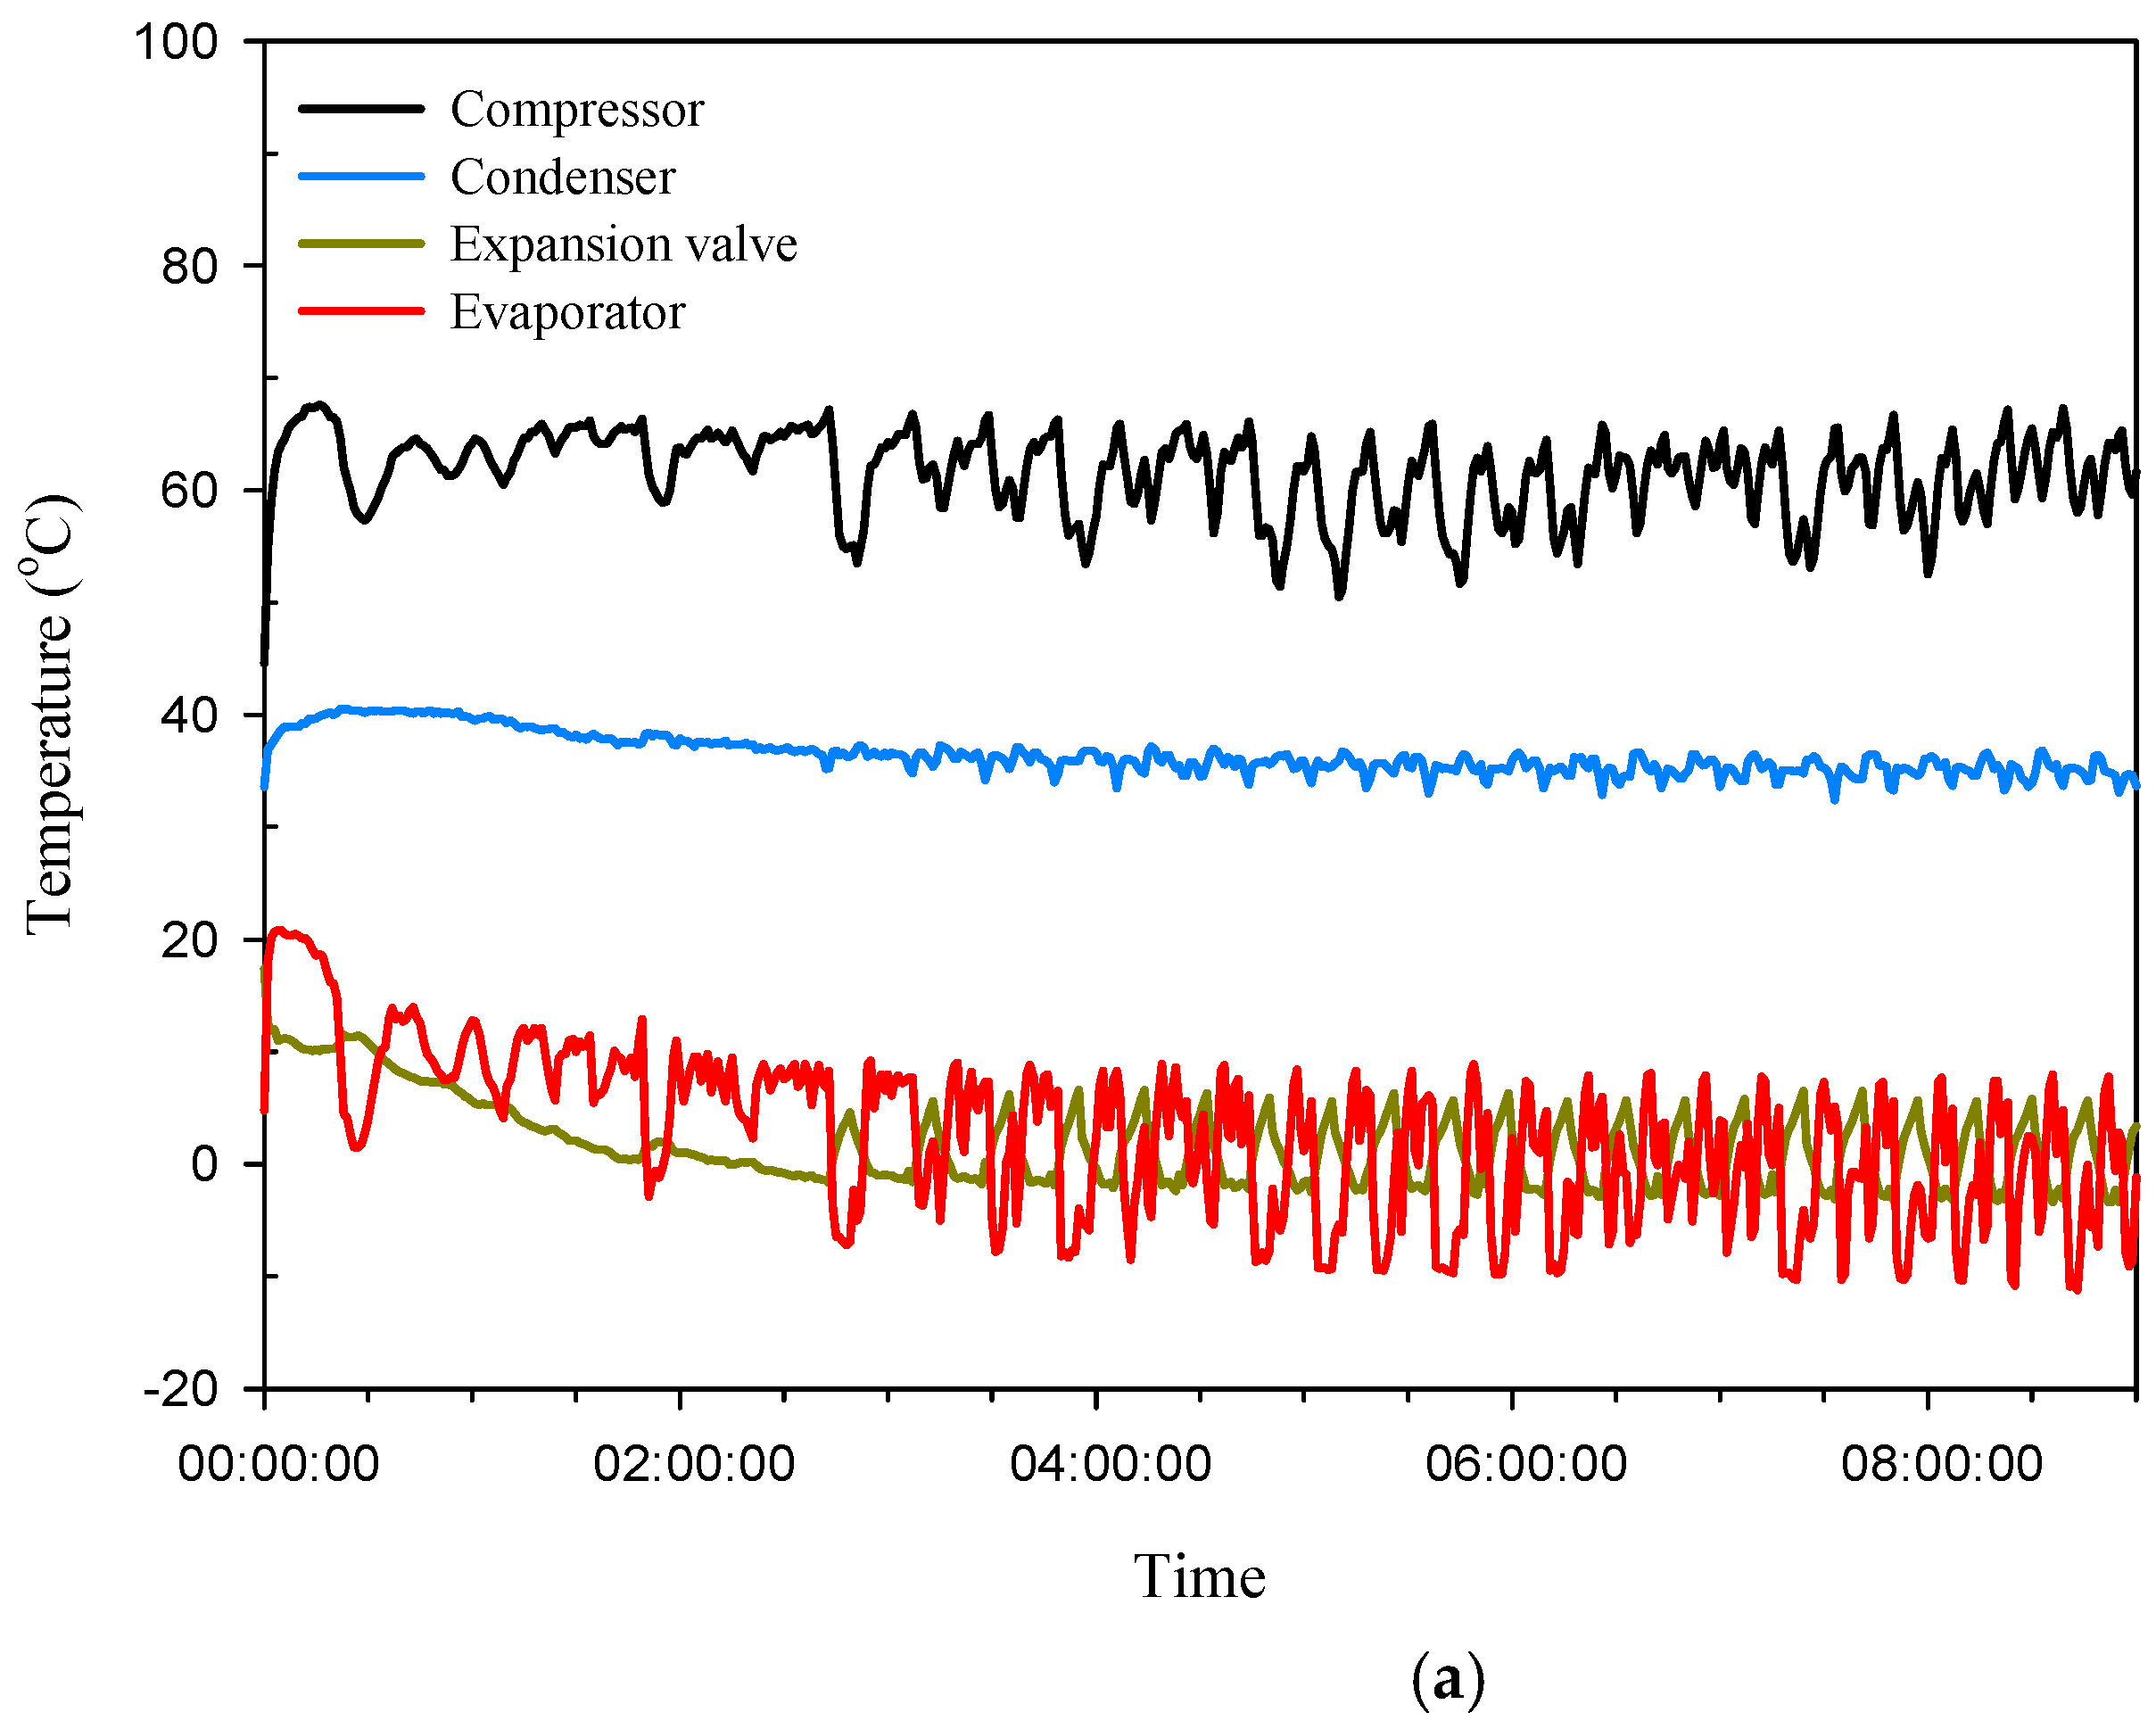
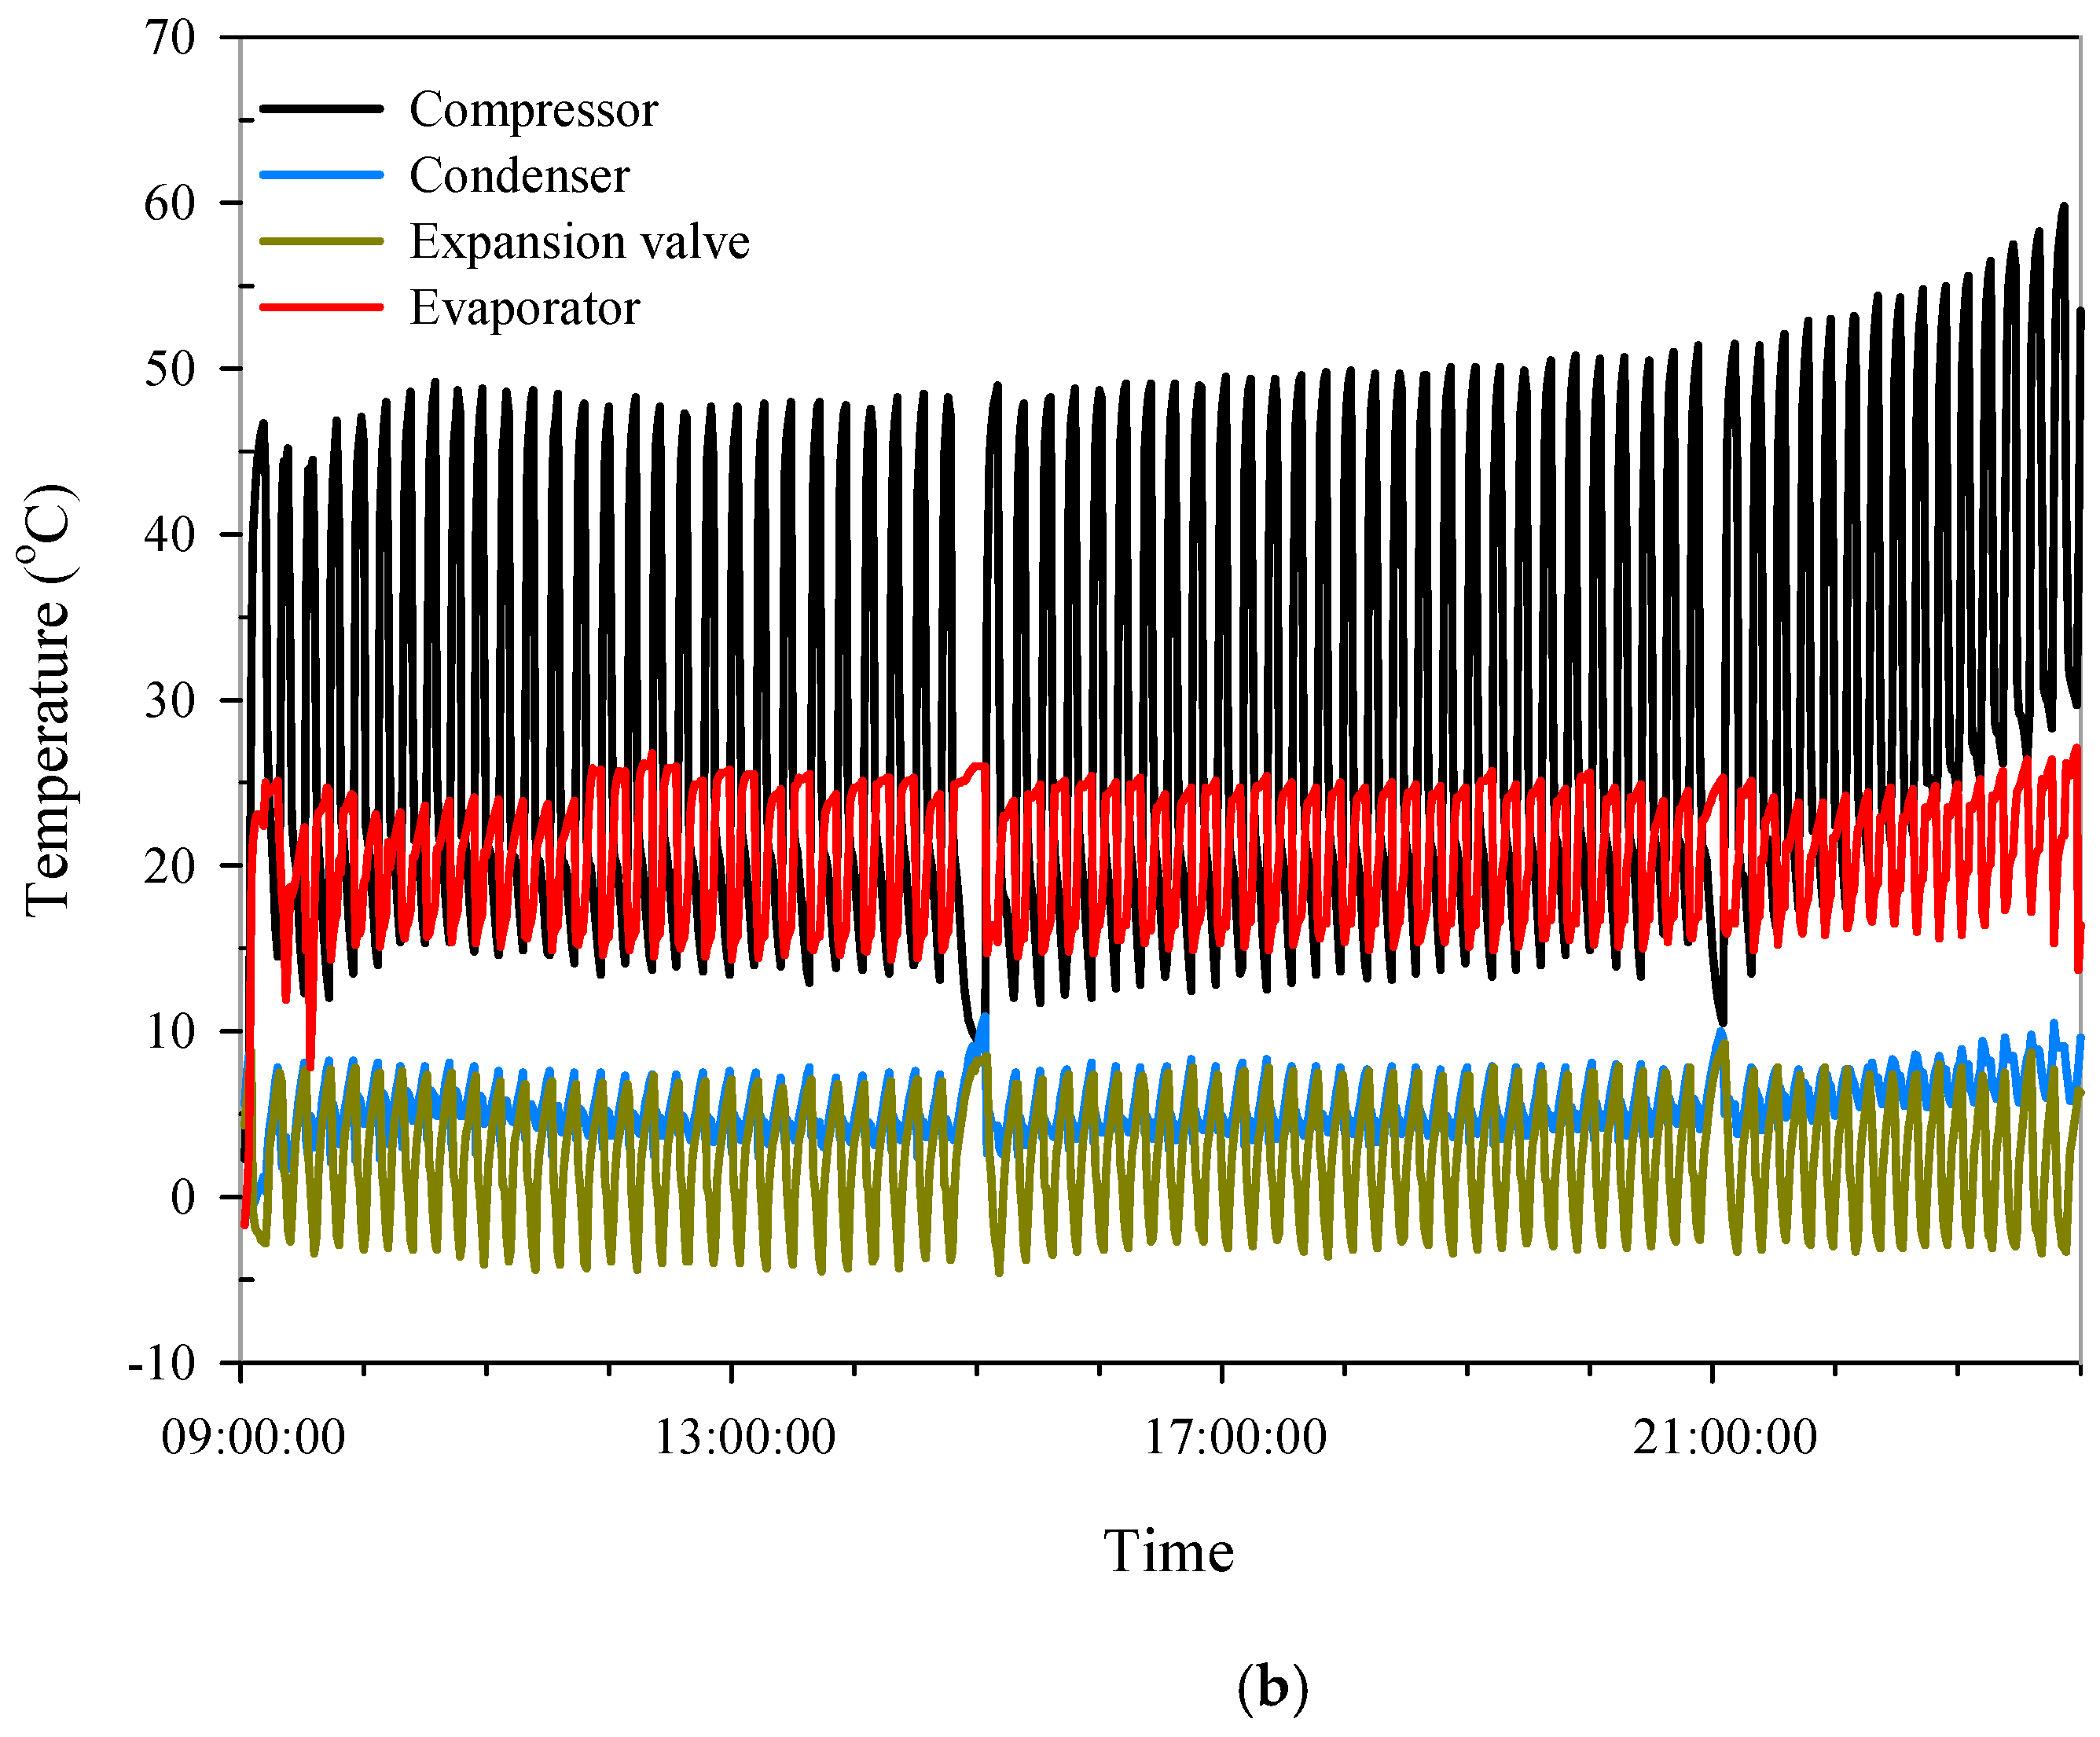
3. Results and Discussion

Analysis of Collecting Data and Comparison of Correlations

In this study, the authors assessed the performance differences between an ice storage system and a refrigeration system for a commercial showcase. The differences between the heat transfer and performance of the two systems were compared. The parameter settings of the ice storage system were as follows: the ambient temperature was 20 ± 2 °C; the showcase temperature was set at 4–7 °C; eighty load blocks were installed inside the showcase; night screens were used during the ice storage mode for 9 h to simulate the actual operating condition; the ice storage mode was set to 9 h, starting from 10:30 p.m.; and the melting mode was switched on subsequently until the temperature of the ice storage tank reached 10 °C, for a duration of approximately 15 h; the refrigeration mode was not turned on. For the general refrigeration system, the refrigeration mode was turned on for 24 h, and the remaining parameter settings were the same as those of the ice storage system.
Figure 6a presents an inlet/outlet temperature change of the compressor, condenser, expansion valves, and evaporator in the ice storage mode. During this mode, the temperature variation was smaller because the equipment was continuous running, and the effect subject to change of ambient conditions is only moderate. The temperature of the compressor falls within 50–70 °C and the condenser temperature was around 40 °C. In the meantime, the temperature at the exit of expansion valves spans from −5 to 5 °C; and the variation of the evaporator temperature was −10 to 10 °C. Figure 6b shows the inlet/outlet temperature change of the compressor, condenser, expansion valves, and evaporator subject to the melting mode. It appears that the temperature variations of these four components are much more pronounced. In fact, the temperature of the compressor was approximately 10–50 °C; that of the condenser was 5 °C; that of the expansion valves was −5 to 10 °C; and that of the evaporator was 10–25 °C. During the melting mode, the condensing temperature dropped from 40 °C to 5 °C. This is because the condenser was changed from air-cooling to water immersion cooling of an ice storage tank. Therefore, the temperature of the compressor in the melting mode was approximately 20 °C lower than that of the ice storage mode.
Figure 7 presents the icing condition in the ice storage tank after 9 h of ice storage mode. In the first 2 h, the temperature of water drops consecutively due to sensible cooling in which phase change from water to ice did not occur. At approximately the second hour, ice began to form around the copper tubes. At approximately the fifth hour, the ice around the copper tubes was beginning to make merge together. At approximately the eighth hour, the ice on the copper tubes is completely frozen.
Figure 8 presents the thickness of ice formation growth on the copper tubes. As depicted in the figure, the growth rate of ice is reduced when the thickness is increased. This is because the change of heat transfer mode for solid ice is only by conduction, while convection with latent heat transfer occurs near the interface of solid ice and water, meaning much higher heat transfer exists at the interface. As a result, the ice growth rate is reduced when the ice thickness is increased. The surface temperature of the ice layer rose as the thickness of the ice layer is increased, thus reducing the temperature difference between the ice and water. Therefore, the ice thickness affected the effective heat transfer from the tube. Moreover, when the ice layer became thicker, the contact area between the ice and water is increased. The heat transfer rate per unit area thus declined when the refrigeration capacity remained the same. Eventually, the thickness of the ice layer stopped increasing when the ice around the tubes merged.
Figure 9 presents a comparison of the power consumption between the ice storage system and that of a conventional refrigeration system. The power consumption of the ice storage system was approximately 4 kW at night time during off-peak hours, whereas that of the general refrigeration system mode was approximately 1 kW. Accordingly, the power consumption of the ice storage system was far greater than that of the conventional refrigeration system during off-peak hours. By contrast, the power consumption of the ice storage system was approximately 1 kW during peak hours in daytime, and that of the general refrigeration system was approximately 1.8 kW. That is, the ice storage system had a lower power consumption than that of the conventional refrigeration system during peak hours. The results confirm that the ice storage system could transfer power consumption from peak hours to off-peak hours. However, the total power consumption of the entire system still increased.
Vetterli and Benz [21] reported that by adding an ice storage system, the total costs are reduced by 11% under the two-level electricity tariff scheme, Chan et al. [22] used the electricity price structure of three different power companies to calculate the annual electricity bill to evaluate the system performance under different parts of storage capacity, control strategy and tariff structure. From the above literatures, the ice storage system shows the potential to save electricity bills under different tariffs at different periods of time.
According to the power consumption of the two systems, different demand power consumption is designed, as shown in Figure 10. Note that plan 1 represents the contract capacity containing a regular contract of 2.5 kW without time of uses rate. Plan 2 denotes the contract capacity having a regular contract of 2.0 kW while the time of uses rate is 4.5 kW. The plan 1 represents the fixed electricity bill. The power consumption of the refrigeration system changes very small, so plan 1 is suitable for this situation. The power consumption of the ice storage system is much lower during the daytime, but the off-peak power consumption is large, so that option 2 is suitable for this situation. The demand charge for plan 1 is 2.5 kW, and the demand charge for plan 2 is 2 kW, and the off-peak demand charge is 2.5 kW.
Figure 11 are the differences between the two systems in energy charge when using TOU. Table 1 presents a benefit analysis of the two systems. Upon energy charge, the power consumption of the ice storage system at night during off-peak hours was approximately 739.8 kWh per month which is higher than that of the general refrigeration system. However, the ice storage system during daytime peak hours was approximately 497.1 kWh per month which is lower than that of the conventional refrigeration system. It is equivalent to 267.3 kWh per month of power consumption relative to night time. The TOU rate in Taiwan is 0.0289   $ USD / kWh during off-peak hours and 0.153   $ USD / kWh during peak hours. Taiwan government offers a promotion of 40% discount for ice storage systems during off-peak hours. In demand charge, the demand charge for ice storage system is 2 kW and off-peak demand charge 2.5 kW, and demand charge of the general refrigeration system is 2.5 kW. As a result, the ice storage system saves 1.56 $USD than that of the refrigeration system Through some mathematical manipulation of the foregoing rates and combing the energy charge and demand charge, the energy cost of the ice storage systems is USD$ 17.13 lower per month when compared to the conventional refrigeration systems, and the power consumption during peak hours is reduced by 35%.
To evaluate the benefits of the energy saving, the authors inspected the pressure–enthalpy diagram of the operation modes in the ice storage system through COP comparison. The corresponding pressure–enthalpy diagram is schematically presented in Figure 12. Various parameters were also considered. The results revealed that the condensing pressure and temperature in the melting mode were significantly lower than those in the refrigeration mode. The condensing pressure is greatly reduced from 1556 kPa to 801.8 kPa, which reduced the enthalpy difference at the inlet/outlet of the compressor between the refrigeration mode (37.9 kJ/kg) and the melting mode (28.5 kJ/kg). The refrigeration capacity is increased (refrigeration mode: 136.4 kJ/kg; melting mode: 181.1 kJ/kg). The COPs of the melting mode and refrigeration mode were approximately 6.35 and 3.6, respectively. Accordingly, it is confirmed that the ice storage system can lower the condensing temperature and pressure through melting ice during peak hours, which will effectively increase the efficiency when compared to conventional refrigeration systems.

4. Conclusions

In this study, the ice storage system for a small commercial, open refrigerated showcases was demonstrated in a convenience store. The heat transfer performance and the corresponding economic benefits of ice storage systems are examined experimentally. R-404A is used as the working fluid and various influence of parameter settings and improvements, are discussed in details. In the ice storage system, the condenser is changed from air-cooling (refrigeration mode) to an immersion type that is placed in an ice storage tank to reduce the condensing temperature and pressure. This increased the efficiency and can effectively reduce the peak power consumption. Some major conclusions can be drawn as follows:
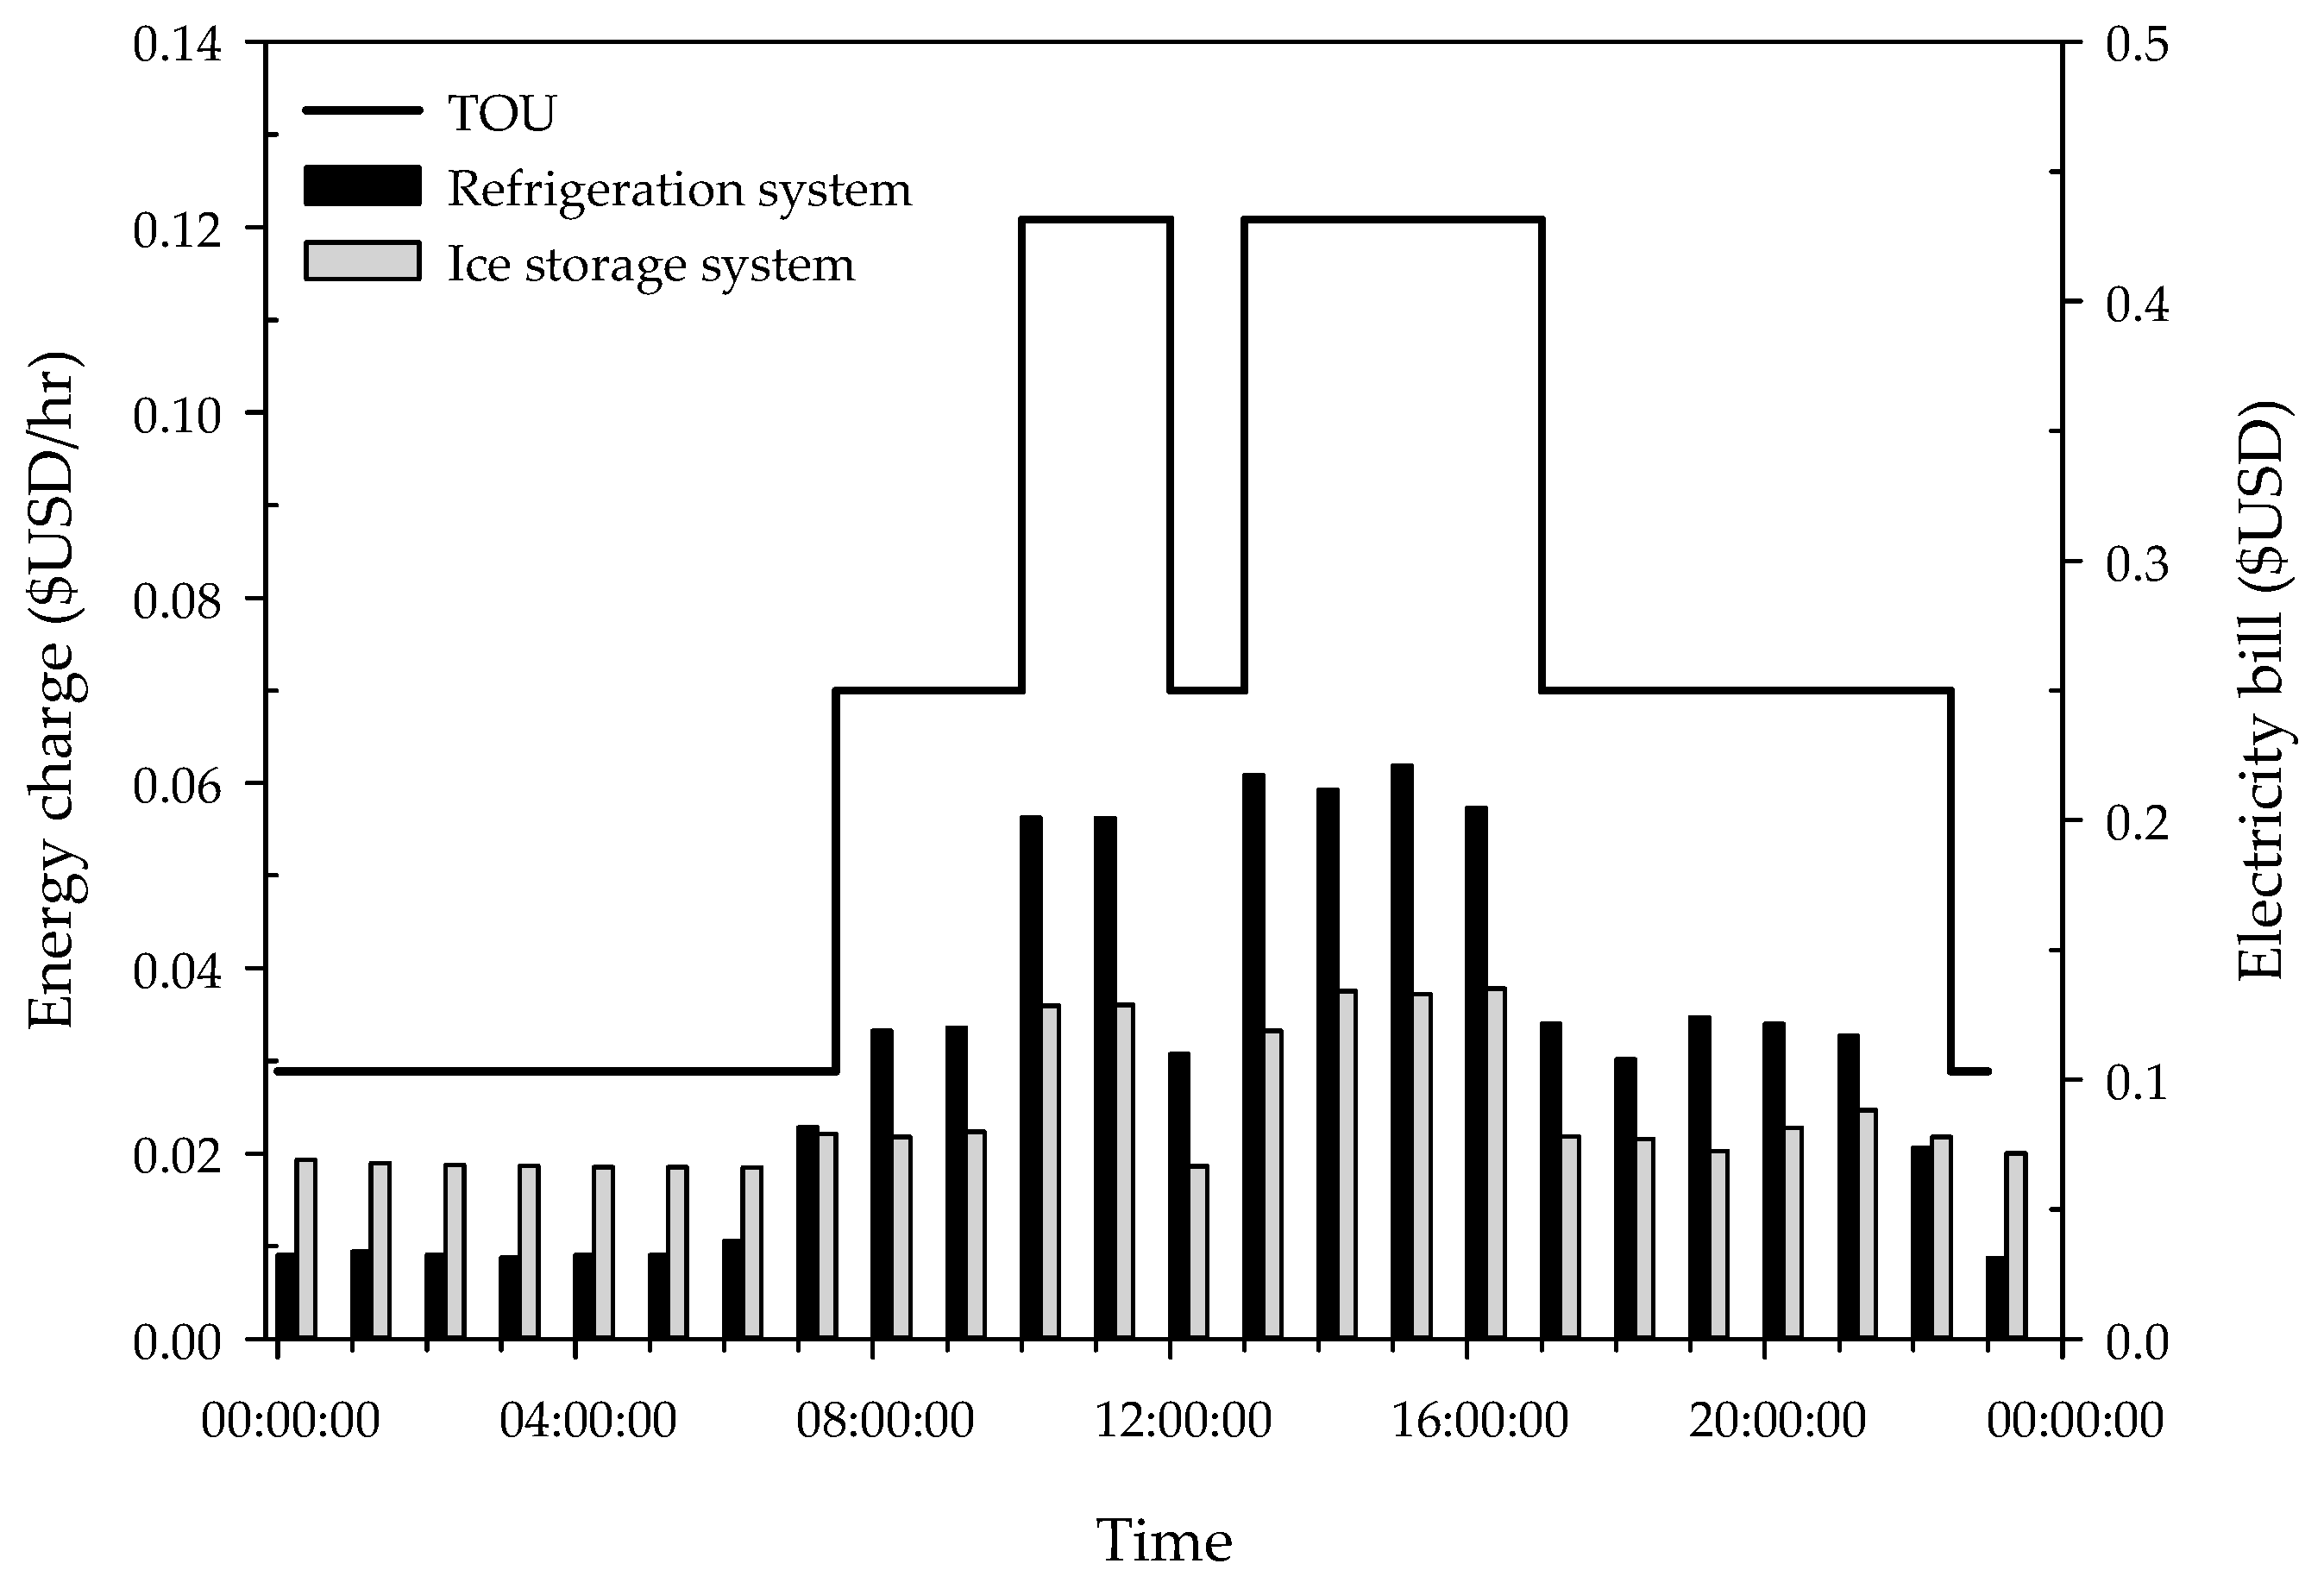
  • Under an ambient temperature of 20 ± 2 °C, the ice storage system applicable to a 24-h commercial refrigerated showcase with a 9-h ice storage period and a 15-h ice melting period consumed 51.8 kWh of energy, whereas the general refrigeration system consumed 36 kWh of energy. The ice storage system consumed 44% more energy than the conventional refrigeration system. However, with the use of the TOU rate plan in Taiwan, the energy cost of the ice storage system is saved by USD$ 17.13 per month when compared to the convention refrigeration system.
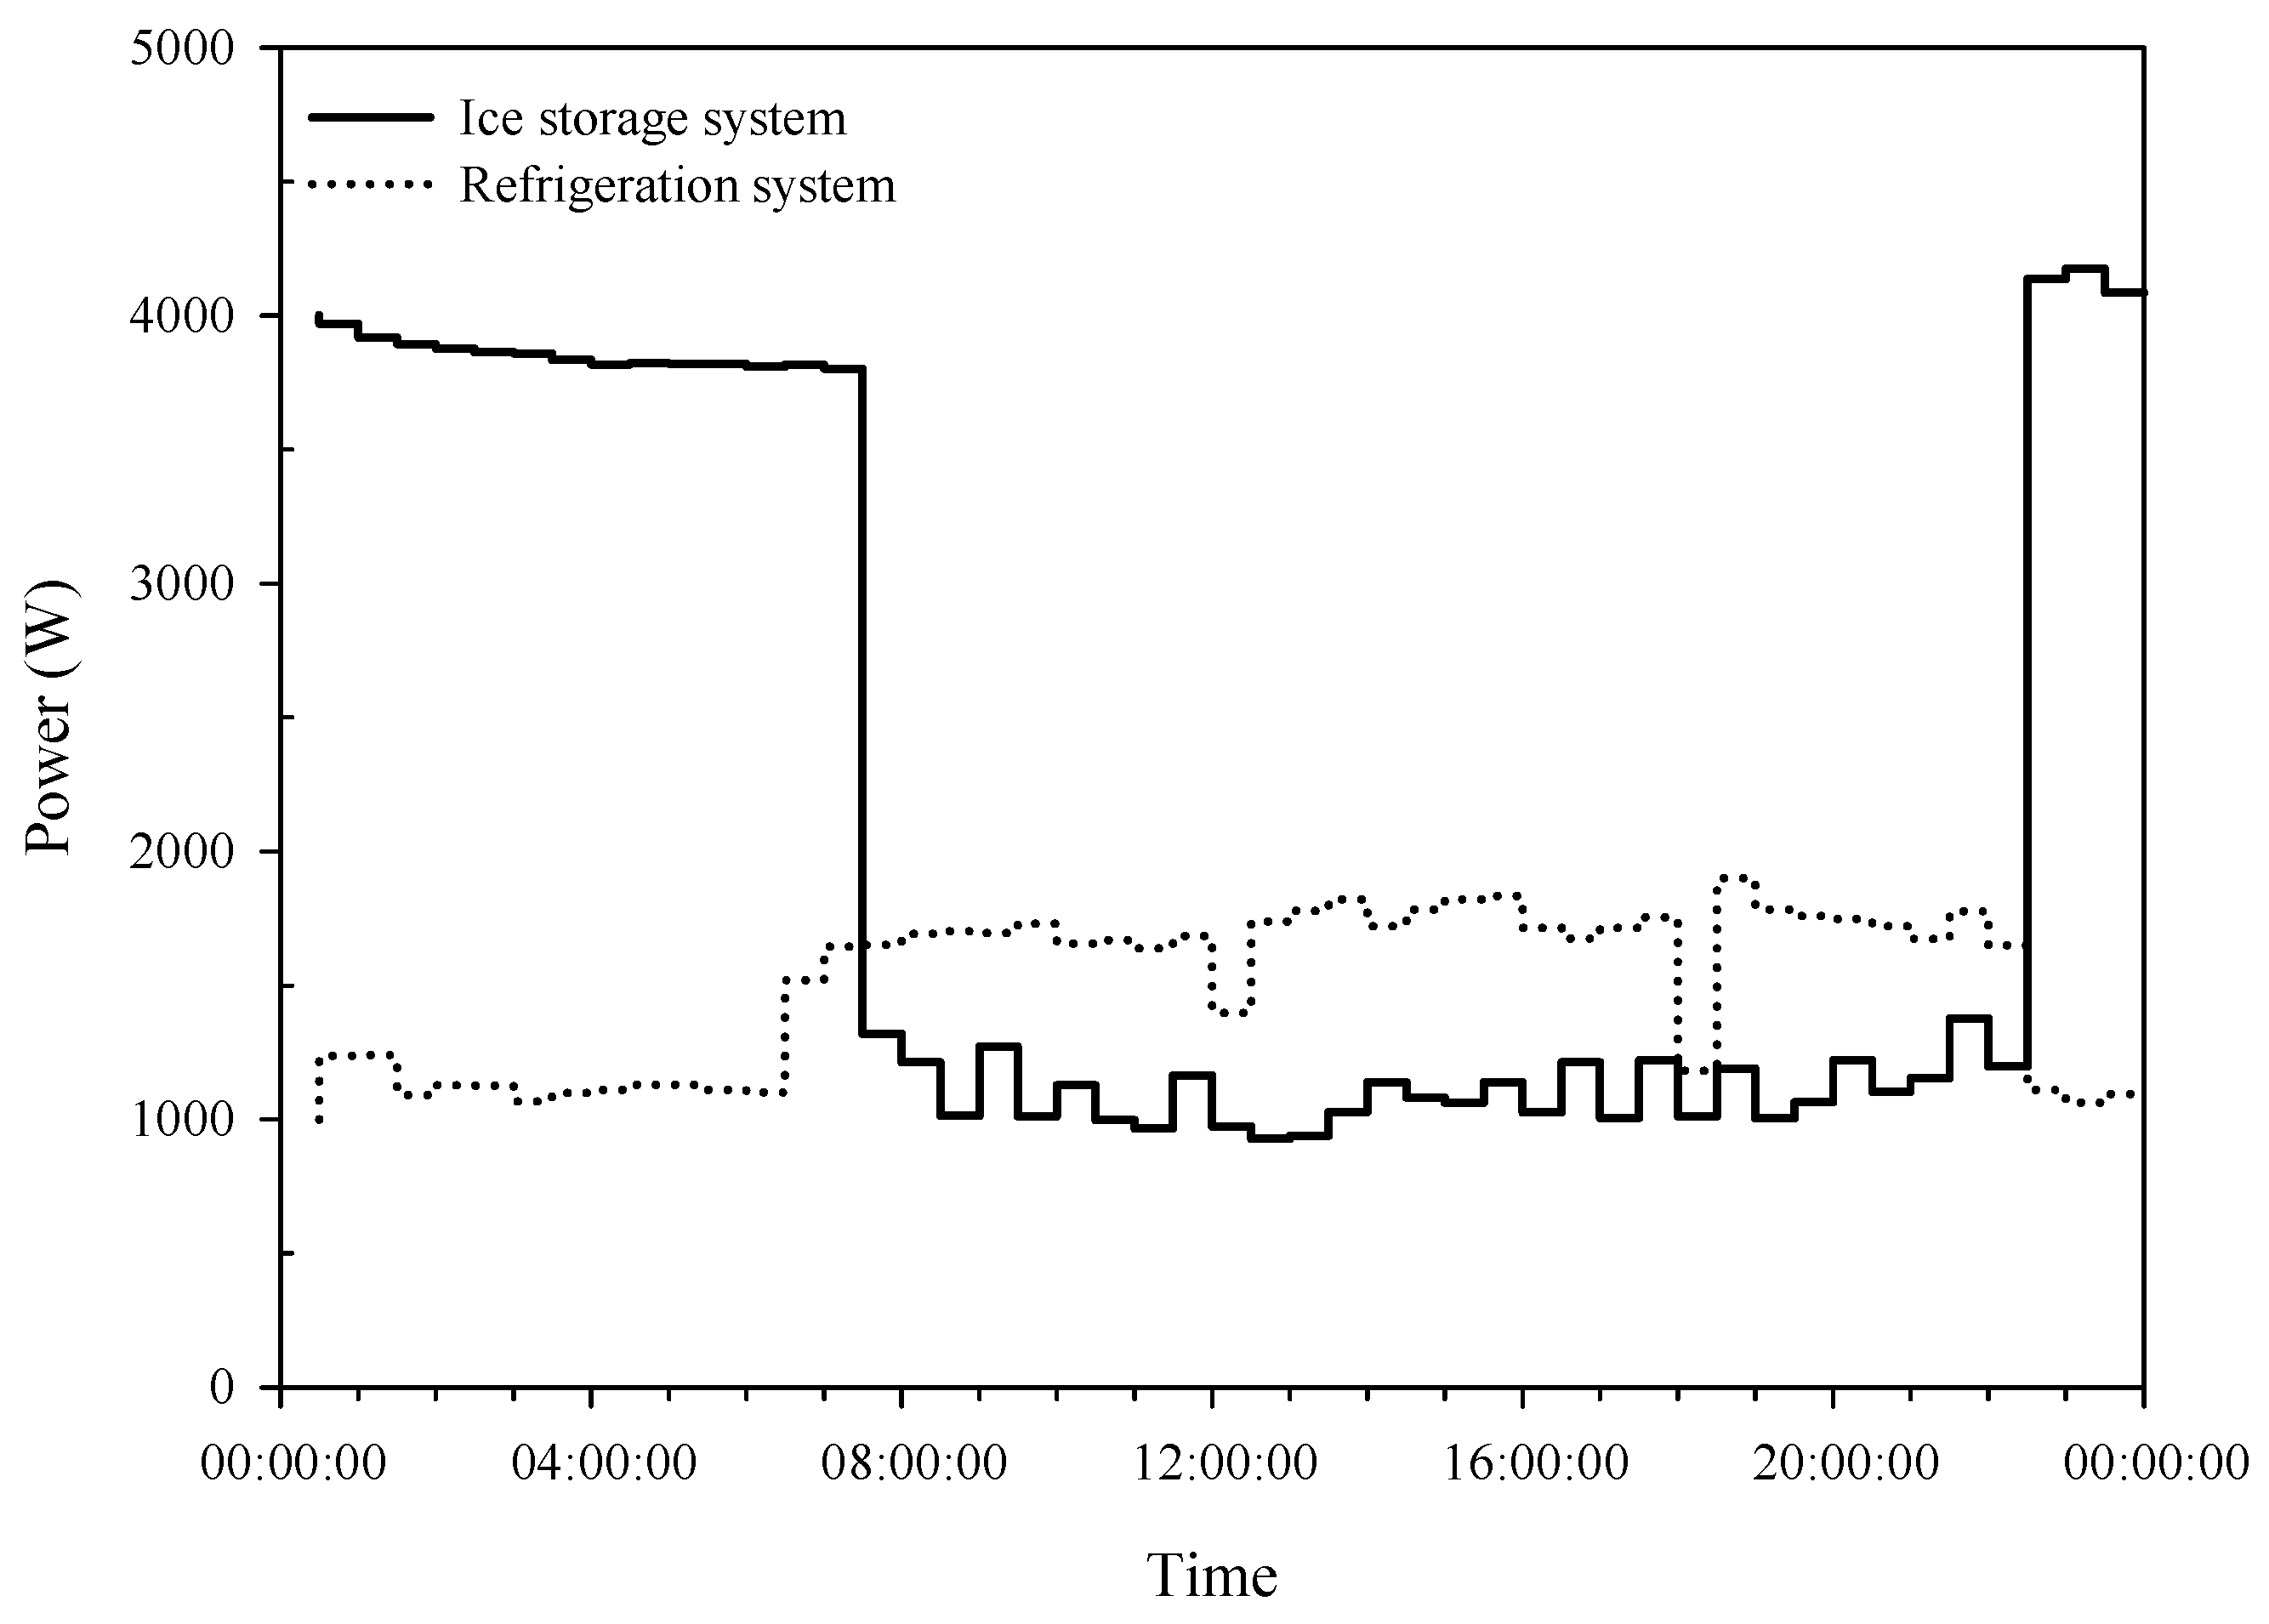
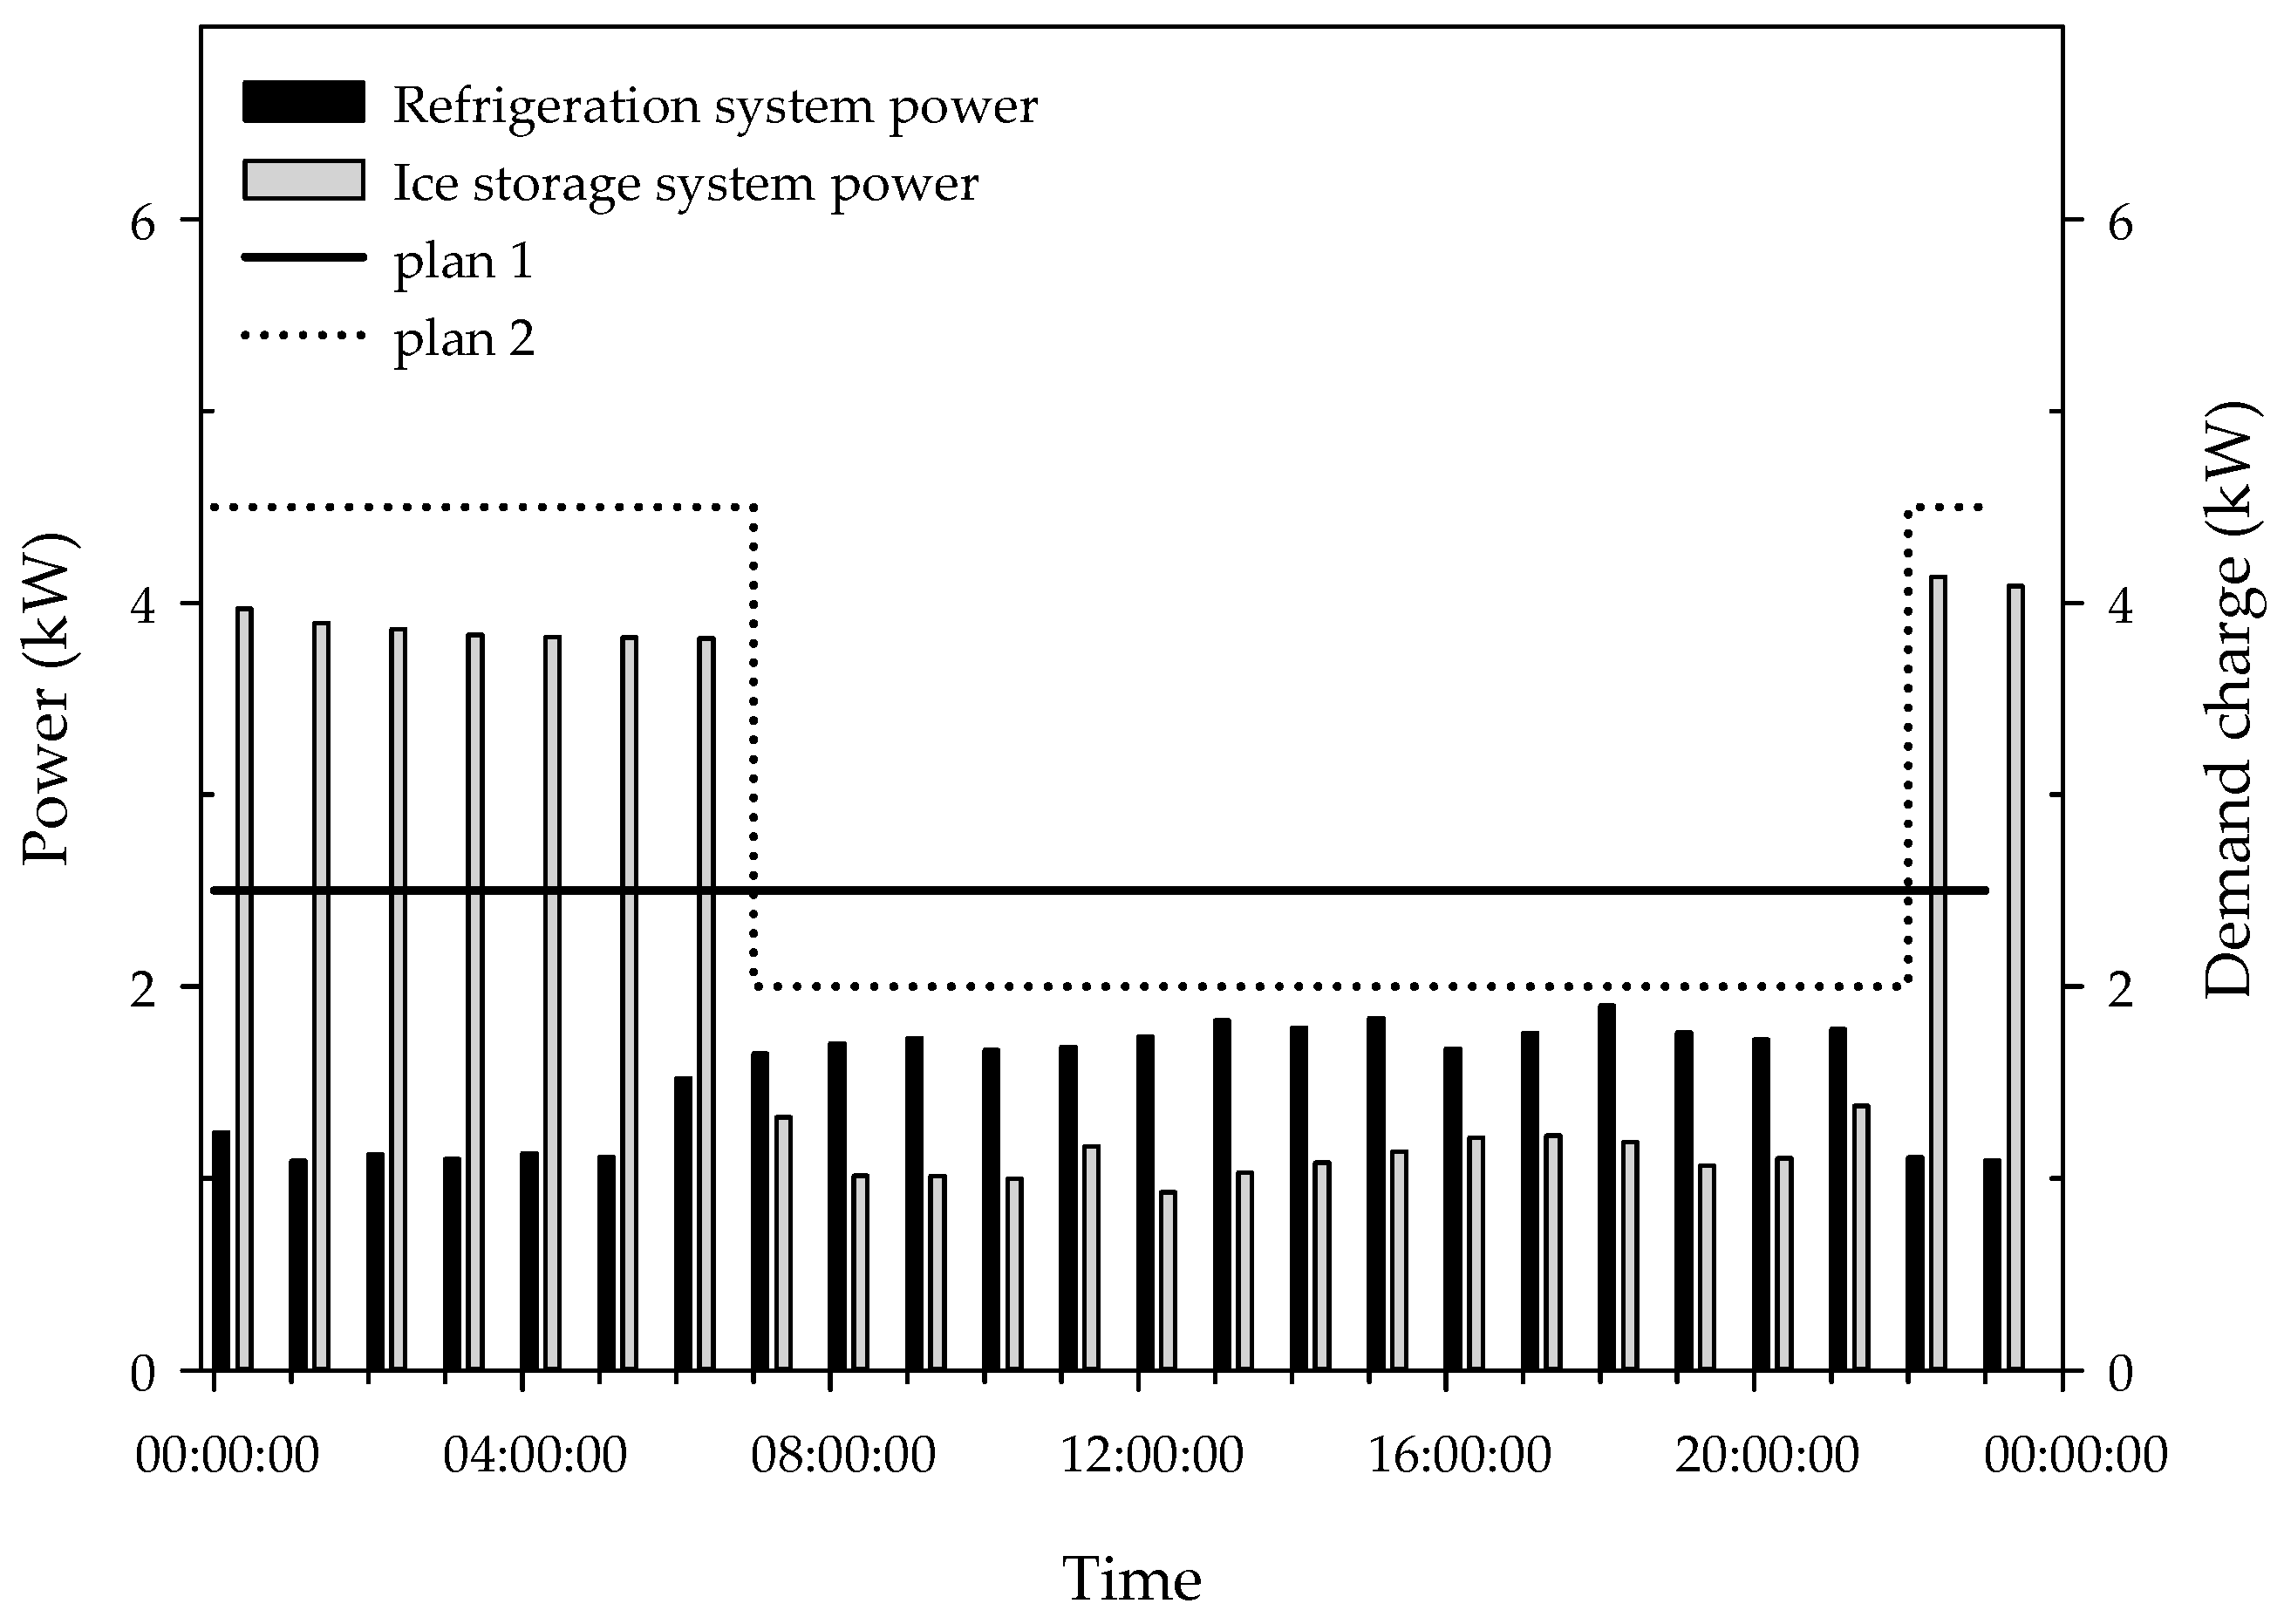
  • The ice storage system could successfully transfer 35% of its power consumption during peak hours to off-peak hours, which successfully retained the peak loads. The reduction of the condensing temperature and pressure increased the COP from 3.6 (refrigeration mode) to 6.35 (melting mode), effectively enhancing the refrigeration efficiency.
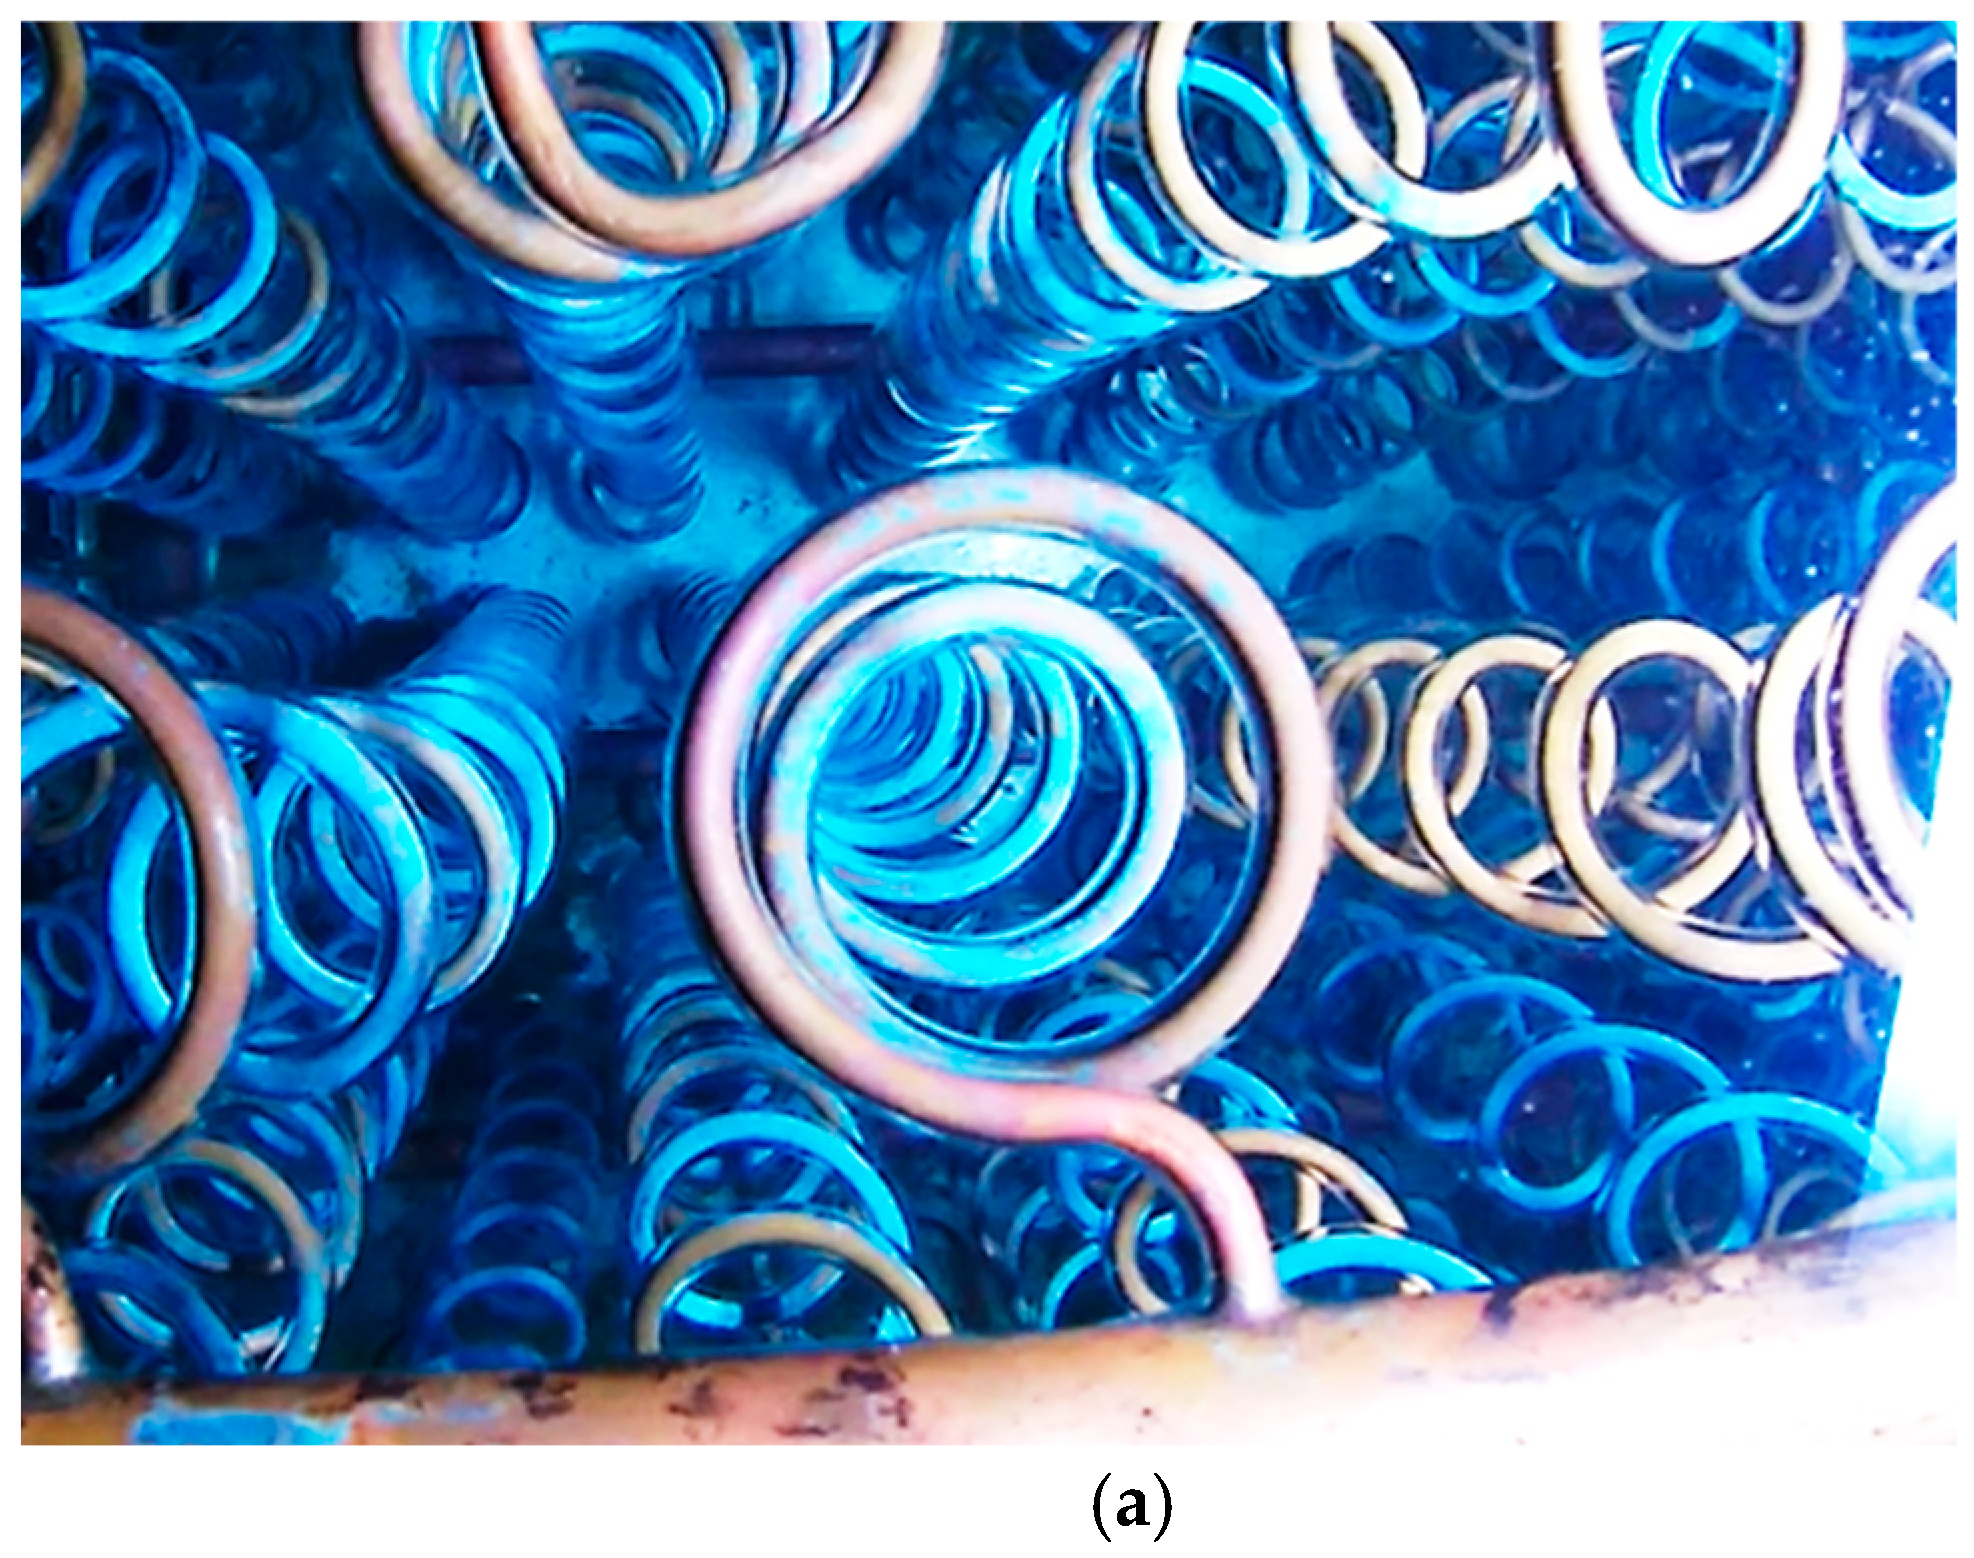
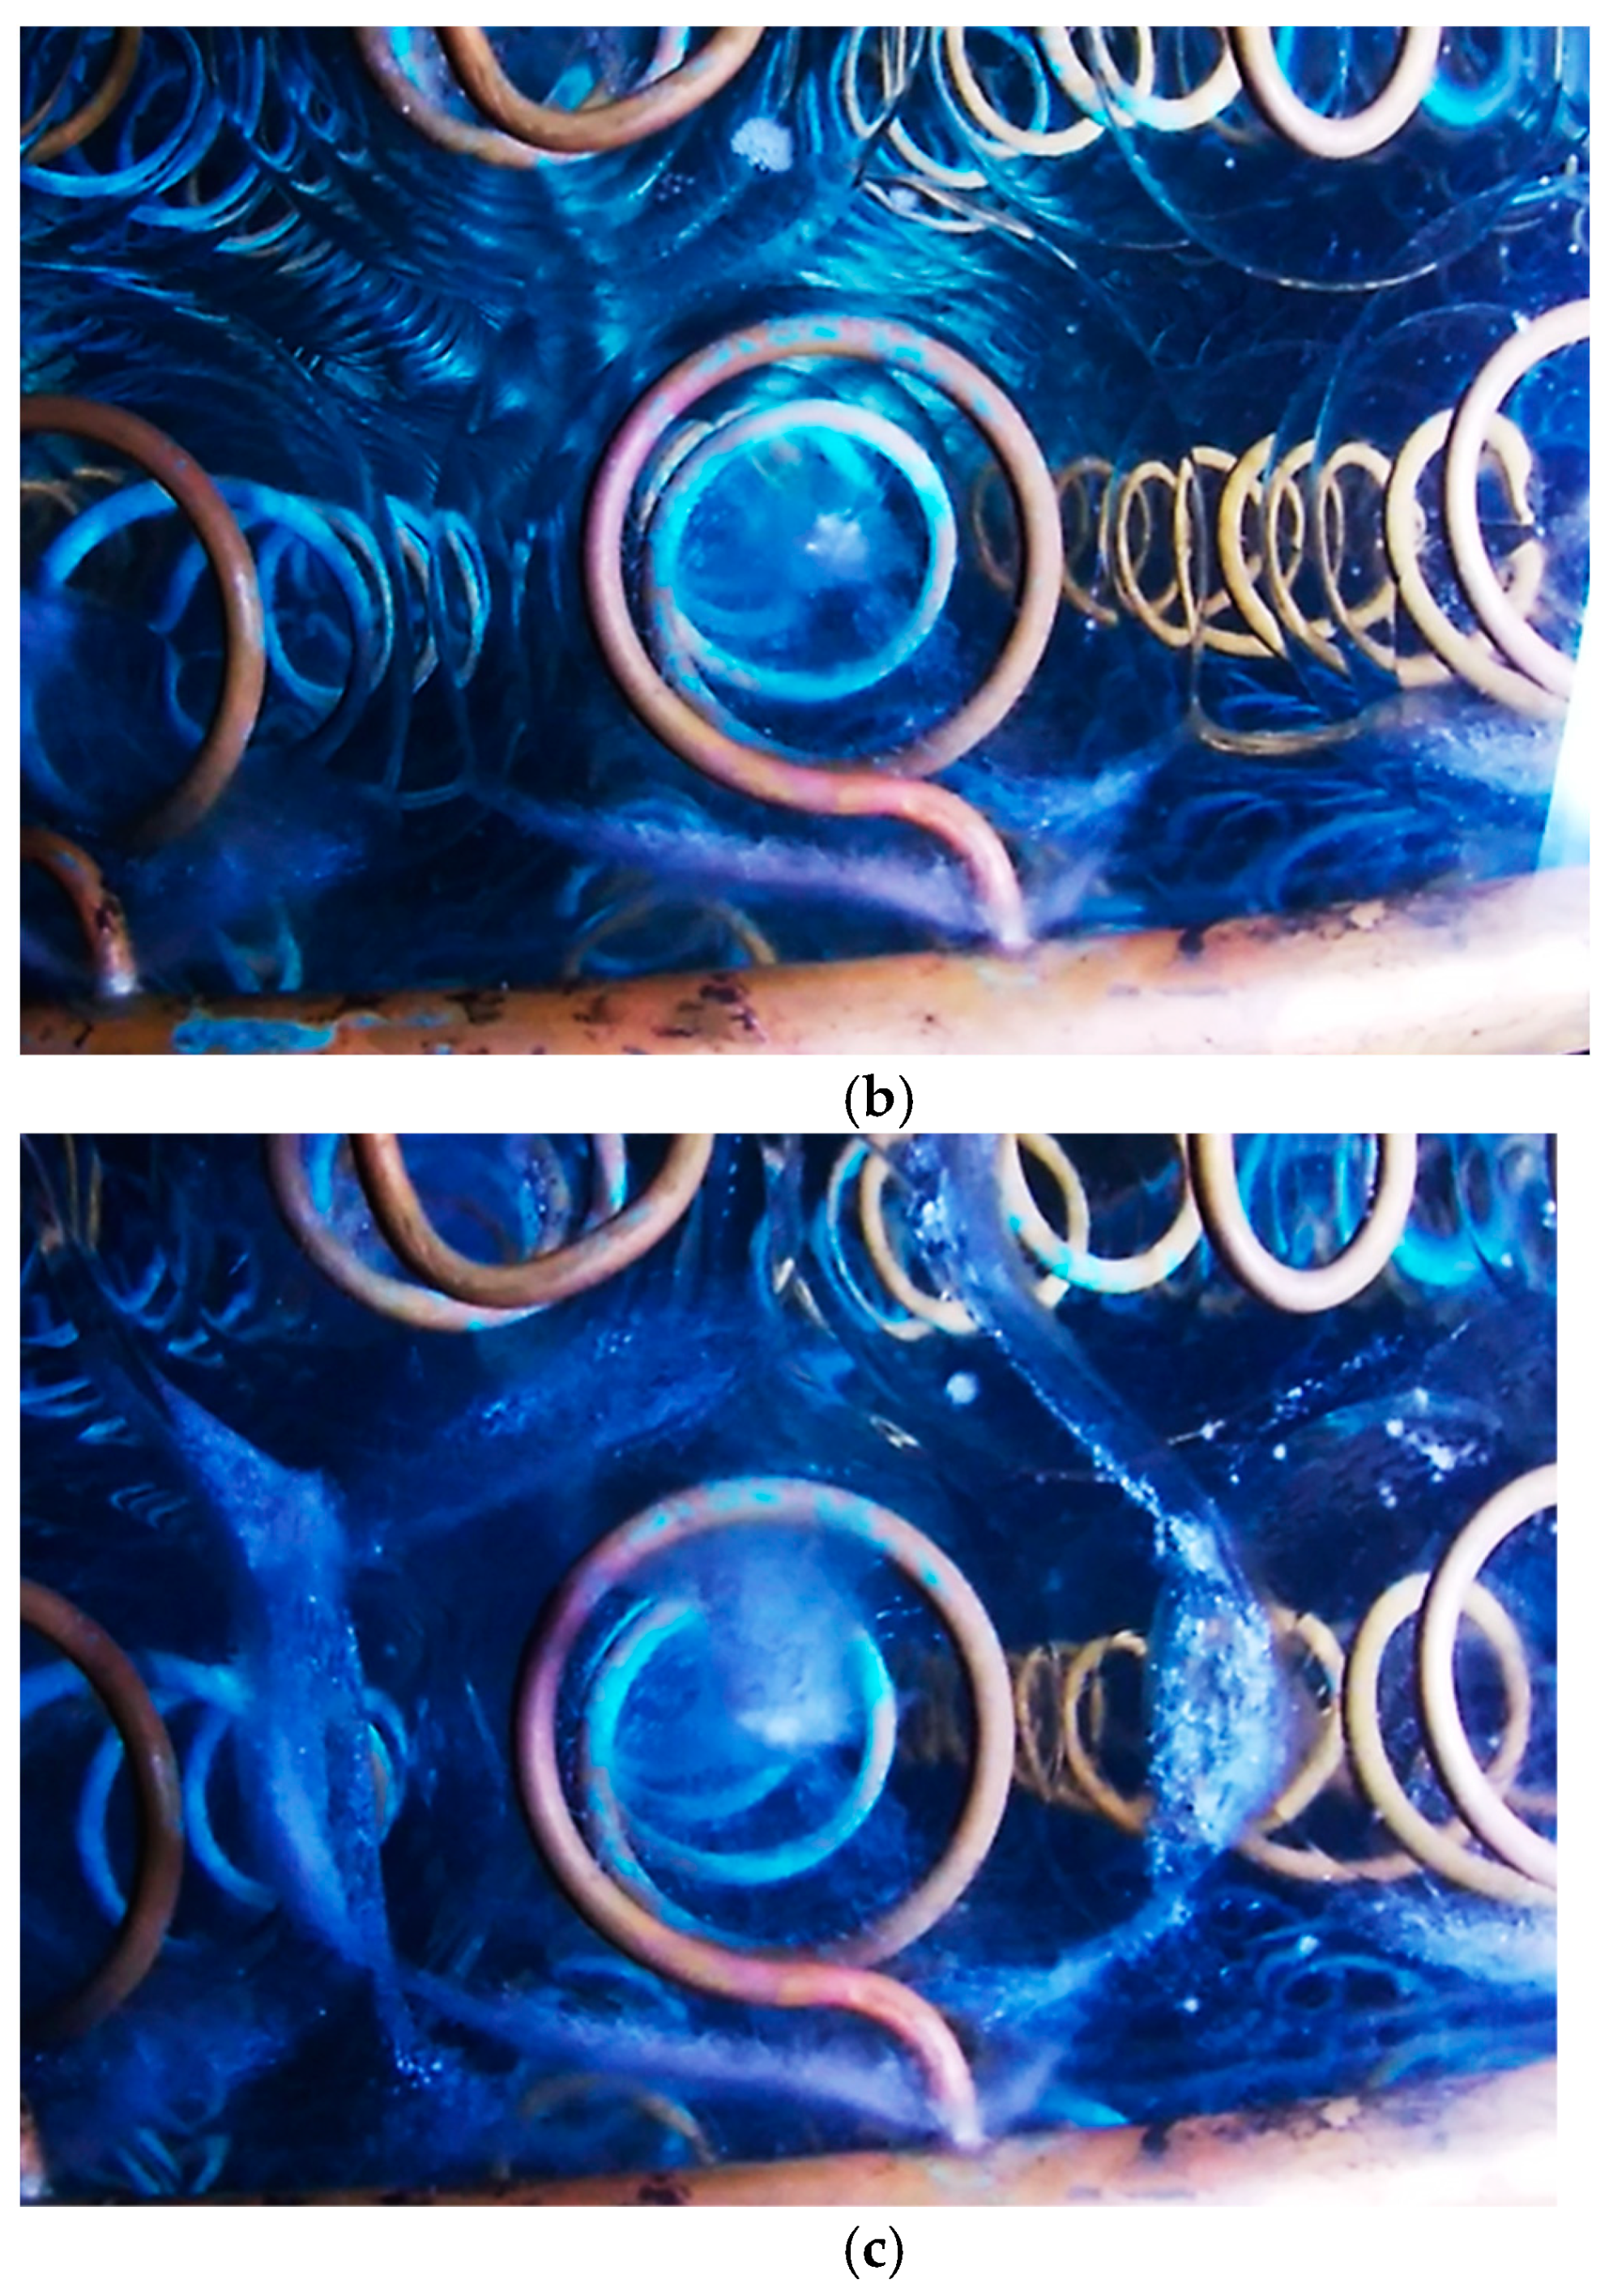
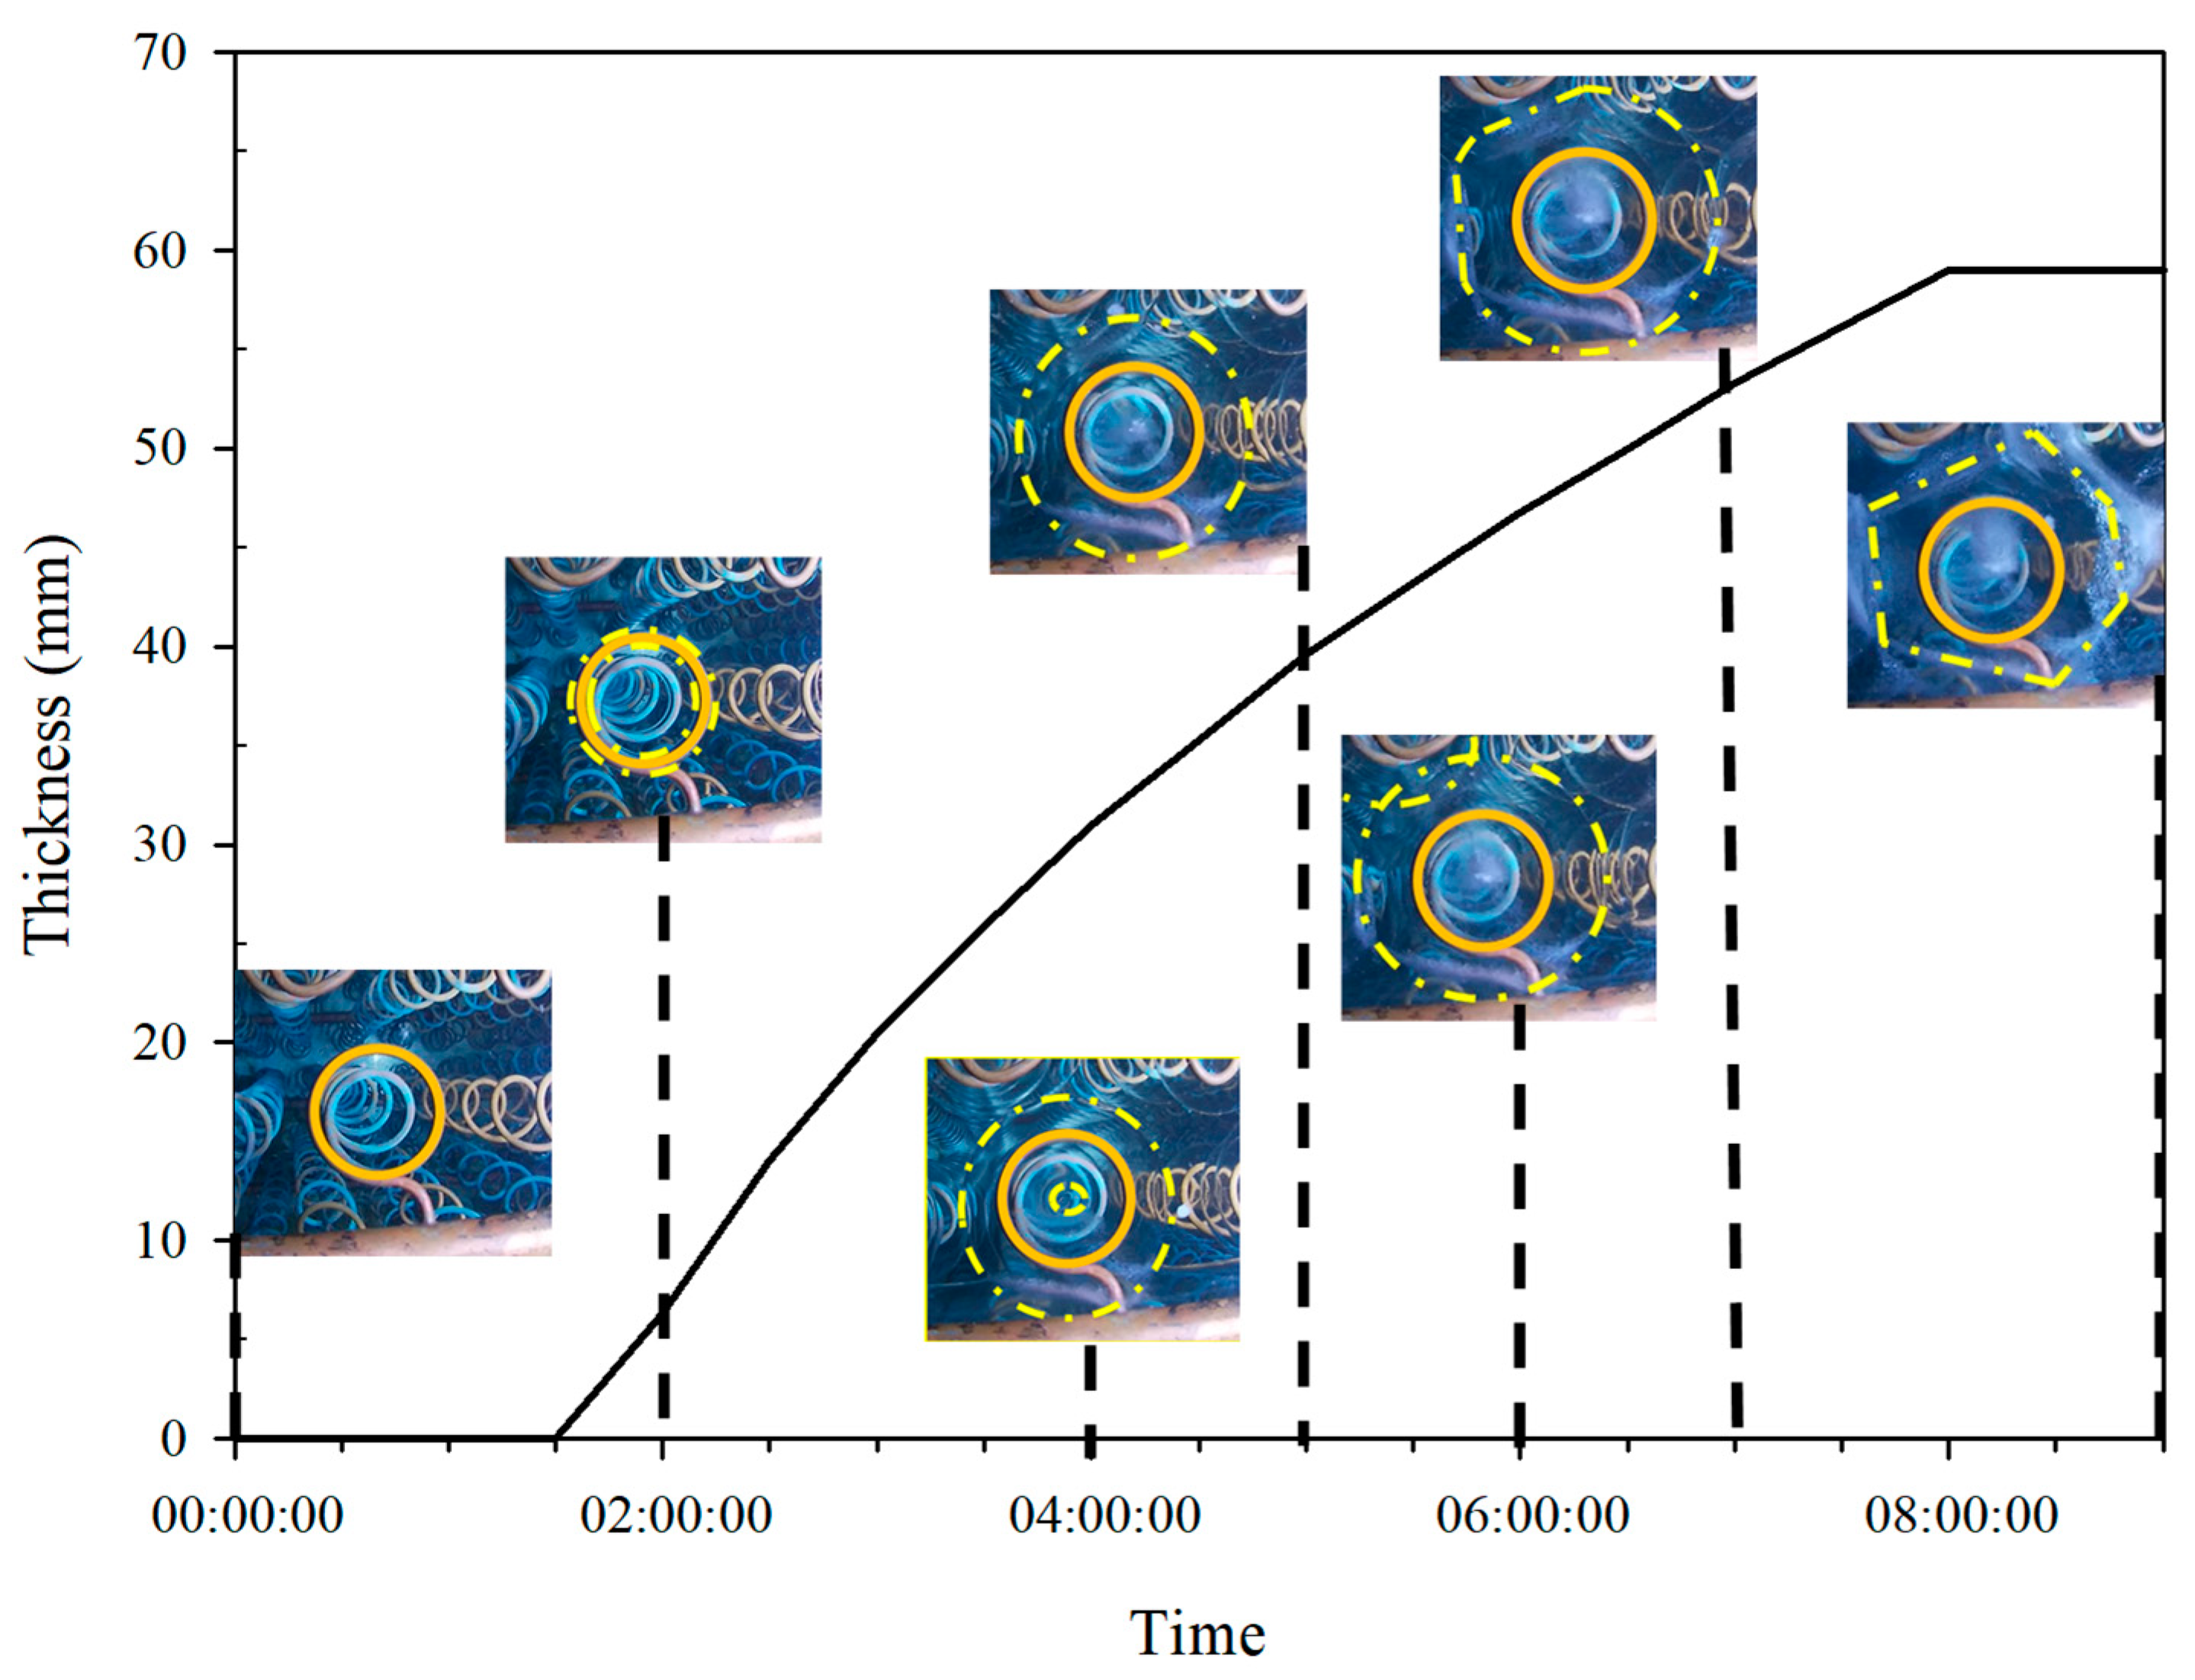
  • For the icing condition in the ice storage tank, the icing rate is reduced with the increase of ice thickness. This is because the ice around the copper tubes may grow and merge overtime, and eventually the heat transfer efficiency declined.

Author Contributions

Conceptualization, C.-H.H.; experiment, Y.-S.C.; investigation, M.-L.C.; writing—original draft preparation, Y.-S.C.; writing—review and editing, all authors; supervision, K.-S.Y. and C.-C.W.; project administration, C.-C.W. All authors have read and agreed to the published version of the manuscript.

Funding

This research was funded by the Bureau of Energy of the Ministry of Economic Affairs under the contracts of 110-E0209, and Ministry of Science and Technology of Taiwan under the contracts of MOST 109-2628-E-167-001-MY3.

Institutional Review Board Statement

Not applicable.

Informed Consent Statement

Not applicable.

Data Availability Statement

Data available on request due to restrictions.

Acknowledgments

The authors gratefully acknowledge the financial support from the Bureau of Energy of the Ministry of Economic Affairs under the contracts of 110-E0209, and Ministry of Science and Technology of Taiwan under the contracts of MOST 109-2628-E-167-001-MY3.

Conflicts of Interest

The authors declare no conflict of interest.

References

  1. Yau, Y.H.; Rismanchi, B. A review on cool thermal storage technologies and operating strategies. Renew. Sustain. Energy Rev. 2012, 16, 787–797. [Google Scholar] [CrossRef]
  2. Sehar, F.; Rahman, S.; Pipattanasomporn, M. Impacts of ice storage on electrical energy consumptions in office buildings. Energy Build. 2012, 51, 255–262. [Google Scholar] [CrossRef]
  3. Haughey, M.D. Ice thermal storage for Colorado school. ASHRAE J. 2003, 45, 50–53. [Google Scholar]
  4. Sebzali, M.J.; Rubini, P.A. Analysis of ice cool thermal storage for a clinic building in Kuwait. Energy Convers. Manag. 2006, 47, 3417–3434. [Google Scholar] [CrossRef]
  5. Dincer, I.; Rosen, M.A. Energetic, environmental and economic aspects of thermal energy storage systems for cooling capacity. Appl. Therm. Eng. 2001, 21, 1105–1117. [Google Scholar] [CrossRef]
  6. Zalba, B.; Marín, J.M.; Cabeza, L.F.; Mehling, H. Review on thermal energy storage with phase change: Materials, heat transfer analysis and applications. Appl. Therm. Eng. 2003, 23, 251–283. [Google Scholar] [CrossRef]
  7. Dincer, I. On thermal energy storage systems and applications in buildings. Energy Build. 2002, 34, 377–388. [Google Scholar] [CrossRef]
  8. Wood, R.J.; Baldwin, D.T.; O’Callaghan, P.W.; Probert, S.D. A survey of the industrial potential for thermal energy storage systems. J. Heat Recover. Syst. 1983, 3, 333–347. [Google Scholar] [CrossRef]
  9. Farid, M.M.; Khudhair, A.M.; Razack, S.A.K.; Al-Hallaj, S. A review on phase change energy storage: Materials and applications. Energy Convers. Manag. 2004, 45, 1597–1615. [Google Scholar] [CrossRef]
  10. Oró, E.; De Gracia, A.; Castell, A.; Farid, M.M.; Cabeza, L.F. Review on phase change materials (PCMs) for cold thermal energy storage applications. Appl. Ener. 2012, 99, 513–533. [Google Scholar] [CrossRef] [Green Version]
  11. Hasnain, S.M. Review on sustainable thermal energy storage technologies, part I: Heat storage materials and techniques. Energy Convers. Manag. 1998, 39, 1127–1138. [Google Scholar] [CrossRef]
  12. Nkwetta, D.N.; Haghighat, F. Thermal energy storage with phase change material — A state-of-the art review. Sustain. Cities Soc. 2014, 10, 87–100. [Google Scholar] [CrossRef]
  13. Hasnain, S.M. Review on sustainable thermal energy storage technologies, part II: Cool thermal storage. Energy Convers. Manag. 1998, 39, 1139–1153. [Google Scholar] [CrossRef]
  14. Hajiah, A.; Krarti, M. Optimal controls of building storage systems using both ice storage and thermal mass—Part II: Parametric analysis. Energy Convers. Manag. 2012, 64, 509–515. [Google Scholar] [CrossRef]
  15. Ahmadi, R.; Hosseini, M.J.; Ranjbar, A.A.; Bahrampoury, R. Phase change in spiral coil heat storage systems. Sustain. Cities Soc. 2018, 38, 145–157. [Google Scholar] [CrossRef]
  16. Esapour, M.; Hosseini, M.J.; Ranjbar, A.A.; Pahamli, Y.; Bahrampoury, R. Phase change in multi-tube heat exchangers. Renew. Energy 2016, 85, 1017–1025. [Google Scholar] [CrossRef]
  17. Yan, C.; Shi, W.; Li, X.; Zhao, Y. Optimal design and application of a compound cold storage system combining seasonal ice storage and chilled water storage. Appl. Energy 2016, 171, 1–11. [Google Scholar] [CrossRef]
  18. Lemort, V. A numerical comparison of control strategies applied to an existing ice storage system. Energy Convers. Manag. 2006, 47, 3619–3631. [Google Scholar] [CrossRef]
  19. Henze, G.P.; Krarti, M.; Brandemuehl, M.J. Guidelines for improved performance of ice storage systems. Energy Build. 2003, 35, 111–127. [Google Scholar] [CrossRef]
  20. Chaichana, C.; Charters, W.W.S.; Aye, L. An ice thermal storage computer model. Appl. Therm. Eng. 2001, 21, 1769–1778. [Google Scholar] [CrossRef]
  21. Vetterli, J.; Benz, M. Cost-optimal design of an ice-storage cooling system using mixed-integer linear programming techniques under various electricity tariff schemes. Energy Build. 2012, 49, 226–234. [Google Scholar] [CrossRef]
  22. Chan, A.L.S.; Chow, T.T.; Fong, S.K.F.; Lin, J.Z. Performance evaluation of district cooling plant with ice storage. Energy 2006, 31, 2750–2762. [Google Scholar] [CrossRef]
Figure 1. Schematic of the experimental equipment.
Processes 09 00683 g001
Figure 2. Design layout of the ice storage tank.
Processes 09 00683 g002
Figure 3. Schematic of the refrigeration mode.
Processes 09 00683 g003
Figure 4. Schematic of the ice storage mode.
Processes 09 00683 g004
Figure 5. Schematic of the melting mode.
Processes 09 00683 g005
Figure 6. Inlet/outlet temperature of the four major refrigeration components. (a) Ice storage mode; (b) Melting mode.
Processes 09 00683 g006aProcesses 09 00683 g006b
Figure 7. Picture of the icing condition at (a) the second hour, (b) fifth hour, and (c) eighth hour.
Processes 09 00683 g007aProcesses 09 00683 g007b
Figure 8. Time–thickness diagram of the ice.
Processes 09 00683 g008
Figure 9. Comparison between the power consumption of the two systems.
Processes 09 00683 g009
Figure 10. Demand charge used by the two systems.
Processes 09 00683 g010
Figure 11. Comparison between the energy charge of the two systems.
Processes 09 00683 g011
Figure 12. Pressure–enthalpy diagram.
Processes 09 00683 g012
Table 1. Benefit analysis of the two systems (plan 1 and plan 2).
Ice Storage SystemGeneral Refrigeration System
Energy chargeOff-peak hours
(22:30–07:30)
kWh1054.8kWh315
USD18.29USD9.09
Half-peak hours
(07:30–10:00)
(12:00–13:00)
(17:00–22:30)
kWh303.9kWh452.4
USD21.27USD31.68
Peak hours
(10:00–12:00)
(13:00–17:00)
kWh193.2kWh312
USD23.34USD37.7
Total electricity bill (USD/Month)62.978.47
Total energy cost saved during peak hours (USD$/Month)24.77
Demand chargeDemand charge (kW)kW2kW2.5
USD15.57USD19.46
Off-peak Demand charge (kW)kW2.5kW0
USD2.33USD0
Total electricity bill (USD/Month)17.919.46
Total energy cost saved during peak hours (USD$/Month)3.89
Total power consumption transfer during peak hours (kWh/Month)267.3
Reduced power consumption during peak hours (%)35
Publisher’s Note: MDPI stays neutral with regard to jurisdictional claims in published maps and institutional affiliations.

