Article

Reused Plant Fried Oil: A Case Study with Home-Made Soaps

1
Department of Plant Origin Food Sciences, Faculty of Veterinary Hygiene and Ecology, University of Veterinary and Pharmaceutical Sciences, Palackeho tr. 1, 612 42 Brno, Czech Republic
2
Department of Molecular Pharmacy, Faculty of Pharmacy, Masaryk University, Palackeho tr. 1946/1, 612 00 Brno, Czech Republic
*
Author to whom correspondence should be addressed.
Processes 2021, 9(3), 529; https://doi.org/10.3390/pr9030529
Submission received: 13 February 2021 / Revised: 10 March 2021 / Accepted: 11 March 2021 / Published: 16 March 2021

Abstract

:
The study aimed to analyze the possibility of waste frying oil utilization in home-made soap production. Soaps were made from unheated and fried rapeseed, sunflower and palm oils that had total polar material (TPM) values up to 24%. Physicochemical and microbial analyses were performed on produced samples to check their quality. The hardness increased with the degradation level of rapeseed and palm oils, and opposite findings were obtained for sunflower-made soaps. The highest malondialdehyde (MDA) contents were recorded for sunflower oil-made samples, with the maximum of 6.61 µg/g, and the lowest for the palm oil-made samples, with the maximum of 0.94 µg/g. The antimicrobial assessment showed no significant (p > 0.05) differences between control soap samples and soaps made of oils with the highest TPM value. Gram-positive bacteria (methicillin-resistant Staphylococcus aureus: MRSA) were the most sensitive chosen microorganisms, compared to Gram-negative bacteria and yeasts. The obtained results did not show exact differences between experimentally produced soap samples from fried or not fried oils; these findings highlight the potential of home-made soap production from this byproduct.

1. Introduction

The amount of waste is increasing together with the world’s population growth, meaning that reverse logistics systems have been gaining in importance [1,2]. Waste frying oil represents one of the most important byproducts due to its hazardous impact on the environment [3]. Food frying is the main cooking method around the world and usually highly accepted by consumers [4]. Approximately 200 million tons of frying vegetable oils are being produced annually in the world with an increasing trend [5,6]. According to some assumptions, 1 L of waste oil poured into water can pollute up to 500,000 L of fresh water [3].
A larger portion of waste frying oil that comes from restaurants and industry is being collected and utilized. According to Greenea, in the European Union, 51% of frying oil waste comes from households and only a few percent is being collected [7]. Thus, a large amount of this waste ends up in sewage, causing environmental and economic problems. In sewage cleaning systems, oil sticks to the apparatuses and causes clogging and corrosion. Such cleaning processes are low in efficiency and require a lot of energy [8].
There is a great potential today for waste frying oil to be used as a low-cost raw material in the production of biodiesel, lubricants, resins, soaps and many other applications (bitumen rejuvenator or fermentation media component) [3,9]. It is of great importance to find the solution for the utilization of household-originated waste frying oils. The possible solution could be the production of home-made soaps. Their production (saponification process) requires a minimal amount of energy and practically no byproducts are created [10]. Consequently, this production is also described as a technology with a green prospective [11].
By some studies, soaps degrade up to 4 times faster than oils. This is mainly due to their higher accessibility to microorganisms [12,13]. In addition, supportive data come from the studies that include saponification as the one step in waste frying oil-rich wastewater treatment [14].
Literature findings are limited to just a few articles describing home-made soap production from waste frying oil, but with no clearly defined degradation level of fried oil from which the soap samples were made [13,15,16]. The study aim was to evaluate the quality of home-made soaps produced from waste frying oils, and to perceive the possible more environmentally friendly utilization.

2. Materials and Methods

2.1. Preparation of Soap Samples

The rapeseed, sunflower and palm oils were used for preparation of soap samples. Rapeseed and sunflower oils were produced in the Czech Republic and palm oil was bottled in Austria. The frying of French fries served as the simulation of the oil frying process in restaurants. The French fries (Hearty Food Co., Tesco, Praha, Czech Republic) in batches of 100 g were fried in approximately 3.3 L of oil in the fryer FR 2035 (Concept, Choceň, Czech Republic) for 5 min at the approximate average temperature of 175 °C. Sampling of the fried oil for soap making purposes was conducted after three batches of frying and, further, when the TPM (total polar matter) reached values of 10, 15, 20 and 24%. TPM values were measured by TPM meter testo 270 (Testo SE & Co. KGaA, Titisee-Neustadt, Germany). The unheated oil was taken for making control soap samples. The samples were labeled according to Table 1.
The soaps were made using the cold saponification method reported by Adigun et al. [17] with slight modifications. An amount of 130 g of filtered oil was mixed with 66.92 g of 26% (w/w) NaOH water solution using the blender (3–5 min). The mixture was poured into the molds and after 24 h was taken out of the filter paper to mature in the air. After 4 weeks, the soap samples were subjected to the analysis.

2.2. Assessment of the Physicochemical Properties of the Soap

The physicochemical parameters studied on soap samples included: pH, moisture, total alkali, total fat matter, total fat content, MDA (malondialdehyde), foaming, hardness and stickiness.
pH value was obtained by measurement in a 1% soap solution in distilled water [18], using the pH meter Orion 4 star (Thermo Scientific, Waltham, MA, USA).
For determination of moisture content, 5 g of soap sample were dried in an oven at 105 °C until achievement of the constant mass. The mass of the sample before and after drying was weighed on the analytical balance ALS 250-4A (Kern, Frankfurt am Main, Germany), with precision of 0.1 mg.
The total alkali was determined by acid base titration. An amount of 10 g of soap sample was dissolved in ethanol and supplemented with 5 mL of 1N H2SO4 (aq). The excess of acid was titrated with 1N NaOH using the phenolphthalein indicator. The total alkali was calculated using the formula [19]
% Total alkali = (V(Acid) − V(Base))/(m(sample)) × 3.1.
For total fat matter determination, 10 g of soap sample was dissolved in hot neutralized ethanol and filtered. The remaining residues on the filter represented matter insoluble in alcohol (MIA). The MIA value was obtained by drying and weighing the filter, and total fat matter was calculated using the formula [20]
% Total fat matter = (100 − (moisture content + MIA))/1.085
The MDA was determined with the TBA (thiobarbituric acid) method according to Khalifa et al. [21] with slight modifications. An amount of 1.5 g of soap sample was homogenized with 1 mL of EDTA (ethylenediaminetetraacetic acid, 0.3% water solution), 5 mL of BHT (butylated hydroxytoluene, 0.8% solution in hexane) and 8 mL of TCA (trichloroacetic acid, 10% water solution) and centrifuged for 5 min at 3000 RPM. The lower layer was filtered into the 10 mL volumetric flask and supplemented with 10% TCA to the mark. Mixture containing 4 mL of this solution and 1 mL of TBA was incubated for 90 min at 70 °C in the dark. This was followed by rapid cooling to room temperature in the ice bath and 45 min laying down at room temperature prior to the measurements. Measurements were conducted at 532 nm on the spectrophotometer CE7210 (Cecil Instruments, Milton, UK). The results were calculated using the standard calibration curve.
Total fat was obtained by the Soxhlet method on the instrument B-811 (Büchi, Flawil, Switzerland). Extraction was conducted using the petrol ether as solvent from the 5 g sample. The program consisted of 90 min of extraction, followed by 30 min of washing and 20 min of solvent evaporation.
Foaming capacity and foam stability were assessed according to Kempka et al. [22] An amount of 20 mL of 0.5% soap solution was homogenized for 30 s in a 400 mL glass beaker (low form) using the homogenizer HG-15A (Witeg, Wertheim, Germany). Homogenization was performed at approximately 13,500 RPM with the dispersing tool HT1025. The foam volume was measured in the 100 mL graduated cylinder right after mixing and after 30 min. The foaming capacity was calculated using the formula
% Foaming capacity = (V(after homogenization) − V(initial solution))/V(initial solution) × 100
The foam stability was calculated using the formula:
% Foam stability = V(foam after 30 min)/V(foam after homogenization) × 100
The textural parameters, hardness and stickiness, of soap samples were measured on the texturometer TA.XT plus (Stable Microsystems, Godalming, UK). The results were obtained using the stainless P/5 cylinder probe to penetrate into the soap bar dimensions 50 × 50 × 20 mm on 5 different places. The probe diameter was 5 mm, penetration depth was set to 5 mm and test speeds were adjusted to 1 mm/s. A 50 kg load cell was fitted in the moving arm of the instrument. The hardness was defined as the force (g) needed for a probe to make a 5 mm deep hole in the soap sample; stickiness represented the force for probe retraction from the sample.

2.3. Assessment of the Antimicrobial Properties of the Soap

To test antimicrobial efficacy, a control set of soaps (S0, R0, P0) and set 5 (S5, R5, P5) were selected. The soaps were dissolved in distilled water and 20% solutions of the individual soaps were prepared. To determine the antimicrobial efficacy of soaps, a modified method according to EUCAST (European Committee on Antimicrobial Susceptibility Testing) was used to determine the minimum inhibitory concentration by the microdilution method. One plate was used to test one type of soap (control and set 5) in 6 concentrations (10%, 5%, 2.5%, 1.25%, 0.625%, 0.3125%), each with one microorganism. Lines A–D contained soaps in various concentrations and with microorganisms, lines E–G contained only soaps in various concentrations without microorganisms (blank), line H (1–6) contained broth without soap and without microorganisms (control of possible broth contamination) and line H (7–12) contained broth without soap with microorganisms (negative control). The reference strains of microorganisms used in the experiment were Staphylococcus aureus subsp. aureus CCM 7110 (methicillin-resistant S. aureus; MRSA), Escherichia coli CCM 3954 and Candida albicans CCM 8261 from the Czech Collection of Microorganisms of the Department of Experimental Biology, Faculty of Science, Masaryk University. Experiments that included cultivation of S. aureus and E. coli were conducted on MUELLER-HINTON broth (MiliporeSigma, formerly Sigma-Aldrich, Munchen, Germany) and C. albicans was inoculated on Malt Extract Broth (Sigma-Aldrich, Germany). Inoculum concentration was adjusted to approximately 1–2 × 10⁸ CFU/mL corresponding to suspension standard of 0.5 McFarland degrees. Final concentration in the wells was adjusted by dilution to 104–105 CFU/mL. The inoculated plates were incubated for 18 h at 35–37 °C. After incubation, the absorbance (turbidity) in plates was measured spectrophotometrically using a microplate reader and the inhibition was calculated from the obtained data. To visualize the results and to stain metabolically active cells, 1% TTC (triphenyl tetrazolium chloride) solution was used. The reaction reduces tetrazolium chloride to red formazan when bacterial and yeast dehydrogenases are present and active.

2.4. Statistics

The results are presented in the tables, together with the mean values and standard deviations. Parameters moisture, total fatty matter, total alkali and total fat content were assessed in duplicate; pH, foaming capacity, foam stability and MDA in triplicate; textural parameters in quintuplicate. Statistical analysis was performed using one-way ANOVA for finding the differences within the sample group. For better overview of differences between the samples, principal component analysis (PCA) was used. IBM SPSS software was used for conducting statistical analysis.

3. Results and Discussion

3.1. Physicochemical Analysis

The results for physicochemical analysis performed on soap samples are presented in Table 2 and Table 3. The obtained pH values were similar in all tested samples (Table 2). The pH ranged from 9.48 in sample 4S to 10.16 in sample P1. From the obtained values, it can be said that the pH value was not affected by the degradation level of fried oils. Significant (p < 0.05) differences were obtained between the samples, but an unambiguous trend of difference between control samples (R0, S0 and P0) and samples made from the oil with the highest TPM% (R5, S5 and P5) was not observed. The obtained results are in line with the study of Sanaguano-Salguero et al. [15], where pH values varied from 9.96 to 11.30. The selected commercial soaps tested in the work of Tarun et al. [23] had pH values between 9 and 10. The study of Mendes et al. [17] confirmed that commercial soap bars intended for kids had pH values up to 11.34. The normal human skin pH is between 5.4 and 5.9 and any introduction of soaps with a high pH can affect its protective role and microbiome [23].
Moisture content analysis revealed low values in all soap samples. No significant (p > 0.05) differences were observed among the samples made from the same oil (rapeseed, sunflower or palm). The moisture ranged from 3.57% (P5) to 9.91% (R2). The range of the soap moisture content in the work of Sanaguano-Salguero et al. [15] was from 24.90% to 43.24%. The tested commercial soaps had moisture values around 30–35% [15]. On the other hand, laundry soaps made from waste frying oils in the work of Adane [16] had moisture content values from 6.67 to 14.47%. This can be explained by the different recipe and method for the preparation of soap samples. Lower moisture content in soaps inhibits the hydrolysis and alteration inside soaps [16]. Some soap producers declare on their products’ maximal 14% of moisture [24].
One of the most important factors of the soap quality is the total fatty matter. A higher value indicates a better quality of the soap since fatty acids positively affect skin rehydration and cleansing [22]. Values ranged from 80.00% (R2) to 86.31% (S4) and changes in values among the samples did not correlate to the degradation level of frying oils from which the soaps were made. The total fatty matter of soaps made from waste frying oils in the work of Adane [16] ranged from 75.42 to 88.53%. Moisture contents measured in commercial soaps ranged from 82.10 to 88.42% and are in accordance with the present study [16]. Total alkali was 0.00% in all samples except P1 (0.01%) and P4 (0.03%). According to the literature, the lower total alkali values mean a better quality of the soap [24].
The total fat content revealed low values that ranged from 0.62% (sample S5) to 2.38% (sample R2). In general, no significant (p > 0.05) differences were obtained within the same sample groups (the same oil type).
Foaming is one of the main properties that take part in soap cleaning properties [25]. The following parameters are used for the estimation of soap foaming properties: foaming capacity and foam stability. From the obtained results, one can see that the lowest foaming capacities were found in the palm oil soaps (Table 3), with the range from 123% (P1) to 235% (P4). Samples made from sunflower and rapeseed oils showed similar values, with the highest value obtained for sample S2 (408%), though no statistically significant (p > 0.05) differences were observed between the samples belonging to the same oil group. The foam stability revealed the highest and statistically significant (p < 0.05) differences between the sunflower oil-made samples. The lowest value was found in sample S1 (10%), while the highest was found in sample S0 (54%), but there was no clear trend that would correlate with the degree of fried oil. The first (S0) and the last (S5) sample did not differ significantly (p > 0.05). The foam stability of rapeseed oil-made soaps ranged from 53% (sample R0) to 74% for sample R5 and a significant (p < 0.05) difference was obtained between those two samples too. The palm oil-made soaps revealed similar values between all the samples.
MDA determination cannot be found in the literature as the soap quality parameter. Peroxidation of oil occurs during the oil frying, and MDA represents a secondary product of oxidation [26]. The soaps made of palm oil showed the lowest values, ranging from 0.45 (sample P1) to 0.94 µg/g (sample P5). This can be explained by the fact that palm oil is more stable than the other two oils because of the structure rich in saturated fatty acids and without the presence of trans fats [27]. Soap samples from rapeseed oil had higher MDA values for the samples R0 and R1 (2.09 and 2.58 µg/g, respectively) than for the samples made from fried oil with a higher TPM. The reason might be found in some reactions during and after the saponification process that have still not been studied [13]. Soap samples made from sunflower oil had values ranging from 4.46 (S1) to 6.61 µg/g (S5). Consequently, it can be concluded that the sunflower oil had the highest level of oxidation during the process of frying.
Concerning other measured parameters of soaps (such as textural properties, hardness and stickiness), there was a lack of information in the literature on methods applied, so they are not comparable to the other studies. In the samples made from rapeseed and palm oils, hardness decreased with the increased oil degradation level. In the rapeseed oil, the value decreased from 2424 (sample R1) to 1256 g (sample R3). Hardness of the palm oil decreased from 4990 (sample P0) to 3023 g (sample P3). Oppositely, in the samples made from sunflower oils, the hardness of the soap samples increased with the degradation level (unheated oil: 786 g; the highest level of frying: 1272 g).
The recorded stickiness for soaps prepared with rapeseed and palm oils revealed the highest values in samples made from unheated rapeseed (R0) and palm oils (P0), −622 and −764 g, respectively. Regarding the sunflower oil-made soaps, no statistical (p > 0.05) difference was obtained between the S0 and S5 samples.

3.2. Antimicrobial Assessment
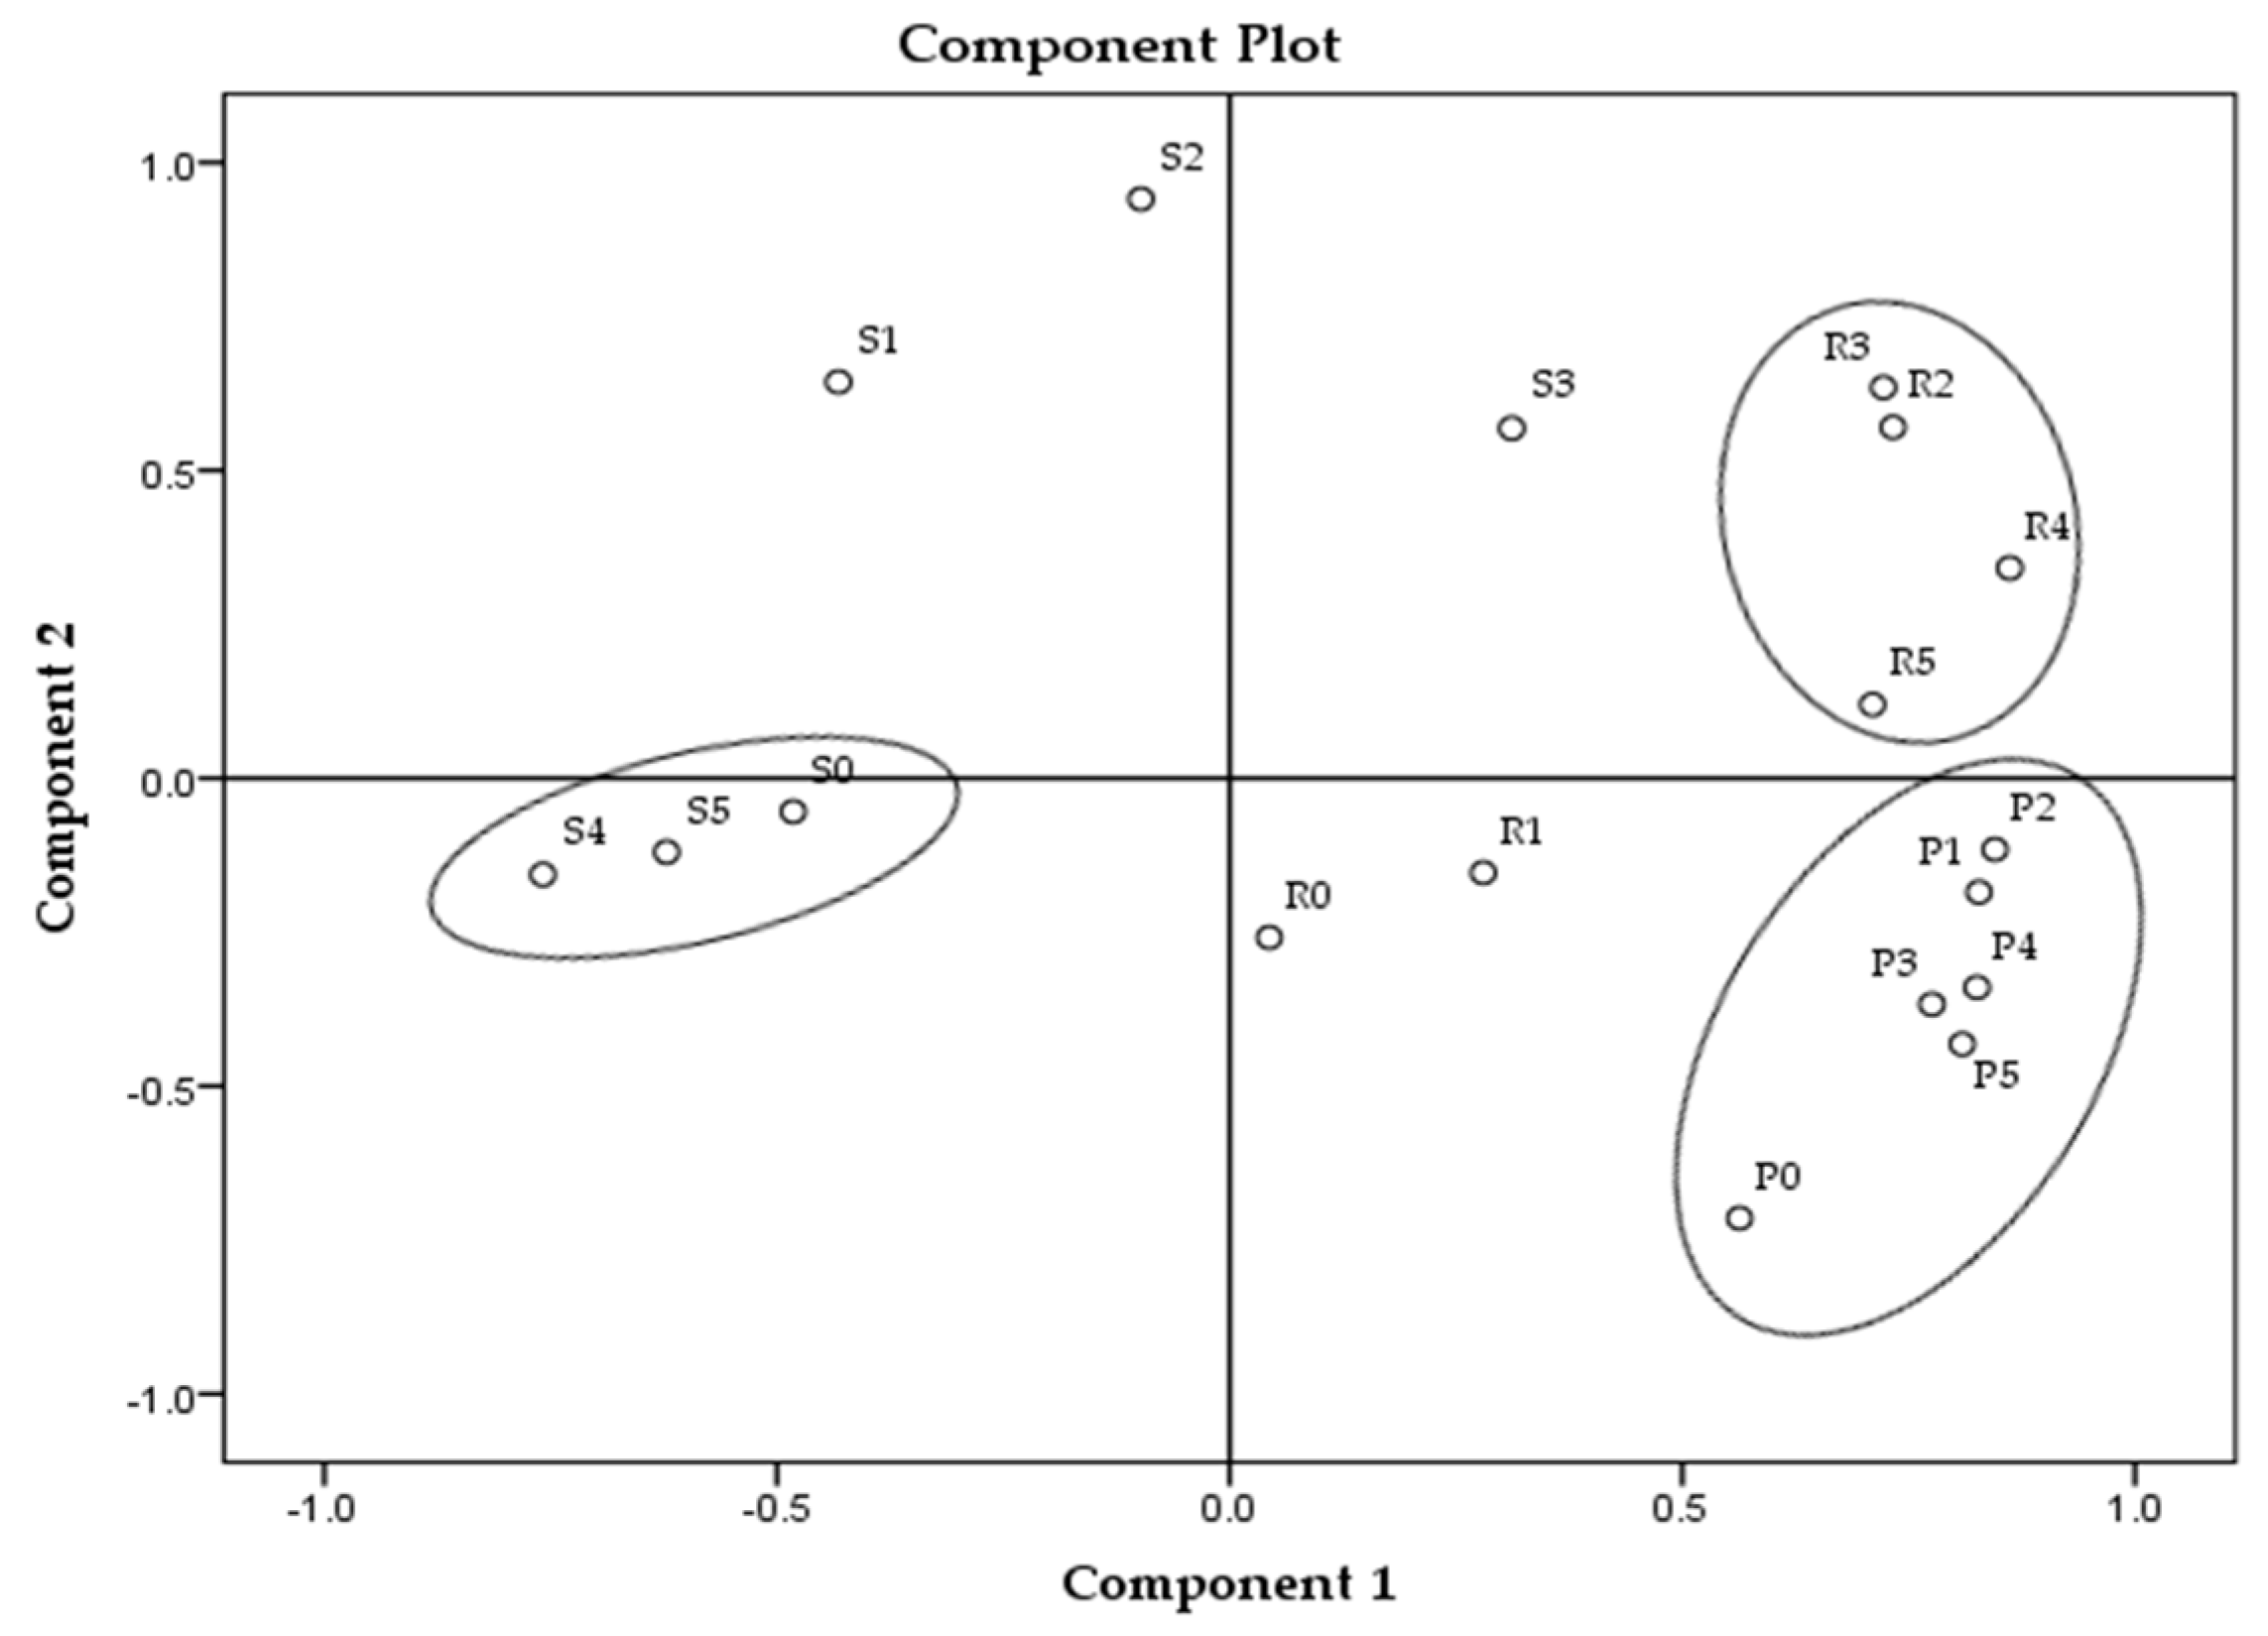
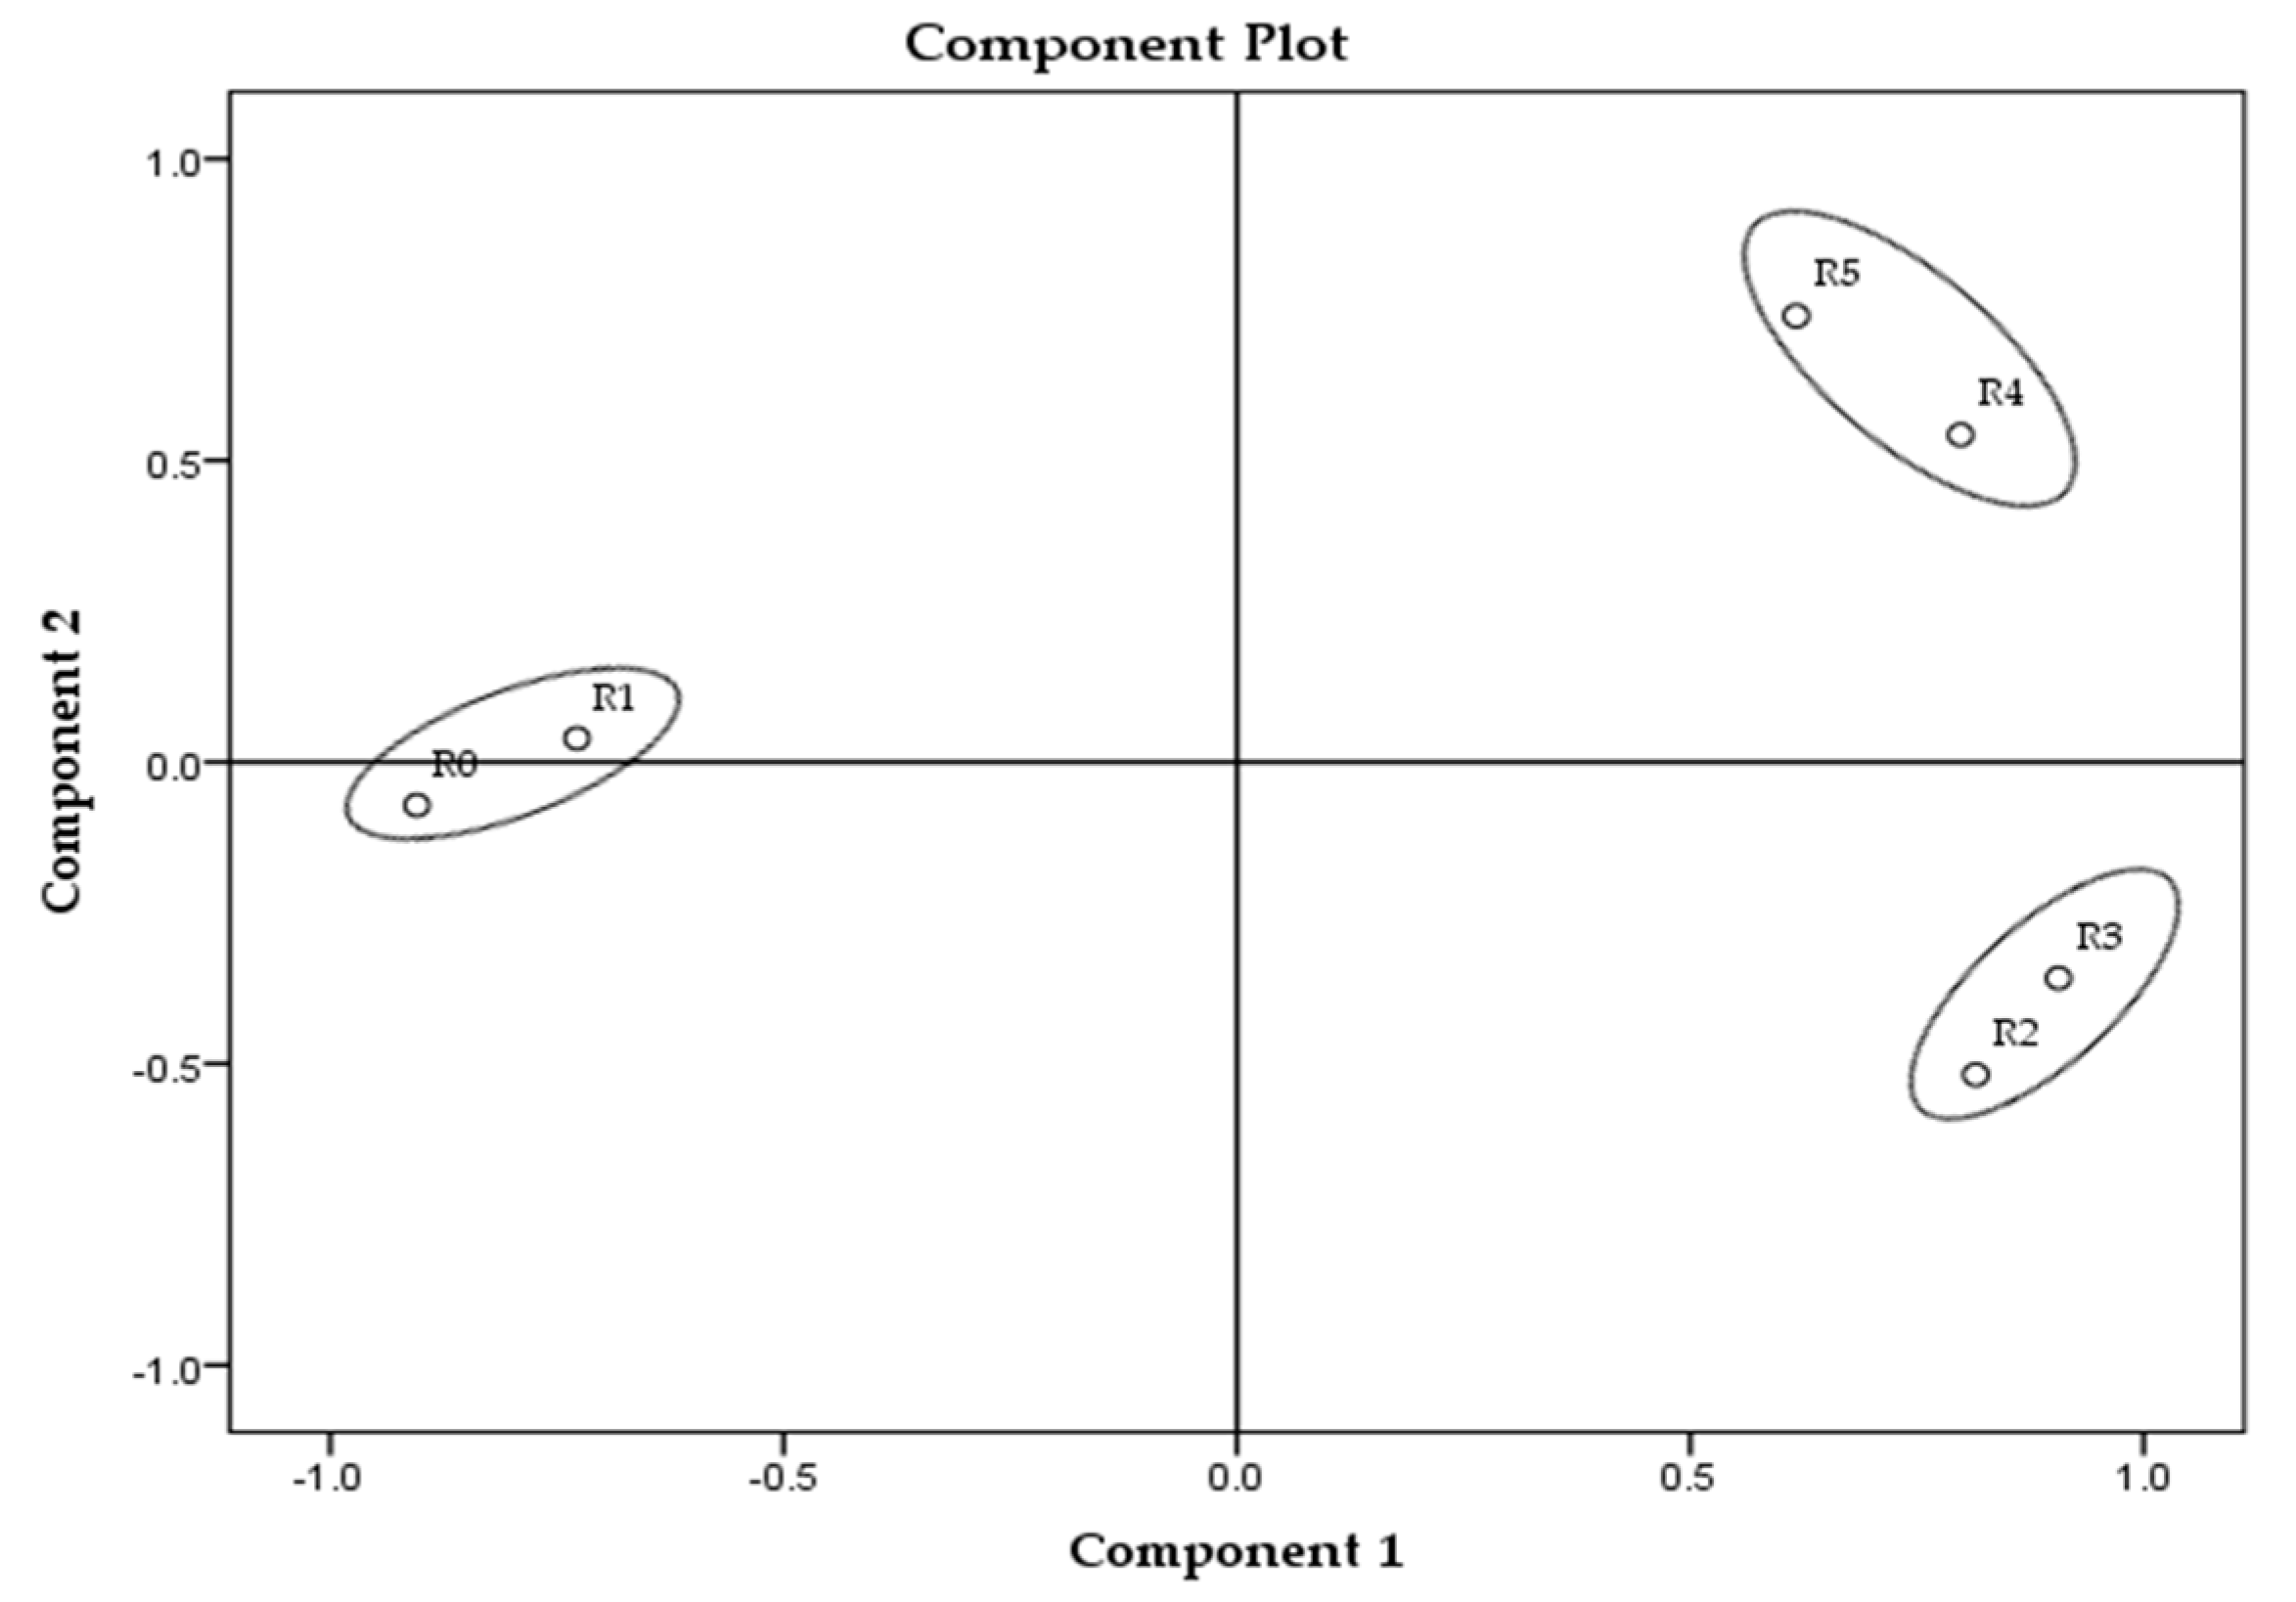
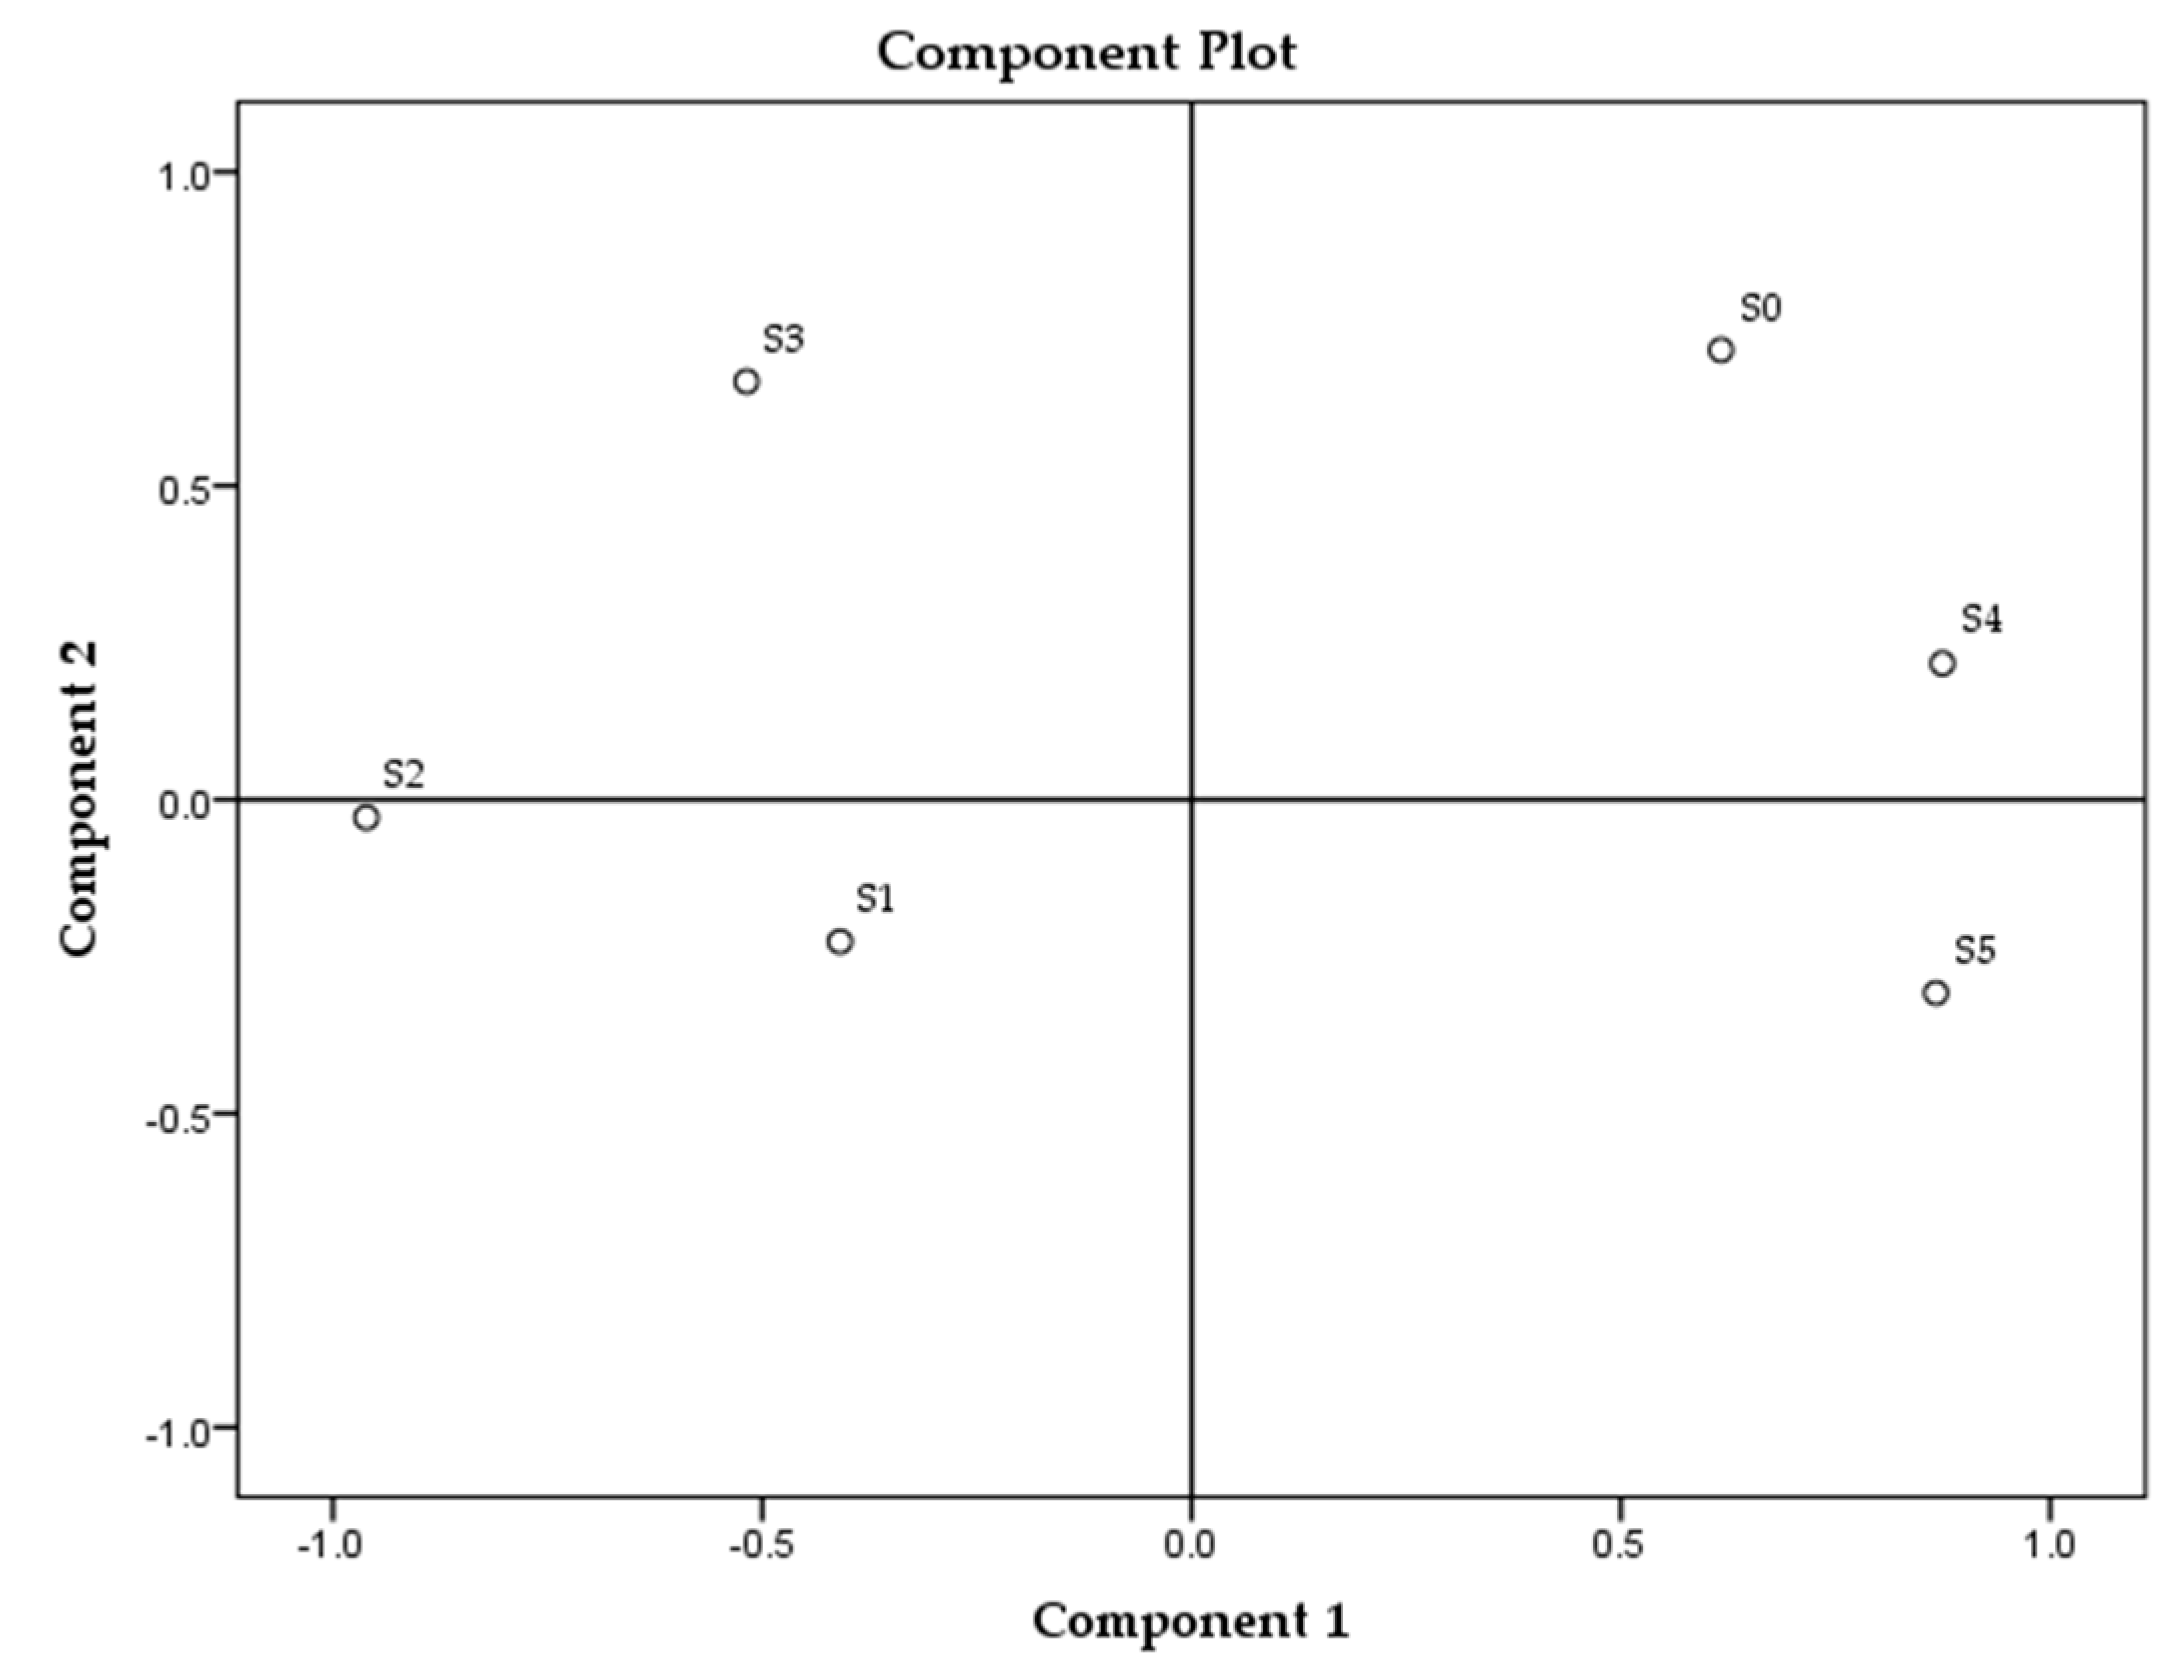
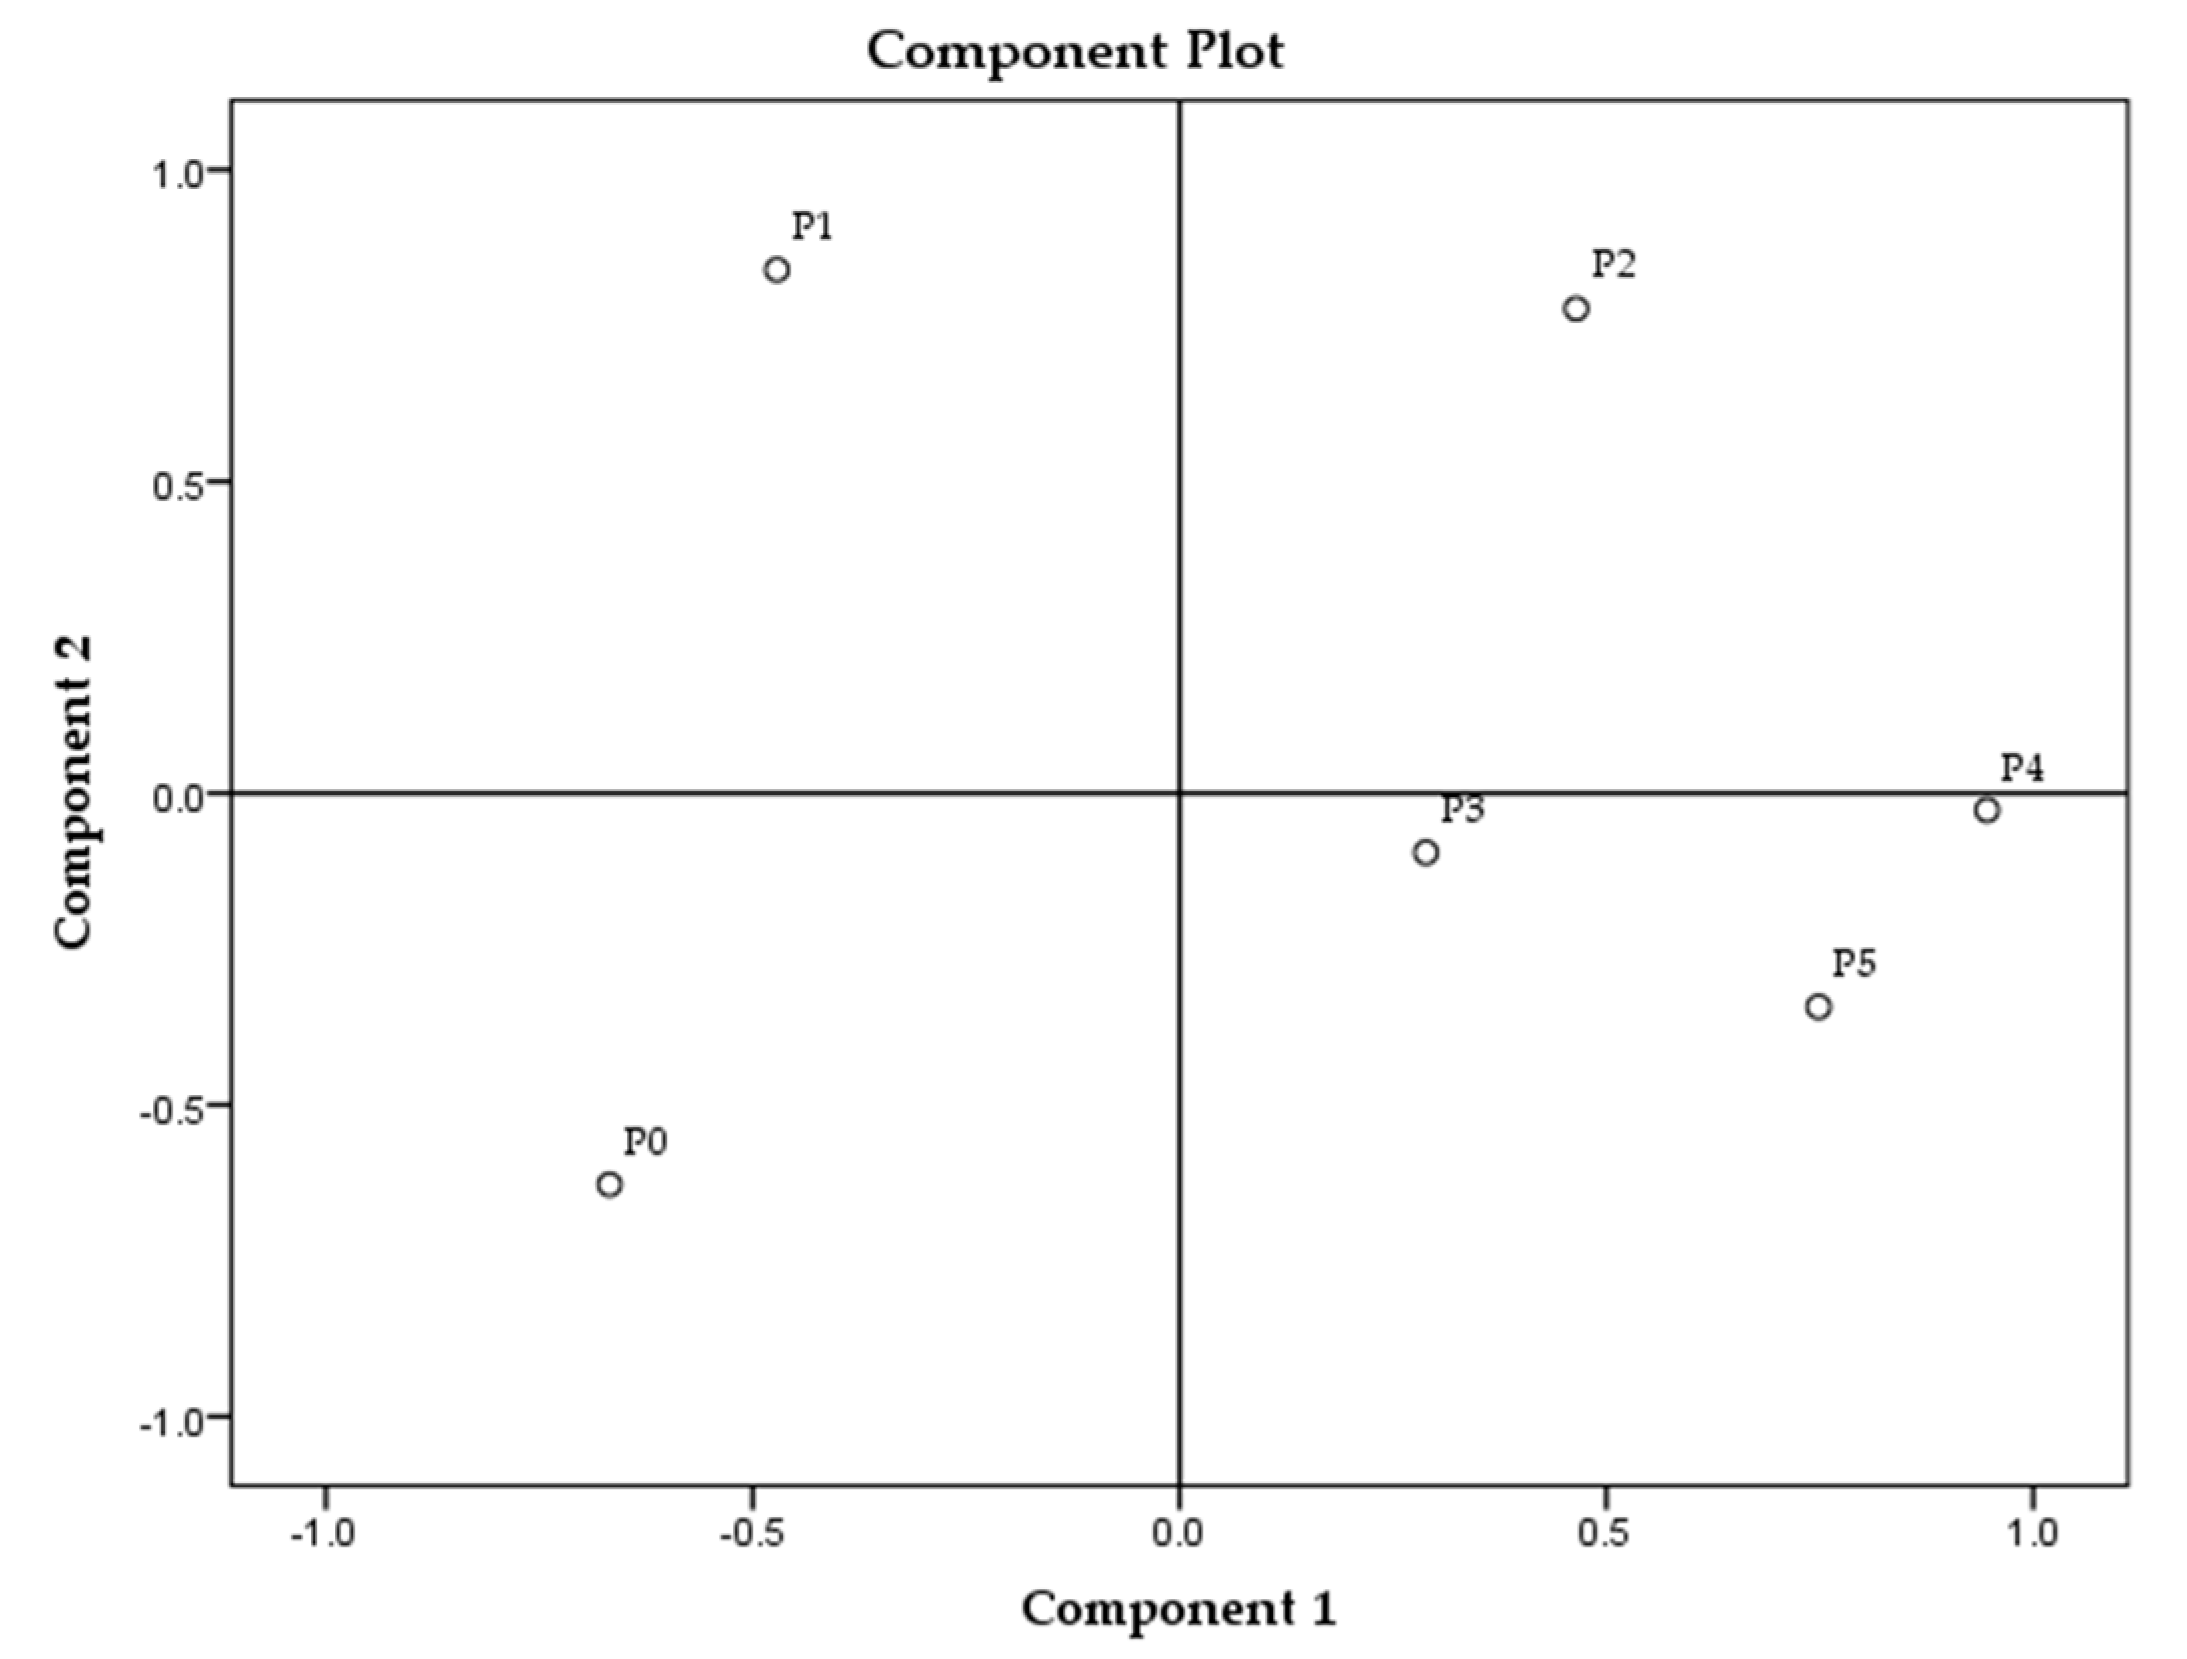
The results of the antimicrobial assessment are presented in Table 4. Inhibition (antimicrobial activity) is given in percentages. According to the approximate determination of the antimicrobial efficacy of soaps made from various oils, the soaps made from sunflower oil samples had the highest antimicrobial effect, while the lowest effectiveness can be observed for the palm oil soap. Sunflower oil soaps completely inhibit the growth of MRSA in all concentrations, regardless of the decreasing pH values. The growth inhibitory effect on E. coli was also the highest among the soap samples produced from the sunflower oil. The high alkalinity of the highest concentrations in all types of soaps undoubtedly potentiates the antimicrobial activity. However, it seems likely that inhibitory substances from the original oils pass into the soaps. It can also be stated that the results of control set 0 and set 5 do not show a significant difference.
The sunflower oil contains mainly unsaturated fatty acids, such as linoleic and oleic acids [28]. Jang et al. [29] proved the antibacterial effect of potassium salts of oleic and linoleic acids at a concentration of 5 mmol/L. After 1 h of incubation, the concentration of S. aureus, expressed as colony-forming units (CFU)/mL, was significantly reduced [29]. Moreover, Kawahara et al. [30] showed that potassium oleate was able to significantly reduce numbers of CFU/mL of S. aureus and E. coli after 10 min in incubation. The effect was comparable to the effect of alcohol-based disinfectant. Furthermore, the fatty acids themselves possess an antibacterial effect, as it was demonstrated by Huang et al. [31].
Unfortunately, no results were found for soaps containing sodium salts of linoleic and oleic acids in the literature. However, it can be assumed that the change in the salt cation would have little effect. The antibacterial effect of soaps is generally attributed to their detergent properties in water solutions. From this point of view, our results demonstrate that Gram-positive bacteria (MRSA) are more susceptible to the antimicrobial effects of soap solutions compared to Gram-negative bacteria and yeasts.

3.3. PCA Analysis

The principal component analysis (PCA) of all parameters in all samples is presented in Figure 1, and for each sample group separately in Figure 2, Figure 3 and Figure 4.
The analysis revealed the highest overall differences between sunflower samples and the lowest among the palm oil samples (Figure 1). Among all tested parameters, MDA and textural parameters (hardness and stickiness) can be identified as the main parameters distinguishing soap samples according to the TPM oil content. Palm oil-made samples revealed the smallest changes between the extreme values (MDA and textural parameters) in those parameters in comparison to the other two sample groups (prepared with sunflower and rapeseed oils). The reason might be, in fact, that the sunflower oil contains the highest content of polyunsaturated fatty acids (up to 70%), following the rapeseed oil (around 20%) and palm oil with 15%. The highest content of saturated fatty acids is in palm oil (approximately 50%) [27,32,33,34,35]. Rapeseed oil samples, according to PCA, created three clusters (R0 and R1, R2 and R3, R4 and R5) and differences between them partially correlate with the degradation level of fried oil, which can be observed in Figure 2, though the samples made from sunflower and palm oils do not have such relation (Figure 3 and Figure 4). The sunflower-made control sample (S0) is the closest to sample S4. For palm oil samples, P0 (as a control) is the closest to samples P3 and P5, among this sample group. PCA figures show unambiguous differences between samples prepared with unheated oils and soap samples prepared with fried oils; these differences are better emphasized between control samples (soaps prepared with unheated oils) and soaps with the highest TPM contents.

4. Conclusions

The present study emphasized the possibility of reusing waste frying oil from households and restaurant facilities, since this waste material is mostly discharged into the sewers. Physicochemical analysis of soaps produced from unheated and fried rapeseed, sunflower and palm oils indicated no significant quality changes for most of the tested parameters. The antimicrobial assessment showed similar results, since no differences were obtained between soaps produced from unheated and fried oils (oils with different levels of degradation, expressed in TPM values). Overall significant differences between soaps made from fried and unheated oils were not found and they cannot be distinguished unambiguously. Certainly, any possible inequality between control soaps and soaps produced from fried oils could be overwhelmed by some soap additives that can be investigated by future studies. It should be emphasized that among many applications for the utilization of frying oils, soap production stands out as a promising solution since this production can be adopted by small businesses and entrepreneurs.

Author Contributions

Conceptualization B.A., B.T., D.D.; methodology S.J., M.N., J.T.; software, B.A., D.D.; validation B.A., D.D., J.T.; formal analysis B.A., M.N., K.G.; investigation, B.A., D.D.; resources, B.T.; data curation, B.A., S.J.; writing—original draft preparation, B.A., B.T., D.D., M.N., J.T.; writing—review and editing, B.A., D.D., J.T.; visualization, B.A.; supervision, D.D., B.T.; project administration, B.T.; funding acquisition, B.T. All authors have read and agreed to the published version of the manuscript.

Funding

This research was funded by the Veterinary and Pharmaceutical University: Internal Grant Agency IGA 228/2020/FVHE.

Institutional Review Board Statement

Not applicable.

Informed Consent Statement

Not applicable.

Data Availability Statement

Data sharing not applicable.

Conflicts of Interest

The authors declare no conflict of interest.

References

  1. Nikolaou, I.E.; Evangelinos, K.I.; Allan, S. A reverse logistics social responsibility evaluation framework based on the triple bottom line approach. J. Clean. Prod. 2013, 56, 173–184. [Google Scholar] [CrossRef]
  2. Herva, M.; Neto, B.; Roca, E. Environmental assessment of the integrated municipal solid waste management system in Porto (Portugal). J. Clean. Prod. 2014, 70, 183–193. [Google Scholar] [CrossRef]
  3. Panadare, D.C. Applications of waste cooking oil other than biodiesel: A review. Iran. J. Chem. Eng. (IJChE) 2015, 12, 55–76. [Google Scholar]
  4. Mannu, A.; Garroni, S.; Ibanez Porras, J.; Mele, A. Available Technologies and Materials for Waste Cooking Oil Recycling. Processes 2020, 8, 366. [Google Scholar] [CrossRef] [Green Version]
  5. Statista.com. Available online: https://www.statista.com/statistics/263937/vegetable-oils-global-consumption/ (accessed on 5 May 2020).
  6. Lopes, M.; Miranda, S.M.; Belo, I. Microbial valorization of waste cooking oils for valuable compounds production—A review. Crit. Rev. Environ. Sci. Technol. 2019, 50, 2583–2616. [Google Scholar] [CrossRef]
  7. Hillairet, F.; Allemandou, V.; Golab, K. Analysis of the Current Development of Household UCO Collection Systems in the EU; GREENEA: Coivert, France, 2016. [Google Scholar]
  8. Maniak, B.; Szmigielski, M.; Piekarski, W.; Markowska, A. Physicochemical changes of post-frying sunflower oil. Int. Agrophys. 2009, 23, 243–248. [Google Scholar]
  9. Gökalp, İ.; Uz, V.E. Utilizing of Waste Vegetable Cooking Oil in bitumen: Zero tolerance aging approach. Constr. Build. Mater. 2019, 227, 116695. [Google Scholar] [CrossRef]
  10. Maotsela, T.; Danha, G.; Muzenda, E. Utilization of Waste Cooking Oil and Tallow for Production of Toilet “Bath” Soap. Procedia Manuf. 2019, 35, 541–545. [Google Scholar] [CrossRef]
  11. Félix, S.; Araújo, J.; Pires, A.M.; Sousa, A.C. Soap production: A green prospective. Waste Manag. 2017, 66, 190–195. [Google Scholar] [CrossRef]
  12. Lefebvre, X.; Paul, E.; Mauret, M.; Baptiste, P.; Capdeville, B. Kinetic characterization of saponified domestic lipid residues aerobic biodegradation. Water Res. 1998, 32, 3031–3038. [Google Scholar] [CrossRef]
  13. Antonić, B.; Dordević, D.; Jančíková, S.; Tremlova, B.; Kushkevych, I. Physicochemical Characterization of Home-Made Soap from Waste-Used Frying Oils. Processes 2019, 8, 1219. [Google Scholar] [CrossRef]
  14. Zhu, X.N.; Lyu, X.J.; Wang, Q.; Qiu, J.; Wang, S.S.; Liu, X.Y.; Li, L. Clean utilization of waste oil: Soap collectors prepared by alkaline hydrolysis for fluorite flotation. J. Clean. Prod. 2019, 240, 118179. [Google Scholar] [CrossRef]
  15. Sanaguano-Salguero, H.; Tigre-Leon, A.; Bayas-Morejon, I.F. Use of waste cooking oil in the manufacture of soaps. Int. J. Ecol. Dev. 2018, 33, 19–27. [Google Scholar]
  16. Adane, L. Preparation of Laundry Soap from Used Cooking Oils: Getting value out of waste. Sci. Res. Essays 2020, 15, 1–10. [Google Scholar]
  17. Adigun, O.; Manful, C.; Prieto Vidal, N.; Mumtaz, A.; Pham, T.H.; Stewart, P.; Nadeem, M.; Keough, D.; Thomas, R. Use of Natural Antioxidants from Newfoundland Wild Berries to Improve the Shelf Life of Natural Herbal Soaps. Antioxidants 2019, 8, 536. [Google Scholar] [CrossRef] [PubMed] [Green Version]
  18. Mendes, B.R.; Shimabukuro, D.M.; Uber, M.; Abagge, K.T. Critical assessment of the pH of children’s soap. Jornal de Pediatria (Versão em Português) 2016, 92, 290–295. [Google Scholar] [CrossRef] [Green Version]
  19. ČSN 68 1148 Methods of Test for Surfactants and Detergents-Surfactants-Analysis of Soaps-Determination of Free Corrosive Alkalis; (Translated by Google Translate); Czech Standards Institute: Prague, Czech Republic, 1994.
  20. Vivian, O.P.; Nathan, O.; Osano, A.; Mesopirr, L.; Omwoyo, W.N. Assessment of the physicochemical properties of selected commercial soaps manufactured and sold in Kenya. Open J. Appl. Sci. 2014, 4, 433–440. [Google Scholar] [CrossRef] [Green Version]
  21. Khalifa, I.; Barakat, H.; El-Mansy, H.A.; Soliman, S.A. Improving the shelf-life stability of apple and strawberry fruits applying chitosan-incorporated olive oil processing residues coating. Food Packag. Shelf Life 2016, 9, 10–19. [Google Scholar] [CrossRef]
  22. Kempka, A.P.; Horvath, F.J.; Fagundes, P.; Prestes, R.C. Foaming and emulsifying capacity, foam and emulsion stability of proteins of porcine blood: Determination at different values of pH and concentrations. Revista Brasileira de Tecnologia 2015, 9, 1797–1809. [Google Scholar] [CrossRef] [Green Version]
  23. Tarun, J.; Susan, J.; Jacob Suria, V.J.S.; Criton, S. Evaluation of pH of bathing soaps and shampoos for skin and hair care. Indian J. Dermatol. 2014, 59, 442. [Google Scholar] [CrossRef]
  24. Betsy, K.J.; Jilu, M.; Fathima, R.; Varkey, J.T. Determination of Alkali Content & Total Fatty Matter in Cleansing Agents. Asian J. Sci. Appl. Technol. 2012, 2, 8–12. [Google Scholar]
  25. Awang, R.; Ahmad, S.; Ghazali, R.A.Z.M.A.H. Properties of sodium soap derived from palm-based dihydroxystearic acid. J. Oil Palm Res. 2001, 13, 33–38. [Google Scholar]
  26. Gaweł, S.; Wardas, M.; Niedworok, E.; Wardas, P. Malondialdehyde (MDA) as a lipid peroxidation marker. Wiadomosci Lekarskie 2004, 57, 453–455. [Google Scholar] [PubMed]
  27. Oboh, G.; Falade, A.O.; Ademiluyi, A.O. Effect of thermal oxidation on the physico-chemical properties, malondialdehyde and carotenoid contents of palm oil. Rivista Italiana Delle Sostanze Grasse 2014, 91, 59–65. [Google Scholar]
  28. Akkaya, M.R. Prediction of fatty acid composition of sunflower seeds by near-infrared reflectance spectroscopy. J. Food Sci. Technol. 2018, 55, 2318–2325. [Google Scholar] [CrossRef]
  29. Jang, H.; Makita, Y.; Jung, K.; Ishizaka, S.; Karasawa, K.; Oida, K.; Takai, M.; Matsuda, H.; Tanaka, A. Linoleic acid salt with ultrapure soft water as an antibacterial combination against dermato-pathogenic Staphylococcus spp. J. Appl. Microbiol. 2016, 120, 280–288. [Google Scholar] [CrossRef]
  30. Kawahara, T.; Takita, M.; Masunaga, A.; Morita, H.; Tsukatani, T.; Nakazawa, K.; Go, D.; Akita, S. Fatty Acid Potassium Had Beneficial Bactericidal Effects and Removed Staphylococcus aureus Biofilms while Exhibiting Reduced Cytotoxicity towards Mouse Fibroblasts and Human Keratinocytes. Int. J. Mol. Sci. 2019, 20, 312. [Google Scholar] [CrossRef] [Green Version]
  31. Huang, C.B.; George, B.; Ebersole, J.L. Antimicrobial activity of n-6, n-7 and n-9 fatty acids and their esters for oral microorganisms. Arch. Oral Biol. 2010, 55, 555–560. [Google Scholar] [CrossRef] [PubMed] [Green Version]
  32. Matthaus, B.; Özcan, M.M.; Al Juhaimi, F. Some rape/canola seed oils: Fatty acid composition and tocopherols. Z. Naturforschung C 2016, 71, 73–77. [Google Scholar] [CrossRef]
  33. Aydınkaptan, E.; Mazı, I.B. Monitoring the physicochemical features of sunflower oil and French fries during repeated microwave frying and deep-fat frying. Grasas Aceites 2017, 68, 202. [Google Scholar] [CrossRef]
  34. Aung, W.P.; Bjertness, E.; Htet, A.S.; Stigum, H.; Chongsuvivatwong, V.; Soe, P.P.; Kjøllesdal, M.K.R. Fatty acid profiles of various vegetable oils and the association between the use of palm oil vs. peanut oil and risk factors for non-communicable diseases in Yangon region, Myanmar. Nutrients 2018, 10, 1193. [Google Scholar] [CrossRef] [PubMed] [Green Version]
  35. Montoya, C.; Cochard, B.; Flori, A.; Cros, D.; Lopes, R.; Cuellar, T.; Espeout, S.; Syaputra, I.; Villeneuve, P.; Pina, M.; et al. Genetic architecture of palm oil fatty acid composition in cultivated oil palm (Elaeis guineensis Jacq.) compared to its wild relative E. oleifera (HBK) Cortés. PLoS ONE 2014, 9, e95412. [Google Scholar] [CrossRef] [PubMed] [Green Version]
Figure 1. Principal component analysis for all analyses on the obtained samples. * Samples’ description is given in Table 1.
Processes 09 00529 g001
Figure 2. Principal component analysis of soap samples made of rapeseed oil. * Samples’ description is given in Table 1.
Processes 09 00529 g002
Figure 3. Principal component analysis of soap samples made of sunflower oil. * Samples’ description is given in Table 1.
Processes 09 00529 g003
Figure 4. Principal component analysis of soap samples made of palm oil. * Samples’ description is given in Table 1.
Processes 09 00529 g004
Table 1. Description of soap sample abbreviations and corresponding oil TPM% levels.
SampleAbbreviationOil TPM Level (%)
RSP
ControlsR0/S0/P067.55
Sample 1 setsR1/S1/P16.596.5
Sample 2 setsR2/S2/P2101010
Sample 3 setsR3/S3/P3151515
Sample 4 setsR4/S4/P4202020
Sample 5 setsR5/5S/P5242424
R—rapeseed oil sample; S—sunflower oil sample; P—palm oil sample.
Table 2. Results for pH, moisture, total fatty matter, total alkali, total fat content and MDA for produced soap samples.
SamplepHMoisture (%)Total Fatty
Matter (%)
Total Alkali (%)Total Fat
Content (%)
MDA (µg/g)
R09.67 ± 0.00 a7.43 ± 0.1782.34 ± 1.340.00 ± 0.001.63 ± 0.102.09 ± 0.05 a
R19.80 ± 0.01 b7.06 ± 1.7381.96 ± 1.560.00 ± 0.002.38 ± 0.112.58 ± 0.04 b
R210.08 ± 0.01 c9.91 ± 0.5280.00 ± 2.200.00 ± 0.001.74 ± 0.270.68 ± 0.00 c
R310.08 ± 0.00 acd9.82 ± 1.4881.61 ± 1.120.00 ± 0.001.43 ± 0.150.71 ± 0.00 d
R410.11 ± 0.01 d9.21 ± 1.4483.31 ± 1.100.00 ± 0.001.37 ± 0.060.83 ± 0.00 e
R510.08 ± 0.01 c8.16 ± 0.8784.33 ± 0.650.00 ± 0.000.95 ± 0.080.96 ± 0.00 f
S09.58 ± 0.01 x6.44 ± 0.6785.98 ± 0.51 x0.00 ± 0.001.61 ± 0.154.66 ± 0.04 x
S19.85 ± 0.00 y8.28 ± 1.1184.35 ± 0.840.00 ± 0.001.29 ± 0.044.46 ± 0.04 y
S210.06 ± 0.01 z9.32 ± 0.1783.32 ± 0.14 y0.00 ± 0.001.30 ± 0.134.86 ± 0.02 z
S310.07 ± 0.01 z7.87 ± 0.8284.67 ± 0.620.00 ± 0.001.37 ± 0.00 x2.91 ± 0.00 u
S49.48 ± 0.00 y6.26 ± 1.4586.31 ± 1.090.00 ± 0.001.58 ± 0.085.73 ± 0.01 v
S59.59 ± 0.01 x6.83 ± 1.3285.77 ± 0.990.00 ± 0.000.62 ± 0.02 y6.61 ± 0.02 w
P010.14 ± 0.01 op3.73 ± 0.1888.53 ± 0.140.00 ± 0.00 o1.41 ± 0.01 o0.58 ± 0.00 o
P110.16 ± 0.01 p3.88 ± 0.1388.35 ± 0.110.01 ± 0.011.01 ± 0.170.45 ± 0.00 p
P210.07 ± 0.00 opq3.90 ± 0.0688.25 ± 0.140.00 ± 0.00 o2.20 ± 0.060.52 ± 0.01 o
P310.13 ± 0.01 op3.88 ± 0.2588.25 ± 0.230.00 ± 0.00 o1.85 ± 0.140.78 ± 0.00 q
P410.00 ± 0.00 oq3.74 ± 0.2988.22 ± 0.250.03 ± 0.01 p2.15 ± 0.02 p0.81 ± 0.00 r
P59.97 ± 0.01 q3.57 ± 0.1788.71 ± 0.130.00 ± 0.00 o1.38 ± 0.100.94 ± 0.00 s
Different lowercase letters indicate statistically significant differences (p < 0.05) between rows: (a, b, c, d, e, f) for rapeseed oil-made samples, (x, y, z, u, v, w) for sunflower oil-made samples and (o, p, q, r, s) for palm oil-made samples. The results are presented as the mean values ± standard deviation.
Table 3. Results for foaming capacity, foam stability, hardness and stickiness for produced soap samples.
ParameterFoaming Capacity (%)Foam Stability (%)Hardness (g)Stickiness (g)
R0320 ± 3553 ± 7 a2320 ± 130 a−622 ± 116 a
R1285 ± 1865 ± 32424 ± 257 a−430 ± 34 bc
R2340 ± 6971 ± 31654 ± 235 b−318 ± 59 b
R3350 ± 6667 ± 31256 ± 183 c−326 ± 65 b
R4262 ± 3571 ± 81414 ± 128 bc−405 ± 38 bc
R5283 ± 1374 ± 1 b1521 ± 185 bc−457 ± 31 c
S0325 ± 7554 ± 8 x786 ± 51 x−411 ± 92 xz
S1293 ± 3210 ± 2 y856 ± 133 x−299 ± 31 x
S2408 ± 24 x23 ± 2 yz457 ± 23 y−148 ± 34 y
S3318 ± 5152 ± 10 x804 ± 105 x−153 ± 69 y
S4303 ± 2533 ± 4 zw1352 ± 155 z−442 ± 20 z
S5250 ± 13 y50 ± 6 xw1272 ± 118 z−471 ± 45 z
P0215 ± 4172 ± 0 o4990 ± 402 o−794 ± 101 o
P1123 ± 861 ± 2 p3866 ± 276 p−346 ± 85 pq
P2175 ± 4868 ± 63243 ± 363 pq−287 ± 96 q
P3182 ± 5171 ± 13023 ± 296 q−427 ± 127 qr
P4235 ± 8778 ± 83037 ± 370 q−568 ± 75 r
P5205 ± 6173 ± 23319 ± 348 pq−496 ± 146 pr
Different lowercase letters indicate statistically significant differences (p < 0.05) between rows: (a, b, c) for rapeseed oil-made samples, (x, y, z, w) for sunflower oil-made samples and (o, p, q, r) for palm oil-made samples. The results are presented as the mean values ± standard deviation.
Table 4. Results for antimicrobial activity of soap samples.
Soap
Concentration
Sample NameInhibition of
E. coli (%)
Inhibition of MRSA (%)Inhibition of
C. albicans (%)
pH of Soap
Solution
0%R010010010010.0
R510010010010.2
5%R010010010010.1
R510010010010.2
2.50%R08010010010.1
R56510010010.2
1.25%R0791009010.2
R535888910.1
0.63%R075100768.1
R52985848.3
0.31%R05890697.2
R52479676.6
10%S01001001009.9
S51001001009.8
5%S01001001009.9
S51001001009.8
2.50%S010010010010.0
S5631001009.8
1.25%S0491009510.0
S550100909.8
0.63%S041100398.5
S538100538.5
0.31%S014100377.7
S521100298.0
10%P010010010010.5
P510010010010.3
5%P010010010010.5
P58010010010.4
2.50%P07810010010.5
P57110010010.3
1.25%P077925510.0
P563100539.9
0.63%P05483478.3
P54980298.2
0.31%P04636357.8
P54976267.7
Publisher’s Note: MDPI stays neutral with regard to jurisdictional claims in published maps and institutional affiliations.

