Abstract
Continuous manufacturing has received increasing interest because of the advantages of intrinsic safety and enhanced mass transfer in the pharmaceutical industry. However, the difficulty for scale-up has limited the application of continuous manufacturing for a long time. Recently, the tubular flow reactor equipped with the Kenics static mixer appears to be a solution for the continuous process scale-up. Although many influence factors on the mixing performance in the Kenics static mixer have been investigated, little research has been carried out on the aspect ratio. In this study, we used the coefficient of variation as the mixing evaluation index to investigate the effect of the aspect ratio (0.2–2) on the Kenics static mixer’s mixing performance. The results indicate that a low aspect ratio helps obtain a shorter mixing time and mixer length. This study suggests that adjusting the aspect ratio of the Kenics static mixer can be a new strategy for the scale-up of a continuous process in the pharmaceutical industry.
1. Introduction
There has been increasing interest in continuous process in the pharmaceutical industry [1,2,3,4,5]. Compared with the existing batch process, the continuous process has the advantages of improved intermediate stability, intrinsic safety, more effective risk management, and enhanced mass and heat transfer [1,3,4,6,7]. In order to realize the continuous process, many types of flow reactors have been developed. Compared with the microchannel reactor, plate flow reactor, and oscillating flow reactor, a tubular flow reactor equipped with a static mixer has been successfully used in large-scale production because of its simple structure, low cost, and wide operating range [8,9]. However, the lack of understanding of mixing performance in milli-scale (1–10 mm) Kenics static mixers hinders the scale-up of this kind of reactor in the pharmaceutical industry.
The mixing performance in the Kenics static mixer is critical for the design of the continuous process with the Kenics static mixer and has been investigated by many researchers. Sir and Lecjack [10] experimentally investigated the effect of Reynolds number, Schmidt number, the volume flow rate ratio, and the viscosity ratios on the mixing performance in the Kenics static mixers. The aspect ratio of the Kenics static mixers used in the experiment was 2. Although the results were compared with the previous literature, in which the aspect ratio was 1.36, the effect of the aspect ratio on the pressure drop and the mixing performance were not discussed. Hobbs et al. [11,12] investigated the effects of injection location, flow ratio, and geometry on the mixing performance of the Kenics static mixer using computational fluid dynamics. Unfortunately, the aspect ratio of the mixers was not given in this study. Alberini et al. [13] characterized the mixing of shear-thinning fluids in the Kenics static mixer (aspect ratio = 1.5) using Planar Laser Induced Fluorescence. Kumar et al. [14] studied the mixing behavior in the Kenics static mixer (aspect ratio = 1.5) over a wide range of Reynolds numbers (1–25,000). Although many influence factors on the mixing performance have been investigated both experimentally and numerically, the difference of the aspect ratio in the literature above makes it difficult to compare these results systematically for better understanding of the Kenics static mixer’s mixing performance. Hence, the effect of the aspect ratio on the mixing performance of the Kenics static mixer needs to be investigated to fill this gap.
This study set out to investigate the effect of the aspect ratio on the Kenics static mixer’s mixing performance. In this paper, the mixing performance of the Kenics static mixer with an aspect ratio between 0.2 and 2 is evaluated by computational fluid dynamics in the Reynolds number range from 1 to 500, which is a typical regime in the continuous process. The coefficient of variation (CoV), as described in Etchells and Meyer [15], is used as the mixing evaluation index. The effect of the aspect ratio on the number of elements, the mixer length, the mixing time, and the pressure drop of the Kenics static mixers are analyzed in detail. The results provide new insight and guidance for the scale-up of the continuous process in the pharmaceutical industry.
2. Materials and Methods
The Kenics static mixers with different aspect ratio (AR), also called the length to diameter ratio, were shown in Figure 1. The dimensions of the Kenics static mixers in this study can be seen in Table 1. The flow reactor equipped with the Kenics static mixer (AR = 0.2) can be seen in Figure 2. In Figure 2, the inlet length of the flow reactor equipped with the Kenics static mixer was set as 200 mm, and the distance after the Kenics static mixer was set as 100 mm.
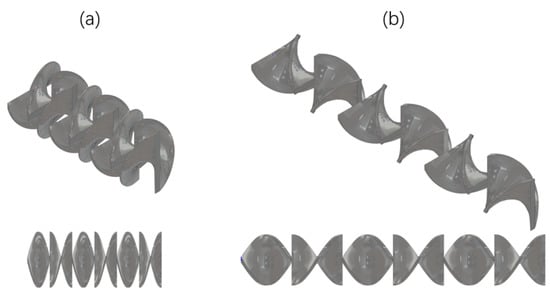
Figure 1.
Schematic of six-element Kenics static mixer with aspect ratio of (a) 0.4; (b) 1.0.

Table 1.
Dimensions of the Kenics static mixers.
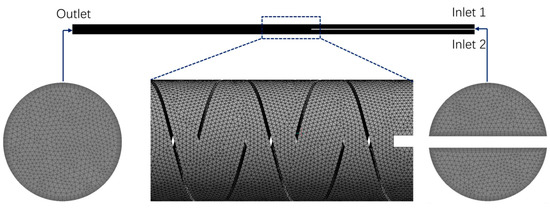
Figure 2.
Schematic diagram of computational domain with meshes.
2.1. Coefficient of Variation
The coefficient of variation, also called the intensity of mixing or degree of segregation, is defined as follows:
where the average concentration of the mixture, , is given by:
where is the local mass fraction of the tracer at the ith mesh cell, is the number of evaluation mesh cells.
The variance of the concentration, σ, is given by:
In a typical industrial mixing process, an additive can be considered well mixed at CoV = 0.05. Hence, in this study, the mixer length, L, was defined as the length of the static mixers required to achieve CoV = 0.05, and the mixing time, tm, used in this study was defined as follows:
where u is the average velocity in the empty pipe.
2.2. Computational Fluid Dynamics
The k−ω SST turbulence model [16,17,18,19], has shown better performance than the k−ε type models in three-dimensional flows with Kenics static mixer [14]. Therefore, the k−ω SST turbulence model was used in this study. The transport equations for the specific turbulence dissipation rate, ω, and the turbulence kinetic energy, k, can be described as follows:
represents the production of turbulence kinetic energy represents the generation of . and represent the effective diffusivity of and , respectively. and represent the dissipation of and , respectively. is the cross-diffusion term.
The fluid used in the simulations has the same properties as water ( = 1000 kg m−3, = 0.001 Pa s). No-slip boundary conditions were applied to the surface of the static mixer and the wall of the pipe. Different open pipe Reynolds number (Re = ) for the flow inside the pipe was obtained by varying the flow rate at the inlet. The velocity profile for fully developed flow in a pipe was used at the inlet. The transport of a tracer chemical species was calculated to evaluate the Kenics static mixers’ mixing performance. The tracer species’ binary diffusion coefficient in the main fluid was set as 1.5 × 10⁻⁹ m2/s, which is a typical value for small molecule in water (1–1.5 × 10⁻⁹ m2/s). The inlet 1 had a tracer concentration of 1, and inlet 2 had a tracer concentration of 0. The tracer fluid had the same viscosity and density as the main fluid. The governing equations were solved using the open-source CFD code OpenFOAM®. The convergence criterion was set to a scaled residual less than 10−5 for all equations.
In the case of AR = 0.2 and Re = 500, four kinds of computational meshes were used for grid sensitivity analysis, and their element sizes were 0.10 mm, 0.08 mm, 0.05 mm, and 0.03 mm, respectively. As shown in Figure 3, the pressure drops across the static mixers by the meshes with element size from 0.08 mm to 0.03 mm were basically the same, while the pressure drop by the meshes with element size of 0.10 mm was slightly different. By changing the grid size from 0.08 to 0.05 mm, the pressure drop changes by less than 0.3%. Therefore, the meshes with element size of 0.08 mm were used in this study.
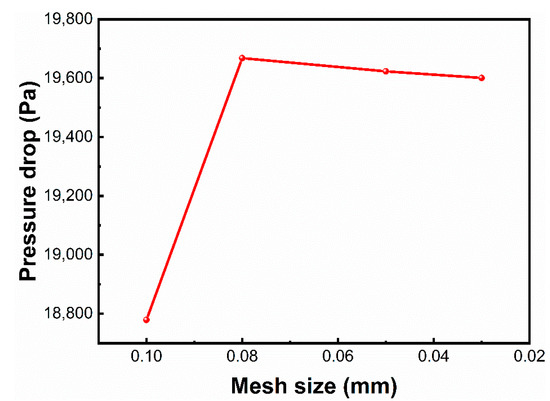
Figure 3.
Pressure drop across the static mixers obtained using four different mesh sizes for grid sensitivity analysis.
In the case of AR = 0.2, the computational meshes were shown in Figure 2. Since the geometric model was complex, all grids in the calculation domain were unstructured tetrahedral mesh. To avoid an excessive y+ value, the thickness of the first layer of the boundary layer on the no-slip walls was 0.03 mm, the growth factor was 1.2 and the total number of layers was 5. The number of meshes in this case was about 48 million.
3. Results and Discussion
3.1. Effect of Aspect Ratio on CoV
The mixing uniformity with the change of the number of elements is evaluated by CoV. Figure 1 shows the effect of aspect ratio on CoV with different number of elements in the range 1< Re < 500. As can be seen in Figure 4a–c, in the range 1< Re < 25, the aspect ratio has a significant influence on the mixing uniformity. This can be explained that at low Re, the difference in the fluid’s residence time between the static mixers of different aspect ratio is more significant. The residence time of the fluids across the same number of elements of the static mixers with a larger aspect ratio is longer, contributing to the mixing uniformity.
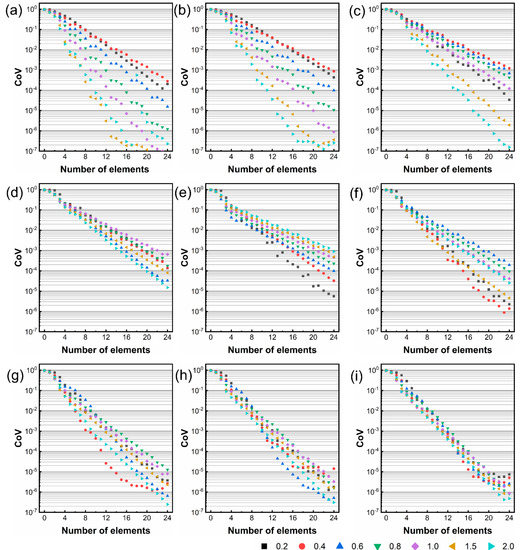
Figure 4.
Effect of aspect ratio on CoV with different number of elements at (a) Re = 1; (b) Re = 5; (c) Re = 25; (d) Re = 50; (e) Re = 100; (f) Re = 200; (g) Re = 300; (h) Re = 400; (i) Re = 500.
With the increase of Re, the difference of mixing uniformity of the static mixers with different aspect ratio becomes smaller after passing through the same number of elements of the mixers, and the mixing uniformity in the mixers with different aspect ratio shows a similar trend after passing through three to four elements, see Figure 4d–i. Furthermore, in the whole range of Re, the mixing uniformity through the first element is independent of the aspect ratio, which indicates that the effect of the aspect ratio on the mixing uniformity in the first element is identical.
The number of elements needed to achieve the same mixing degree differs for the static mixers with different aspect ratios at low Re. At Re = 1 and CoV = 0.05, the number of elements needed for the static mixer with AR = 0.4 is 12, while the number of elements for the static mixer with AR = 2 is 4, see Figure 4a. With the increase of Re, the number of elements decreases gradually. When Re > 400, the difference of the number of elements needed for the static mixers with different aspect ratios is usually less than 2, see Figure 4h-i. This indicates that the aspect ratio has a significant effect on the number of elements at low Re but has little effect on the number of elements at Re above 400.
Figure 5 shows the effect of aspect ratio on CoV in axial position at different Re. The mixing uniformity at the same position increases with the increase of Re. This indicates that the increase of Re is beneficial to all the static mixers with different aspect ratios. The distance required to achieve CoV = 0.05 first increases and then decreases with the increase of Re. With the increase of Re, the mixing uniformity increases faster with the increase of distance. At Re above 200, the change rate tends to be constant.
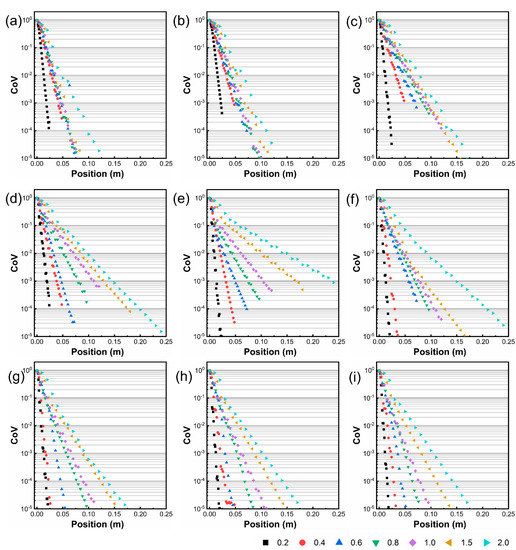
Figure 5.
Effect of aspect ratio on CoV in axial position at (a) Re = 1; (b) Re = 5; (c) Re = 25; (d) Re = 50; (e) Re = 100; (f) Re = 200; (g) Re = 300; (h) Re = 400; (i) Re = 500.
The effect of the aspect ratio on the flow field in the Kenics static mixers at different Re can be seen in Figure 6, Figure 7 and Figure 8. In general, the velocity gradient decreases with the increase of the AR and Re. And the concentration profile can be seen in Figure 9, Figure 10 and Figure 11. The mixing uniformity is better in the mixer with larger AR after the same number of elements.
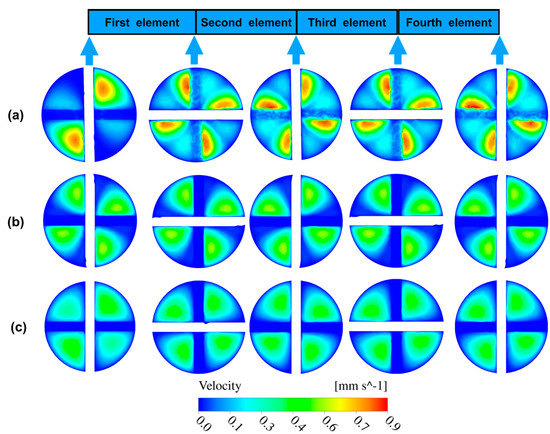
Figure 6.
Effect of aspect ratio on cross sectional profiles of velocity at Re = 1: (a) AR = 0.4; (b) AR = 0.8; (c) AR = 1.5.
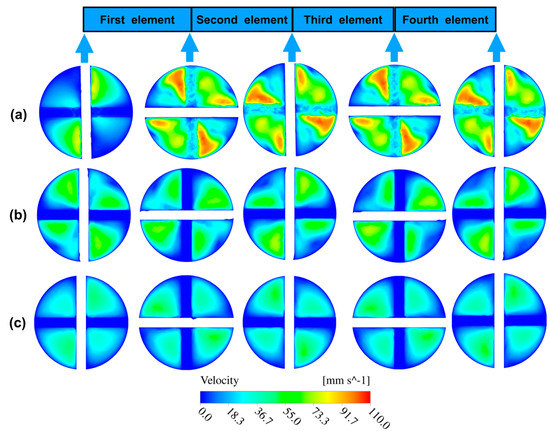
Figure 7.
Effect of aspect ratio on cross sectional profiles of velocity at Re = 100: (a) AR = 0.4; (b) AR = 0.8; (c) AR = 1.5.
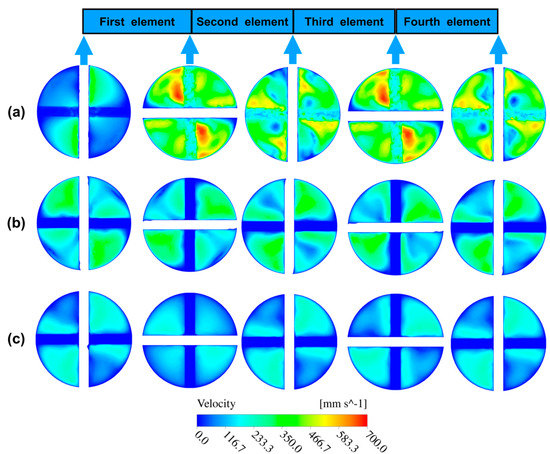
Figure 8.
Effect of aspect ratio on cross sectional profiles of velocity at Re = 500: (a) AR = 0.4; (b) AR = 0.8; (c) AR = 1.5.
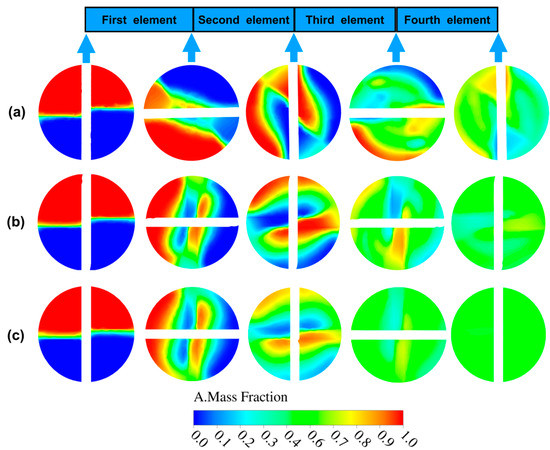
Figure 9.
Effect of aspect ratio on cross sectional profiles of concentration at Re = 1: (a) AR = 0.4 (b) AR = 0.8 (c) AR = 1.5.
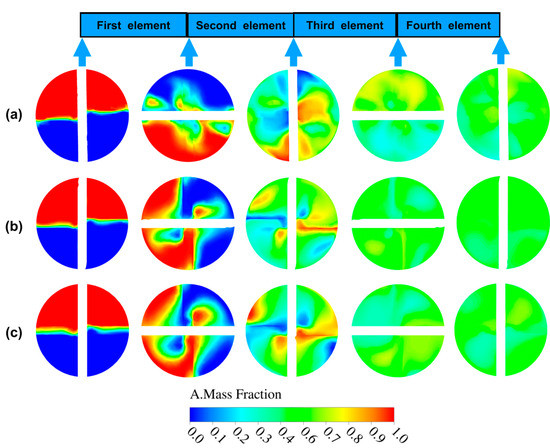
Figure 10.
Effect of aspect ratio on cross sectional profiles of concentration at Re = 100: (a) AR = 0.4; (b) AR = 0.8; (c) AR = 1.5.
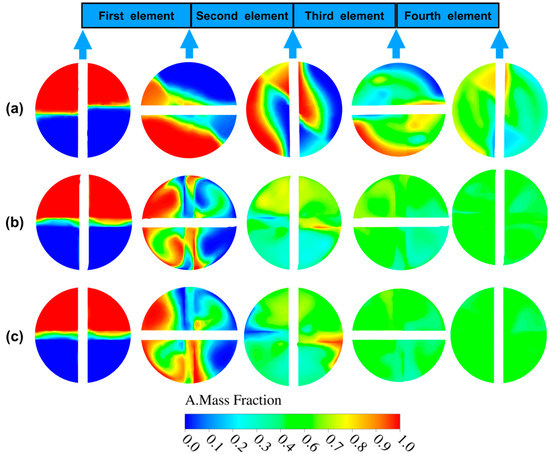
Figure 11.
Effect of aspect ratio on cross sectional profiles of concentration at Re = 500: (a) AR = 0.4; (b) AR = 0.8; (c) AR = 1.5.
3.2. Effect of Aspect Ratio on Number of Elements
The number of elements needed for homogenization increases with the Re, as shown in Figure 12. At Re above 200, the number of elements is constant and independent of the Re. At a low Re, the number of elements needed for uniform mixing differs for different aspect ratios. The difference in the number of elements becomes small with the increase of the Re. When Re is low, the static mixer with a low aspect ratio needs enough mixing time to achieve uniform mixing. Hence, more elements are needed. With the increase of Reynolds number, the static mixer with a small aspect ratio can improve the shear rate more significantly, so it needs shorter time to achieve uniform mixing.
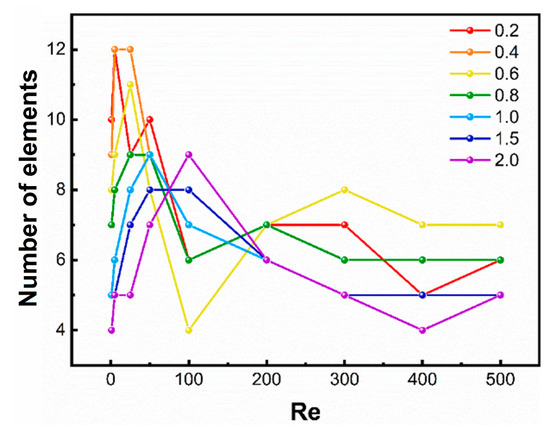
Figure 12.
Effect of aspect ratio on number of elements at different Re.
3.3. Effect of Aspect Ratio on Mixer Length
The mixer length needed for homogenization increases with the Re first, then reduces to a constant value, as shown in Figure 13. The critical Re at which the maximum mixer length can be obtained differs for different aspect ratios. The critical Re is small with a low aspect ratio. Under the same Re, the mixer length in the static mixers with different aspect ratios is different. Usually, the larger the aspect ratio, the longer the mixer length. The results show that the low aspect ratio helps achieve uniform mixing at low Re with shorter mixer length. When Re is 100, the difference of the mixer length for the static mixers with different aspect ratios reaches the maximum. The mixer length of the static mixer with an aspect ratio of 2 is about fifteen times that of the mixer with an aspect ratio of 0.2.
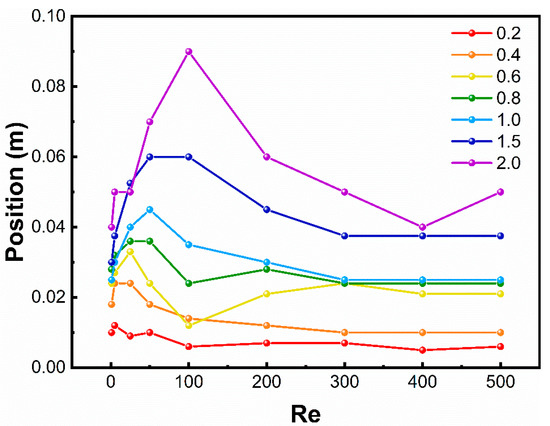
Figure 13.
Effect of aspect ratio on mixer length at different Re.
3.4. Effect of Aspect Ratio on Mixing Time
For the static mixers with different aspect ratios, the mixing time needed to achieve uniform mixing decreases with the increase of Re, as can be seen in Figure 14. The mixing time becomes shorter with the decrease of the aspect ratio at the same Re. Static mixers with 0.2 < AR < 0.4 have significantly shorter mixing time in the whole Re range than the static mixers with a larger aspect ratio. In the range 50 < Re < 200, the mixing time of the static mixers with 0.4 < AR < 1 is quite different, while in the range Re < 50 and Re > 200, the mixing time of static mixers with 0.4 < AR < 1 is similar. This result shows that low AR helps obtain a shorter mixing time at a low Re, which helps intensify the mixing process. When Re = 100, the difference of the mixing time in the static mixers with different aspect ratios is the biggest, and the mixing time of the static mixer with AR = 2 is about twenty times that of the static mixer with AR = 0.2.
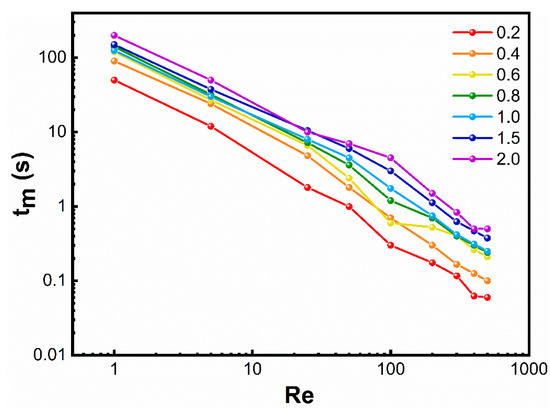
Figure 14.
Effect of aspect ratio on mixing time at different Re.
3.5. Effect of Aspect Ratio on Pressure Drop
Figure 15 compared the pressure drop through the Kenics static mixers with different aspect ratios at different Re. The pressure drop with the increase of Re shows a similar trend with different aspect ratios. The aspect ratio has a similar effect on the pressure drop in the whole range of Re. The pressure drop with an aspect ratio of 0.2 is significant.
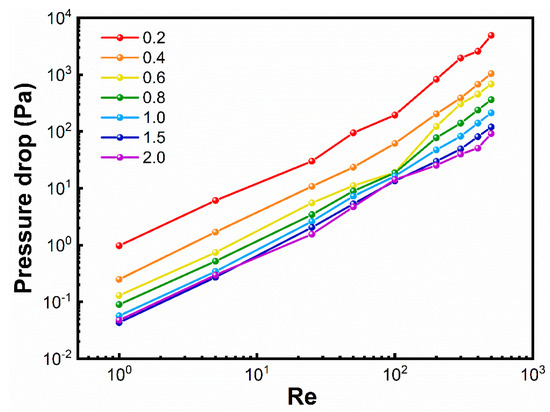
Figure 15.
Effect of aspect ratio on pressure drop through the Kenics static mixers at different Re.
Although the degree of uniform mixing obtained by the static mixers with different aspect ratios can be the same, the pressure drop produced by static mixers with a large aspect ratio is lower. The static mixer with a small aspect ratio is preferred for scenarios where mixing time or mixer length is constrained at a specific Re. Static mixers with a large aspect ratio are more economical for applications where mixing time or mixer length is not critical at a specific Re.
4. Conclusions
This research shows that the aspect ratio has a significant effect on the mixing performance of the Kenics static mixer. A low aspect ratio helps obtain a shorter mixing time at low Re. From the CoV, mixing time, mixer length, and pressure drop versus different Re obtained in this study, it is possible to choose the adequate aspect ratio during the design of a tubular flow reactor equipped with the Kenics static mixer. The number of elements of the static mixers needed to achieve a specified degree of mixing can also be estimated based on this study’s results. Furthermore, because the mixing performance at different flow rates can be adjusted by changing the aspect ratio, the scale-up of the continuous process can be obtained by this strategy. Finally, because the conclusions in this study were limited to the CFD results, we will investigate the effect of the aspect ratio on the mixing performance using Villermaux–Dushman reaction in the future.
Author Contributions
Conceptualization, X.J.; methodology, X.J.; software, X.J.; validation, N.Y.; formal analysis, X.J.; writing—original draft preparation, X.J.; writing—review and editing, N.Y.; supervision, R.W.; project administration, R.W. All authors have read and agreed to the published version of the manuscript.
Funding
This research received no external funding.
Institutional Review Board Statement
Not applicable.
Informed Consent Statement
Not applicable.
Data Availability Statement
The data is contained within the article.
Acknowledgments
We acknowledge Jiangsu Seven Continents Green Chemical Co., Ltd. for their financial support.
Conflicts of Interest
The authors declare no conflict of interest.
References
- Roberge, D.M.; Zimmermann, B.; Rainone, F.; Gottsponer, M.; Eyholzer, M.; Kockmann, N. Microreactor Technology and Continuous Processes in the Fine Chemical and Pharmaceutical Industry: Is the Revolution Underway? Org. Process Res. Dev. 2008, 12, 905–910. [Google Scholar] [CrossRef]
- Poechlauer, P.; Braune, S.; Dielemans, B.; Kaptein, B.; Obermueller, R.; Thathagar, M. On-site-on demand production of hazardous chemicals by continuous flow processes. Chim. Oggi-Chem. Today 2012, 30, 51–54. [Google Scholar]
- Gutmann, B.; Cantillo, D.; Kappe, C.O. Continuous-Flow Technology—A Tool for the Safe Manufacturing of Active Pharmaceutical Ingredients. Angew. Chem. Int. Ed. 2015, 54, 6688–6728. [Google Scholar] [CrossRef]
- Plumb, K. Continuous Processing in the Pharmaceutical Industry: Changing the Mind Set. Chem. Eng. Res. Des. 2005, 83, 730–738. [Google Scholar] [CrossRef]
- Sagandira, C.R.; Siyawamwaya, M.; Watts, P. 3D printing and continuous flow chemistry technology to advance pharmaceutical manufacturing in developing countries. Arab. J. Chem. 2020, 13, 7886–7908. [Google Scholar] [CrossRef]
- Plutschack, M.B.; Pieber, B.; Gilmore, K.; Seeberger, P.H. The Hitchhiker’s Guide to Flow Chemistry. Chem. Rev. 2017, 117, 11796–11893. [Google Scholar] [CrossRef]
- Schaber, S.D.; Gerogiorgis, D.I.; Ramachandran, R.; Evans, J.M.B.; Barton, P.I.; Trout, B.L. Economic Analysis of Integrated Continuous and Batch Pharmaceutical Manufacturing: A Case Study. Ind. Eng. Chem. Res. 2011, 50, 10083–10092. [Google Scholar] [CrossRef]
- Taylor, R.A.; Penney, W.R.; Vo, H.X. Scale-up Methods for Fast Competitive Chemical Reactions in Pipeline Mixers. Ind. Eng. Chem. Res. 2005, 44, 6095–6102. [Google Scholar] [CrossRef]
- Levesque, F.; Bogus, N.J.; Spencer, G.; Grigorov, P.; McMullen, J.P.; Thaisrivongs, D.A.; Davies, I.W.; Naber, J.R. Advancing Flow Chemistry Portability: A Simplified Approach to Scaling Up Flow Chemistry. Org. Process Res. Dev. 2018, 22, 1015–1021. [Google Scholar] [CrossRef]
- Ir, J.I.I.; Lecjaks, Z. Pressure drop and homogenization efficiency of a motionless mixer. Chem. Eng. Commun. 1982, 16, 325–334. [Google Scholar] [CrossRef]
- Hobbs, D.M. Characterization of a Kenics Static Mixer under Laminar Flow Conditions. Ph.D. Thesis, The State University of NewJersey, New Brunswick, NJ, USA, 1997. [Google Scholar]
- Hobbs, D.M.; Muzzio, F.J. Effects of injection location, flow ratio and geometry on kenics mixer performance. Aiche J. 1997, 43, 3121–3132. [Google Scholar] [CrossRef]
- Alberini, F.; Simmons, M.J.H.; Ingram, A.; Stitt, E.H. Assessment of different methods of analysis to characterise the mixing of shear-thinning fluids in a Kenics KM static mixer using PLIF. Chem. Eng. Sci. 2014, 112, 152–169. [Google Scholar] [CrossRef]
- Kumar, V.; Shirke, V.; Nigam, K.D.P. Performance of Kenics static mixer over a wide range of Reynolds number. Chem. Eng. J. 2008, 139, 284–295. [Google Scholar] [CrossRef]
- Etchells Iii, A.W.; Meyer, C.F. Mixing in Pipelines. In Handbook of Industrial Mixing; Wiley: Hoboken, NJ, USA, 2003; pp. 391–477. [Google Scholar] [CrossRef]
- Wilcox, D.C. Turbulence Modeling for CFD; DCW Industries: La CaÒada, CA, USA, 2010. [Google Scholar]
- Wilcox, D.C. Formulation of the k-w Turbulence Model Revisited. AIAA J. 2008, 46, 2823–2838. [Google Scholar] [CrossRef]
- Wilcox, D.C. Simulation of Transition with a Two-Equation Turbulence Model. AIAA J. 1994, 32, 247–255. [Google Scholar] [CrossRef]
- Menter, F.R. Two-equation eddy-viscosity turbulence models for engineering applications. Aiaa J. 1994, 32, 1598–1605. [Google Scholar] [CrossRef]
Publisher’s Note: MDPI stays neutral with regard to jurisdictional claims in published maps and institutional affiliations. |
© 2021 by the authors. Licensee MDPI, Basel, Switzerland. This article is an open access article distributed under the terms and conditions of the Creative Commons Attribution (CC BY) license (http://creativecommons.org/licenses/by/4.0/).