Abstract
A new optical chemical sensor was fabricated based on incorporation of 2,2-furildioxime as a sensitive reagent into the nanopore of a transparent glasslike material through the sol-gel method which was suitable for determination of Ni2+ ions in aqueous solutions. The prepared sensors were composed of tetraethoxysilane (TEOS), 2,2-furildioxime, methanol, hydrochloric acid and Triton X-100. The sensors were constructed by dip coating onto glass substrates. The optimum response of the sensor toward Ni2+ ions was reached at pH 8.5 and the contact time for the formation of the complex at 10 min. The linear concentration of the calibration curve was in the range of 1–5 mg L−1 with a detection limit of 0.111 mg L−1, and quantification limit of 0.337 mg L−1. In addition, the relative standard deviation (RSD) was less than 5% in determination of Ni2+ with ten slide sensor membranes. The developed sensor was tested on Ni2+ determination in real water samples which was confirmed by the atomic absorption spectrophotometer method.
1. Introduction
Nowadays, optical sensors serve as analytical measurement devices in various analyses, especially heavy metal ion detection [1,2]. They have advantages such as reducing waste, low cost preparation, ease of use and in situ analysis. Some materials have been used for the optical sensor’s matrix such as polyvinyl chloride (PVC) [3], agarose [4], polyvinyl acetate (PVA) [5,6], chitosan, ethyl cellulose [7], and polysaccharide [8]. In addition, sol-gel matrix was used as polymer the matrix to immobilize the reagent for metal ion determination [9]. Sol-gel matrices are more interesting for research due to their high stability, transparency in the visible region of electromagnetic waves, and simple synthesis at room temperature [10]. In this work, TEOS (tetraethylorthosilicate) is synthesized by a hydrolyzing process in acid catalyst and condensation to form a silica network [11]. Rate of hydrolysis and condensation affected the pore size, rigidity and surface of the sol-gel film. The structure and properties of sol-gel depend on pH, temperature, ratio of H2O:Si, and catalyst. In strong base conditions, the process of aggregation and gelation will be longer due to deprotonation and increase of surface charge. In strong acidic conditions, the polycondensation of organic polymers cause a low surface area of material and thus the efficiency of the optical sensor is decreased [12]. The porosity of surface areas is high with a high ratio of H2O:Si. In a low ratio of H2O:Si, the hydrolyzing process of alkyl groups is slow [13,14].
Environmental pollution by heavy metal is of serious concern to many researchers. Nickel is a nutrient in trace element concentration in the human body, animal species and plants, but, in high concentration, nickel will be carcinogenic and toxic. The decomposition of rocks and soils in mining areas are one the most significant sources of nickel ion pollution. The maximum concentration of nickel in this area is 0.5 mg L−1 [15]. On the other hand, nickel and nickel compounds are used for electroplating, alloys, mobile phones, medical equipment, laboratory tools and household appliances [16]. Indonesia is estimated to have more than 800 million tons of nickel reserves located in vast areas of its Sulawesi, Maluku, North Maluku, Kalimantan, and Papua islands [17].
Determination of nickel is conducted by several conventional methods such as electrochemical, flame atomic absorption spectrometry (AAS), and inductively coupled plasma-mass spectrometry (ICP-MS) [18]. Analysis of nickel using these methods needs laborious pretreatment of samples, experienced staff, toxic solvent, high cost treatment and far from green chemistry. Simple, cheaper and easier methods in nickel determination are required not only for environmental assessment, but also for small and medium-size nickel industries in their preliminary tests before the production. This research proposes a simple method for nickel detection without highly skilled staff. Nickel ion is detected by changing the sensor color from transparent to yellow. In this work, 2,2 furildioxime (FDO) was used as a colorimetric reagent for the determination of Ni2+ in metal alloys (see Figure 1 for its chemical structure; chemical formula C10H8N2O4) with a molecular weight of 220.18 g mol−1. It is insoluble in water, but dissolves in organic solvents. In addition, FDO is also used as a stain test reagent and a complexing agent in gravimetric determination of Ni2+. 2,2 furildioxime reagent with Ni2+ metal ions will form a yellow Ni2+-FDO complex and their absorbance can be measured by spectrophotometry [19]. 2,2-furildioxime or α-furildioxime as a ligand was immobilized into a sol-gel matrix for the detection of Ni2+ ions with good accuracy and precision since Ni2+ made complex structures with 2,2-furildioxime [20]. Thin films were synthesized by the sol-gel method and the optical sensor was prepared by dip coating with the obtained gel on a glass substrate.
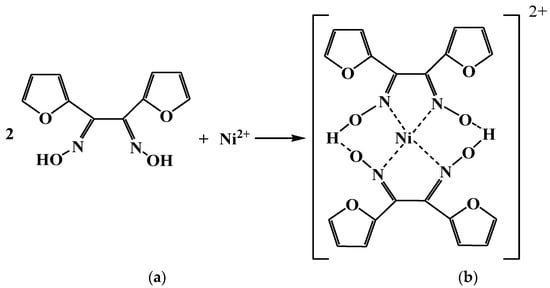
Figure 1.
Chemical structures of (a) 2,2 furildioxime (FDO), (b) Ni2+-FDO complex.
2. Materials and Methods
2.1. Materials
All chemical used were of analytical grade, i.e., tetraethoxysilane (TEOS), absolute methanol (MeOH), absolute ethanol (EtOH), Triton X-100, HCl, Ni(NO3)2, Zn(NO3)2, Fe(NO3)3, Cu(NO3)2, Pb(NO3)2, Cd(NO3)2, Co(NO3)2 and were purchased from Merck (Darmstadt, Germany), a reagent α-furildioxime (FDO) (Tokyo Chemical Industry, Tokyo, Japan), HEPES buffer (Dojindo, Kumamoto, Japan). Glass slides were cut out into 3.75 × 0.8 cm2. Water samples were obtained from the North Konawe region, Southeast Sulawesi-Indonesia.
2.2. Preparation of Sol-Gel Matrix
The sol-gel matrix was prepared by mixing all chemical compounds, as described by [12]. Briefly, 2 mL of TEOS and 2 mL of methanol, 645 μL of H2O, Triton X-100 (10 drops), 1 mL of FDO dissolved in ethanol (100 mg/L) and 0.5 mL drop by drop of HCl (0.3 M) were mixed and sonicated for 35 min to obtain a homogeneous solution. The obtained solution remained in a glass vial for 24 h in the absence of light at room temperature to achieve a more viscous solution. The glass slides (3.75 × 0.8 cm2) were treated with concentrated HNO3 for 2 h. Then they were sonicated in ethanol solution for 30 min and then washed with ethanol and distilled water, followed by drying at 100 °C for 10 min. The glass slides were coated by dip coating and aged at room temperature to enable them to form a smooth and even membrane.
For the study of precision, different sensors were immersed in 1 mg L−1 of Ni2+ ion solution at optimum condition and the absorbance of each sensor was measured at 449 nm.
2.3. Analytical Procedure
Five milliliters of Ni2+ standard and 1 mL of buffer solution were added. Then, the film sensors were immersed to this solution. After the immersion, film sensors were taken out and inserted into the cuvette vertically and further distilled water was added. The absorbances were measured by spectrophotometer in the wavelength range of 400–600 nm, then the optimum wavelength was determined (which is 449 nm) for further sample analysis.
3. Results and Discussion
3.1. Characterization of Sensor
The functional group of TEOS precursor and sensors were recorded using a Fourier transform infrared (FT-IR) spectrophotometer (Prestige-21 Shimadzu, Kyoto, Japan). The immobilization of FDO in the sol-gel matrix can be determined by comparing IR spectra of TEOS and film sol-gel before and after detection of nickel (Figure 2). Based on the TEOS-FDO spectrum (Figure 2c), the additional peak at 1635 cm−1 could be attributed to the C=N stretching from the FDO reagent. It showed the reagent of FDO was successfully trapped in sol-gel. The precursor of TEOS was hydrolyzed to form the Si–OH group, as shown at band 3425 cm−1 and shifted to 3464 cm−1 (Figure 2c,d). It is suggested that there was vibration of N–O–H in the formation of the Ni-FDO complex.
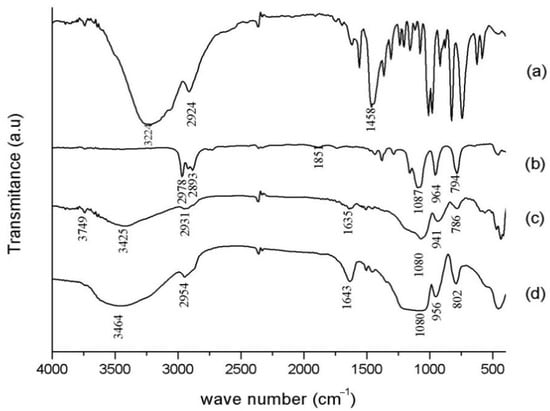
Figure 2.
FTIR spectra of (a) 2,2 furildioxime (FDO), (b) tetraethoxysilane (TEOS), (c) TEOS-FDO and (d) TEOS-FDO-Ni2+.
Characterization was also carried out using a scanning electron microscope/SEM (JEOL Ltd., Tokyo, Japan). The sol-gel film sensor with TEOS precursor has a clear, hard shape and, before grinding, it looks more like a glass layer. SEM images of the film before and after being used for Ni2+ detection are shown in Figure 3. SEM images provide information about the three-dimensional appearance of the film sensor. The shape of the two films showed a heterogeneous and nonuniform size.
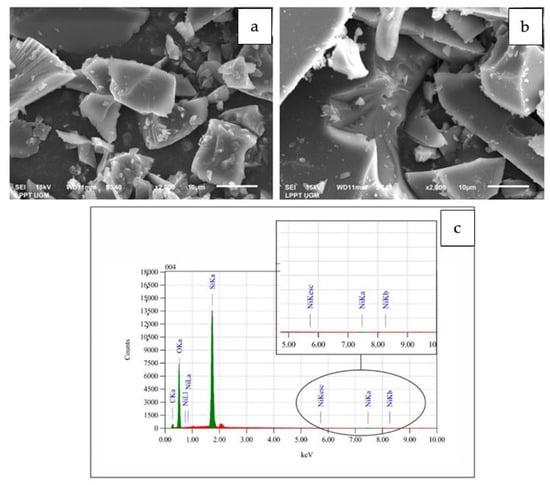
Figure 3.
SEM-EDS images of sensor film (A) before, (B) after Ni2+ detection and (C) sensor’s EDS data of Ni2+ detection.
Table 1 shows that there are several main components of the sol-gel film. The most constituent component is the element O followed by Si. This is consistent with the sol-gel film-forming precursor, which is TEOS. While the Ni element is a representation of the Ni2+ ions trapped in the silica gel matrix. It can be seen that 0.10% of the element Ni is absorbed into the film. These data explain that the sensor is able to detect the presence of Ni by absorbing Ni2+ ions into the pore of the silica gel matrix.

Table 1.
Elemental composition data of sensor film.
3.2. Effect of pH and Contact Time
The pH value is very important because it significantly affect to the performance of optical sensor. The pH of Ni2+ solutions was tested in HEPES/4-(2-hydroxyethyl)-1-piperazineethanesulfonic acid buffer 0.1 M in range of 3 to 11. The pH of the buffer solution was adapted by either HCl or NaOH. As shown in Figure 4, the maximum response of the sensor was observed at a pH of 8.5. In a pH less than 8.5, the absorbance was reduced because of H+ entering from the aqueous solution into the thin film. In a pH greater than 8.5, Ni2+ ions are in a hydroxide complex and thus the absorbance decreases. Thus, a pH of 8.5 was used for further studies.
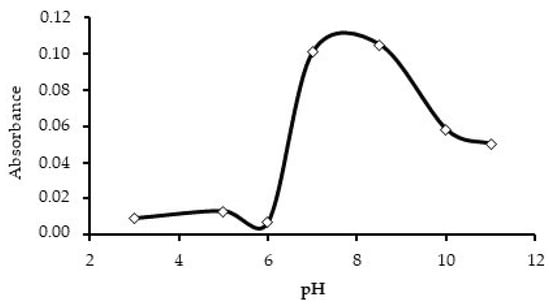
Figure 4.
Effect of different pH levels on the sensor absorbance’s response for solution containing 2 mg L−1 Ni2+ in fixed time (10 min).
The important analytical parameter of the sensor is its response time. It is determined by the thickness and composition of membrane. The absorbance responses of the sensor against time in different concentrations of Ni (2 and 5 mg L−1) were recorded at 449 nm. Figure 5 shows the response time of the sensor obtained was about 10 min because the optimum results were obtained, then absorbance values for two concentrations were decreased and constant after 10 min. The decreasing of absorbances (especially in case of 2 mg/L of Ni2+) possibly due to the instability of complex formation.
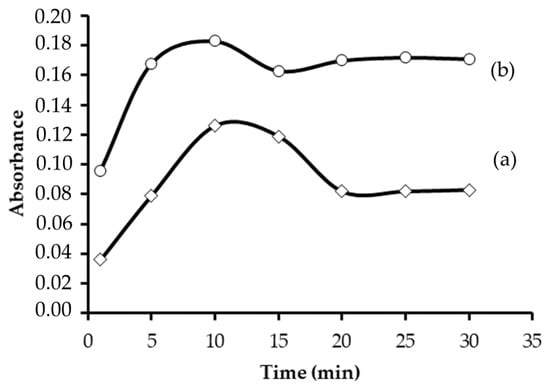
Figure 5.
Absorbance’s response of the sensor at 449 nm in the presence of Ni2+ (a) 2 mg L−1 and (b) 5 mg L−1.
3.3. Calibration Curve of the Sensor
The dynamic range of absorbance Ni-FDO was studied at a concentration range between 1–5 mg L−1 (Figure 6). The absorbance of the sensor was measured by using spectrophotometer UV-Vis at 449 nm in pH optimum condition. The calibration curve was obtained based on the absorbance of the sensor at 449 nm versus the concentration of Ni2+ ions. The linear range was found to be 1.0 to 5.0 mg L−1 with a correlation equation of Y = 0.0477x + 0.0062 and R2 = 0.9963, as shown in Figure 2. The detection limit (LOD) was found to be 0.111 mg L−1 and limit quantification 0.337 mg L−1 according to nine times the standard deviation of the signal blank [21]. The detection limit was lower than the results of previous studies, such as the immobilization of 2-aminocyclopent-1-ene-1-carbodithioic acid (ACDA) as a colorimetric chemo sensor (chads) for determination of Ni2+, which produced 1 mg L−1 of LOD [22].
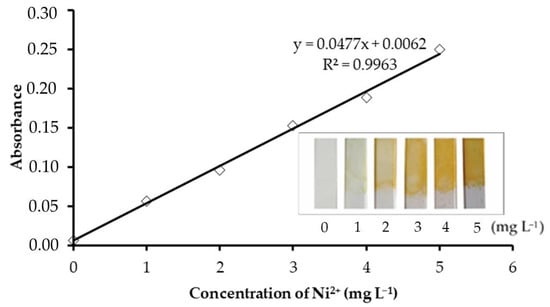
Figure 6.
Calibration curve for nickel determination at pH 8.5.
3.4. Selectivity
The influence of some ions on the determination of Ni was studied. The interference ion solution was added to Ni solution in a concentration ratio of 1:1 and the absorbance of sensor was examined at λ 449 and pH 8.5. Selectivity is the ability of the sensor to respond to the primary ion without any interference from other ions. To investigate the sensor selectivity, the absorbance of the sensor was measured in 3 mg L−1 Ni2+ solution in the absence (ΔAo) and presence (ΔA) of some potentially interfering ions, such as Cu2+, Fe3+, Zn2+, Pb2+, Cd2+ and Co2+ at concentration ratio 1:1 in the maximum condition (see Figure 7). The relative error was considered as RE(%) = [(ΔA − ΔAo)/ΔAo] × 100% [22]. The effect of the interference ions is summarized in Figure 6. The obtained data clearly shows that the relative errors are less than 5% for interference from Pb2+, Fe, Cd2+ and Zn2+ ions. However, the presence of Cu2+ and Co2+ increased the absorbance of the sensor at 10.6 and 20.5%, respectively. Copper and cobalt are reacted with furildioxime and interfering the nickel analysis at 400–550 nm [23,24].
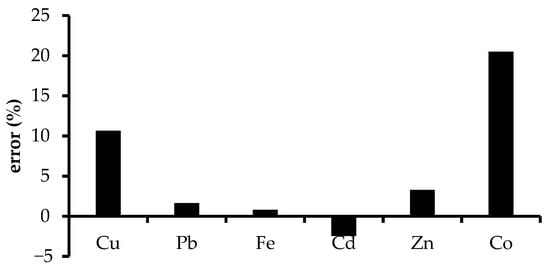
Figure 7.
Effect of interference ions on the sensor response with ratio concentration of Ni2+ and interference ions of 1:1.
3.5. Precision and Accuracy
Precision was one important parameter indicating replication analysis method that was represented by relative standard deviation (RSD). Precision was calculated based on the formula:
where X is the value of each measurement,
represents the mean of all measurements, n symbolizes the number of measurements, and SD stands for standard deviation. In this research, the precision of the sensor was found to be 2.65%. The accuracy of the sensor was determined by measuring the sensor immersed in the sample solution with the spiking method. The accuracy of this method was estimated by determining the percentage of analyte recovery that stated as:
where Ca indicates the concentration of analyte in a mixture of sample and standard, Cb represents the concentration analyte in a sample, and Cstd is the concentration of standard solution. The accuracy of sensor was 83–92%.
3.6. Application of Sensor in Seawater Sample
For practical application of the sensor, the obtained seawater (Table 2 samples A and B) (North Konawe, Southeast Sulawesi) was acidified and kept at a temperature of around 5 °C. The sensing process was conducted by the addition of 5 mL of water samples into 1 mL of buffer HEPES 0.1 M solution. The sensors were immersed in the water sample for determination of Ni2+ for 10 min. The absorbance was measured at 449 nm using a UV-Vis spectrophotometer (Thermo Fisher Scientific, Waltham, MA, USA).

Table 2.
Determination of Ni2+ in seawater sample.
The results of applicability of the sensor are presented in Table 2 where Ni2+ standard solution was spiked into water samples. t-test results showed the comparison measurements by the present sensor are good results, when those investigations by AAS are the reference methods (Table 3). With 95% confidence level, tcount at 0.218 was lower than ttable at 2.776, so it means that there are no different results between optical sensors and AAS methods on the detection of Ni2+ in water samples.

Table 3.
Comparison of the detection methods.
4. Conclusions
An optical chemical sensor was designed for determination of Ni2+ ions. In this regard, sol-gel film was used as a matrix for immobilization of the reagent 2,2-furildioxime. The sensor detected Ni2+ ions by changing color from colorless to yellow; and was successfully tested to determine Ni2+ ions’ concentration in water samples. In comparison with the AAS method, the optical sensor based on 2,2-furildioxime produced comparably good results in detecting nickel with tcount < ttable. Thus, the optical chemical sensor for nickel detection is promising for further industrial and environmental applications.
Author Contributions
Conceptualization, S.S. and A.K.; methodology, S.S. and M.S.H.; validation, S.S. and A.K.; formal analysis, S.S.; investigation, M.S.H.; data curation, M.S.H.; writing—original draft preparation, S.S. and M.S.H.; review and editing, S.S.; supervision, S.S. and A.K. All authors have read and agreed to the published version of the manuscript.
Funding
This research was funded by Ministry of Research and Technology/National Research and Innovation Agency of Indonesia through the contract number 6/AMD/E1/KP.PTNBH/2020 and 2775/UN1.DITLIT/DIT-LIT/PT/2020.
Acknowledgments
We would like to thank Department of Chemistry, Universitas Gadjah Mada for providing facilities during the research and activities.
Conflicts of Interest
The authors declare no conflict of interest.
References and Note
- Parsaee, Z. Electrospin nanofibers decorated with bio-sonochemically synthesized gold nanoparticles as an ultrasensitive probe in amalgam-based mercury (II) detection system. Ultrason. Sonochem. 2018, 44, 24–35. [Google Scholar] [CrossRef] [PubMed]
- Parsaee, Z.; Haratipour, P.; Lariche, M.J.; Vojood, A. A novel highly performance nano chemosensor for copper (II) ion based on an ultrasound-assisted synthesized diphenylamine-based Schiff base: Design, fabrication and density functional theory calculations. Ultrason. Sonochem. 2018, 41, 337–349. [Google Scholar] [CrossRef] [PubMed]
- Ghaedi, M.; Shahamiri, A.; Hajati, S.; Mirtamizdoust, B. A novel PVC-membrane optical sensor for highly sensitive and selective determination of Cu2+ ion based on synthesized (E)-N′-(pyridin-2-ylmethylene) isonicotin-ohydrazide. J. Mol. Liq. 2014, 199, 483–488. [Google Scholar] [CrossRef]
- Hashemi, P.; Zarjani, R.A. A wide range pH optical sensor with mixture of neutral red and thionin immobilized on an agarose film coated glass slide. Sens. Actuators B Chem. 2008, 135, 112–115. [Google Scholar] [CrossRef]
- Kim, M.D.; Dergunov, S.A.; Lindner, E.; Pinkhassik, E. Dye-loaded porous nano-capsules immobilized in a permeable polyvinyl alcohol matrix: A versatile optical sensor platform. Anal. Chem. 2012, 84, 2695–2701. [Google Scholar] [CrossRef] [PubMed]
- Liu, Z.; Liu, J.; Chen, T. Phenol red immobilized PVA membrane for an optical pH sensor with two determination ranges and long-term stability. Sens. Actuators B Chem. 2005, 107, 311–316. [Google Scholar] [CrossRef]
- Dashtian, K.; Zare-Dorabei, R. Preparation and characterization of a novel optical chemical sensor for determination of trace amounts of Praseodymium ion by UV/Vis spectrophotometry. Sens. Actuators B Chem. 2017, 242, 586–594. [Google Scholar] [CrossRef]
- Azeman, N.H.; Arsad, N.; Bakar, A.A. Polysaccharides as the sensing material for metal ion detection-based optical sensor applications. Sensors 2020, 20, 3924. [Google Scholar] [CrossRef]
- Shahamirifard, S.A.; Ghaedi, M.; Montazerozohori, M. Design a sensitive optical thin film sensor based on incorporation of isonicatinohydrazide derivative in sol-gel matrix for determination of trace amounts of copper (II) in fruit juice: Effect of sonication time on immobilization approach. Ultrason. Sonochem. 2018, 42, 723–730. [Google Scholar] [CrossRef]
- Maybodi, A.S.; Rezaei, V. A new sol-gel optical sensor with nonporous structure for determination of trace zinc. Sens. Actuators B Chem. 2014, 199, 418–423. [Google Scholar] [CrossRef]
- Parsaee, Z.; Karachi, N.; Razavi, R. Ultrasound assisted fabrication of a novel optode base on a triazine based schiff base immobilized on TEOS for copper detection. Ultrason. Sonochem. 2018, 47, 1–20. [Google Scholar] [CrossRef] [PubMed]
- Shahamirifard, S.A.; Ghaedi, M.; Hajati, S. A new silver (I) ions optical sensor based on nanoporous thin film of sol-gel by Rose Bengal dye. Sens. Actuators B Chem. 2018, 259, 20–29. [Google Scholar] [CrossRef]
- Lev, O.; Tsionsky, M.; Rabinovich, L.; Glezer, V.; Sampath, S.; Pankratov, I.; Gun, J. Organically modified sol-gel sensors. Anal. Chem. 1995, 67, 22A–30A. [Google Scholar] [CrossRef]
- Darmawan, A.; Smart, S.; Julbe, A.; da Costa, J.C.D. Iron oxide silica derived from sol-gel synthesis. Materials 2011, 4, 448–456. [Google Scholar] [CrossRef]
- Anonymous. Ministry of Environment Republic of Indonesia No.9 Year 2006 Concerning Wastewater Quality Standards for Nickel ore Mining in Business and Activities; 2006.
- Fay, M.; Wilbur, S.; Abadin, H.; Ingerman, L.; Swarts, S.G. Toxicological Profile for Nickel; Agency for Toxic Substances and Disease Registry (ATSDR): Atlanta, Georgia, 2005. [Google Scholar]
- Sugiyono, A. Overview of nickel industry in Indonesia. MAMBERAMO NOW 1998, 2, 1–8. [Google Scholar]
- Silva, E.L.; Roldan, P.D.S.; Gine, M.F. Simultaneous preconcentration of copper, cadmium and nickel in Water Samples by Cloud Point Extraction using 4-(2-pyridylazo)-resorcinol and their determination by inductively coupled plasma optic emission spectrometry. Hazard. Mater. 2009, 171, 1133–1138. [Google Scholar] [CrossRef]
- Mizuguchi, H.; Zhang, Y.-F.; Onodera, H.; Nishizawa, S.; Shida, J. On-site determination of trace nickel in liquid sample for semiconductor manufacturing by highly sensitive solid-phase colorimetry with α-furil dioxime. Chem. Lett. 2008, 37, 792–793. [Google Scholar] [CrossRef]
- Bobrowski, A. Catalytic adsorptive stripping voltammetric determination of cobalt and nickel as their Furil dioxime complexes. Electroanalysis 2004, 16, 1536–1541. [Google Scholar] [CrossRef]
- Murthy, Y.L.N.; Govindh, B.; Diwakar, B.S.; Nagalakshmi, K. A simple inexpensive detection method of Nickel in Water using Optical Sensor. Int. J. Chem. Tech. Res. 2011, 3, 1285–1291. [Google Scholar]
- Hakim, M.S. Colorimetric Detection of Ni(II) Using Thin Film Sensor with Ligand Alfa-Furildioxime in Silica Gel Matrix. Master’s Thesis, Universitas Gadjah Mada, Yogyakarta, Indonesia, 30 August 2019. [Google Scholar]
- De Sousa, C.S.; Korn, M. Effects of ultrasonic irradiation on the spectrophotometric determination of nickel with dimethylglyoxime. Anal. Chim. Acta 2001, 444, 309–315. [Google Scholar] [CrossRef]
- Memon, N.; Memon, S.; Solangi, A.R.; Soomro, R.; Soomro, R. Single-channel flow injection spectrophotometric determination of nickel using furildioxime in micellar solution. Sci. World. J. 2012, 2012, 1–5. [Google Scholar] [CrossRef] [PubMed]
Publisher’s Note: MDPI stays neutral with regard to jurisdictional claims in published maps and institutional affiliations. |
© 2021 by the authors. Licensee MDPI, Basel, Switzerland. This article is an open access article distributed under the terms and conditions of the Creative Commons Attribution (CC BY) license (http://creativecommons.org/licenses/by/4.0/).