
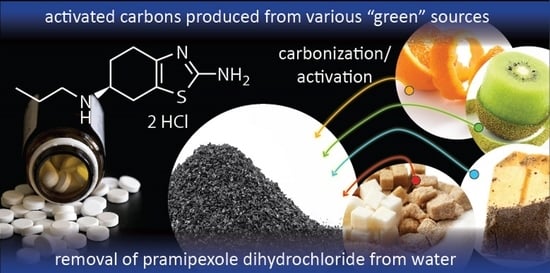
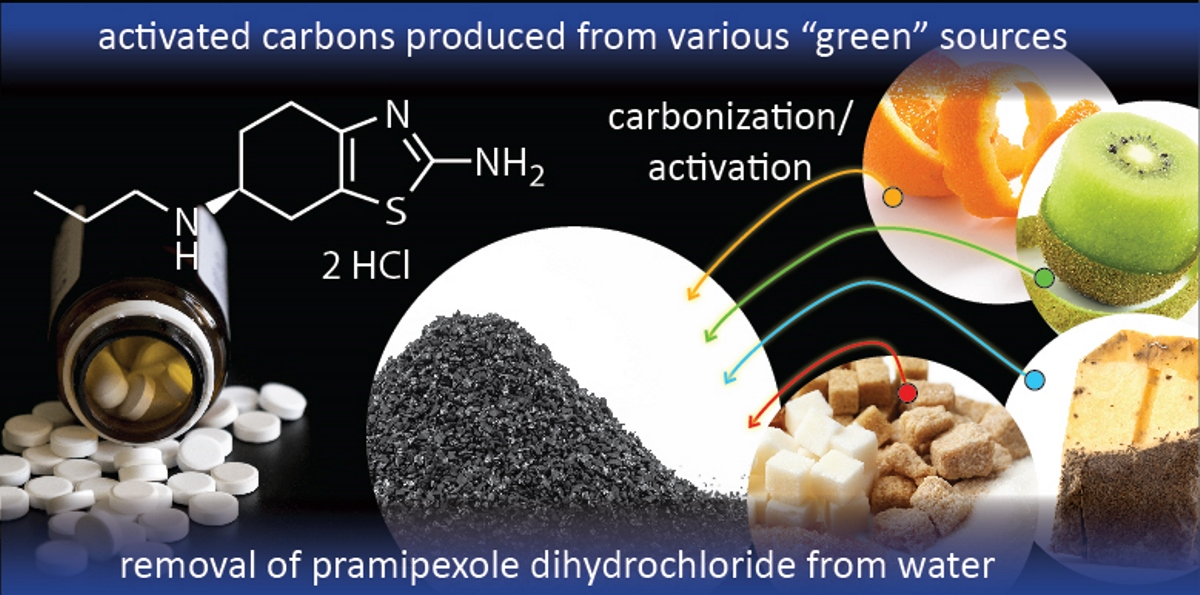
Carbonaceous Adsorbents Derived from Agricultural Sources for the Removal of Pramipexole Pharmaceutical Model Compound from Synthetic Aqueous Solutions

 ,
,  ,
,  ,
, 

Abstract
1. Introduction
2. Materials and Methods
2.1. Materials
2.2. Synthesis of AC from Various Carbon Sources
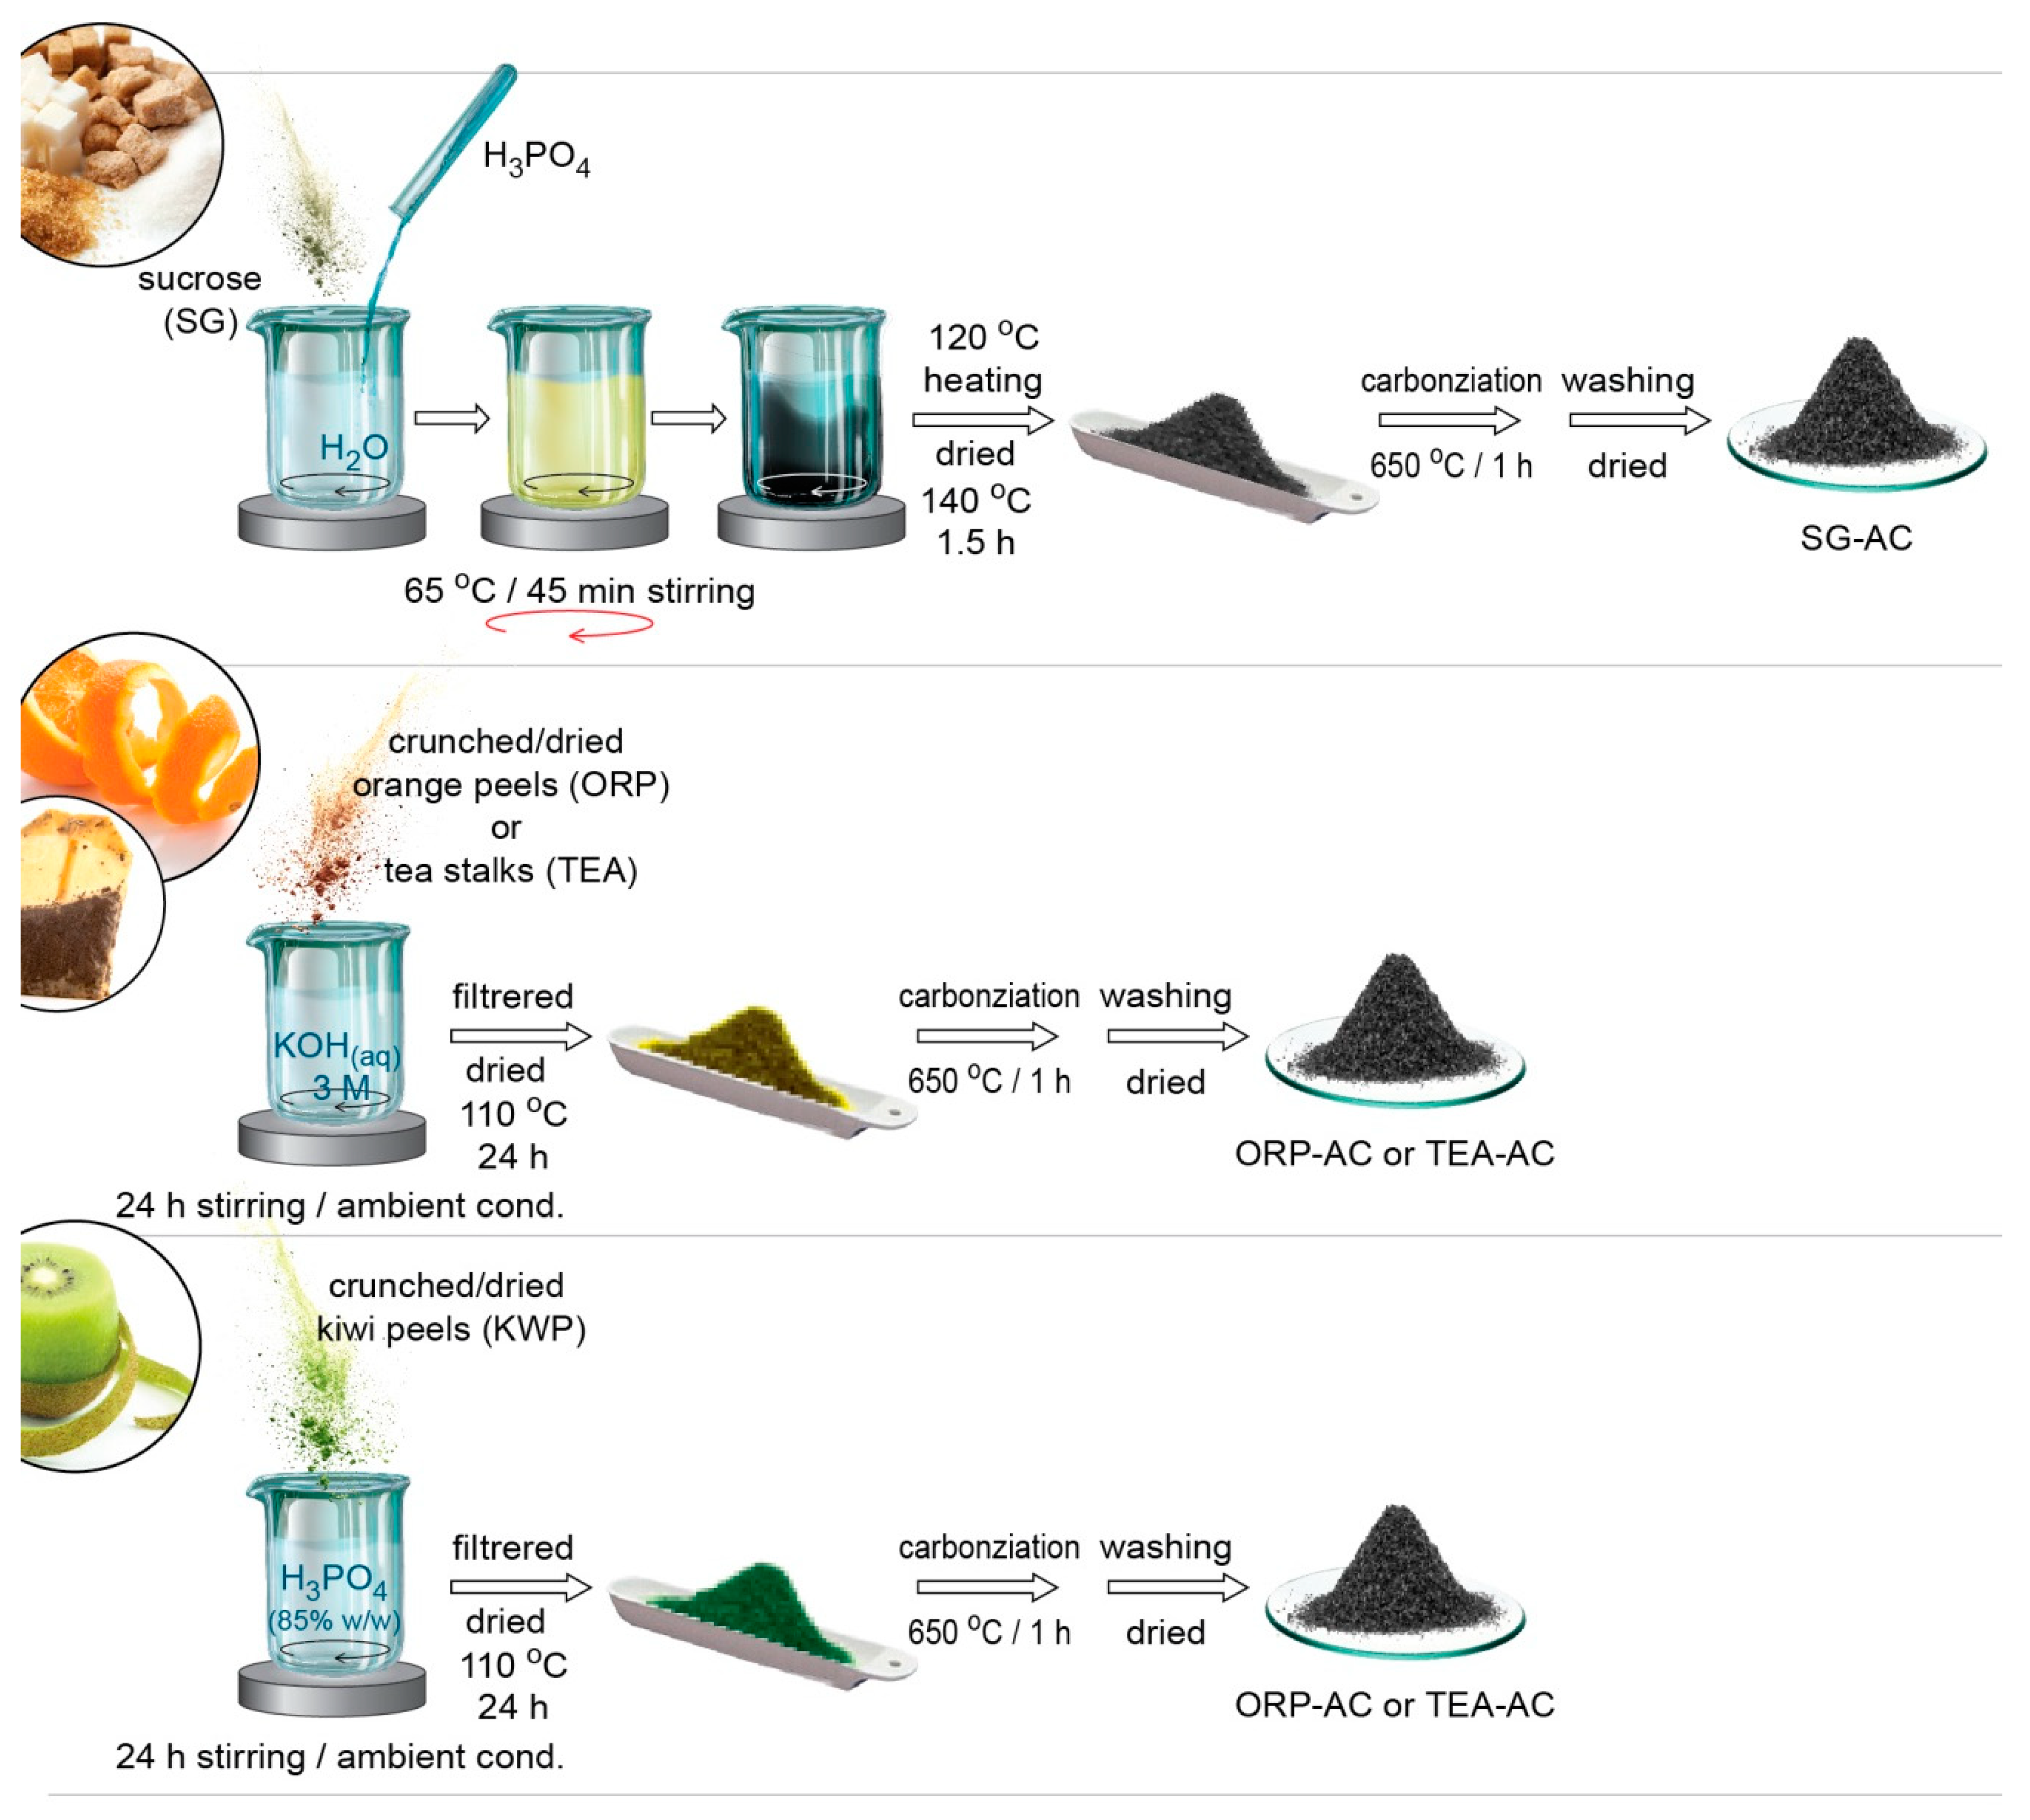
2.2.1. Activated Carbon from Sucrose (SG-AC)
2.2.2. Activated Carbon from Orange Peels (ORP-AC), Tea Stalks (TEA-AC), and Kiwi Peels (KWP-AC)
2.3. Adsorption Evaluation
2.3.1. pH Effect
2.3.2. Equilibrium/Isotherms
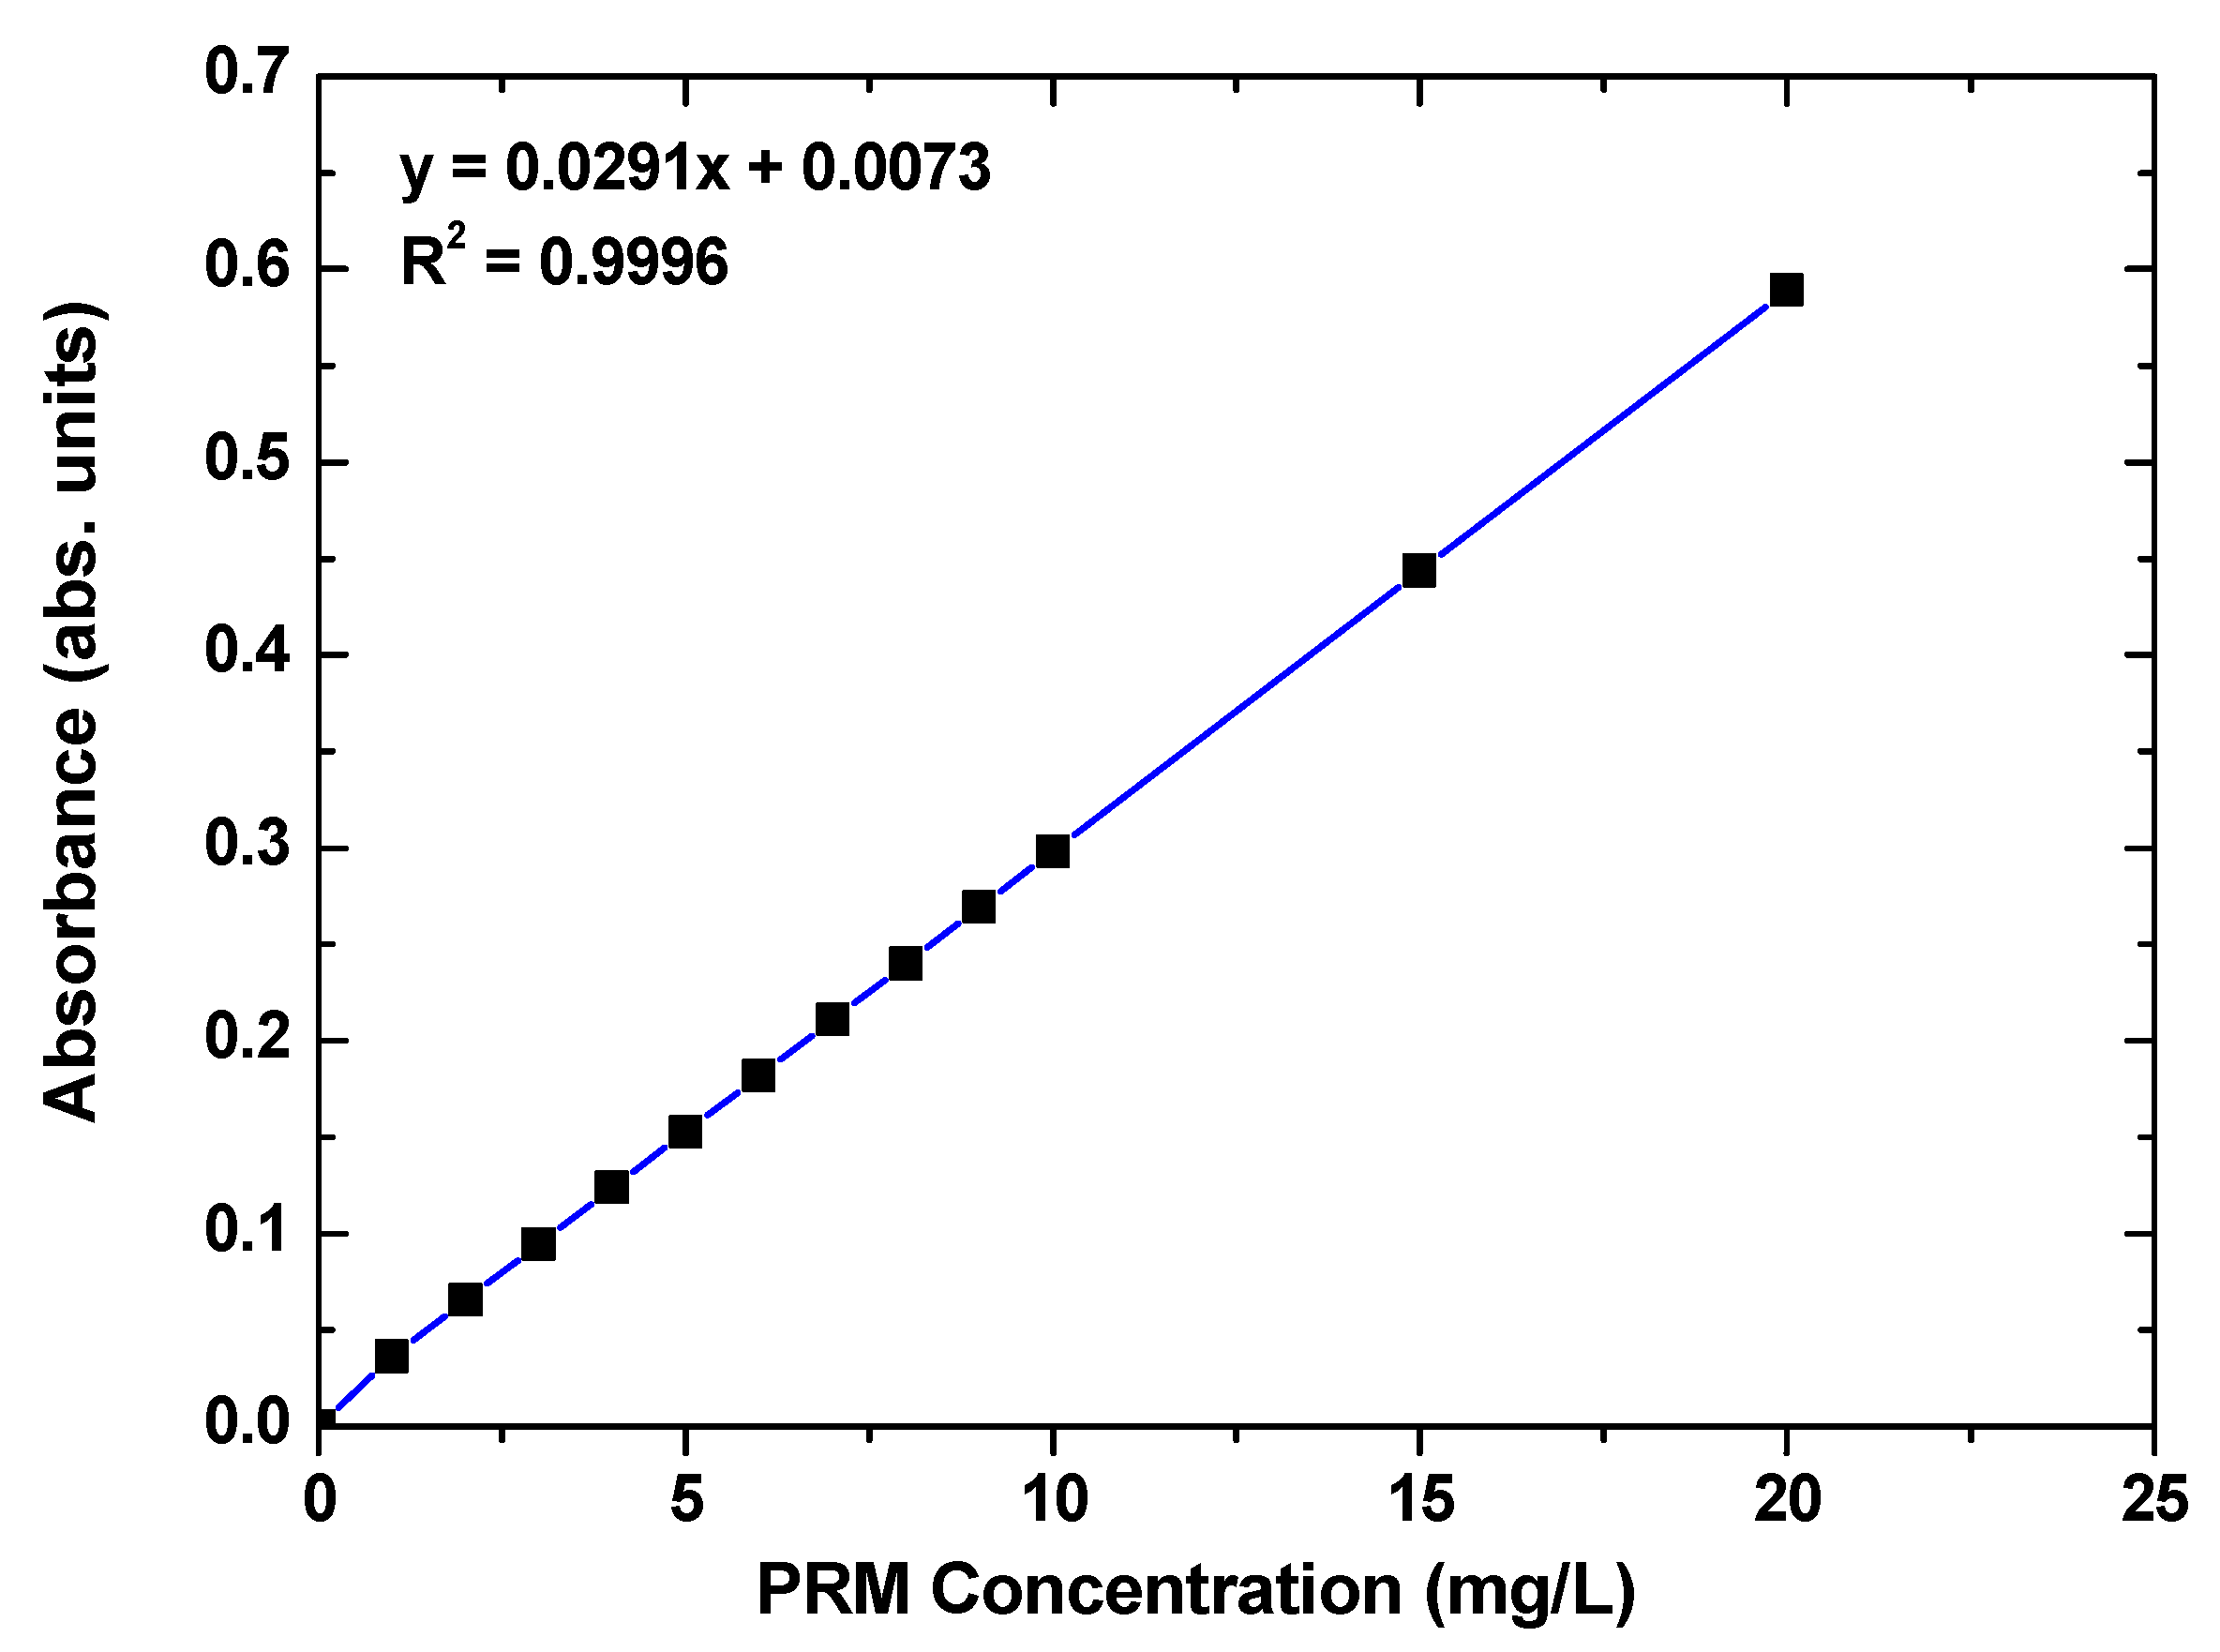
2.3.3. Analysis and Fitting
2.3.4. Error Analysis
2.4. Characterization Techniques
3. Results and Discussion
3.1. Characterizations
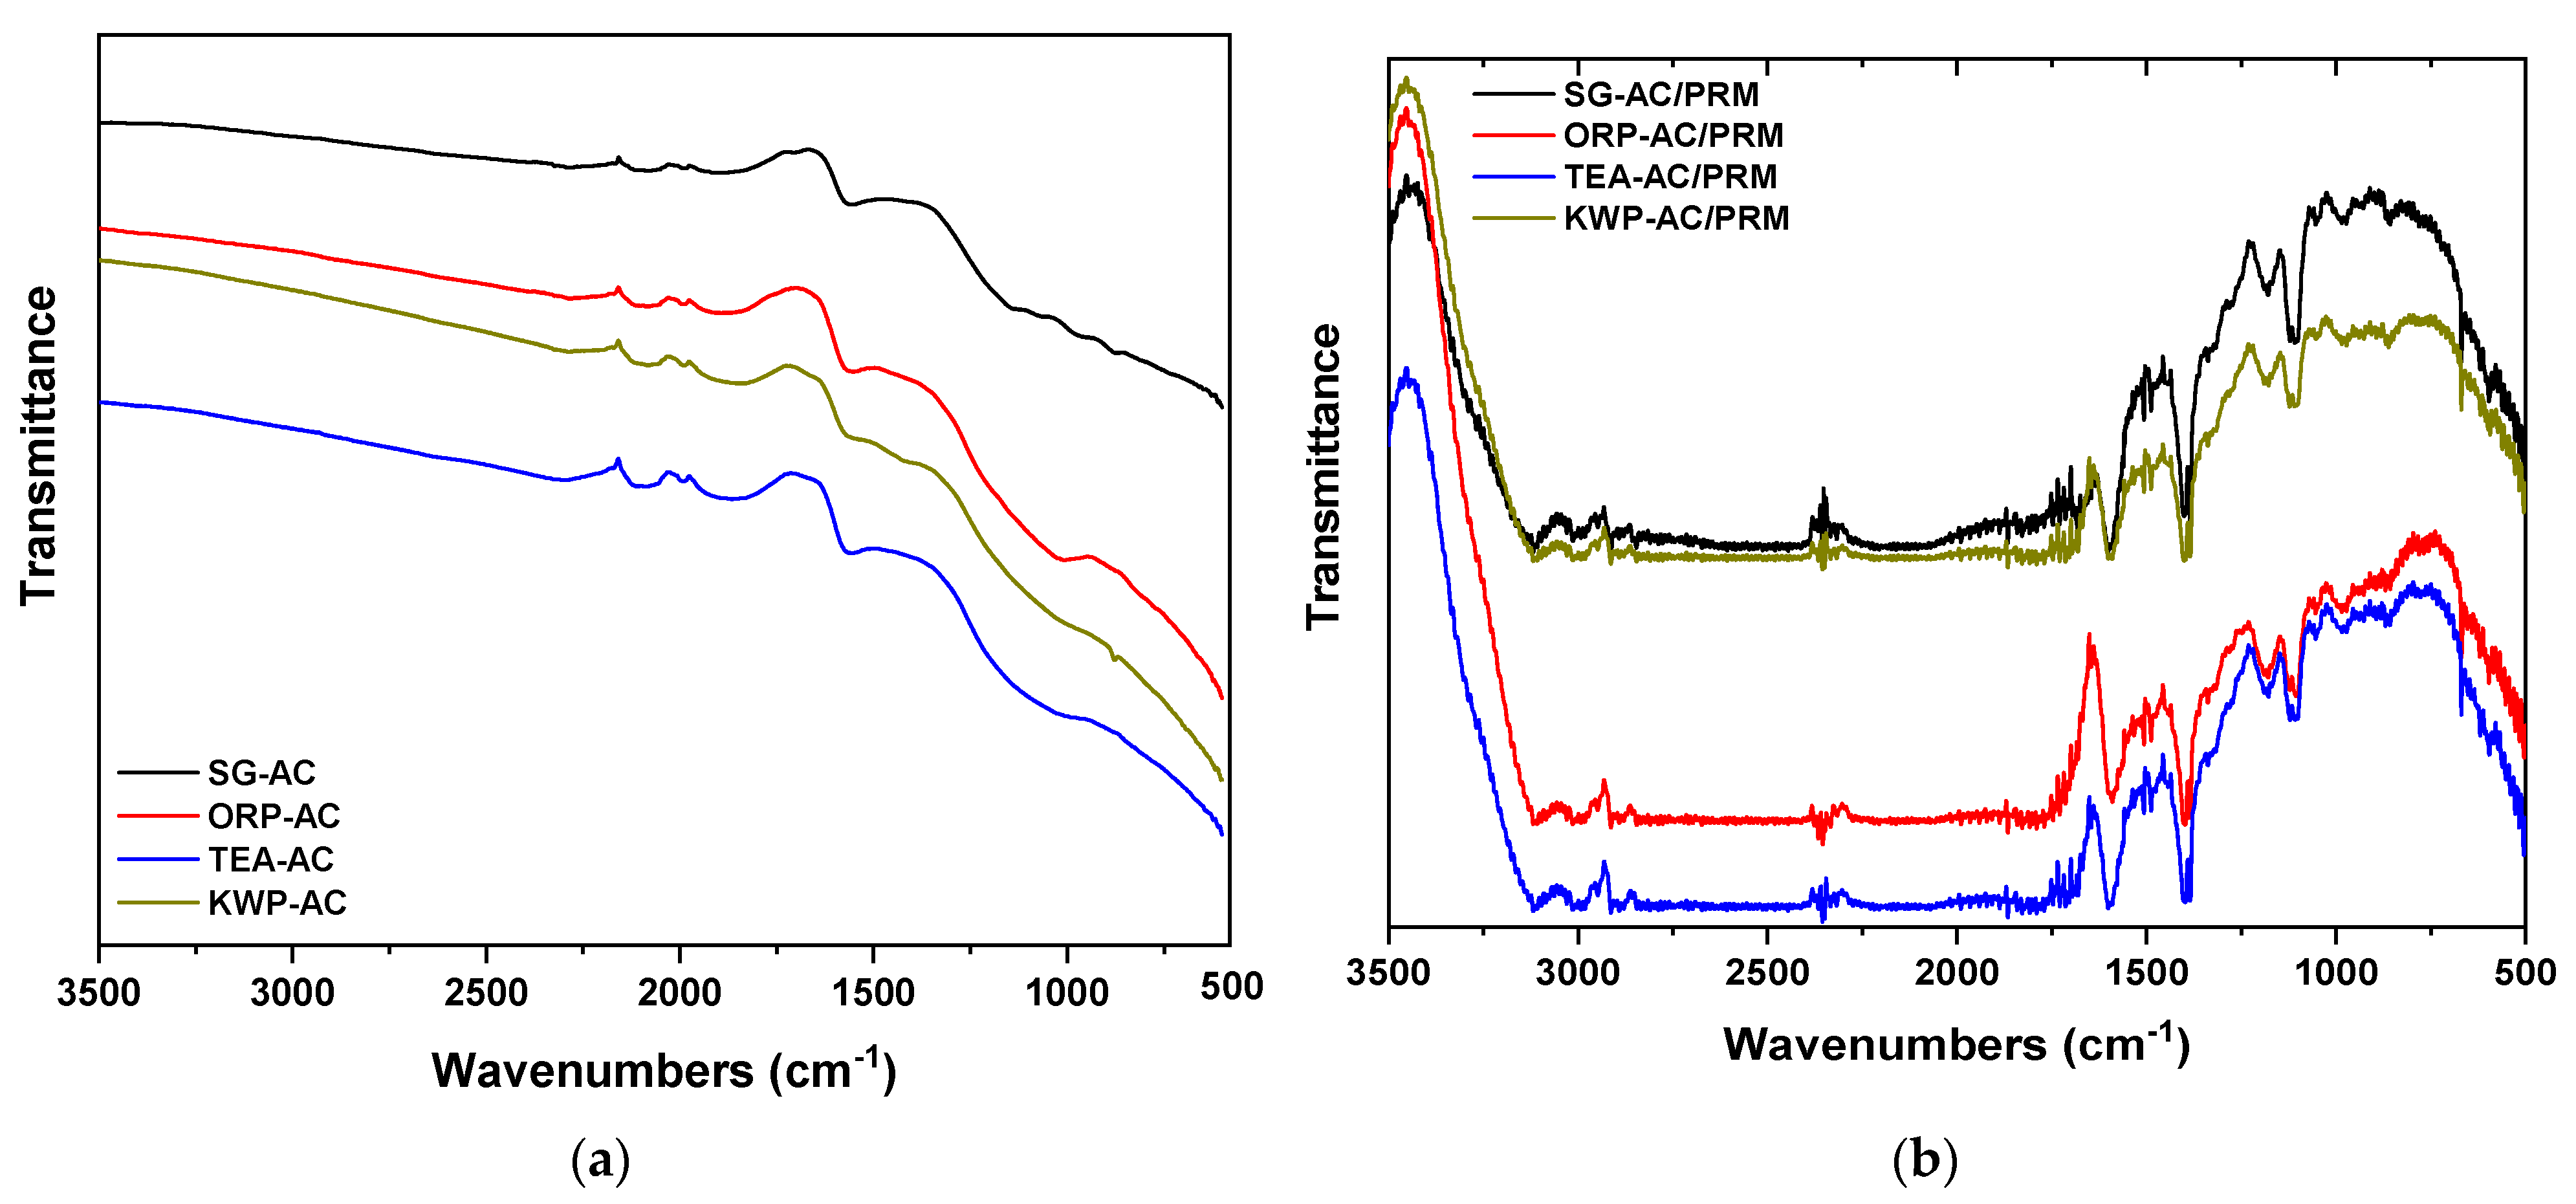
3.1.1. FTIR Spectroscopy
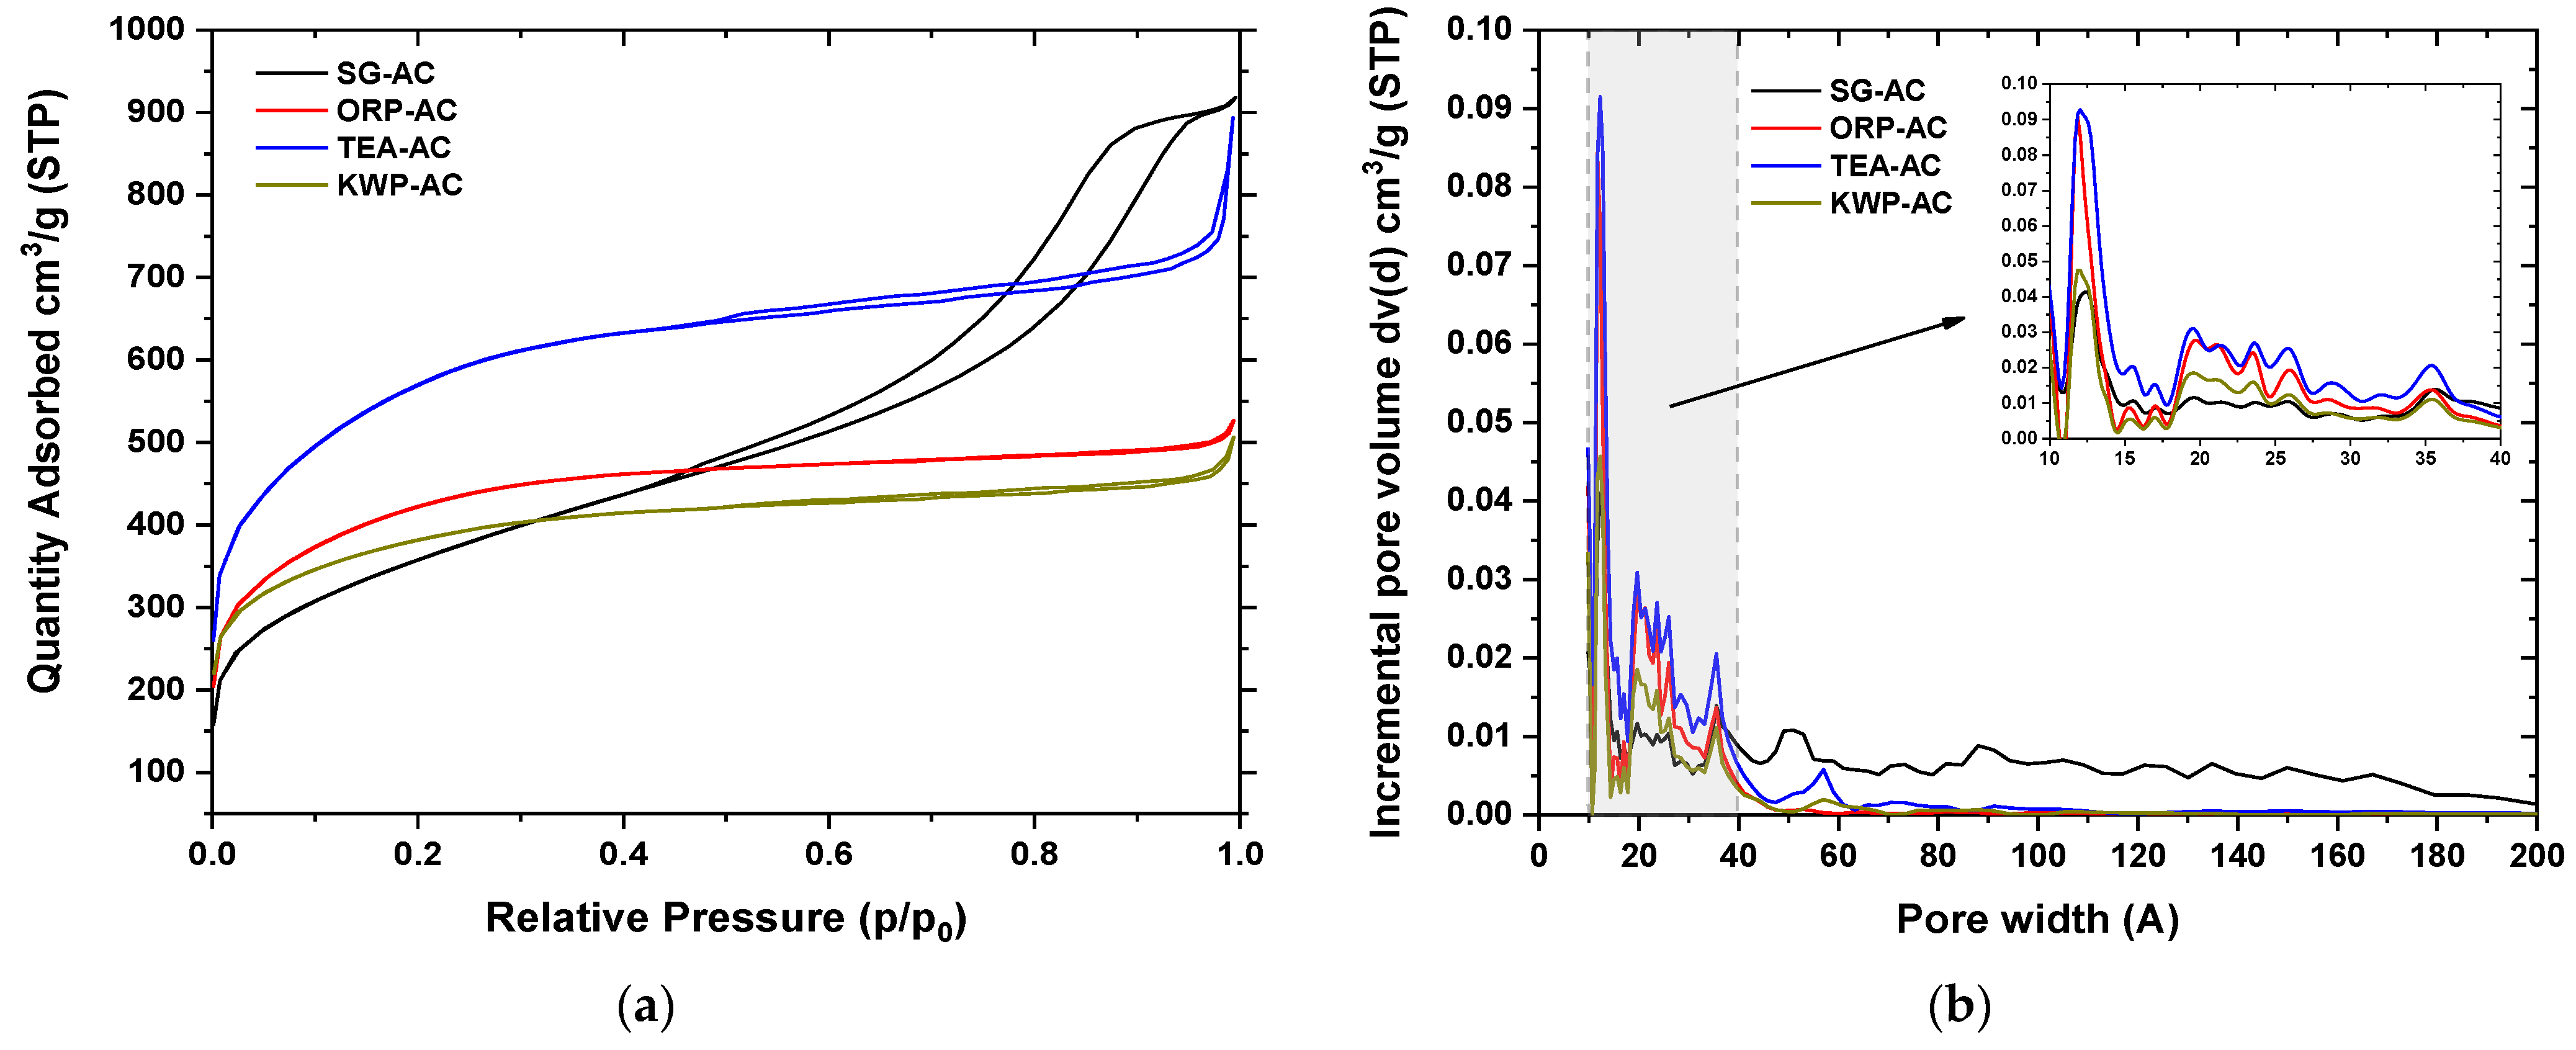
3.1.2. N2 Physisorption Tests Analysis
4H3PO4→P4O10 + 6H2O
P4O10 + 10C→P4 + 10CO
K2CO3 → K2O + CO2
K2CO3 + 2C → 2K + 3CO
CO2 + C → 2CO
C + K2O → 2K + CO
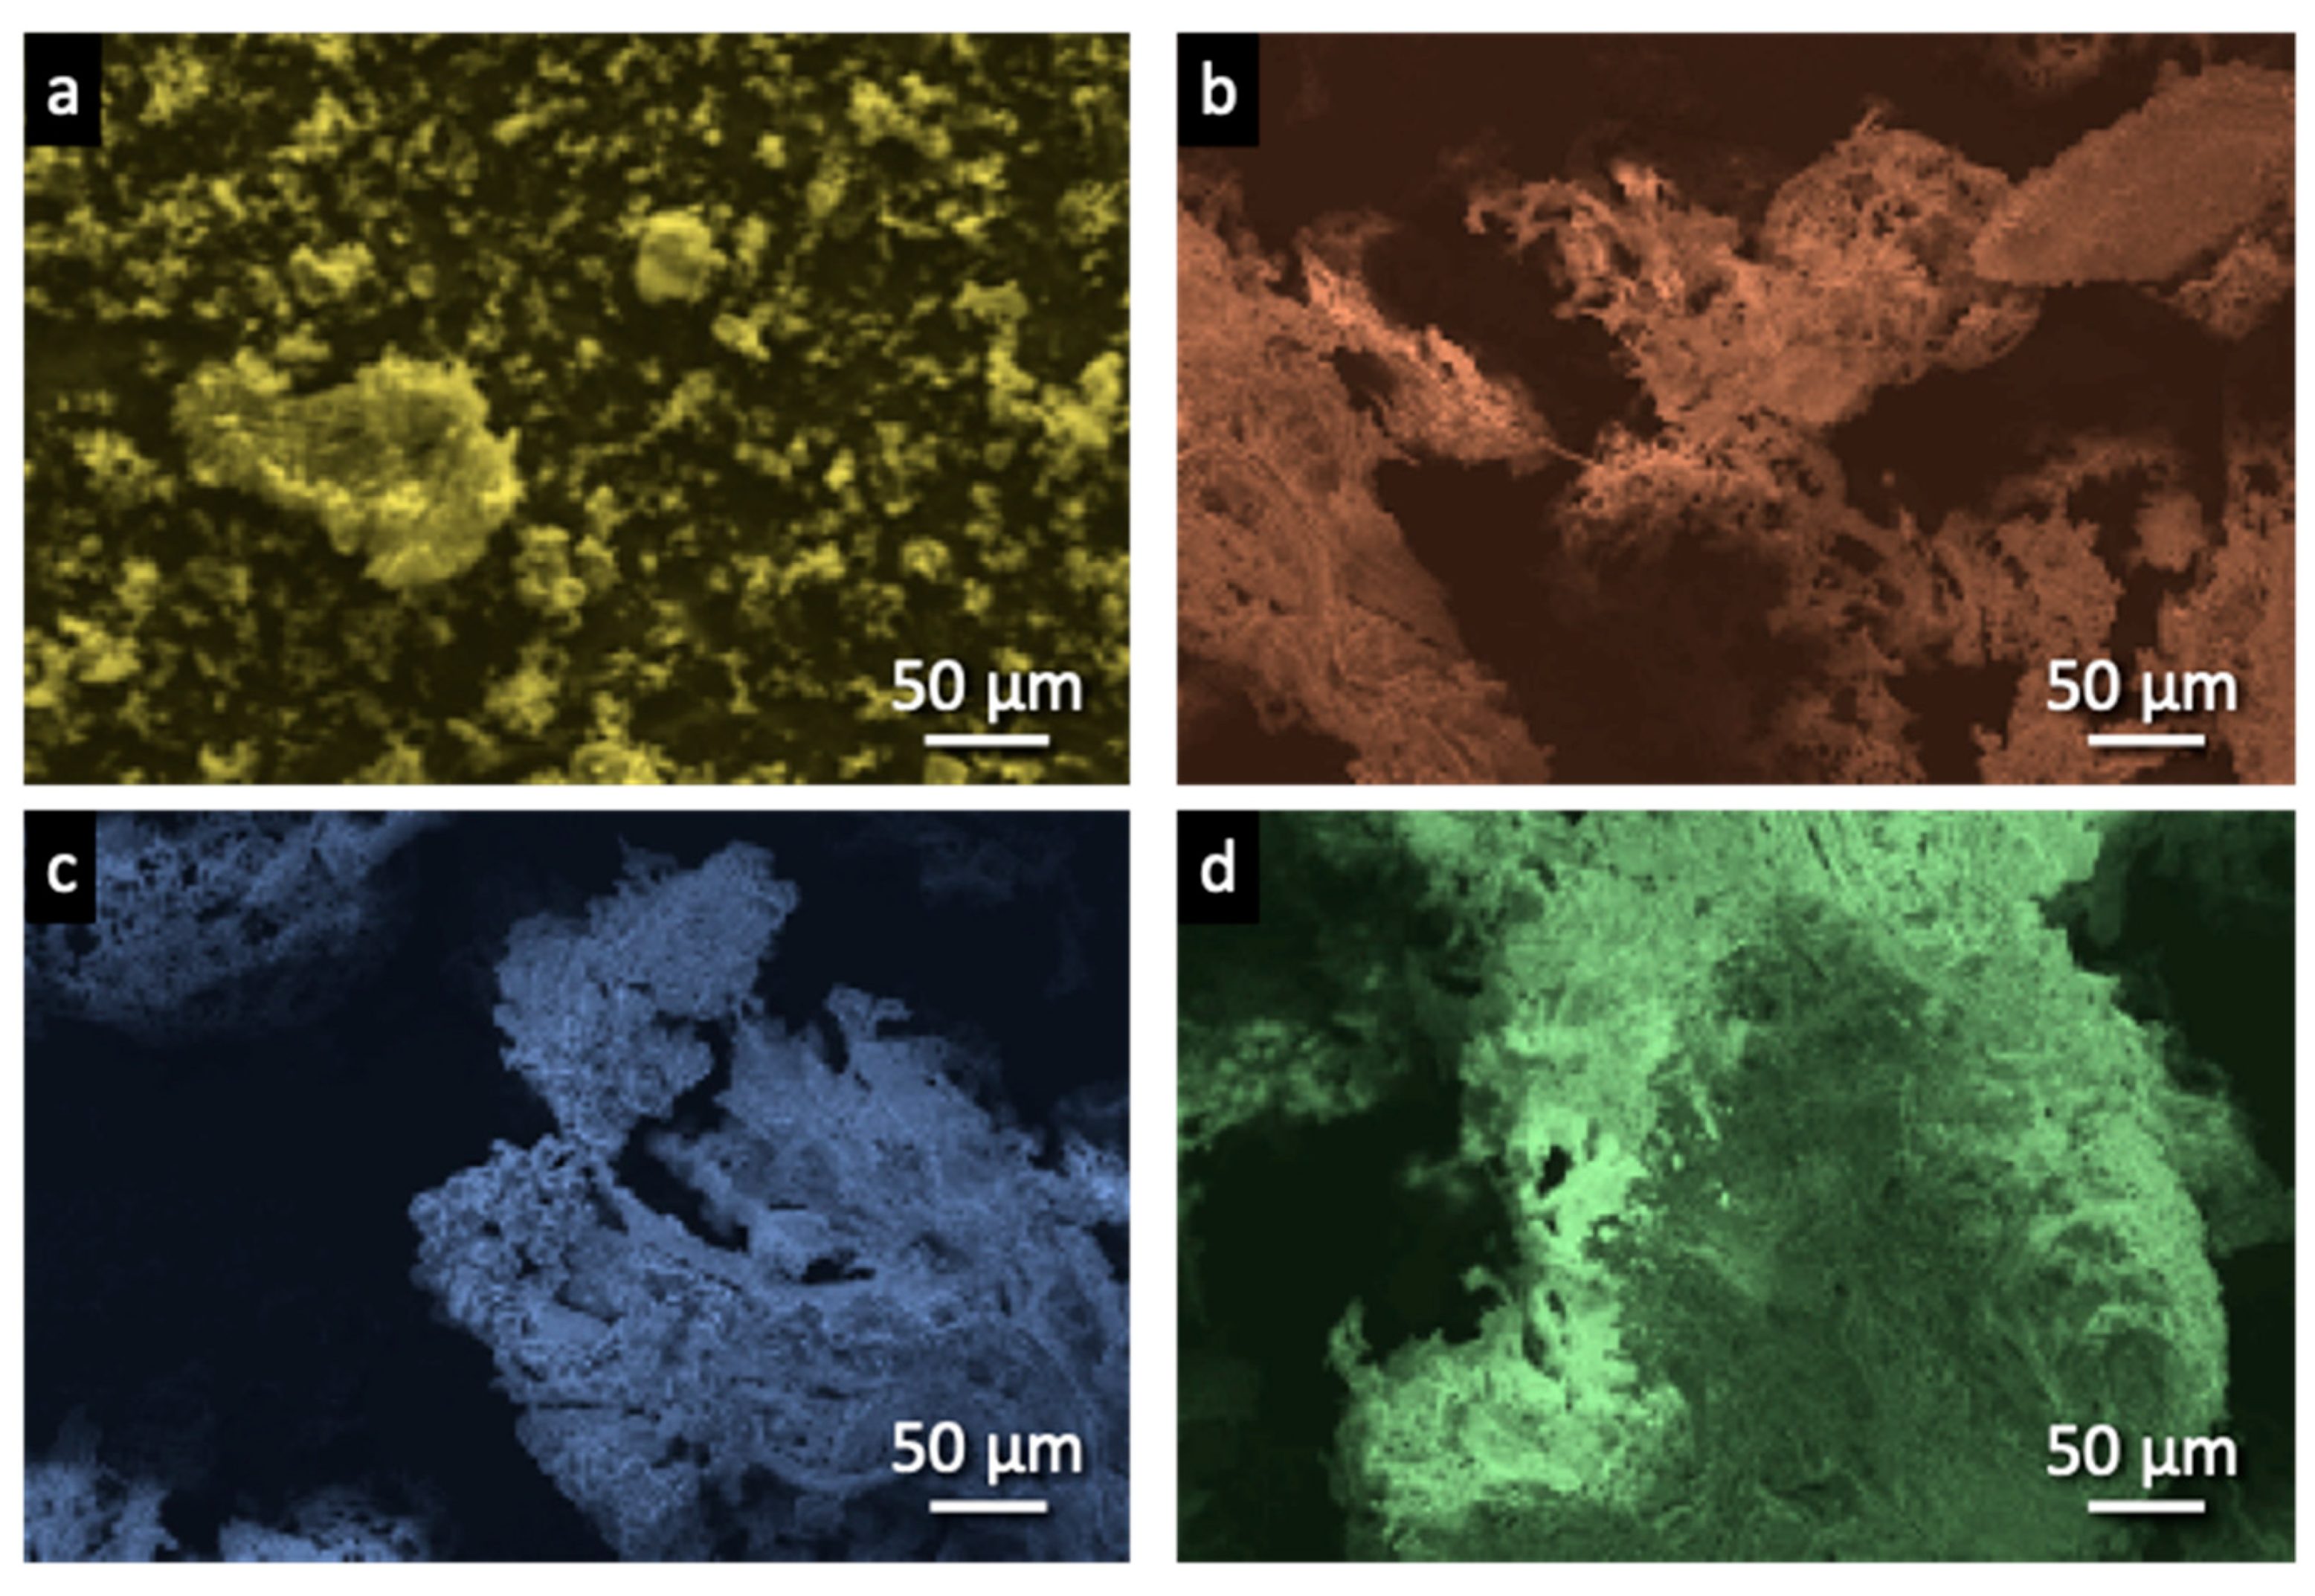
3.1.3. SEM Images
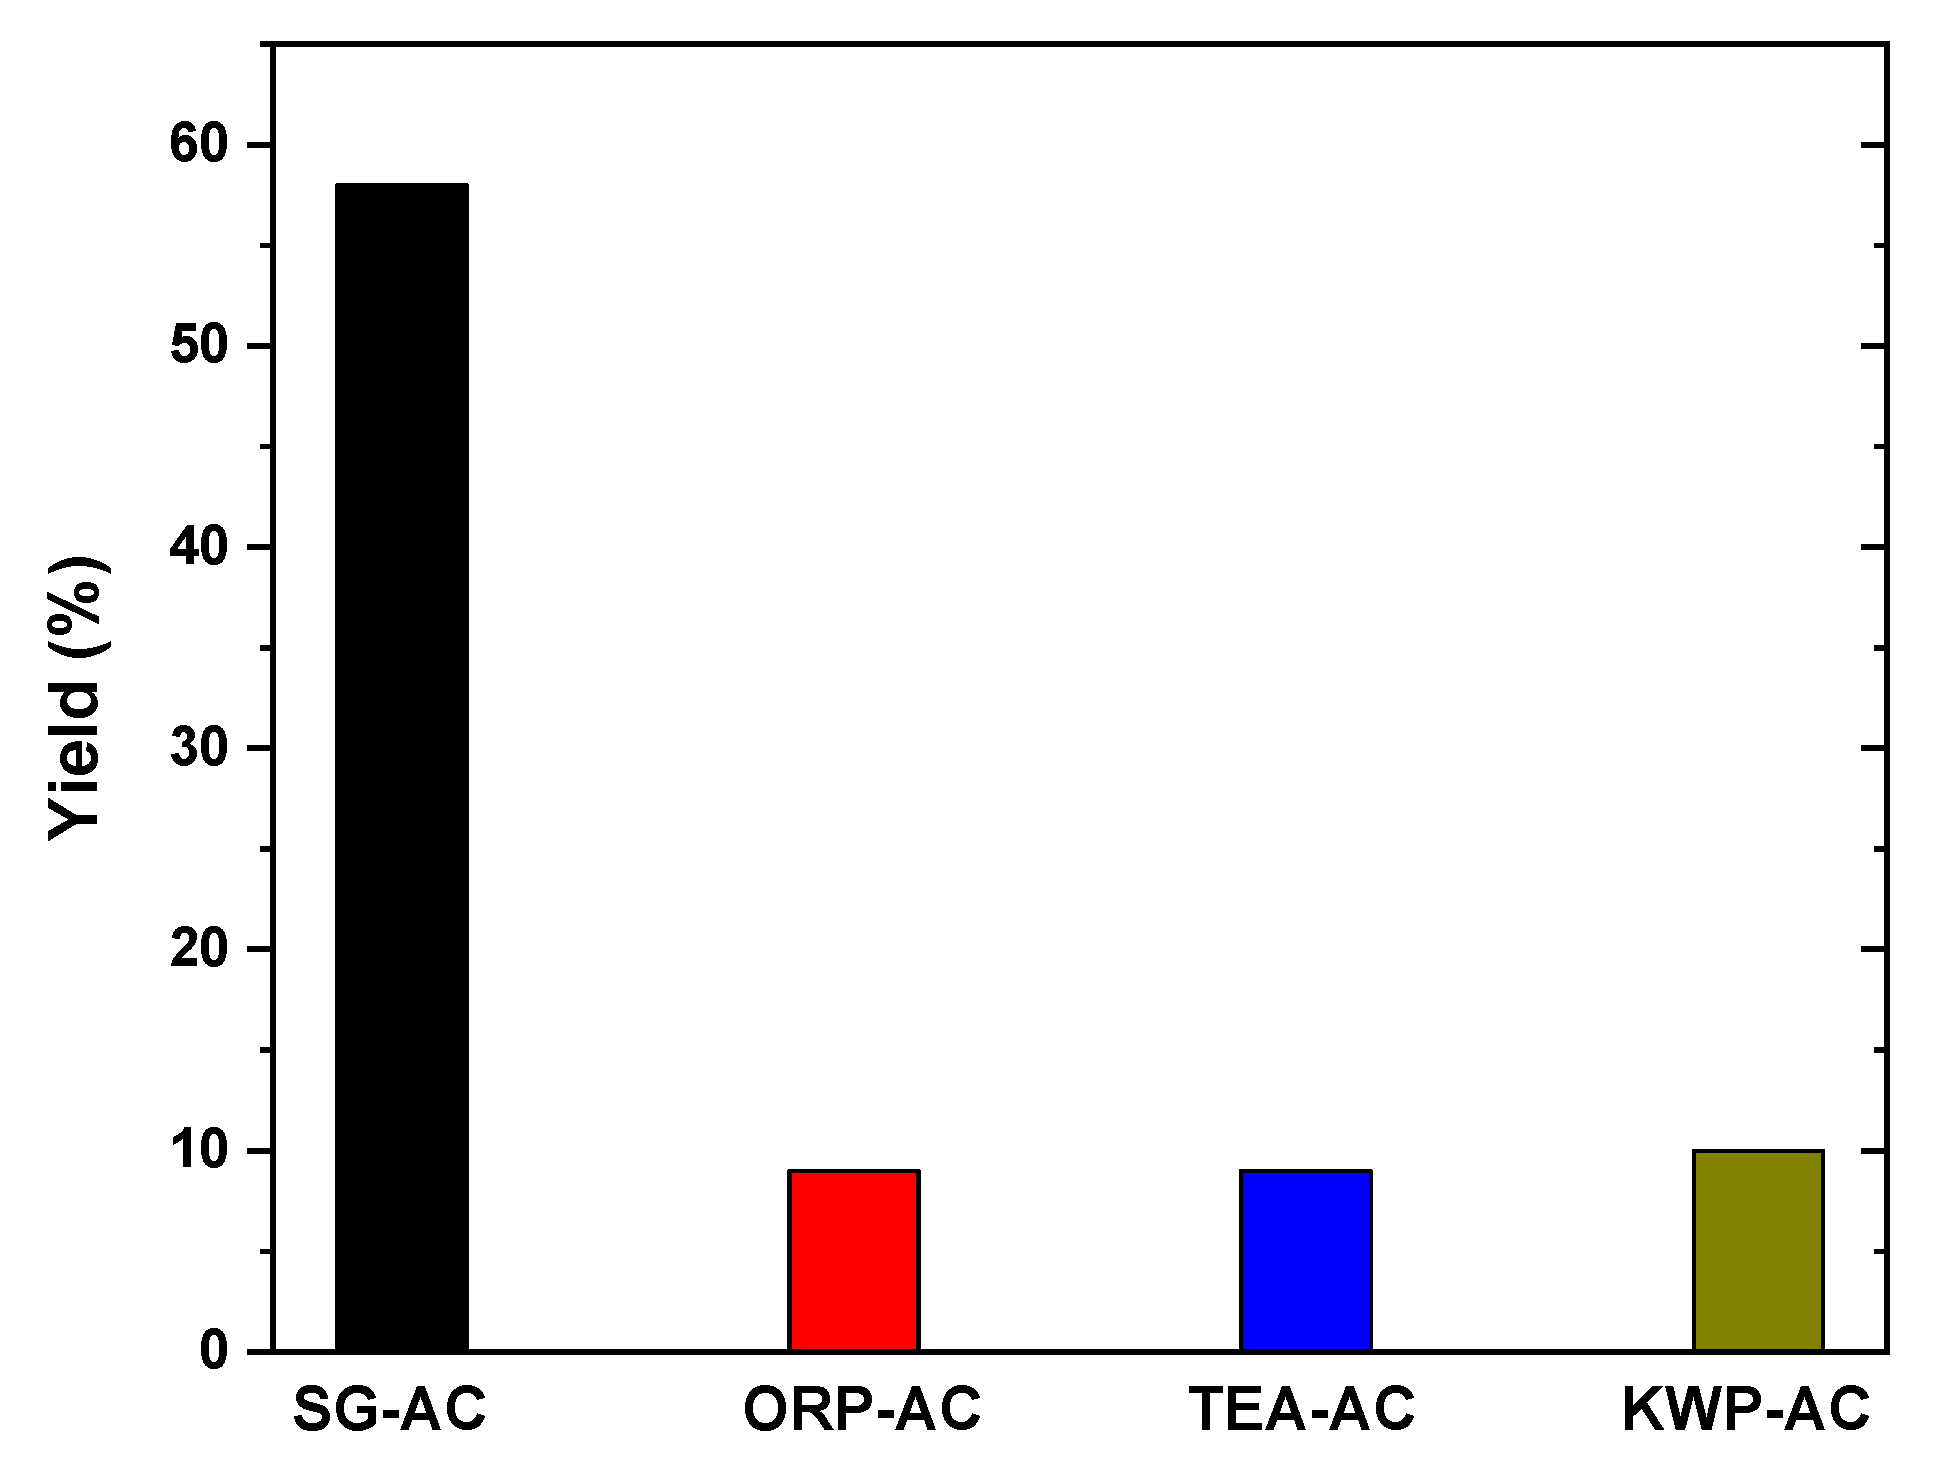
3.1.4. Yield of AC Samples
3.2. Adsorption Evaluation
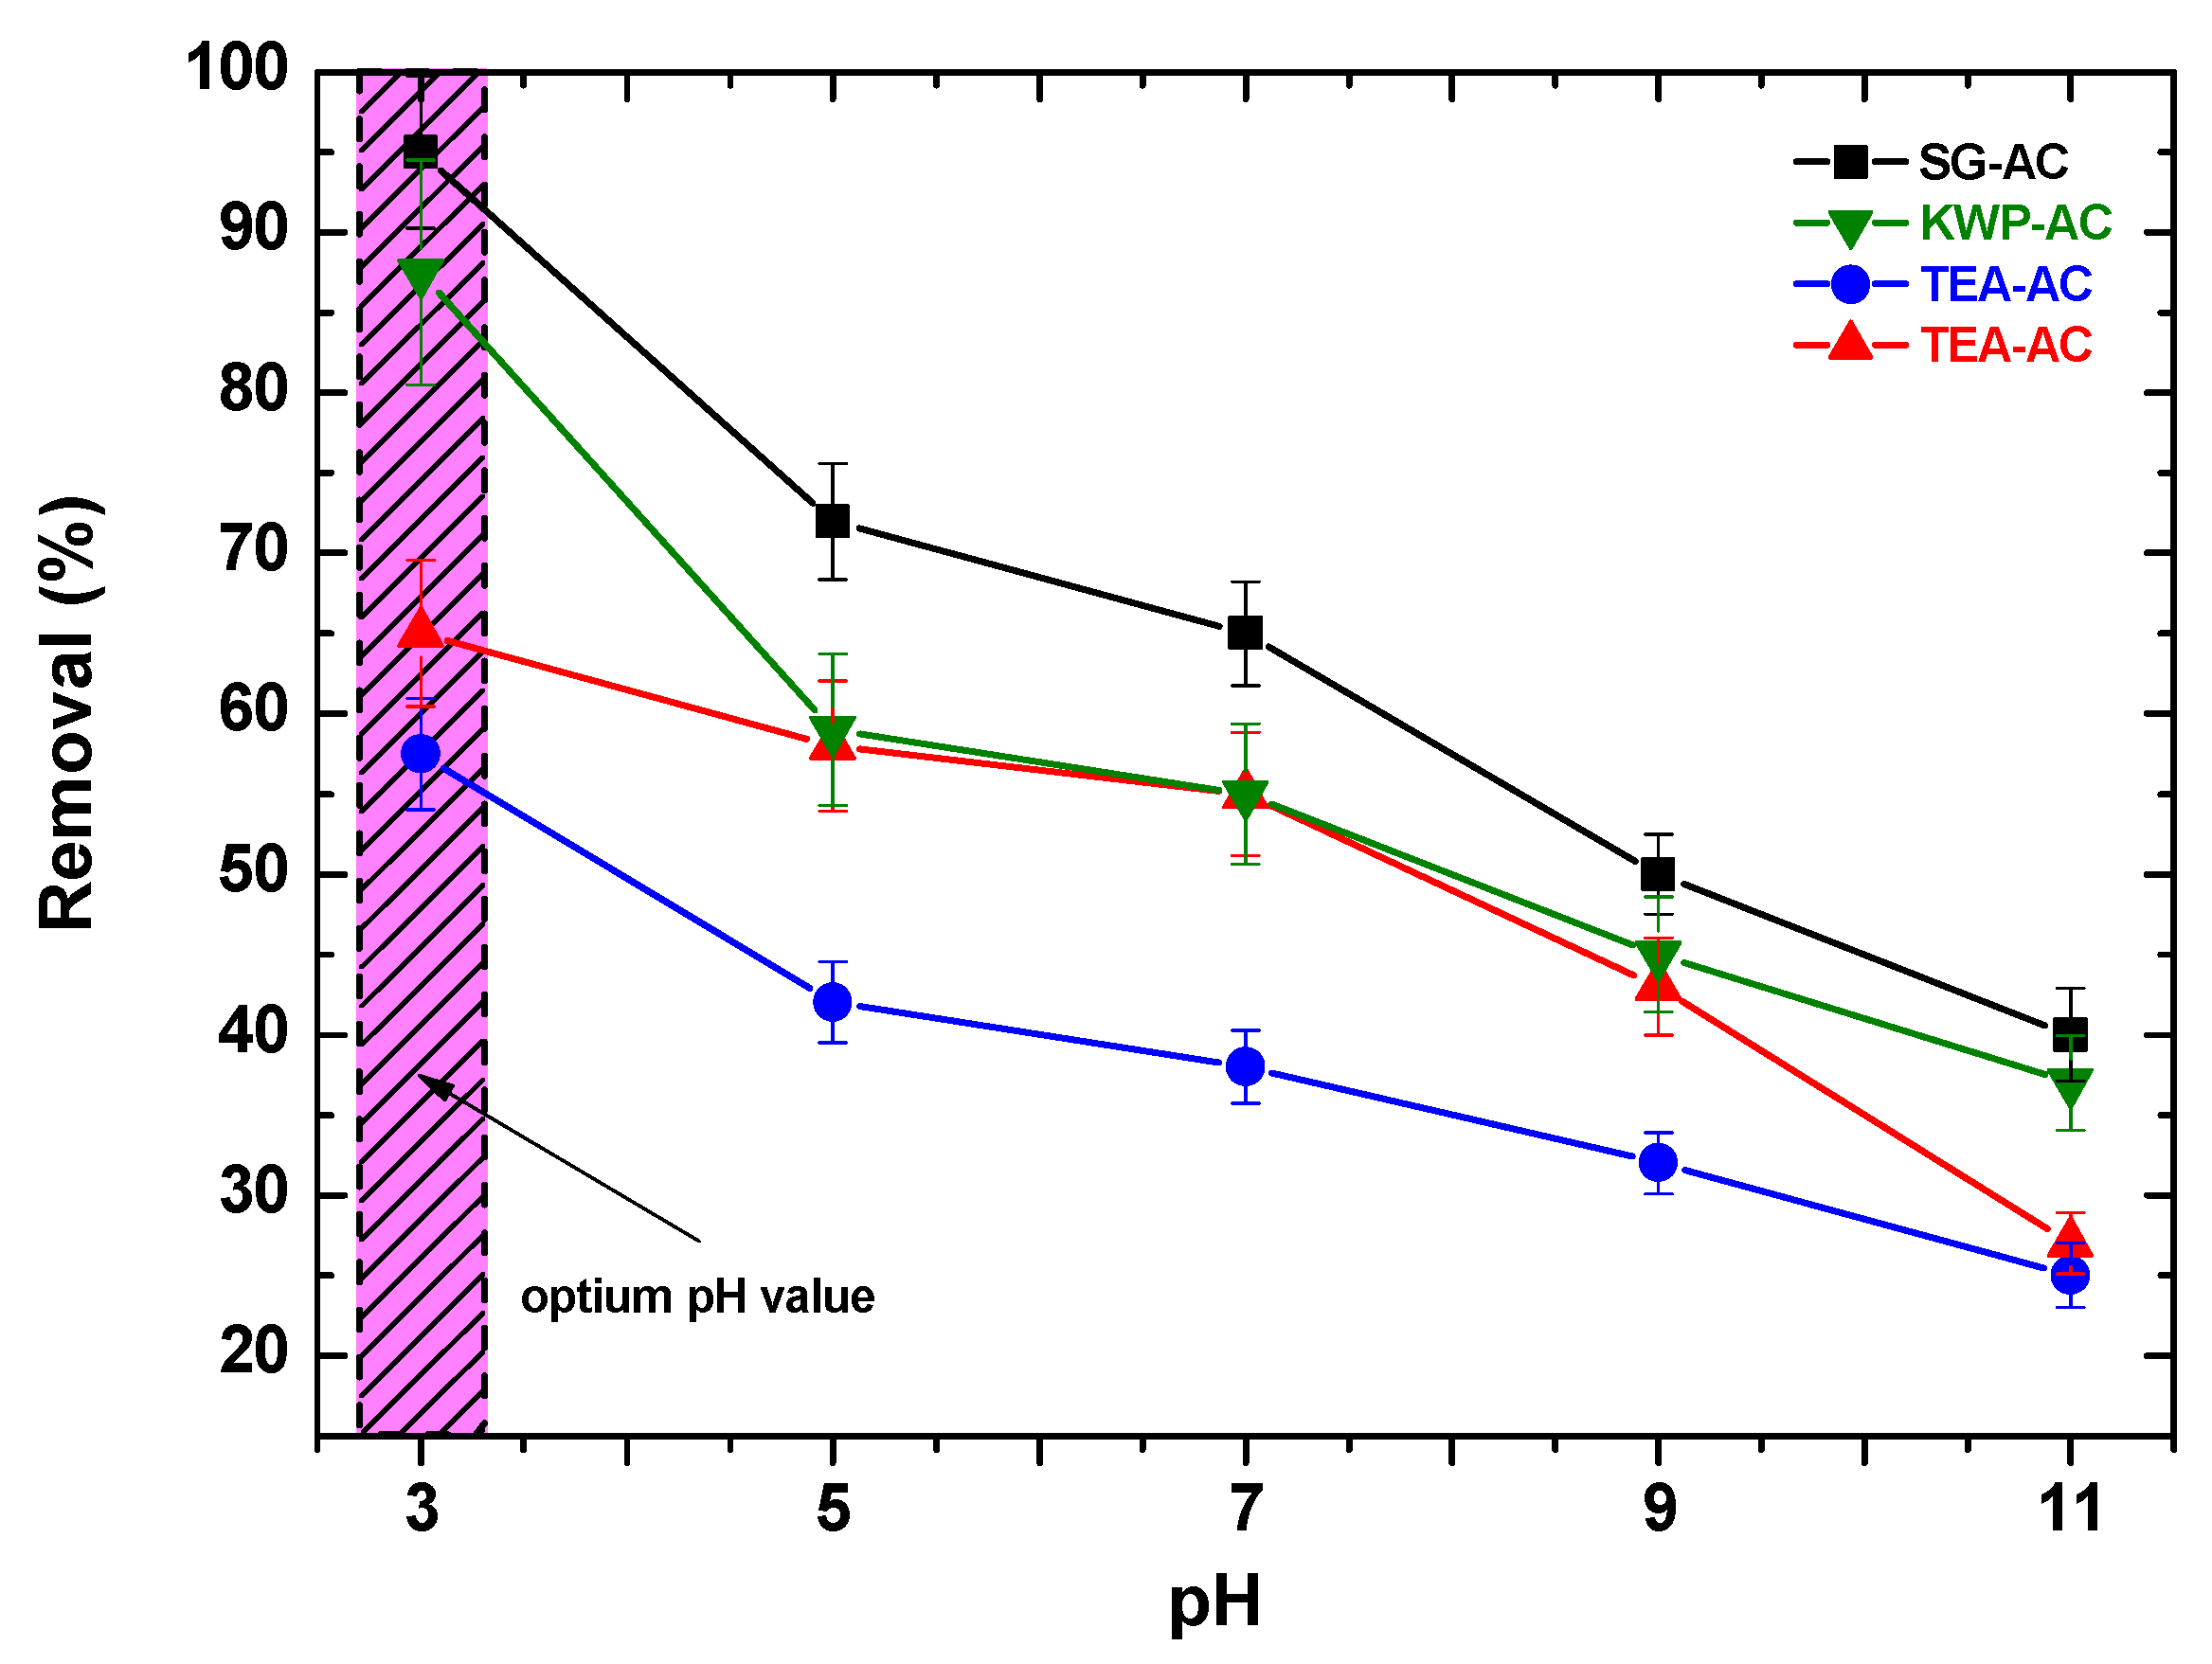
3.2.1. Effect of pH
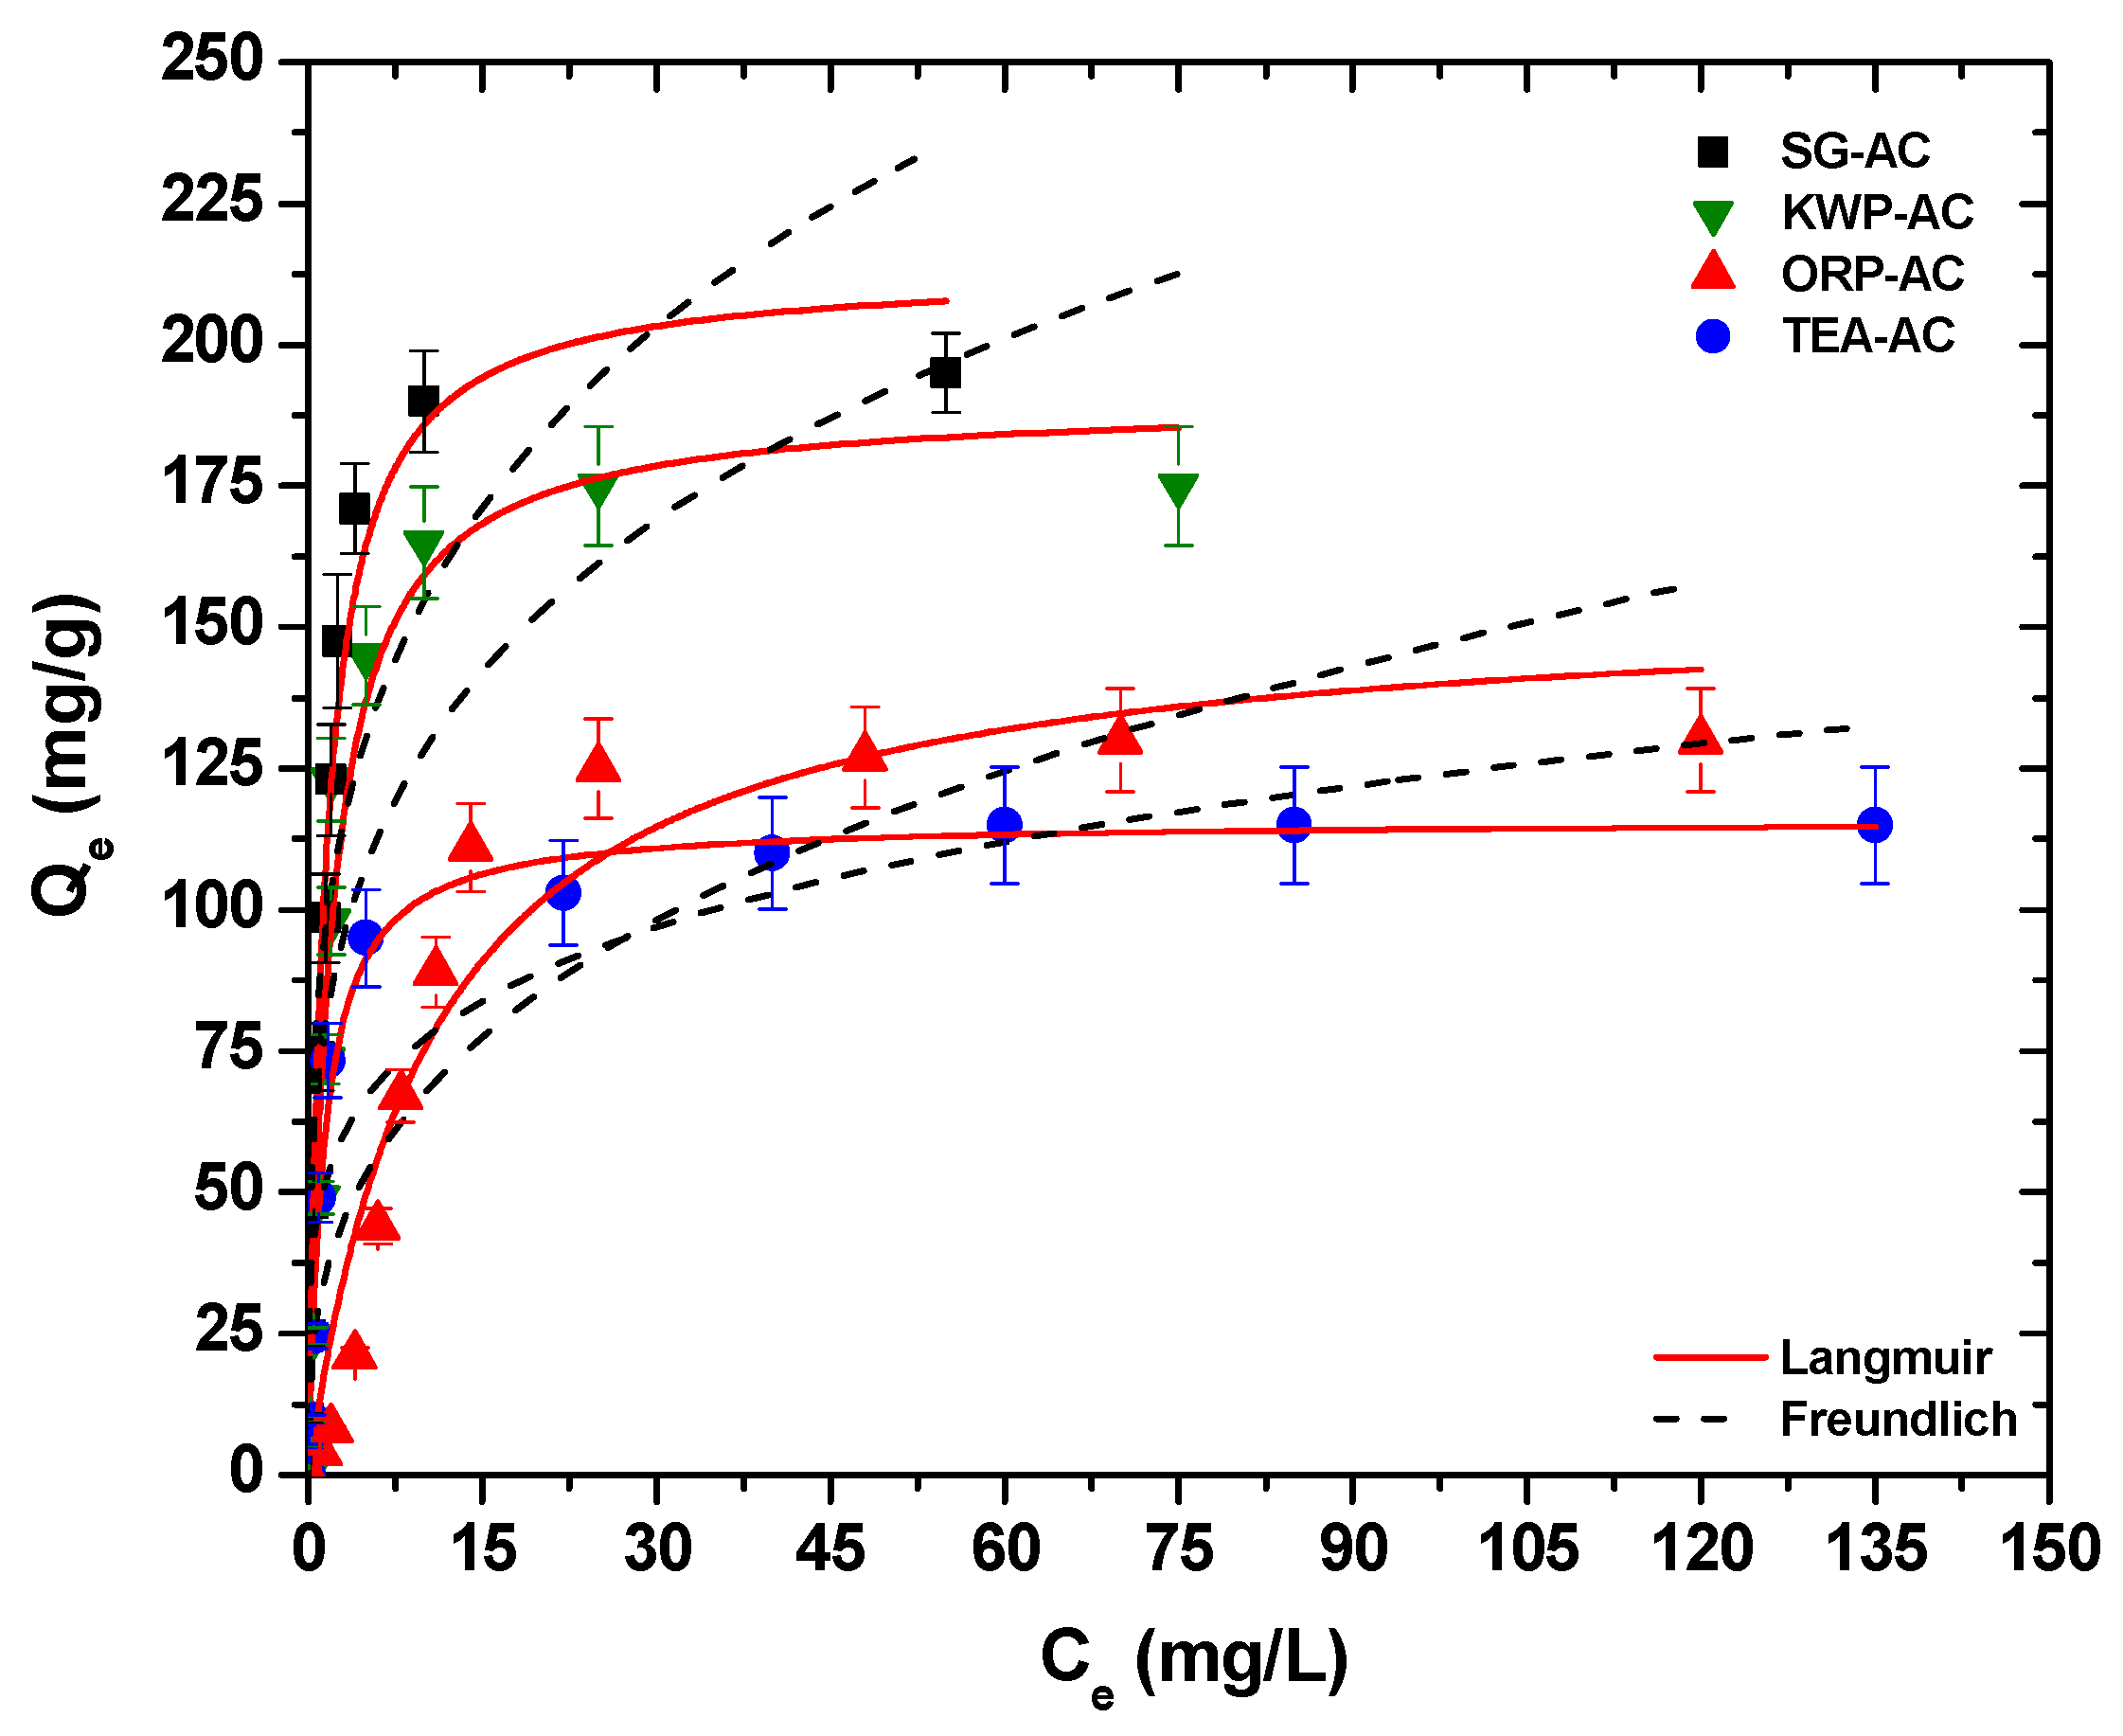
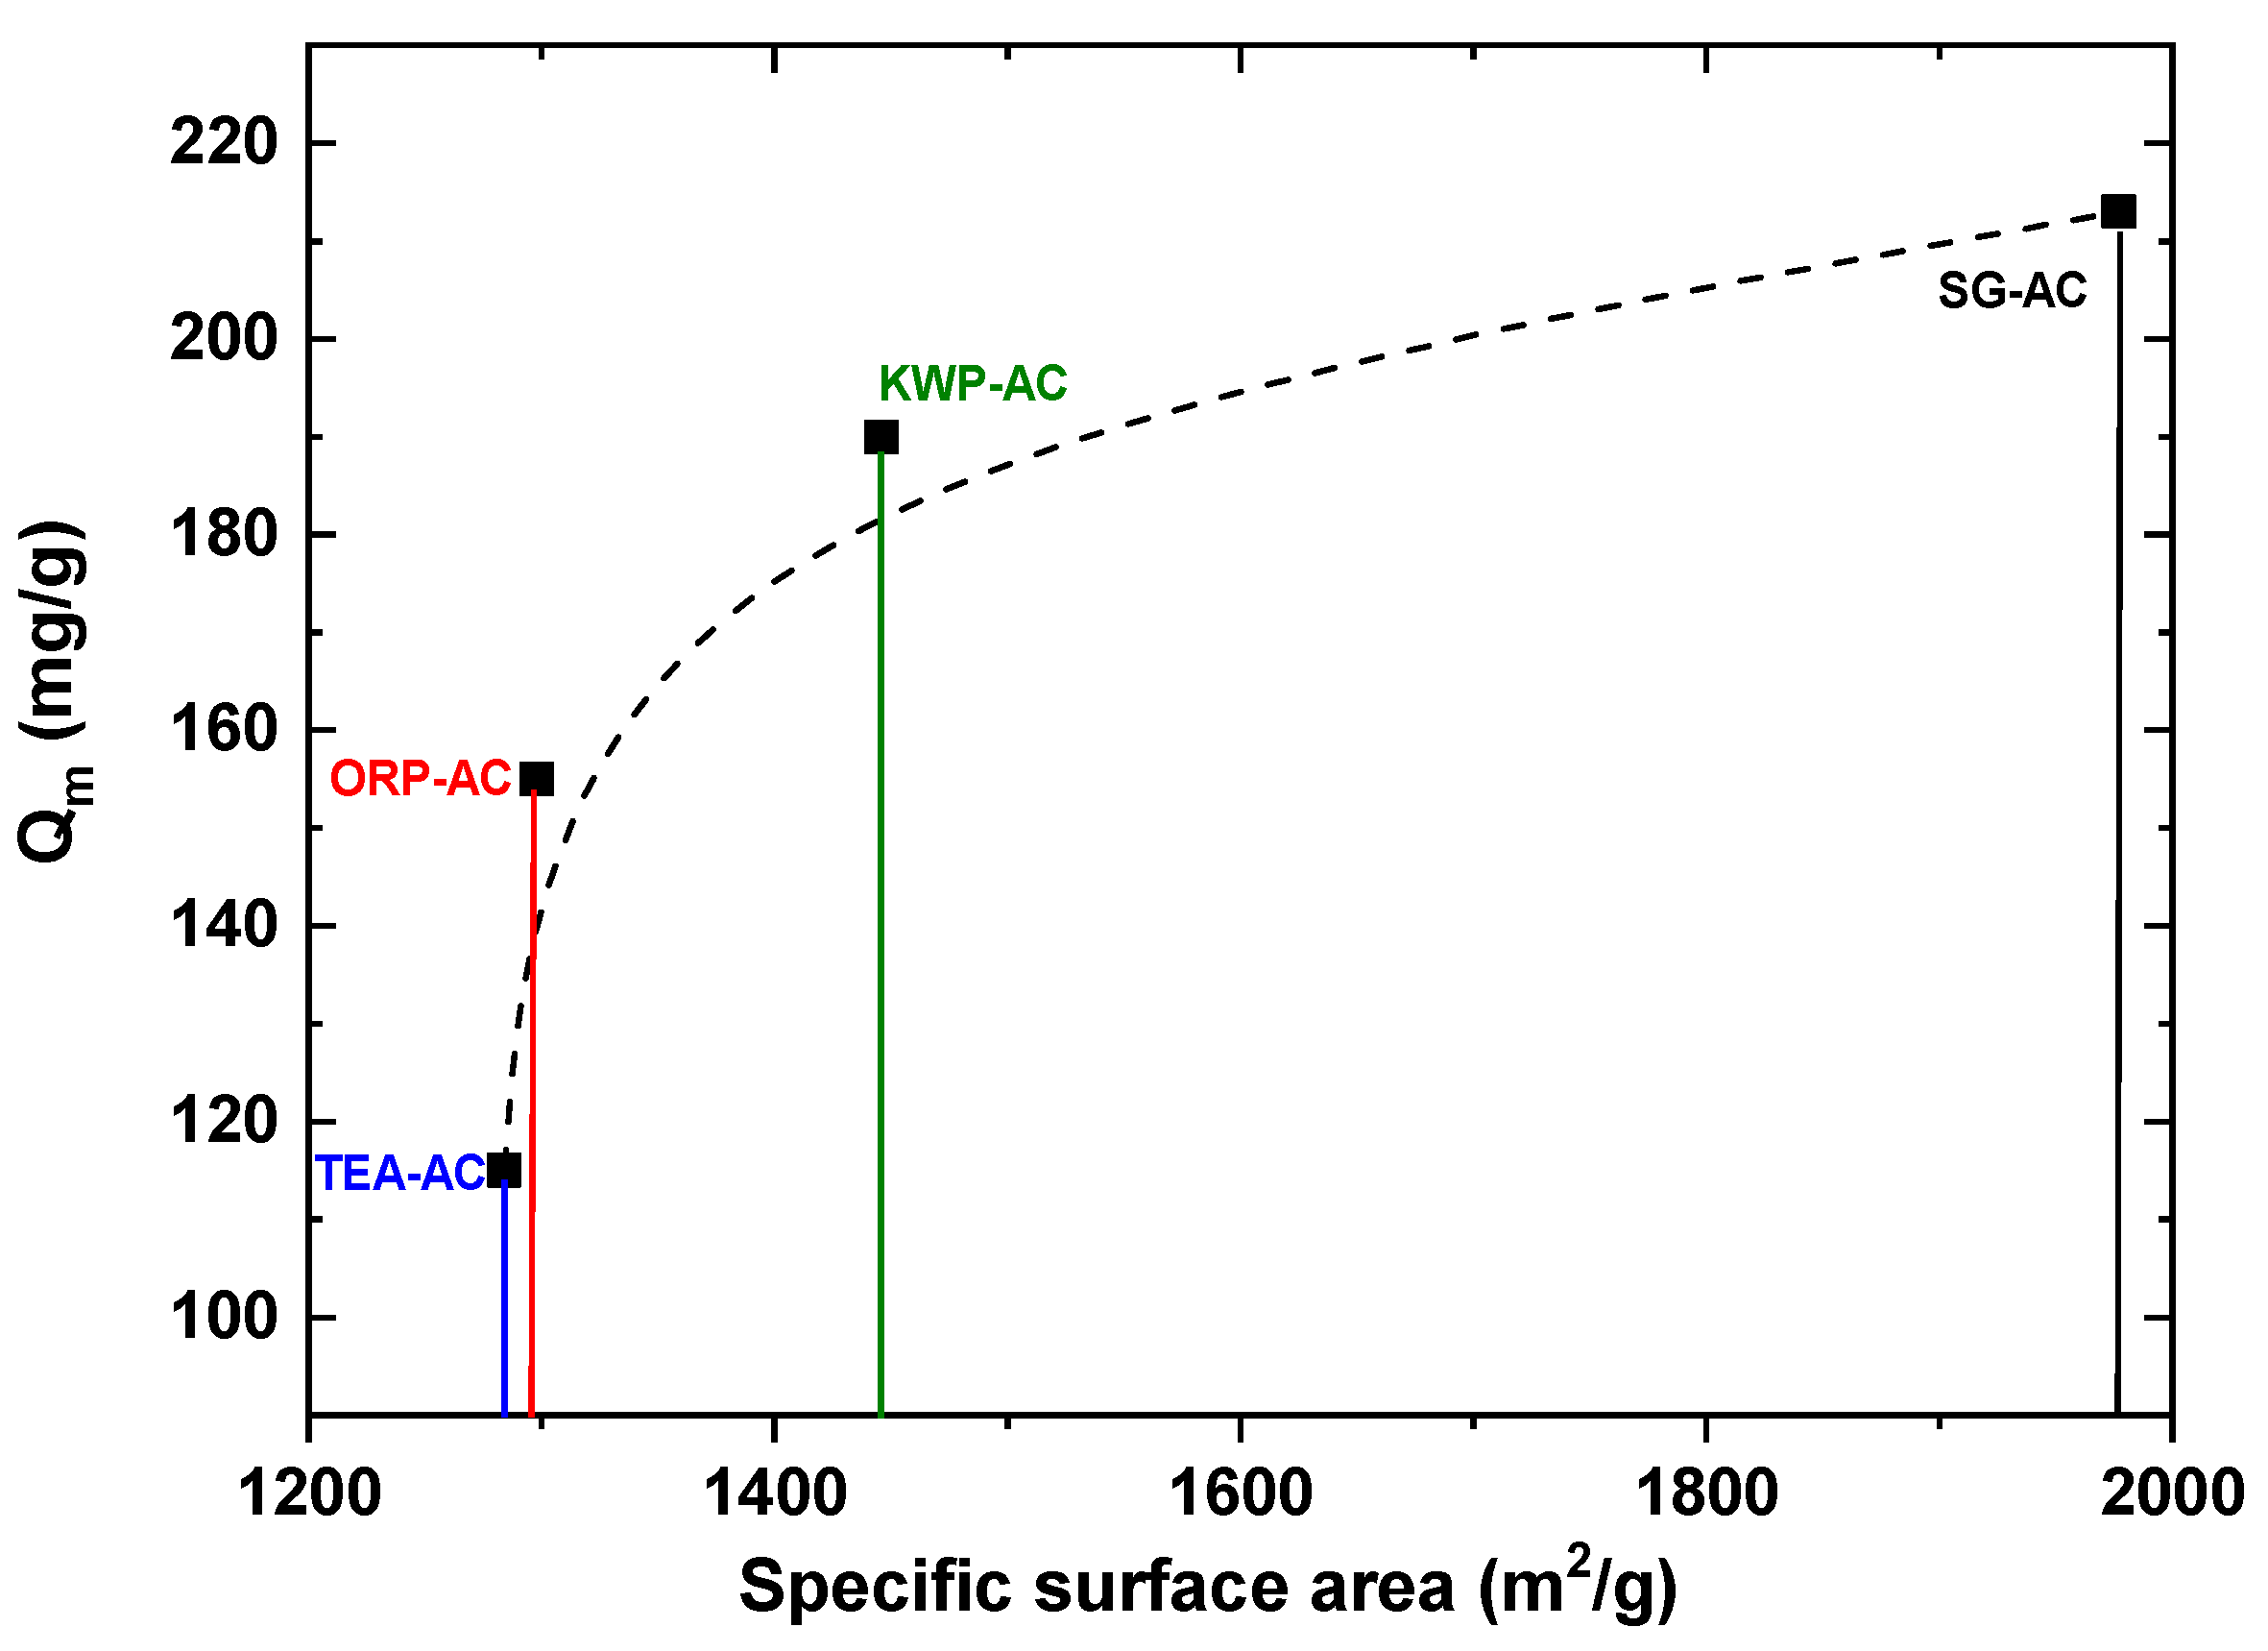
3.2.2. Equilibrium/Isotherms
4. Conclusions and Perspectives
Author Contributions
Funding
Institutional Review Board Statement
Informed Consent Statement
Data Availability Statement
Conflicts of Interest
References
- Liou, T.-H. Development of mesoporous structure and high adsorption capacity of biomass-based activated carbon by phosphoric acid and zinc chloride activation. Chem. Eng. J. 2010, 158, 129–142. [Google Scholar] [CrossRef]
- Acosta, L.; Galeano-Caro, D.; Medina, O.E.; Cortés, F.B.; Franco, C.A. Nano-Intermediate of Magnetite Nanoparticles Supported on Activated Carbon from Spent Coffee Grounds for Treatment of Wastewater from Oil Industry and Energy Production. Processes 2020, 9, 63. [Google Scholar] [CrossRef]
- Alam Ashik, M.; Hossain, A.; Hossain, D.; Johir, M.; Hossen, J.; Rahman, S.; Zhou, J.L.; Hasan, A.K.; Karmakar, A.K.; Ahmed, M.B. The Potentiality of Rice Husk-Derived Activated Carbon: From Synthesis to Application. Processes 2020, 8, 203. [Google Scholar] [CrossRef]
- Filho, A.V.; Kulman, R.X.; Tholozan, L.V.; De Almeida, A.R.F.; Da Rosa, G.S. Preparation and Characterization of Activated Carbon Obtained from Water Treatment Plant Sludge for Removal of Cationic Dye from Wastewater. Processes 2020, 8, 1549. [Google Scholar] [CrossRef]
- Hira, S.A.; Yusuf, M.; Annas, D.; Hui, H.S.; Park, K.H. Biomass-derived activated carbon as a catalyst for the effective degradation of Rhodamine B dye. Processes 2020, 8, 926. [Google Scholar] [CrossRef]
- Zhang, H.; Yan, Y.; Yang, L. Preparation of activated carbon from sawdust by zinc chloride activation. Adsorption 2010, 16, 161–166. [Google Scholar] [CrossRef]
- Khelfa, A.; Rodrigues, F.A.; Koubaa, M.; Vorobiev, E. Microwave-Assisted Pyrolysis of Pine Wood Sawdust Mixed with Activated Carbon for Bio-Oil and Bio-Char Production. Processes 2020, 8, 1437. [Google Scholar] [CrossRef]
- León, M.; Silva, J.; Carrasco, S.; Barrientos, N. Design, cost estimation and sensitivity analysis for a production process of activated carbon fromwaste nutshells by physical activation. Processes 2020, 8, 945. [Google Scholar] [CrossRef]
- Liu, Y.; Cheng, H.; He, Y. Application and Mechanism of Sludge-Based Activated Carbon for Phenol and Cyanide Removal from Bio-Treated Effluent of Coking Wastewater. Processes 2020, 8, 82. [Google Scholar] [CrossRef]
- Ahmadpour, A.; Do, D. The preparation of activated carbon from macadamia nutshell by chemical activation. Carbon 1997, 35, 1723–1732. [Google Scholar] [CrossRef]
- Rashidi, N.F.D.; Jamali, N.S.; Mahamad, S.S.; Ibrahim, M.F.; Abdullah, N.; Ismail, S.F.; Izhar, S. Effects of Alginate and Chitosan on Activated Carbon as Immobilisation Beads in Biohydrogen Production. Processes 2020, 8, 1254. [Google Scholar] [CrossRef]
- Yang, H.-C.; Lee, M.-W.; Eun, H.-C.; Kim, H.-J.; Lee, K.; Seo, B.-K. Thermal Decontamination of Spent Activated Carbon Contaminated with Radiocarbon and Tritium. Processes 2020, 8, 1359. [Google Scholar] [CrossRef]
- Ziganshina, E.E.; Belostotskiy, D.E.; Bulynina, S.S.; Ziganshin, A.M. Influence of Granular Activated Carbon on Anaerobic Co-Digestion of Sugar Beet Pulp and Distillers Grains with Solubles. Processes 2020, 8, 1226. [Google Scholar] [CrossRef]
- Anastopoulos, I.; Kyzas, G.Z. Agricultural peels for dye adsorption: A review of recent literature. J. Mol. Liq. 2014, 200, 381–389. [Google Scholar] [CrossRef]
- Heidarinejad, Z.; Dehghani, M.H.; Heidari, M.; Javedan, G.; Ali, I.; Sillanpää, M. Methods for preparation and activation of activated carbon: A review. Environ. Chem. Lett. 2020, 18, 393–415. [Google Scholar] [CrossRef]
- Luo, Y.; Guo, W.; Ngo, H.H.; Nghiem, L.D.; Hai, F.I.; Zhang, J.; Liang, S.; Wang, X.C. A review on the occurrence of micropollutants in the aquatic environment and their fate and removal during wastewater treatment. Sci. Total Environ. 2014, 473, 619–641. [Google Scholar] [CrossRef]
- Kurniawan, T.A.; Chan, G.Y.; Lo, W.-H.; Babel, S. Physico–chemical treatment techniques for wastewater laden with heavy metals. Chem. Eng. J. 2006, 118, 83–98. [Google Scholar] [CrossRef]
- Busca, G.; Berardinelli, S.; Resini, C.; Arrighi, L. Technologies for the removal of phenol from fluid streams: A short review of recent developments. J. Hazard. Mater. 2008, 160, 265–288. [Google Scholar] [CrossRef]
- Nabil, G.M.; El-Mallah, N.M.; Mahmoud, M.E. Enhanced decolorization of reactive black 5 dye by active carbon sorbent-immobilized-cationic surfactant (AC-CS). J. Ind. Eng. Chem. 2014, 20, 994–1002. [Google Scholar] [CrossRef]
- Chong, M.N.; Jin, B.; Chow, C.W.; Saint, C. Recent developments in photocatalytic water treatment technology: A review. Water Res. 2010, 44, 2997–3027. [Google Scholar] [CrossRef]
- Chenab, K.K.; Sohrabi, B.; Jafari, A.; Ramakrishna, S. Water treatment: Functional nanomaterials and applications from adsorption to photodegradation. Mater. Today Chem. 2020, 16, 100262. [Google Scholar] [CrossRef]
- Pandey, S.; Spiro, E.F.; Waanders, F.; Kumar, N.; Ray, S.S.; Kim, J.; Kang, M. Equilibrium, kinetic, and thermodynamic studies of lead ion adsorption from mine wastewater onto MoS2-clinoptilolite com-posite. Mater. Today Chem. 2020, 18, 100376. [Google Scholar] [CrossRef]
- Santoso, E.; Ediati, R.; Kusumawati, Y.; Bahruji, H.; Sulistiono, D.; Prasetyoko, D. Review on recent advances of carbon based adsorbent for methylene blue removal from waste water. Mater. Today Chem. 2020, 16, 100233. [Google Scholar] [CrossRef]
- Sharma, M.; Poddar, M.; Gupta, Y.; Nigam, S.; Avasthi, D.; Adelung, R.; Abolhassani, R.; Fiutowski, J.; Joshi, M.; Mishra, Y.K. Solar light assisted degradation of dyes and adsorption of heavy metal ions from water by CuO–ZnO tetrapodal hybrid nanocomposite. Mater. Today Chem. 2020, 17, 100336. [Google Scholar] [CrossRef]
- Mohanty, K.; Naidu, J.T.; Meikap, B.C.; Biswas, M.N. Removal of Crystal Violet from Wastewater by Activated Carbons Prepared from Rice Husk. Ind. Eng. Chem. Res. 2006, 45, 5165–5171. [Google Scholar] [CrossRef]
- Yorgun, S.; Yıldız, D. Preparation and characterization of activated carbons from Paulownia wood by chemical activation with H3PO4. J. Taiwan Inst. Chem. Eng. 2015, 53, 122–131. [Google Scholar] [CrossRef]
- Wang, J.; Kaskel, S. KOH activation of carbon-based materials for energy storage. J. Mat. Chem. 2012, 22, 23710–23725. [Google Scholar] [CrossRef]
- Kyzas, G.Z.; Deliyanni, E.A. Modified activated carbons from potato peels as green environmental-friendly ad–Sorbents for the treatment of pharmaceutical effluents. Chem. Eng. Res. Des. 2015, 97, 135–144. [Google Scholar] [CrossRef]
- Lees, J.A.; Hardy, J.; Revesz, T. Parkinson’s disease. Lancet 2009, 373, 2055–2066. [Google Scholar] [CrossRef]
- Barone, P.; Poewe, W.; Albrecht, S.; Debieuvre, C.; Massey, D.; Rascol, O.; Tolosa, E.; Weintraub, D. Pramipexole for the treatment of depressive symptoms in patients with Parkinson’s disease: A randomised, double-blind, place-bo-controlled trial. Lancet Neurol. 2010, 9, 573–580. [Google Scholar] [CrossRef]
- Allen, R.P.; Picchietti, D.; Hening, W.A.; Trenkwalder, C.; Walters, A.S.; Montplaisi, J. Restless legs syndrome: Diagnostic criteria, special considerations, and epidemiology: A report from the restless legs syndrome diagnosis and epidemiology workshop at the National Institutes of Health. Sleep Med. 2003, 4, 101–119. [Google Scholar] [CrossRef]
- Fernandez, M.E.; Nunell, G.V.; Bonelli, P.R.; Cukierman, A.L. Activated carbon developed from orange peels: Batch and dynamic competitive adsorption of basic dyes. Ind. Crops Prod. 2014, 62, 437–445. [Google Scholar] [CrossRef]
- Kurniawan, T.A.; Chan, G.Y.; Lo, W.-H.; Babel, S. Comparisons of low-cost adsorbents for treating wastewaters laden with heavy metals. Sci. Total Environ. 2006, 366, 409–426. [Google Scholar] [CrossRef] [PubMed]
- Hussain, S. Waste tea as a novel adsorbent: A review. Appl. Water Sci. 2018, 8, 1–16. [Google Scholar] [CrossRef]
- Sandoval, R.; Cooper, A.M.; Aymar, K.; Jain, A.; Hristovski, K. Removal of arsenic and methylene blue from water by granular activated carbon media impregnated with zirconium dioxide nanoparticles. J. Hazard. Mater. 2011, 193, 296–303. [Google Scholar] [CrossRef]
- Guo, Y.; Qi, P.S.; Liu, Y.Z. A Review on Advanced Treatment of Pharmaceutical Wastewater. IOP Conf. Ser: Earth Environ. Sci. 2017, 63, 012025. [Google Scholar] [CrossRef]
- Langmuir, I. The adsorption of gases on plane surfaces of glass, mica and platinum. J. Am. Chem. Soc. 1918, 40, 1361–1403. [Google Scholar] [CrossRef]
- Freundlich, H. Over the adsorption in solution. Z. Phys. Chem. 1906, 57, 385–470. [Google Scholar]
- Puzii, A.M. Methods of production, structure, and physicochemical characteristics of phosphorylated carbon adsorbents. Theor. Exp. Chem. 2011, 47, 277–291. [Google Scholar] [CrossRef]
- El-Hendawy, A.-N.A. Variation in the FTIR spectra of a biomass under impregnation, carbonization and oxi-dation conditions. J. Analy. Appl. Pyrol. 2006, 75, 59–166. [Google Scholar]
- Liu, Q.-S.; Zheng, T.; Wang, P.; Guo, L. Preparation and characterization of activated carbon from bamboo by microwave-induced phosphoric acid activation. Ind. Crop. Prod. 2010, 31, 233–238. [Google Scholar] [CrossRef]
- Mohammadi, S.Z.; Karimi, M.A.; Afzali, D.; Mansouri, F. Removal of Pb(II) from aqueous solutions using activated carbon from Sea-buckthorn stones by chemical activation. Desalination 2010, 262, 86–93. [Google Scholar] [CrossRef]
- Liu, H.; Wang, X.; Zhai, G.; Zhang, J.; Zhang, C.; Bao, N.; Cheng, C. Preparation of activated carbon from lotus stalks with the mixture of phosphoric acid and pentaerythritol impregnation and its application for Ni(II) sorption. Chem. Eng. J. 2012, 209, 155–162. [Google Scholar] [CrossRef]
- Kyzas, G.Z.; Deliyanni, E.A.; Matis, K.A. Activated carbons produced by pyrolysis of waste potato peels: Cobalt ions removal by adsorption. Colloids Surfaces A Physicochem. Eng. Asp. 2016, 490, 74–83. [Google Scholar] [CrossRef]
- Huang, Y.; Ma, E.; Zhao, G. Thermal and structure analysis on reaction mechanisms during the preparation of activated carbon fibers by KOH activation from liquefied wood-based fibers. Ind. Crops Prod. 2015, 69, 447–455. [Google Scholar] [CrossRef]
- Huang, L.; Sun, Y.; Wang, W.; Yue, Q.; Yang, T. Comparative study on characterization of activated carbons prepared by microwave and conventional heating methods and application in removal of oxytetracycline (OTC). Chem. Eng. J. 2011, 171, 1446–1453. [Google Scholar] [CrossRef]
- Sulistianti, I.; Krisnandi, Y.K.; Moenandar, I. Study of CO2 adsorption capacity of mesoporous carbon and activated carbon modified by triethylenetetramine (TETA). IOP Conf. Ser. Mat. Sci. Eng. 2017, 188, 012041. [Google Scholar] [CrossRef]
- Wang, Y.-T.; Lu, A.-H.; Zhang, H.-L.; Li, W.-C. Synthesis of Nanostructured Mesoporous Manganese Oxides with Three-Dimensional Frameworks and Their Application in Supercapacitors. J. Phys. Chem. C 2011, 115, 5413–5421. [Google Scholar] [CrossRef]
- Thommes, K.; Kaneko, A.V.; Neimark, J.P.; Olivier, F.; Rodriguez-Reinoso, J.; Rouquerol, K.S.W. Sing, Phy-sisorption of gases, with special reference to the evaluation of surface area and pore size distribution (IUPAC Tech-nical Report). Pure Appl. Chem. 2015, 87, 1051–1069. [Google Scholar] [CrossRef]
- Chandra, T.C.; Mirna, M.M.; Sunarso, J.; Sudaryanto, Y.; Ismadji, S. Activated carbon from durian shell: Prepa-ration and characterization. J. Taiwan Inst. Chem. Eng. 2009, 40, 457–462. [Google Scholar] [CrossRef]
- Molina-Sabio, M.; Rodriguez-Reinoso, F. Role of chemical activation in the development of carbon porosity. Colloids Surf. A Physicochem. Eng. Aspects 2004, 241, 15–25. [Google Scholar] [CrossRef]
- Kaipannan, S.; Nagarajan, S.; Manickavasakam, K.; Sathish, M. Orange Peel Derived Activated Carbon for Fab-rication of High-Energy and High-Rate Supercapacitors. ChemistrySelect 2017, 2, 11384–11392. [Google Scholar]
- Rivas-Cantu, R.C.; Mills, P.L.; Jones, K.D. A citrus waste-based biorefinery as a source of renewable energy: Technical advances and analysis of engineering challenges. Waste Manag. Res. 2013, 31, 413–420. [Google Scholar] [CrossRef] [PubMed]
- Ye, J.; Jin, J.; Liang, H.; Lu, J.; Du, Y.; Zheng, X.; Liang, Y.-R. Using tea stalk lignocellulose as an adsorbent for separating decaffeinated tea catechins. Bioresour. Technol. 2009, 100, 622–628. [Google Scholar] [CrossRef] [PubMed]
- Ji, L.; Chen, W.; Zheng, S.; Xu, Z.; Zhu, D. Adsorption of Sulfonamide Antibiotics to Multiwalled Carbon Nano-tubes. Langmuir 2009, 25, 11608–11613. [Google Scholar] [CrossRef] [PubMed]
- Li, S.; Zhang, X.; Huang, Y. Zeolitic imidazolate framework-8 derived nanoporous carbon as an effective and recyclable adsorbent for removal of ciprofloxacin antibiotics from water. J. Hazard. Mater. 2017, 321, 711–719. [Google Scholar] [CrossRef]
- Yu, F.; Sun, S.; Han, S.; Zheng, J.; Ma, J. Adsorption removal of ciprofloxacin by multi-walled carbon nanotubes with different oxygen contents from aqueous solutions. Chem. Eng. J. 2016, 285, 588–595. [Google Scholar] [CrossRef]
- Chen, H.; Gao, B.; Li, H. Removal of sulfamethoxazole and ciprofloxacin from aqueous solutions by graphene oxide. J. Hazard. Mater. 2015, 282, 201–207. [Google Scholar] [CrossRef]
- Ma, J.; Yang, M.; Yu, F.; Zheng, J. Water-enhanced Removal of Ciprofloxacin from Water by Porous Graphene Hydrogel. Sci. Rep. 2015, 5, srep13578. [Google Scholar] [CrossRef]
- Rajapaksha, A.U.; Vithanage, M.; Zhang, M.; Ahmad, M.; Mohan, D.; Chang, S.X.; Ok, Y.S. Pyrolysis condition affected sulfamethazine sorption by tea waste biochars. Bioresour. Technol. 2014, 166, 303–308. [Google Scholar] [CrossRef]
- Gao, Y.; Li, Y.; Zhang, L.; Huang, H.; Hu, J.; Shah, S.M.; Su, X. Adsorption and removal of tetracycline antibiotics from aqueous solution by graphene oxide. J. Colloid Interface Sci. 2012, 368, 540–546. [Google Scholar] [CrossRef] [PubMed]
- Kyzas, G.Z.; Kostoglou, M.; Lazaridis, N.K.; Lambropoulou, D.A.; Bikiaris, D.N. Environmental friendly tech-nology for the removal of pharmaceutical contaminants from wastewaters using modified chitosan adsorbents. Chem. Eng. J. 2013, 222, 248–258. [Google Scholar] [CrossRef]


| Wavelength (cm−1) | ||||
|---|---|---|---|---|
| Bond/Vibration | SG-AC | ORP-AC | TEA-AC | KWP-AC |
| P–H | 2285 | 2286 | 2295 | 2287 |
| N–H O | 2077, 1987, 1902 | 2083, 1992, 1892 | 2084, 1992, 1866 | 2085, 1988, 1842 |
| C=O or C=C * | 1554 | 1551 * | 1552 | 1552 * |
| –OH in C-OH | 1150 | 1150 | 1150 | |
| C–O | 1007 | |||
| C–H or O–H (οut-of-plane bending) | 877 | 876 | 877 | 878 |
| νO–H in OH (aromatic structures) | 613 | 614 | 615 | 612 |
| AC Sample | Surface Area (m2/g) | Micropore Surface Area (m2/g) | External Surface Area (m2/g) | Total Pore Volume (cm3/g) | Micropore Volume (cm3/g) | Mesopore Volume (cm3/g) |
|---|---|---|---|---|---|---|
| SG-AC | 1977 | 1226 | 751 | 1.382 | 0.563 | 0.819 |
| ORP-AC | 1298 | 340 | 928 | 1.421 | 0.152 | 1.270 |
| TEA-AC | 1284 | 922 | 361 | 0.784 | 0.439 | 0.345 |
| KWP-AC | 1446 | 976 | 471 | 0.815 | 0.454 | 0.361 |
| Langmuir Equation | Freundlich Equation | |||||
|---|---|---|---|---|---|---|
| Qm | KL | R2 | KF | n | R2 | |
| Material | mg/g | L/mg | mg1−1/n L1/n g−1 | |||
| SG-AC | 213 | 0.678 | 0.984 | 87.66 | 4.047 | 0.793 |
| ORP-AC | 155 | 0.094 | 0.929 | 47.73 | 4.800 | 0.856 |
| TEA-AC | 115 | 0.744 | 0.986 | 30.58 | 2.917 | 0.783 |
| KWP-AC | 190 | 0.517 | 0.968 | 72.02 | 3.988 | 0.788 |
| Langmuir Equation | Freundlich Equation | |||||
|---|---|---|---|---|---|---|
| SSE | SAE | ARE | SSE | SAE | ARE | |
| Material | (%) | (%) | ||||
| SG-AC | 855.91 | 77.79 | 6.00 | 11,271.08 | 321.99 | 18.30 |
| ORP-AC | 2145.58 | 136.67 | 9.66 | 6249.45 | 231.14 | 18.59 |
| TEA-AC | 320.24 | 45.33 | 2.39 | 3210.60 | 160.77 | 11.77 |
| KWP-AC | 1516.85 | 101.45 | 6.41 | 10,359.94 | 324.92 | 20.01 |
| Adsorbent | Compound | Qmax (mg/g) | References |
|---|---|---|---|
| Nanoporous carbon derived from MOFs | Ciprofloxacin | 417 | [56] |
| MWNTs with 4.7% oxygen content | Ciprofloxacin | 206 | [57] |
| Graphene oxide | Ciprofloxacin | 379 | [58] |
| Porous graphene hydrogel granules | Ciprofloxacin | 236 | [59] |
| Graphene oxide | Sulfamethoxazole | 240 | [58] |
| High-silica zeolite HSZ-385 | Sulfathiazole | 402 | [28] |
| Tea waste biochars | Sulfamethazine | 34 | [60] |
| Graphene oxide | Tetracyclines | 313 | [61] |
| Sulfonate grafted chitosan | Pramipexole | 337 | [62] |
| N-(2-carboxybenzyl) grafted chitosan | Pramipexole | 307 | [62] |
| Non-grafted cross-linked chitosan | Pramipexole | 181 | [62] |
| Activated carbon from potato peels (hydrothermal) | Pramipexole | 66 | [28] |
| Activated carbon from potato peels (pyrolyzed) | Pramipexole | 56 | [28] |
| SG-AC | Pramipexole | 213 | This study |
| KWP-AC | Pramipexole | 190 | This study |
| ORP-AC | Pramipexole | 155 | This study |
| TEA-AC | Pramipexole | 115 | This study |
Publisher’s Note: MDPI stays neutral with regard to jurisdictional claims in published maps and institutional affiliations. |
© 2021 by the authors. Licensee MDPI, Basel, Switzerland. This article is an open access article distributed under the terms and conditions of the Creative Commons Attribution (CC BY) license (http://creativecommons.org/licenses/by/4.0/).
Share and Cite
Liakos, E.V.; Rekos, K.; Giannakoudakis, D.A.; Mitropoulos, A.C.; Kyzas, G.Z. Carbonaceous Adsorbents Derived from Agricultural Sources for the Removal of Pramipexole Pharmaceutical Model Compound from Synthetic Aqueous Solutions. Processes 2021, 9, 253. https://doi.org/10.3390/pr9020253
Liakos EV, Rekos K, Giannakoudakis DA, Mitropoulos AC, Kyzas GZ. Carbonaceous Adsorbents Derived from Agricultural Sources for the Removal of Pramipexole Pharmaceutical Model Compound from Synthetic Aqueous Solutions. Processes. 2021; 9(2):253. https://doi.org/10.3390/pr9020253
Chicago/Turabian StyleLiakos, Efstathios V., Kyriazis Rekos, Dimitrios A. Giannakoudakis, Athanasios C. Mitropoulos, and George Z. Kyzas. 2021. "Carbonaceous Adsorbents Derived from Agricultural Sources for the Removal of Pramipexole Pharmaceutical Model Compound from Synthetic Aqueous Solutions" Processes 9, no. 2: 253. https://doi.org/10.3390/pr9020253
APA StyleLiakos, E. V., Rekos, K., Giannakoudakis, D. A., Mitropoulos, A. C., & Kyzas, G. Z. (2021). Carbonaceous Adsorbents Derived from Agricultural Sources for the Removal of Pramipexole Pharmaceutical Model Compound from Synthetic Aqueous Solutions. Processes, 9(2), 253. https://doi.org/10.3390/pr9020253