Abstract
This study aimed to determine the effects of osmotic dehydration on the kinetics of hot air drying of apricot halves under conditions that were similar to the industrial ones. The osmotic process was performed in a sucrose solution at 40 and 60 °C and concentrations of 50% and 65%. As expected increased temperatures and concentrations of the solution resulted in increased water loss, solid gain and shrinkage. The kinetics of osmotic dehydration were well described by the Peleg model. The effective diffusivity of water 5.50–7.387 × 10⁻⁹ m2/s and solute 8.315 × 10⁻¹⁰–1.113 × 10⁻⁹ m2/s was calculated for osmotic dehydration. Hot air drying was carried out at 40, 50, and 60 °C with air flow velocities of 1.0 m/s and 1.5 m/s. The drying time shortened with higher temperature and air velocity. The calculated effective diffusion of water was from 3.002 × 10⁻¹⁰ m2/s to 1.970 × 10⁻⁹ m2/s. The activation energy was sensitive to selected air temperatures, so greater air velocity resulted in greater activation energy: 46.379–51.514 kJ/mol, and with the osmotic pretreatment, it decreased to 35.216–46.469 kJ/mol. Osmotic dehydration reduced the effective diffusivity of water during the hot air drying process. It also resulted in smaller shrinkage of apricot halves in the hot air drying process.
1. Introduction
Apricot (Prunus armeniaca) is one of the most valued stone fruit species grown in the temperate climate zone due to its attractive appearance and distinctive aroma. It is a rich source of antioxidants, minerals, and vitamins. In addition to its fresh use, it is used for various forms of processing (drying, freezing, gelled products, compotes, juices, and alcoholic beverages). The production of dried fruit in the world in 2019 amounted to 2.8 million tons, which is 16% higher than ten years ago. Compared to other fruits, dried apricot production has been recorded with the largest increase and a share of about 40%. The world’s leading producer is Turkey, with 19% of total production, and the US with 12% [,,]. In Serbia, the consumption of dried apricots has gradually increased over the last years, and most of it is imported from Turkey and Iran. Domestic production of dried apricots is rather small due to a lack of knowledge of adequate technology. Given the significant production of fresh apricots in Serbia and the economic justification of the drying process, further research on the drying of domestic varieties should be encouraged [,].
The common apricot drying technology includes a pre-treatment with sulfurization and hot air drying. Sulfurization slows down enzymatic and non-enzymatic reactions as well as microbiological spoilage during long storage. However, sulfurization and hot air drying affect the sensory, nutritional, and physical properties of dried apricots, and they cause the reduction of phenolic compounds, carotenoids, and vitamin C [,,,,]. Recently, there has been a growing demand in the world for dried sulfur-free apricots with better functional properties. Osmotic dehydration (OD) as a pre-treatment for hot air drying (HAD) offers less sulfur and improves the qualitative properties of dried fruit [,].
Osmotic dehydration is the process of removing water from tissue immersed in concentrated aqueous solutions. The difference in osmotic pressures causes mass transfer between the fruit tissue and the osmotic agent. Two opposite flows appear: diffusion of water from fruit cellular tissue (water loss, WL) and diffusion of osmotic agent into cells (solid gain, SG). The intensity of mass transfer depends on the type of osmotic agent, temperature, and concentration of the osmotic solution, agitation speed, size and shape of the fruit, fruit maturity, and fruit to osmotic agent mass ratio. Various osmotic agents can be used: sucrose, glucose, fructose, maltodextrin, sorbitol, sodium chloride, and their combinations [,,,]. The structure of fruit tissue cells plays a significant role in the rate of mass transfer [,]. Acceleration of osmotic dehydration via cell structure can be achieved by applying thermal pretreatments such as freezing and blanching. Recent research has focused on the application of non-thermal pretreatments such as high hydrostatic pressure (HHP), ultrasound (US), or pulsed electrical field (PEF) [,,,]. Both groups of pretreatments, thermal, and non-thermal, cause changes in the cell structure which is a limiting factor for mass transfer.
Osmotically-treated fruit has been proved to have a positive effect on the preservation of the content of total phenolic compounds and vitamin C compared to non-treated fruit. Apricot cubes osmotically treated in a sorbitol solution showed better color retention compared to the non-treated ones [,,], as well as can help preserve the apricot shape, volume, and smooth surface during hot air drying []. Apricots treated osmotically in a sucrose solution presented lower water activity and lower glass transition temperature compared to untreated ones with the same water content []. In addition to the positive effects, OD also has some disadvantages. It requires an additional drying process, usually with hot air (HAD), to dry the product to a safe moisture content. The osmotic solution needs to be regenerated after some time. OD affects the reduction of the effective water diffusion coefficient in the additional drying process [].
Literature data on the kinetics of OD and HAD of apricots refers to the pieces of small fruit cut into regular geometric shapes, cubes, slices, cylinders [,,]. In industrial conditions, apricots are dried as a whole fruit or cut in half. Apricots up to 35 mm in diameter are dried as a whole fruit [], and those with a diameter over 35 mm require cutting in halves or other shapes. To the best of our knowledge there is no data in literature describing the combination of OD and HAD of apricot fruits in the form of halves. Additionally, OD experiments are typically performed in small-volume vessels that cannot represent the real process of mass transfer, which is also the case with HAD experiments [].
This study aims to determine the kinetics of OD as well as the influence of OD on mass transfer during HAD under conditions similar to the industrial ones. The research was performed on the apricot halves. During OD, the kinetics of water loss and solid gain, as well as the shrinkage by volume, length, width, and thickness were determined. Mathematical modeling of WL and SG kinetics was performed and the coefficients of effective diffusion of water and osmotic agent were calculated. During the HAD, mathematical modeling of the change in water content was done, the coefficients of effective water diffusion, activation energy, as well as the shrinkage of the volume, length, width, and thickness of apricot half were also determined.
2. Materials and Methods
2.1. Material
Fresh fruits of apricot (Prunus armeniaca L.) were harvested in the orchard of the University of Novi Sad, Faculty of Agriculture, Rimski šančevi (45°20′ N and 19°50′ E, 80 m a.s.l.), Serbia. The native variety from Novi Sad was chosen because of its presence in the domestic assortment [,]. The fruits were in full technological maturity with the following characteristics (average values): moisture content of fresh fruit 7.45 ± 0.34 kg H2O/kg d.m., length 50.9 ± 6.3 mm, width 49.0 ± 5.5 mm, thickness 44.7 ± 4.3 mm, whole fruit weight 60.6 ± 5.5 g, fruit strength 3.97 ± 0.32 kg/cm2, pH value 3.03 ± 0.12, and flesh ratio 94.49 ± 1.16%. The picked fruits were stored in a cooling chamber at a temperature of 4 °C and relative air humidity of 75% for a maximum of 48 h.
2.2. Methods
2.2.1. Cutting in Halves and Sulfurization
The fruits were washed in tap water in the laboratory and then cut longitudinally into two halves with a metal blade. The average dimensions of apricot halves were: length L1 = 50.9 ± 6.8 mm, width L2 = 49.0 ± 5.5 mm, thickness L3 = 22.0 ± 2.2 mm, volume 27.58 ± 5.70 cm3. Characteristic dimensions, length, width, and thickness were measured with vernier caliper (0–190 mm, ±0.05 mm, TMA MEBA, D-6-1, Prvomajska, Zagreb, Croatia). The halves were spread on plastic perforated trays 450 × 250 × 50 mm in size. A stainless steel metal chamber 2000 × 320 × 510 mm (or 0.327 m3) was used for dry sulfurization (SO2). About 40 kg of apricot halves with a bulk porosity of 40% were placed in the chamber leaving 0.23 m3 of space. Powdered sulfur was used and 0.75 g of sulfur per one kilogram of apricot halves was burned for 2 h [,]. After sulfurization, the halves were osmotically dehydrated. The dry matter content was determined by drying the samples at 105 °C in an oven (Sterimatic, ST-11, Instrumentaria, Zagreb, Croatia) to constant weight.
2.2.2. Osmotic Dehydration
The osmotic dryer of 0.034 m3 volume was used with a circulation pump and a heat exchanger []. The working fluid was sucrose dissolved in distilled water [,]. To avoid a decrease in osmotic pressure because of the diluted solution, the ratio of osmotic solution/material was 10:1 []. Osmotic dehydration was performed at two temperatures, 40 and 60 °C, and two concentrations of sucrose, 50 and 65% (w/w). About 4 kg of sulfurized apricot halves were placed in a perforated metal basket and immersed in the osmotic solution. Drying lasted 3 h with a constant solution flow rate of 0.01033 m/s (ultrasonic flow meter, Krohne, UMF 600P, Sensor A, Beverly, MA, USA). Before the beginning of each osmotic dehydration experiment, 30 apricot halves were selected and their mass (m0), length (L1(0)), width (L2(0)), thickness (L3(0)), and volume (V0) were measured. Every 20 min of the experiment, a sample of three halves was taken, the excess solution was carefully wiped with a paper towel, and then the measurements of mass (mτ), length (L1(τ)), width (L2(τ)), thickness (L3(τ)), volume (Vτ), and dry matter content were taken. The weight of the sample was measured on an analytical balance (0–200 g, 0.01 g ± 0.02 g, Kern, 440-33 N, Balingen, Germany). The dry matter content was determined by drying the samples at 105 °C in an oven (Sterimatic, ST-11, Instrumentaria, Zagreb, Croatia) to constant weight. The OD experiment was performed in three replicates of all factor combinations.
2.2.3. Hot Air Drying (HAD)
Pre-treatment samples OD1 (40 °C, 50%) OD2 (60 °C, 65%) and a control sample (without OD) were used to investigate the effect of OD on HAD. The prepared samples were placed in a tray-type tunnel dryer. The experiment of hot air drying was performed at 40, 50, 60 °C in a laboratory-scale dryer with 1.0 and 1.5 m/s air velocities. Two kilograms of apricot halves were arranged in a thin layer on four trays 440 × 290 mm in size. The specific load of the tray was 4 kg of apricot halves/m2. The spherical part of the half was laid down facing the tray, and the cut part of the half was laid turned upwards. Inlet air was 25 ± 1.4 °C and the relative humidity was 42 ± 7.8%. Before the experiment was started, the dryer was run empty for about 30 min to achieve the desired temperature and air velocity conditions. Drying with one combination of factors took 1380 min. Each combination of factors was repeated three times.
During the HAD process, the kinetics of the drying process was continuously measured and the following data were recorded: the mass of apricot halves, temperature of fruit, temperature of heated and surrounding air (dry and wet-bulb temperature). The change in the mass of the sample was measured using a mass sensor built into the dryer (HBM, Germany, model PW6CC3MR, measuring range 0–20 kg, accuracy ±2 g). The temperature of apricot halves was measured by placing the tip of a thermocouple (J-type) 5 mm below the upper surface and it was measured on three halves. The temperature of the surrounding hot air was measured with thermocouples (J-type). Mass and temperature sensors were connected to a measurement acquisition (National Instruments, USA, model NI 622225) which recorded data every 60 s. Air velocity was measured using dynamic pressure that was measured by employing a pitot tube and a differential micro manometer (Testo 506, Germany, measuring range 0–100 hPa, accuracy ±1 Pa). The dryer used in the experiment was described in detail in the previous paper []. At the beginning (τ = 0 min) and at the end (τ = 1380 min) of each HAD experiment, 10 apricot halves were selected and their mass (mτ), length (L1(τ)), width (L2(τ)), thickness (L3(τ)), and volume (Vτ) were measured.
2.2.4. Measuring of Volume and Shrinkage
The volume of the apricot halves was measured by immersing the halves into 96% ethanol and calculating the volume according to the following equation []:
where Vτ is the volume of the half (cm3), mτ is the mass of the half and fluid (ethanol) (g), m is the fluid mass (g), ρ is fluid density (g/cm3). One of the qualitative indicators of the drying process and the quality of the final product is the change in the volume and dimensions of the final product compared to the fresh material. Shrinkage of apricot halves was calculated with the following equations [,]:
where Sv(τ) is decrease in volume (−), V0 initial volume of apricot half (cm3), Vτ apricot half volume (cm3) at time τ. SL1(τ)—shrinkage in length (−), L1(0), L1(τ)—length (mm) at the beginning of process and at time τ, SL2(τ)—shrinkage in width (−),L2(0), L2(τ)—width (mm) at the beginning of process and at time τ, SL3(τ)—shrinkage in thickness (−), L3(0), L3(τ)—thickness (mm) at the beginning of process and at time τ.
2.2.5. Modeling of Osmotic Dehydration and Hot Air Drying
Following parameters describing the kinetics of the OD process were calculated []:
where WL is water loss (kg H2O/kg d.m.), SG is solid gain (kg d.m./kg i.d.m.; is initial dry matter), X0 is initial water content (kg H2O/kg d.m.), Xτ is water content (kg H2O/kg d.m.) at time τ of the process, md.m.(0) is the initial mass of dry matter (kg i.d.m.), md.m.(τ) is mass of dry matter (kg d.m.) at time τ of the process, m0 is the initial mass of the sample (kg), and mτ is mass of the sample (kg) at time τ of the process.
The Peleg model was used to describe the kinetics of OD based on WL and SG changes during the process []:
where τ is time (min) of drying, kw1 is Peleg’s parameter (min kg d.m./kg H2O), kw2 is Peleg’s parameter (kg d.m./kg H2O), kS1 is Peleg´s parameter (min kg i.d.m./kg d.m.), kS2 is Peleg´s parameter (kg d.m. initial/kg d.m.).
The moisture ratio (MR) and drying rate (ΔX/Δτ) were calculated using the following formulas to show the kinetics of the hot air drying process:
where X0 is the initial water content in the course of drying (kg H2O/kg d.m.), Xτ is water content (kg H2O/kg d.m.) at time τ of the process, Xeq—equilibrium water content (kg H2O/kg d.m.), τ—drying time (min). The equilibrium water content for all experimental units was 0.1 kg H2O/kg d.m. (≈10% wet base).
To select the best mathematical model that would describe the curves of hot air drying of apricot halves pretreated with osmotic dehydration, ten equations commonly used in literature were analyzed (Table 1).

Table 1.
Mathematical models applied to hot air drying curves.
2.2.6. Determination of Water and Solute Diffusivities
The coefficient of effective diffusivity of water and solute during OD and HAD, obtained from the drying data, represents an overall mass transfer property of water or solute in the material, which may include liquid diffusion, vapor diffusion, hydrodynamic flow, and other possible mass transfer mechanisms. Analytical solutions of the equations representative of mass transfer in terms of Fick’s law have been reported for geometrical shapes such as infinite slabs, infinite and finite cylinders, parallelepipeds, and spheres []. Nevertheless, several food products of hemispherical shape (mushrooms, coffee grains, halved potato, halved melons, halved apricots) are frequently modeled in this geometry [,]. For the hemispherical shape, more complex methods have been used based on finite element techniques to solve mass transfer in terms of Fick’s law [,]. In this study, the diffusivities of water and osmotic agent was calculated by applying the analytical solution for a infinite slab geometry [,]. The solutions to the second Fick’s law for infinite slab and a working medium of limited volume are the following equations for diffusions of water and solute [,]:
where the qi represents the non-zero roots of:
where WLeq is water loss at equilibrium (kg H2O/kg d.m.), SGeq is solid gain at equilibrium (kg d.m./kg d.m.initial), l—half thickness of slab/sample (m), De is the effective diffusivity of the water or solute (m2/s), α is the ratio of solution/sphere volumes. The WLeq and SGeq values were determined experimentally. For all combinations, three apricot halves were placed in a 500 cm3 vessel with osmotic agent and placed in an incubator (Sterimatic, ST-05, Instrumentaria, Zagreb, Croatia). The mass was measured every 24 h until equilibrium was reached, and then the dry matter content was measured. The measurement was done in three replicates.
For diffusivity of a infinite slab, Fourier number Deτ/l2 was set to be greater than 0.1; only the first term in Equation (10) is significant and other terms can be neglected, so Equation (10) can be, therefore, reduced to:
The value De of water and solute can be determined from the slope of the linear regression plotting −ln((1 − WL/WLeq)/C1] and −ln[(1 − SG/SGeq)/C1) versus τ.
The solution to Fick´s second law for the diffusion of an infinite slab in the media of unlimited volume resulted in the following equation for the transfer of water during hot air drying [,]:
where Deff water diffusivity coefficient (m2/s). For long drying processes, only the first term on the right side of the equation is taken into consideration and then the equation takes the following form [,]:
Only the first term in Equation (15) is significant and other terms can be neglected. The value Deff of water can be determined from the slope of the linear regression plotting lnMR versus τ.
2.2.7. Determination of Activation Energy
Activation energy (Ea) shows the sensibility of the diffusivity (Deff) to temperature. The greater value of Ea means more sensibility of diffusivity to temperature. The temperature dependence of effective diffusivity may be described by Arrhenius-type relationship as follows []:
where Ea is activation energy (kJ/mol), Do is the Arrhenius factor that is generally defined as the infinitely high temperature (m2/s), R is the universal gas constant (kJ/kmolK), and T is the absolute temperature (K). Ea is calculated using the right line that was obtained by linear regression between ln(Deff) and (1/T).
2.2.8. Experimental Design and Statistical Analysis of the Results
In this study, a set of randomized 2 × 3 factorial experiments with three replicates was performed to investigate:
- effects of concentration and temperature of the osmotic solution on the drying behavior of apricot halves during OD, the kinetics of water loss, solid gain, shrinkage, and diffusivity coefficients;
- effects of the OD process parameters on the drying behavior of apricot halves during HAD, kinetics, shrinkage, diffusivity coefficients, and activation energy.
The data obtained from experiments were analyzed using “Statistica” software, version 13 (TIBCO Software Inc., Palo Alto, CA, USA). The analysis of variance (ANOVA) was used to evaluate the difference between mean values of response. The Duncan´s multiple range test was performed and significant differences were observed at p < 0.05. The drying constants and coefficients in the models were determined by performing a non-linear regression analysis. “Statistica” software version 13 (TIBCO Software Inc., Palo Alto, CA, USA) was used for statistical analysis. The determination coefficient (R2), the root mean square error (RMSE), the reduced chi-squared (χ2), and coefficient residual variation (CRV) were used to evaluate the fitness of the models []:
where MRi.p is predicted dimensionless moisture ratio; MRi.e is experimental dimensionless moisture ratio; MRe is experimental mean dimensionless moisture ratio; N is number of observations; n is number of constants in the model equation; Y mean experimental values of WL, SG or MR. High R2 values, lower χ2, and RMSE indicate that the model fits well to the experimental data. The CRV values below 20% indicate that the model can be used for prediction.
3. Results
3.1. Osmotic Dehydration
Figure 1 shows the water loss (WL) of apricot halves during osmotic dehydration. After 180 min of process, the highest WL was recorded with the highest values of process parameters (60 °C, 65%) and it was 5.214 kg H2O/kg d.m., and the lowest value was 3.832 kgH2O/kg d.m. for the lowest temperature and smallest osmotic agent concentration (40 °C, 50%). During the first 60 min of the process, WL was most intense. Compared to the moisture content of apricot halves in the initial sample (8.304 kg H2O/kg d.m.), 30–44% of water was lost, and for the remaining 120 min another 17–18% was lost. A total of 180 min of osmotic dehydration reduced moisture content in the range of 47–62%. Based on the osmotic drying curves and depending on the process parameters, the lowest moisture content was 3.187 kg H20/kg d.m. recorded after 180 min of the process (Supplementary Figure S1). The evaluation of ANOVA (Table 2) showed the significance of both temperature and osmotic agent concentration for WL. The temperature of the solution had greater effect on WL, while the interaction of the factors was not statistically significant.
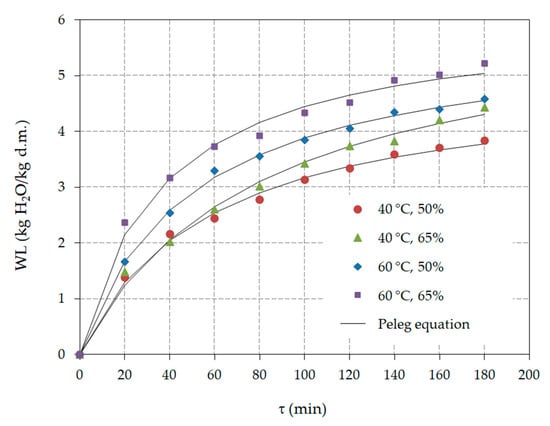
Figure 1.
Water loss (WL) during the osmotic dehydration process (process predicted based on Equation (6)).
Table 2.
Mass transfer parameters after 180 min of OD process.
Increase in solid gain (SG) is presented in Figure 2. After 180 min, depending on the process parameters, SG was: 0.565, 0.517, 0.478, 0.394 kg d.m./kg i.d.m., respectively, for samples treated at 60 °C, 65%, 60 °C, 50%, 40 °C, 65% and 40 °C, 50%. The highest SG was recorded in the first 40 min: 0.311, 0.222, 0.193, 0.166 kg d.m./kg i.d.m., respectively, for samples treated at 60 °C, 65%, 60 °C, 50%, 40 °C, 50%, and 40 °C, 65%. It continuously decreased until the end of the process.
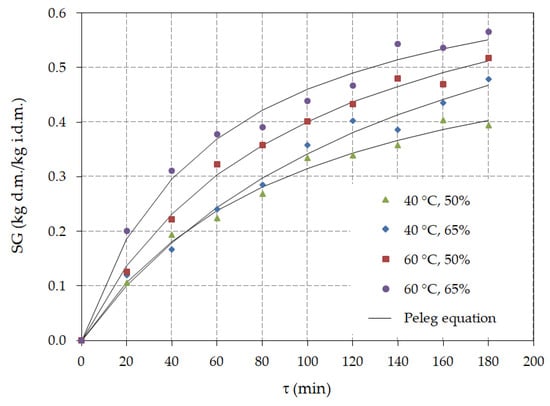
Figure 2.
Solid gain (SG) during the osmotic dehydration process (process predicted based on Equation (7)).
The ANOVA results (Table 2) confirmed the significance of temperature and osmotic agent concentration for SG. Statistically, temperature was more significant, while the interaction of factors was statistically less significant. The average volume of apricot halves before the OD process was 27.58 ± 5.71 cm3. The highest decrease in volume, a value of 0.331, was observed in the samples that were treated at the highest temperature and osmotic agent concentration, followed by the values of 0.238 (40 °C, 65%) and 0.205 (60 °C, 55%), and the smallest decrease in volume was 0.157 (40 °C, 50%). The results of ANOVA (Table 2) showed that the factors are statistically significant, as well as their mutual interaction.
The volumetric shrinkage of apricot halves was approximately linear with the duration of the OD process (Supplementary Figure S2). The measured dimensions confirmed uneven shrinkage of apricot halves (Supplementary Table S1). The ANOVA results confirmed the significance of temperature and osmotic agent concentration for shrinkage. The largest shrinkage occurred in thickness (SL3 = 0.226), then width (SL2 = 0.141), and the smallest shrinkage was in length (SL1 = 0.134).
The mathematical modeling of each process allowed us to calculate the values of the required parameters for any observed time. Table 3 shows the results of osmotic dehydration constants of the Peleg model for WL and SG, as well as the results of statistical analysis of OD modeling. In general, the Peleg model with calculated drying constants shows good fitting with experimental data; R2 is in the range of 0.9872–0.9985, and CRV is between 1.827 and 6.372%.
Table 3.
Parameters of mathematical modeling used for the description of changes in WL (kw1, kw2) and SG (ks1, ks2) with statistical analysis.
For WL models, the values of the Peleg model constants, kw1 and kw2 decrease with higher temperature, while higher osmotic agent concentration kw1 shows no dependence and the kw2 decreases. When modeling SG, the constants ks1 and ks2 decrease with increasing temperature, and the dependence was not determined with different concentrations. Fitting the WL with Equation (6) is shown in Figure 1, and SG with Equation (7) in Figure 2.
Table 4 shows the values of diffusion coefficient of water (Dew) and solute (Des) calculated with Fick’s model (Equations (10)–(13)). The Dew values range from 5.50 × 10⁻⁹ m2/s to 7.387 × 10⁻⁹ m2/s. The coefficients of determination (R2) have values >0.9. The values of Des range from 8.315 × 10⁻¹⁰ m2/s to 1.113 × 10⁻⁹ m2/s, and R2 is within a range of 0.8831–0.9527. Higher temperature and osmotic agent concentration caused higher values of water and solute diffusivity.
Table 4.
Water and solute diffusivities during osmotic dehydration calculated by Fick´s model.
3.2. Hot Air Drying
The moisture content of apricot halves in the control group was 8.295 kg H2O/kg d.m. at the beginning of the drying process (τ = 0 min), and in osmotically dehydrated samples it was 4.108 kgH2O/kg d.m. (OD1) and 3.148 kgH2O/kg d.m. (OD2). It was noticed that with increased air temperature and air velocity, the drying process was more intense for all experimental units. At the end of the hot air drying process, at τ = 1380 min, the lowest recorded level of moisture content was achieved in the control sample 0.0751 kg H2O/kg d.m. (60 °C, 1.5 m/s), as well as the smallest decrease in the moisture content, 1.050 kg H2O/kg d.m. (40 °C, 1.0 m/s). In osmotically dehydrated samples, final moisture content in the range of 0.129–0.729 kg H2O/kg d.m. (OD1) and 0.256–0.764 (OD2) was recorded (Supplementary Figures S3 and S4).
The hot air drying kinetics of untreated, OD1-treated and OD2-treated apricot halves are shown in the form of moisture ratio (MR) in Figure 3, Figure 4 and Figure 5, respectively. The control sample (Figure 3) achieved the set equilibrium moisture ratio values at an air temperature of 60 °C and air velocity of 1.5 m/s for τ = 1230 min. At the end of the process, at the same temperature and lower air velocity, 1.0 m/s, the sample needed only 1.2% of moisture ratio to reach the equilibrium value of the moisture content.
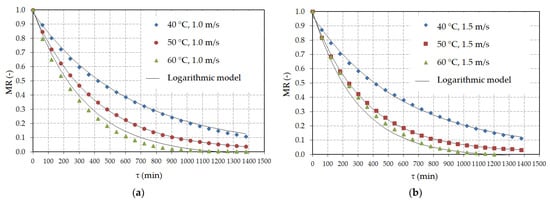
Figure 3.
Drying curves of the hot air drying process of the control group (fresh apricot halves): (a) air velocity 1.0 m/s, (b) air velocity 1.5 m/s.
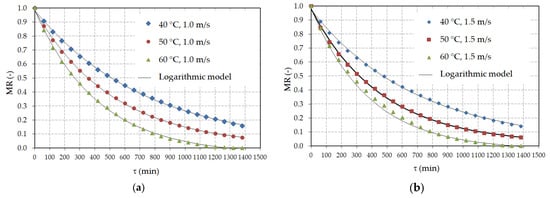
Figure 4.
Drying curves of the hot air drying process of the apricot halves with osmotic pretreatment OD1 (40 °C, 50%): (a) air velocity 1.0 m/s, (b) air velocity 1.5 m/s.
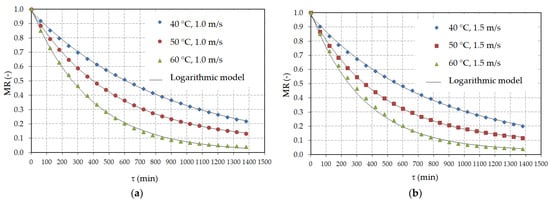
Figure 5.
Drying curves of the hot air drying process of the apricot halves with osmotic pretreatment OD2 (60 °C, 65%): (a) air velocity 1.0 m/s, (b) air velocity 1.5 m/s.
Air temperature increase from 40 °C to 60 °C accelerates the drying process in the range of 11.72–17.70% in all experimental units. A particularly evident effect of air temperature on the drying speed was observed in osmotically dehydrated samples. As for the samples treated with OD2, increased air temperature reduced the water content from 15.38–17.70%, and for OD1, 13.34–15.82%. In the control group, the increase in temperature affected the rate of reaching the equilibrium moisture content of ≈11.72%.
Increased air velocity, from 1.0 to 1.5 m/s, accelerated the drying process by 0.41–1.80% for all experimental units. A slightly higher effect of air velocity on the drying rate was observed in osmotically-treated samples compared to the control group: 0.67–1.80% for OD1, 0.7–1.61% for OD2, and 0.41% for the control group.
Osmotic pretreatment slowed down the drying process of apricot halves. At the end of the hot air drying process, OD samples had smaller reduction in MR compared to the control group: 3.91–9.9% for OD2, and 0.07–4.04% for OD1. More pronounced slowing of the drying process was observed in the samples with OD2 pretreatment.
The decrease in shrinkage (Sv) of apricot halves was in the range of 0.628–0.903. The OD apricot halves exerted less shrinkage compared to the control group, 0.628–0.765 and 0.804–0.903, respectively. Shrinkage in size (SL1, SL2, SL3) corresponds to the trend of Sv. It was observed that apricot halves shrank most in their width (SL3), and least in the length (SL1). It can be concluded that the drying air velocity is not statistically significant for shrinkage (Supplementary Table S2).
The influence of OD on the drying rate for the HAD process is shown in Figure 6 for the selected process parameters. With the same moisture content values, the most intensive drying rate was achieved with the control sample.
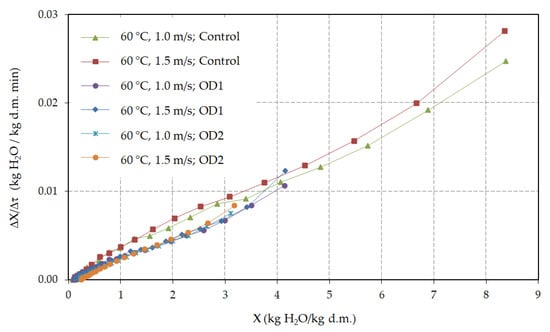
Figure 6.
Drying rate of apricot halves during HAD for the air temperature of 60 °C; 1.0 and 1.5 m/s air velocity.
Drying speed for apricot halves with OD1 and OD2 pretreatments was approximately the same up to moisture content of ≈1.0 kg H2O/kg d.m. (τ ≈ 600 min). However, in the later drying stage, the speed decreased in OD2 compared to OD1. The influence of air velocity on the drying kinetics was more pronounced in the control sample than in OD1 and OD2 up to a moisture content level of ≈1.0 kg H2O/kg d.m., after which this influence was insignificant.
Figure 7 shows the temperatures of apricot halves (tm) measured at a depth of ≈5 mm from the upper surface and for the selected HAD process parameters. There was a difference between temperature of the control and both OD1 and OD2 treated samples, even with the same material moisture content of the samples. Higher inner temperatures were achieved with the control sample. Temperature differences decreased as the moisture content reached equilibrium. Increased air velocity caused faster heating of the apricot halves.
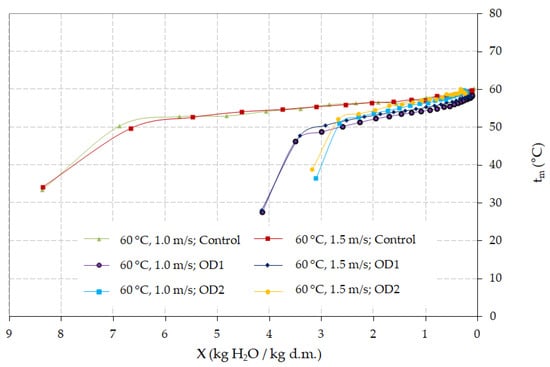
Figure 7.
Temperature of apricot halves during HAD at 60 °C; 1.0 and 1.5 m/s air velocity.
The results of regression analysis of the ten studied models used to describe the kinetics of hot air drying of apricot halves with osmotic pretreatment, and the control group are summarized in Table 5 and Table S3. The analysis of results shows that all applied models have a good fit of the experimental results. The coefficient of determination (R2) for all drying regimes is in the range from 0.9895–0.9999. The mean-square error (RMSE) and the values of the reduced test (χ2) are small, 0.00119–0.02502, and 0.000002 and 0.00068, respectively. Additionally, the values of the coefficient of residual variation (CRV) are small for all regimes, 0.26–7.87%. The drying kinetics was, for standardization reasons, modeled with the logarithmic model, which gives the best overall results. For all experimental units, the logarithmic model gave results for the coefficient of determination (R2) in the range of 0.9981–0.9999, a maximum mean-square error (RMSE) of 0.0108, and a reduced test of 0.00013 (Table 5).
Table 5.
Statistical analysis of logarithmic model used to describe the kinetics of hot air drying of fresh and osmotically-pretreated apricot halves.
In a few experiments had slightly better matching values that were obtained by using the Diffusion Approach and Page models. The coefficients of logarithmic model are given in Table 6, and other evaluated models are presented in Table S4 (Supplementary File, Tables S4–S12).
Table 6.
The coefficients of Logarithmic model used to describe the kinetics of hot air drying of fresh and osmotically-pretreated apricot halves.
The results of effective moisture diffusivity (Deff) of the apricot halves during the HAD process are shown in Table 7 together with the coefficient of determination (R2), from 3.002 × 10⁻¹⁰ to 1.970 × 10−90 m2/s and from 0.887 to 0.999, respectively. It can be concluded that the highest values of effective moisture diffusivity were achieved by the control samples, followed by the OD1 pretreated samples, and finally, the lowest value was recorded for OD2 ones. An increase in the value of the effective diffusivity of moisture was observed in all experimental units when the temperature and air velocity increased. The air temperature had a greater influence than air velocity on the increase in Deff values. Osmotic pretreatment influenced the decrease of Deff values: higher values of osmotic dehydration, temperature, and concentration of the osmotic agent caused Deff to decrease.
Table 7.
The effective moisture diffusivity coefficients during hot air drying calculated by Fick´s model.
The activation energy for all experimental units is in the range of 35.216 kJ/mol to 51.514 kJ/mol (Table 8). Osmotic pretreatment lowered the activation energy value with respect to the control sample. Additionally, greater air velocity intensified the drying process, which led to higher activation energy.
Table 8.
The activation energy for the apricot halves during the HAD process.
4. Discussion
Increased temperatures and concentrations of the osmotic solution resulted in higher water loss and solid gain in the apricot halves. In fact, an increase in the solution concentration cause a rise in osmotic pressure, while an increase in the temperature of the osmotic agent can affected the permeability of the cell wall and the viscosity of water and osmotic agent, thus enabling water to pass more easily through the cell tissue and the agent to penetrate more easily into the apricot halves [,,,,]. The measured values of WL and SG are in accordance with the results of other authors for the osmotic drying of apricot slices [], apricot cubes [], and apple cubes []. The results of the statistical analysis (Table 2) prove the influence of both factors on the rate of mass transfer, but the temperatures of the osmotic agent gave a more significant difference. Khoyi and Hesari [] points out that, for the mass transfer rate, the agent’s temperature is statistically more significant than the concentration, when drying apricot slices in sucrose solution at a temperature from 30–60 °C and the concentration of 50–70%. Togrul and Ispir [] came to the same conclusion when drying melon cubes.
The choice of process parameters depends on the WL/SG ratio (Table 2). Their ratio is chosen according to the desired characteristics of the finished product. In order to produce dried fruit with minimal addition of sugar, the most favorable ratio of the said process parameters for osmotic dehydration of apricot halves is 40 °C and 50% (WL/SG = 9.711). Khoyi and Hesari [] recommend 50 °C temperature and 60% concentration for apricot slices drying due to high WL and low SG. They also point out better solution viscosity, lower production costs and less technical problems at the plant.
The calculated values of the effective diffusivity of water Dew and solute Des (Table 4), for WL and SG, are in agreement with the results of other authors who osmotically dehydrated the fruit in sucrose solution, at a similar range of temperatures and osmotic agent concentrations. The authors recorded the following values: apricot slices []: 0.61 × 10⁻¹⁰–4.06 × 10⁻¹⁰ m2/s for WL and 7.69 × 10⁻⁹–3.13 × 10⁻⁹ m2/s for SG; apricot halves []: 0.751 × 10⁻¹⁰–1.25 × 10⁻¹⁰ m2/s for WL and 0.69 × 10⁻¹⁰–1.21 × 10⁻⁹ m2/s for SG; apple cubes []: 1.98 × 10⁻¹⁰–2.48 × 10⁻⁹ m2/s for WL and 2.340 × 10⁻¹⁰–1.228 × 10⁻¹⁰ m2/s for SG; melon cubes []: 1.11 × 10⁻¹⁰–3.10 × 10⁻⁹ m2/s for WL and 1.02 × 10⁻¹⁰–2.46 × 10⁻¹⁰ m2/s for SG.
The greatest volumetric shrinkage was recorded in the samples dried at a temperature of 60 °C and osmotic agent concentration of 65%. The measured dimensions confirmed uneven shrinkage of apricot halves (Supplementary Table S1). The largest shrinkage occurred in thickness, then width, and the smallest shrinkage was observed in length. Figure 8 shows a cross-section of an apricot half with changes in size and mass transfer during OD. The solid and dotted lines indicate the dimensions before and after the OD process, respectively. As already mentioned, the intensity of WL and SG depends on the state of the cell wall [,,,]. When the apricot fruit was cut and stone removed, surfaces F(1) and F(2) were formed. The surface F(1) was with the damaged mesocarp tissue due to cutting, so the cells were more permeable for water and agent molecules. The surface F(2) consists of parenchyma cells and the cell wall is semi-permeable []. The F(3) surface contains cells of the epidermal tissue whose natural role is to protect the fruit from external influences. Uneven shrinkage in size (SL1(0−τ) < SL2(0−τ) < SL3(0−τ)) was a consequence of uneven water loss on the observed surfaces. The largest loss was marked on F(1), then F(2), and the smallest loss was on F(3), WL(1) > WL(2) > WL(3). Additionally, SG had the same trend: SG(1) > SG(2) > SG(3). Similar results have been reported by other researchers who discovered that the shrinkage was more pronounced in the cells that were closer to the surface of mass transfer and whose cell wall structure changed than inside the tissue [,,,,].
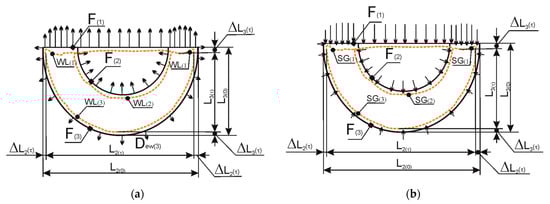
Figure 8.
Cross-section of the apricot halves with shrinkage and mass transfer during osmotic dehydration: (a) Water loss (WL); (b) Solid gain (SG). F(1)—Surface after cutting; F(2)—Surface after the stone was removed; F(3)—Surface; L2(0), L2(τ)—Width of apricot half at the beginning of process and at time τ; L3(0), L3(τ)—Thickness of apricot half at the beginning of process and at time τ; WL(1), WL(2), WL(3)—Water loss through surfaces F(1), F(2), F(3); SG(1), SG(2), SG(3)—solid gain through surfaces F(1), F(2), F(3); Δ—difference; → direction of water and solute diffusion, ▪▪▪▪—dash line dimensions after OD.
The Peleg model was chosen to predict osmotic dehydration. High coefficients of determination (R2) were obtained for both WL and SG, but the values were higher for WL due to the greater variability of experimental data in SG (Table 3). This was also reflected in higher values of the prediction error indicator (χ2) of RMSE and CRV. Good matching of the data obtained with the Peleg model for the prediction of osmotic drying was also reported by other authors, for apricot slices [], apple cubes [], and melon cubes [].
The drying rate was the highest for the control sample due to the difference in initial moisture content and the presence of osmotic agent in the treated samples (Figure 6 and Figures S3 and S4, Supplementary File). The figure (Figure 6) shows that the drying rate was not constant, and the speed was decreasing throughout the process. This indicates a dominant physical-mechanical diffusion of water in the fruit []. After OD1 lasting for 180 min, the moisture content in samples was 4.108 kg H2O/kg d.m., while the control sample developed this moisture content in 220 min at 60 °C and air velocity of 1.0 m/s. After OD2, the samples had a moisture content of 3.148 kg H2O/kg d.m., and the control sample achieved this moisture content in 315 min at 60 °C and air velocity of 1.0 m/s. This means that osmotic dehydration had higher drying rate in the first 180 min of the process compared to HAD. The duration of the HAD process was affected more by higher temperature than air velocity. The results of other authors confirm this conclusion [,].
The shrinkage measurement after HAD confirmed greater shrinkage of apricot halves in the control group compared to the osmotically-dehydrated samples (Table S2, Supplementary File). The authors [,] reported a positive effect of osmotic pretreatment on apple slices shrinkage; the treated samples shrank less than the control group after HAD. Figure 9 shows a cross-section of the apricot half with changes in size and mass transfer. The solid line shows the dimensions of the halves before HAD, and the dotted line shows dimensions after drying.
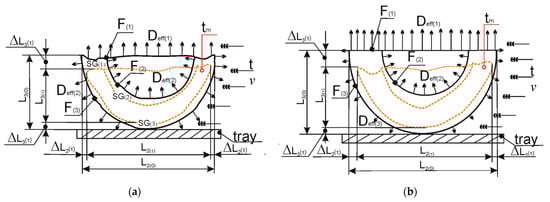
Figure 9.
Cross-section of the apricot halves with shrinkage and mass transfer during HAD: (a) with OD pretreatment, (b) Control group. F(1)—Surface after cutting; F(2)—surface after the stone was removed; F(3)—Surface; L2(o), L2(τ)—Width of apricot half at the beginning of the process and at time τ; L3(o), L3(τ)—Thickness of apricot half at the beginning of the process and at time τ; Deff(1), Deff(2), Deff(3)—diffusion of water through surfaces F(1), F(2), F(3); Δ—difference; ▪▪▪▪—dash line, dimensions after HAD; tm—the temperature of apricot halves at a depth of 5 mm; t—hot air, v—air velocity; «—airflow flow direction; → direction of water diffusion on surfaces F(1), F(2), F(3).
During the HAD process, the transfer of moisture from the surface of apricot halves into the air and the diffusion of water molecules through the tissue and towards the transfer surface was more intense in the control sample (Figure 6 and Figure 8b). The layers of cells that make up the surface F(1) had the highest transfer of moisture into the air, followed by the surface F(2), and the slowest transfer of moisture was from the surface F(3). In the control sample, at the beginning of the HAD process, due to the increased moisture content that was capillary bound, the evaporation process took place on the surfaces F(1), F(2), and F(3); during the evaporation process, it moved towards the interior of the apricot half. The layers of tissue cells that were closer to the surface were drier than the layers that were further away; the temperature of the material increased (Figure 7), and the volume decreased. The fast transition of the evaporation area towards the center caused the outer layers to dry out and the inner layers of the cells to be wetter, so an uneven field of moisture was formed in the material. Different moisture content between the cell layers that were made of surfaces F(1), F(2), and F(3) influenced the measured shrinkage intensity (SL3(0−τ) > SL2(0−τ) > SL1(0−τ)). Internal stresses were formed between the layers and greater deformation of the initial shape was observed in the control sample compared to the OD samples (Supplementary Table S2). More uniform drying of surfaces F(1), F(2), and F(3) was achieved in apricot halves pretreated with OD due to the presence of osmotic agent molecules in the tissue, in the order as follows SG(1) > SG(2) > SG(3) (Figure 8b). At the beginning of drying of OD samples, the halves that were smaller in size provided a shorter path for the diffusion of water molecules, which also affected the formation of a homogeneous moisture field inside the half. Consequently, the tissue temperature at a depth of 5 mm increased more slowly in the samples treated with OD compared to the control sample (Figure 7). The same results of temperature measuring were reported by the authors for drying apricots [] and banana slices []. Over drying of surface layers was less pronounced in OD samples. The lower temperature of the material is a consequence of the heat consumption to break the newly formed bonds between the dry matter, osmotic agent, and moisture in the apricot tissue. This forms the moisture bound by adsorption whose higher share reduces the value of water activity [].
Some semi-theoretical drying models that have been commonly used to describe the slow drying time in the literature are Newton, the Henderson and Pabis, the logarithmic, the Page model, and others (Table 1). These models are generally derived by simplifying general series solutions of Fick´s second law and considering a direct relationship between the average water content and drying time [,,,]. They neglect the fundamentals of the drying process and their parameters have no physical meaning. The logarithmic model gives the highest values of R2 and lowest of χ2, RMSE, and CRV (Table 5 and Supplementary File Table S3). It is also observed that the consistency of fitting the drying data into the model is very good for all of the experimental drying air conditions. Thus, the model can be assumed to represent the drying behavior of fresh and osmotically-treated apricot halves. The logarithmic model also describes the air drying curve of whole apricot [] with a correlation coefficient of 0.991.
Within the scope of applied pretreatments, temperature, and drying air velocity, the calculated effective diffusion coefficient (Deff) includes water diffusion in the tissue and external convective moisture transfer. The values obtained for all pretreatments, temperatures, and air velocities are given in Table 7. As the air temperature and velocity increased, the value of the effective diffusivity of water also increased. Osmotic pretreatment influences the reduction of the effective diffusion coefficient. The calculated effective water diffusion coefficients are in the range of the values reported by other authors. The diffusion coefficient for apricot halves dried with hot air at temperatures of 30–90 °C was 2.7 × 10⁻¹⁰–10.2 × 10⁻¹⁰ m2/s [], for apricot halves without OD it was 1.47 × 10⁻⁹–6.56 × 10⁻⁹ m2/s, for whole apricot fruit, at 50–80 °C, it was 4.76 × 10⁻⁹–8.32 × 10⁻⁹ m2/s [].
The calculated activation energy values (Ea) (Table 8) indicate the sensitivity of the effective water diffusion coefficient to the selected air temperature range. Increased air velocity caused the value of Ea to increase as well. Osmotic pretreatment lowered the value of Ea, which may be an indication that the solute in the cells bound to water molecules, so energy is then needed to break these bonds. The Ea values obtained in this study are in the range of values obtained by other authors for HAD fruit 20.0–46.278 kJ/mol [,,].
5. Conclusions
The kinetics of osmotic drying of apricot halves, water loss, and solid gain, are described using the Peleg model with satisfactory accuracy. The most favorable ratio of water loss and solid gain is with the osmotic agent temperature of 40 °C in the concentration of 50%. Cutting the apricot fruit in half disturbs its cellular structure and the shrinkage is then most evident in thickness and less in length. Higher parameters of the osmotic drying process intensify the mass transfer. The kinetics of hot air drying was described using the logarithmic model that approximated the experimental data over the entire time range with satisfactory accuracy. The model proved to be useful for predicting the kinetics of hot air drying of the apricot halves both for those which had the osmotic pretreatment and for those that did not.
Osmotic pretreatment slows down the kinetics of convective drying, reduces the water diffusion coefficient and activation energy. Osmotically-treated apricot halves shrank less in volume, length, thickness, and width than the control sample, which resulted in a better quality of the final product. The most favorable combinations of parameters of osmotic dehydration and hot air drying are: the temperature of 40 °C and 50% concentration of the osmotic agent, the temperature of 60 °C and air velocity of 1.0 m/s. Future research should focus on the energy consumption in hot air drying technology and comparison between the apricot halves with and without the osmotic pretreatment.
Supplementary Materials
The following are available online at https://www.mdpi.com/2227-9717/9/2/202/s1, Figure S1. Drying curves of the apricot halves during the osmotic dehydration process, Figure S2. Shrinkage of apricot halves (Sv) during the osmotic dehydration process, Figure S3. Drying curves of hot air drying apricot halves for air velocity 1.0 m/s, Figure S4. Drying curves of hot air drying apricot halves for air velocity 1.5 m/s, Table S1. Mean values of shrinkage for osmotic dehydrated samples after 180 min of process, Table S2. Mean values of shrinkage for hot air dried samples after 1380 min of process, Table S3. Statistical analysis of models used to describe the kinetics of hot air drying of fresh (control) and osmotically-pretreated apricot halves, Table S4. The coefficients of Newton model used to describe the kinetics of hot air drying of fresh (control) and osmotically-pretreated apricot halves, Table S5. The coefficients of Page model used to describe the kinetics of hot air drying of fresh (control) and osmotically-pretreated apricot halves, Table S6. The coefficients of Modified Page model used to describe the kinetics of hot air drying of fresh (control) and osmotically-pretreated apricot halves, Table S7. The coefficients of Henderson and Pabis model used to describe the kinetics of hot air drying of fresh (control) and osmotically-pretreated apricot halves, Table S8. The coefficients of Modified Henderson and Pabis model used to describe the kinetics of hot air drying of fresh (control) and osmotically-pretreated apricot halves, Table S9. The coefficients of Verma model used to describe the kinetics of hot air drying of fresh (control) and osmotically pretreated apricot halves, Table S10. The coefficients of Two Term model used to describe the kinetics of hot air drying of fresh (control) and osmotically-pretreated apricot halves, Table S11. The coefficients of Two Term Exponantial model used to describe the kinetics of hot air drying of fresh (control) and osmotically-pretreated apricot halves, Table S12. The coefficients of Diffusion Approach model used to describe the kinetics of hot air drying of fresh (control) and osmotically-pretreated apricot halves.
Author Contributions
Conceptualization: I.P. and M.R.; methodology: I.P.; contributions to sample and analysis experiments: I.P., M.R., Z.S., K.K., and O.P.; software: Z.S.; validation: U.T., and P.S.; investigation: A.S.; resources: A.S.; data curation: Z.S. and K.K.; writing—original draft preparation: I.P., M.R., Z.S., U.T., and P.S.; writing—review and editing: I.P., M.R., and P.S.; visualization: K.K.; supervision: M.R., P.S., and U.T.; project administration: Z.S. All authors have read and agreed to the published version of the manuscript.
Funding
This research was funded by Ministry of Education, Science and Technology, Republic of Serbia, grant number 451-03-68/2020-14/200125.
Institutional Review Board Statement
Not applicable.
Informed Consent Statement
Not applicable.
Data Availability Statement
The data presented in this study are available on request from the corresponding author. The data are not publicly available due to unpublished results.
Conflicts of Interest
The authors declare no conflict of interest.
References
- Miodragović, M.; Magazin, N.; Keserović, N.; Milić, B.; Popović, B.; Blagojević, B.; Klajdžić, J. The Early Perfomance and Fruit Properties of Apricot Cultivars Grafted on Pruns spinosa L. Interstock. Sci. Hortic. 2019, 250, 199–206. [Google Scholar] [CrossRef]
- Miodragović, M.; Keserović, Z.; Milić, B.; Dorić, M.; Magazin, N. Physical and Chemical Fruit Properties of Apricot Cultivars and Selections from Novi Sad within High-Density Growing System. J. Pomol. 2015, 49, 37–42. (In Serbian) [Google Scholar]
- Vukoje, V.; Pavkov, I.; Miljatović, A. Economic Aspects of Dried Fruit Production by Combined Technology. Econ. Agric. 2018, 65, 1031–1044. [Google Scholar] [CrossRef]
- Vukoje, V.; Pavkov, I. Analysis of Economic Justification of Drying of Apricots by Combined Technology. J. Process. Energy Agric. 2010, 14, 40–43. Available online: https://scindeks-clanci.ceon.rs/data/pdf/1821-4487/2010/1821-44871001040V.pdf (accessed on 17 November 2020).
- Keserović, Z.; Magazin, N.; Milić, B.; Igić, M.; Miodragović, M.; Kalajdžić, J. New Apricot Cultivar—“Buda”. J. Pomol. 2018, 52, 27–31. [Google Scholar]
- Karabulut, I.; Tugca, B.; Sislioglu, K.; Gokbulut, I.; Ozdemir, I.S.; Seyhan, F.; Ozturk, K. Chemical Composition of Apricots Affected by Fruit Size and Drying Methods. Dry. Technol. 2018, 36, 1937–1948. [Google Scholar] [CrossRef]
- Türkyılmaz, M.; Tağı, S.; Özkan, M. Changes in Chemical and Microbial Qualities of Dried Apricots Containing Sulphur Dioxide at Different Levels During Storage. Food Bioprocess Technol. 2013, 6, 1526–1538. [Google Scholar] [CrossRef]
- Sağırlı, F.; Tağı, S.; Özkan, M.; Yemiş, O. Chemical and Microbial Stability of High Moisture Dried Apricots During Storage. J. Sci. Food Agric. 2008, 88, 858–869. [Google Scholar] [CrossRef]
- Madrau, M.C.; Piscopo, A.; Sanguinetti, A.M.; Del Caro, A.; Poiana, M.; Romeo, F.V.; Piga, A. Effect of Drying Temperature on Polyphenolic Content and Antioxidant Activity of Apricots. Eur. Food Res. Technol. 2009, 228, 441–448. [Google Scholar] [CrossRef]
- Mir, M.A.; Hussain, P.R.; Fouzia, S.; Rather, A.H. Effect of Sulphiting and Drying Methods on Physic-Chemical and Sensorial Quality of Dried Apricots During Ambient Storage. Int. J. Food Sci. Technol. 2009, 44, 1157–1166. [Google Scholar] [CrossRef]
- Torreggiani, D.; Bertolo, G. Osmotic Pre-treatment in Fruit Processing: Chemical, Physical and Structural Effects. J. Food Eng. 2001, 49, 247–253. [Google Scholar] [CrossRef]
- Sakooei-Vayghan, R.; Peighambardoust, S.H.; Hesari, J.; Peressini, D. Effects of Osmotic Dehydration (with and without sonication) and Pectinbased Coating Pretreatments on Functional Properties and Color of Hot-Air Dried Apricot Cubes. Food Chem. 2020, 311, 125978. [Google Scholar] [CrossRef] [PubMed]
- Ispir, A.; Togrul, I.T. The Influence of Application of Pretreatment on the Osmotic Dehydration of Apricots. J. Food Process. Preserv. 2009, 33, 58–74. [Google Scholar] [CrossRef]
- Ciurzynska, A.; Kowalska, H.; Czajkowska, K.; Lenart, A. Osmotic Dehydration in Production of Sustainable and Healthy Food. Trends Food Sci. Technol. 2016, 59, 186–192. [Google Scholar] [CrossRef]
- Rastogi, N.K.; Niranjan, K. Enhanced Mass Transfer During Osmotic Dehydration of High Pressure Treated Pineapple. J. Food Sci. 1998, 63, 508–511. [Google Scholar] [CrossRef]
- Wiktor, A.; Sledz, M.; Nowacka, M.; Chudoba, T.; Witrowa-Rajchert, D. Pulsed Electric Field Pretreatment for Osmotic Dehydration of Apple Tissue: Experimental and Mathematical Modeling Studies. Dry. Technol. 2014, 32, 408–417. [Google Scholar] [CrossRef]
- Nowacka, M.; Wiktor, A.; Sledz, M.; Jurek, N.; Witrowa-Rajchert, D. Drying of Ultrasound Pretreated Apple and its Selected Physical Properties. J. Food Eng. 2012, 113, 427–433. [Google Scholar] [CrossRef]
- Vega-Galaves, A.; Uribe, E.; Perez, M.; Tabilo-Munizaga, G.; Vegara, J.; Garcia-Segovia, P.; Lara, E.; Di Scala, K. Effect of High Hydrostatic Pressure Pretreatment on Drying Kinetics, Antioxidant Activity, Firmness and Microstructure of Aloe Vera (Aloe barbadensis Miller) gel. LWT 2011, 44, 384–391. [Google Scholar] [CrossRef]
- Rodríguez, M.M.; Rodriguez, A.; Mascheroni, R.H. Color, Texture, Rehydration Ability and Phenolic Compounds of Plums Partially Osmodehydrated and Finish-Dried by Hot Air. J. Food Process. Preserv. 2015, 39, 2647–2662. [Google Scholar] [CrossRef]
- Riva, M.; Campolongo, S.; Leva, A.A.; Maestrelli, A.; Torreggiani, D. Structure–Property Relationships in Osmo-Air-Dehydrated Apricot Cubes. Food Res. Int. 2005, 38, 533–542. [Google Scholar] [CrossRef]
- Mrad, N.D.; Bonazzi, B.; Boudhrioua, N.; Kechaou, N.; Courtois, F. Influence of Sugar Composition on Water Sorption Isotherms and on Glass Transition in Apricots. J. Food Eng. 2012, 111, 403–411. [Google Scholar] [CrossRef]
- Kešelj, K.; Babić, M.; Pavkov, I.; Radojčin, M.; Stamenković, Z.; Tekić, D.; Ivanišević, M. Effects of Storage and Sulfurization with Sulfur Dioxide of Different Concentration on Changes in the Color of Cried Apricots. J. Process. Energy Agric. 2019, 23, 190–194. [Google Scholar] [CrossRef]
- Pavkov, I.; Babić, L.; Babić, M. Mathematical Model of the Apricot Kinetic Osmotic Drying. J. Process. Energy Agric. 2007, 11, 98–101. (In Serbian). Available online: https://scindeks.ceon.rs/article.aspx?artid=1450-50290703098P (accessed on 7 December 2020).
- Ispir, A.; Togrul, I.T. Osmotic Dehydration of Apricot: Kinetics and the Effect of Process Parameters. Chem. Eng. Res. Des. 2009, 87, 166–180. [Google Scholar] [CrossRef]
- Khoyi, M.R.; Hesari, J. Osmotic Dehydration Kinetics of Apricot Using Sucrose Solution. J. Food Eng. 2007, 78, 1355–1360. [Google Scholar] [CrossRef]
- Rahimi, J.; Singh, A.; Adewale, P.O.; Adedeji, A.A.; Ngadi, M.O.; Raghavan, V. Effect of Carboxylmethyl Cellulose Coating and Osmotic Dehydration on Freeze Drying Kinetics of Apple Slice. Foods 2013, 2, 170–182. [Google Scholar] [CrossRef] [PubMed]
- Pavkov, I.; Babić, L.; Babić, M.; Radojčin, M. Kinetics of the Combined Drying Technology of Pear Slice (Pyrus). J. Process. Energy Agric. 2009, 13, 111–116. Available online: https://scindeks.ceon.rs/article.aspx?artid=1821-44871104217P (accessed on 10 December 2020).
- Mohsenin, N.N. Physical Properties of Plant and Animal Materials; Gordon and Breach Sci. Publ.: New York, NY, USA, 1986; pp. 23–25. [Google Scholar]
- Radojčin, M.; Babić, M.; Pavkov, I.; Stamenković, Z. Osmotic Drying Effects on the Mass Transfer and Shrinkage of Quince tissue. J. Process. Energy Agric. 2015, 19, 113–119. Available online: https://scindeks.ceon.rs/article.aspx?artid=1821-44871503113R (accessed on 10 December 2020).
- Assis, F.R.; Morais, R.M.S.C.; Morais, A.M.M.B. Mathematical Modeling of Osmotic Dehydration Kinetics of Apple Cubes. J. Food Process. Preserv. 2017, 41, 1–16. [Google Scholar] [CrossRef]
- Lewis, W.K. The Rate of Drying of Solid Materials. ACES 1921, 13, 427–432. [Google Scholar] [CrossRef]
- Page, C. Factors Influencing the Maximum Rates of Air Drying of Shelled Corn in Thin Layer. Master’s Thesis, Purdue University, Lafayette, IN, USA, 1949. Unpublished work. [Google Scholar]
- Overhults, D.G.; White, H.E.; Hamilton, H.E.; Ross, I.J. Drying Soybeans With Heated Air. Trans. ASAE 1973, 16, 112–113. [Google Scholar] [CrossRef]
- Yagcıoglu, A.; Degirmencioglu, A.; Cagatay, F. Drying Characteristics of Laurel Leaves Under Different Drying Conditions. In Proceedings of the 7th International Congress on Agricultural Mechanization and Energy, Adana, Turkey, 26–27 May 1999; pp. 565–569. [Google Scholar]
- Henderson, S.M.; Pabis, S. Grain drying theory I. Temperature Effect on Drying Coefficient. J. Agric. Eng. Res. 1961, 6, 169–174. [Google Scholar]
- Karathanos, V.T.; Belessiotis, V.G. Application of a Thin Layer Equation to Drying Data of Fresh and Semi-Dried Fruits. J. Agric. Eng. Res. 1999, 74, 355–361. [Google Scholar] [CrossRef]
- Verma, L.R.A.; Bucklin, J.B.; Endan, F.T.W. Effects of Drying Air Parameters on Rice Drying Models. Trans. ASABE 1985, 28, 296–301. [Google Scholar] [CrossRef]
- Henderson, S.M. Progress in Developing the Thin Layer Drying Equation. Trans. ASABE 1974, 17, 1167–1172. [Google Scholar] [CrossRef]
- Yaldız, O.; Ertekin, C. Thin Layer Solar Drying Some Different Vegetables. Dry. Technol. 2001, 19, 583–596. [Google Scholar] [CrossRef]
- Kassem, A.S. Comparative Studies on Thin Layer Drying Models for Wheat. In Proceedings of the 13th International Congress on Agricultural Engineering, Rabat, Morocco, 2–6 February 1998; Bartali, E.H., Ed.; ANAFIDE: Rabat, Morocco, 1998. [Google Scholar]
- Crank, J. Mathematics of Diffusion, 2nd ed.; Clarendon Press: Oxford, UK, 1975; pp. 24–68. [Google Scholar]
- Kayran, S.; Doymaz, I. Infrared Drying and Effective Moisture Diffusivity of Apricot Halves: Influence of Pretreatment and Infrared Power. J. Food Process. Preserv. 2017, 41, 1–8. [Google Scholar] [CrossRef]
- Ruiz-Lopez, I.I.; Ruiz-Espinosa, H.; Luna-Guevara, M.L.; Garcia-Alvarado, M.A. Modeling and Simulation of Heat and Mass Transfer During Drying of Solids With Hemispherical Shell Geometry. Comput. Chem. Eng. 2011, 35, 191–199. [Google Scholar] [CrossRef]
- Bon, J.; Simal, S.; Rossello, C.; Mulet, A. Drying Characteristic of Hemispherical Solids. J. Food Eng. 1997, 34, 109–122. [Google Scholar] [CrossRef]
- Togrul, I.T.; Ispir, A. Effect on Effective Diffusion Coefficients and Investigation of Shrinkage During Osmotic Dehydration of Apricot. Energy Convers. Manag. 2007, 48, 2611–2621. [Google Scholar] [CrossRef]
- Junior, J.L.B.; Mancini, M.C.; Hubinger, M.D. Mass Transfer Kinetics and Mathematical Modeling of the Osmotic Dehydration of Orange-Fleshed Honeydew Melon in Corn Syrup and Sucrose Solutions. Int. J. Food Sci. Technol. 2013, 48, 2463–2473. [Google Scholar] [CrossRef]
- Archibald, R.; Melton, L. The Anatomy of the Fleshy Pericarp of Maturing Moorpac Apricots, Prunus Armeniaca. N. Z. J. Bot. 1987, 25, 181–184. [Google Scholar] [CrossRef]
- Mandala, I.G.; Anagnostaras, E.F.; Oikonomou, C.K. Influence of Osmotic Dehydration Conditions on Apple Air Drying Kinetics and their Quality Characteristics. J. Food Eng. 2005, 69, 307–316. [Google Scholar] [CrossRef]
- Barat, J.M.; Fito, P.; Chiralt, A. Modeling of Simultaneous Mass Transfer and Structural Changes in Fruit Tissues. J. Food Eng. 2001, 49, 77–85. [Google Scholar] [CrossRef]
- Yang, J.; Di., Q.; Jiang, Q.; Zhao, J. Application of Pore Size Analyzers in Study of Chinese Angelica Slices Drying. Dry. Technol. 2010, 28, 214–221. [Google Scholar] [CrossRef]
- Guine, R.P.F.; Castro, J.A.A.M. Pear Drying Process Analysis: Drying Rates and Evaluation of Water and Sugar Concentrations in Space and Time. Dry. Technol. 2002, 20, 1515–1526. [Google Scholar] [CrossRef]
- Bozkir, O. Thin-layer Drying and Mathematical Modeling for Washed Dry Apricots. J. Food Eng. 2006, 77, 146–151. [Google Scholar] [CrossRef]
- Sankat, C.K.; Castaigne, F.; Maharaj, R. The Air Drying Behaviour of Fresh and Osmotically Dehydrated Banana Slices. Int. J. Food Sci. Technol. 1996, 3, 123–135. [Google Scholar] [CrossRef]
- Azoubel, P.M.; El-Aouar, A.A.; Tonon, R.V.; Kurozawa, L.M.; Graziella, C.A.; Murr, F.E.X.; Park, K.J. Effect of Osmotic Dehydration on the Drying Kinetics and Quality of Cashew Apple. Int. J. Food Sci. Technol. 2009, 44, 980–986. [Google Scholar] [CrossRef]
- Igual, M.; Garcia-Martinez, E.; Martina-Espraza, M.E.; Martinez-Navarrete, N. Effect of Processing on the Drying Kinetics and Functional Value of Dried Apricot. Food Res. Int. 2012, 47, 284–290. [Google Scholar] [CrossRef]
- Doymaz, I. Effect of Pre-treatments Using Potassium Metabisulphide and Alkaline Ethyl Oleate on the Drying Kinetics of Apricots. Biosyst. Eng. 2004, 89, 281–287. [Google Scholar] [CrossRef]
- Bon, J.; Rossello, C.; Femenia, A.; Eim, V.; Simal, S. Mathematical Modeling of Drying Kinetics for Apricots: Influence of the External Resistance to Mass Transfer. Dry. Technol. 2007, 25, 1829–1835. [Google Scholar] [CrossRef]
- Krzykowski, A.; Dziki, D.; Rudy, S.; Gawlik-Dziki, U.; Janiszewska-Turak, E.; Biernacka, B. Wild Strawberry Fragaria vesca L.: Kinetics of Fruit Drying and Quality Characteristics of the Dried Fruits. Processes 2020, 8, 1265. [Google Scholar] [CrossRef]
Publisher’s Note: MDPI stays neutral with regard to jurisdictional claims in published maps and institutional affiliations. |
© 2021 by the authors. Licensee MDPI, Basel, Switzerland. This article is an open access article distributed under the terms and conditions of the Creative Commons Attribution (CC BY) license (http://creativecommons.org/licenses/by/4.0/).