Article

Regulation of Hydrogen Peroxide Dosage in a Heterogeneous Photo-Fenton Process

by
Karla Estefanía Saldaña-Flores
1,
René Alejandro Flores-Estrella
2,*,
Victor Alcaraz-Gonzalez
1,
Elvis Carissimi
3,
Bruna Gonçalves de Souza
4,5,
Luís Augusto Martins Ruotolo
4 and
Ernesto Urquieta-Gonzalez
4,5
1
Departamento de Ingeniería Química, Universidad de Guadalajara, Guadalajara 44430, Mexico
2
Departamento de Ciencias de la Sustentabilidad, El Colegio de la Frontera Sur, Tapachula 30700, Mexico
3
Department of Sanitation and Environmental Engineering, Federal University of Santa Maria, Santa Maria 97105-900, RS, Brazil
4
Department of Chemical Engineering, Federal University of São Carlos, São Carlos 3565-905, SP, Brazil
5
Research Center on Advanced Materials and Energy, Federal University of São Carlos, São Carlos 13565-905, SP, Brazil
*
Author to whom correspondence should be addressed.
Processes 2021, 9(12), 2167; https://doi.org/10.3390/pr9122167
Submission received: 10 November 2021 / Revised: 25 November 2021 / Accepted: 29 November 2021 / Published: 1 December 2021

Abstract

:
In this work, a classical linear control approach for the peroxide (H 2 O 2 ) dosage in a photo-Fenton process is presented as a suitable solution for improving the efficiency in the treatment of recalcitrant organic compounds that cannot be degraded by classical wastewater treatment processes like anaerobic digestion. Experiments were carried out to degrade Lignin, Melanoidin, and Gallic acid, which are typical recalcitrant organic compounds present in some kinds of effluents such as vinasses from the Tequila and Cachaça industries. Experiments were carried in Open-Loop mode for obtaining the degradation model for the three compounds in the form of a Transfer Function, and in Closed-Loop mode for controlling the concentration of each compound. First-order Transfer Functions were obtained using the reaction curve method, and then, based on these models, the parameters of Proportional Integral controllers were calculated using the direct synthesis method. In the Closed-Loop experiments, the Total Organic Carbon removal was 39% for lignin, 7% for melanoidin, and 29% for Gallic acid, which were greater than those obtained in the Open-Loop experiments.

1. Introduction

Vinasses are effluents generated during the distillation processes to produce alcoholic beverages such as beer, wine, and liquors. In México, the most important industry of distilled beverages is Tequila production (the worldwide known Mexican spirit), while in Brazil the most popular spirit is Cachaça, produced from the fermented agave juice and sugarcane juice, respectively. The Cachaça industry generates between 4 and 15 L of vinasses per liter of product [1,2]. Considering that it is estimated that Brazil has an installed production capacity of approximately 1.2 billion liters of Cachaça annually, but less than 800 million liters are produced annually, this represents 3.2–12 billion liters of vinasses [3]. The Tequila industry is still more polluting because when a liter of Tequila is produced, 10 to 12 L of vinasses are generated [4]. For instance, with a production of 374 million liters of Tequila in Mexico in 2020 [5]; this represented 3.7–4.4 billion liters of produced vinasses. Vinasses depend on the raw material but share general characteristics, i.e., high organic load (50–150 gCOD/L) and low pH (3.5–4) [6]. They are also highly corrosive at high temperatures and concentrations, making them very strong polluting effluents [6]. Moreover, the unregulated discharge of vinasses into the soil is related to its salinization and the contamination of surface and groundwater [1]. In the state of Jalisco, México, this has been a common practice. Unfortunately, even today vinasses are still discharged by small and medium-sized Tequila producers into water bodies, or used in crops with the risk that this implies for aquatic life due to the high content of organic matter and color [7,8]. Table 1 shows the composition of the Cachaça and Tequila vinasses [9,10].
Vinasses contain recalcitrant organic compounds (RC), which cannot be degraded by conventional wastewater treatment processes [6,12]. The cloudy color of vinasses is associated with melanoidins, affecting the passage of light in water and photosynthetic processes, and, thus, affecting the aquatic life [13].
In addition, the phenolic and polyphenolic compounds (i.e., Gallic acid and lignin) present in vinasses, can inhibit seed germination and damage crops, as well as negatively affect the soil microbial activity [12]. Vinasses generated in the Tequila production can have between 480 to 540 ppm of Gallic acid, and vinasses that come from the Cachaça production have around 450 ppm of that compound [12,14].
It is well known that Anaerobic Digestion (AD) is a viable solution for the treatment of Tequila and Cachaça vinasses, but due to the content of RC this process is not capable of reaching regulatory discharge standards for wastewater [12,15]. On the other hand, advanced oxidation processes (AOP) have been applied in the last decades to degrade contaminants present in water that are chemically stable. For instance, Fenton uses the hydroxyl radical (•OH), which is the second most oxidizing agent only after fluorine. This AOP is effective in the degradation of RC because the •OH is not selective. Most of these processes are carried out at room temperature and not all require an external energy source. In general, AOP can reach total organic matter mineralization, producing CO 2 and water, but it can also produce other compounds, which biological processes can later treat. In such a case, AOP would be being used as a pretreatment. Furthermore, when a biological process is the first step in wastewater treatment, a subsequent AOP process could be necessary to reach total mineralization of the organic matter [16,17,18].
Among these AOP, the heterogeneous photo-Fenton process (HPP) has proved efficient in the degradation of RC [15], and thus, it may be used as a post-treatment of AD effluents. Moreover, the HPP can be improved by modeling the degradation of organic compounds, monitoring the process variables, and applying control approaches to achieve better use of the reagents and, consequently, a better degradation of pollutants. The photo-Fenton process uses sunlight or UV light, Fe (II) ion, and H 2 O 2 . In this process, high mineralization of organic matter is obtained. The overall organic reactions are depicted as follows:
RC + H 2 O 2 CO 2 + H 2 O
H 2 O 2 H 2 O + 1 / 2 O 2
while the involved photo-Fenton reactions are the following:
Fe 2 + + H 2 O 2 Fe 3 + + OH + OH
Fe 3 + + H 2 O 2 + hv Fe 2 + + H + + OH
H 2 O 2 + hv 2 OH
Equation (3) shows the oxidation of Fe 2 + to Fe 3 + , that is the Fenton reaction, Equation (4) shows the reduction of Fe 3 + to Fe 2 + in the presence of light, and Equation (5) shows the photolysis of hydrogen peroxide [15,18]. The main variables affecting the HPP are temperature, pH, and H 2 O 2 concentration. Several scientific articles have reported the photo-Fenton process around 30 C, avoiding the degradation of H 2 O 2 at higher temperatures. It has also been reported successful photo-Fenton process conditions of 50–75 C, but this would increase process costs. Concerning pH, H 2 O 2 decomposition is accelerated at basic pH values, leading to a lower generation of hydroxyl radicals. Recent studies have been performed at near-neutral pH [19]. Furthermore, instead of homogeneous, the heterogeneous photo-Fenton processes, would be advantageous as it allows for greater results at a neutral pH [20]. In addition, by not having to lower the pH of the water to be treated, the costs associated with chemicals can be reduced [21]. Indeed, some studies have been done without pH adjustment and have had good results; this is due to the formation of intermediary compounds at the beginning of the reaction that causes the decrease in pH [15,22].
Nevertheless, among operational photo-Fenton process conditions, the H 2 O 2 concentration present at each time is perhaps the most important parameter in the HPP affecting both the reaction outcome and the cost of the process [23]. If an equivalent amount of H 2 O 2 is added at the beginning of the reaction, the process could not reach total contaminant degradation. It means the H 2 O 2 could be being consumed by other reactions named scavengers. However, if the H 2 O 2 is dosed, it could better degrade pollutants, even if smaller quantities of H 2 O 2 are added. Thus, H 2 O 2 will be efficiently consumed [24].
When the H 2 O 2 is added to the photo-Fenton reaction system, there is an effect on the dissolved oxygen (DO) concentration. An increase in DO is related to H 2 O 2 decomposition, while a decrease in DO is related to a lack of H 2 O 2 . Therefore, the control of this variable has been considered as a critical factor in this process [25]. Considering this fact, some authors have modeled the homogeneous photo-Fenton process by the reaction curve method [24].
DO measuring is essential for carrying out two important tasks. In offline DO measurement mode, the first one is to obtain a model of RC degradation. In the online DO measurement mode, the second one is to use this measurement as an output variable in applying an automatic closed-loop control law. This last task carries out the dosing of input H 2 O 2 to optimize its consumption, as well as other reagents into the reactor, which allows reaching better degradation results [23,24].
Several researchers have reported a continuous dosage of H 2 O 2 using DO as control variable [23,24]. To the best of our knowledge, no works upon (i) the treatment of more complex wastewater, (ii) modeling and control heterogeneous photo-Fenton processes without pH adjustment at the same time has been reported.
The aims of this work are focused upon the following: (a) the modeling of HPP as a function of the measured DO for three RC present in Tequila and Cachaça vinasses, i.e., lignin, Gallic acid, and melanoidin, and to use the obtained models to design a simple and classical linear control approach for each one by implementing the automatic dosage of hydrogen peroxide in the HPP for degrading this compounds, (b) to compare the implementation of the automatic dosage against the conventional H 2 O 2 dosage in terms of COD, TOC, H 2 O 2 consumption.

2. Materials and Methods

2.1. Reagents

Synthetic samples of RC were elaborated with soluble water and low sulfonated lignin (Sigma™), and Gallic acid (97.5%) (Sigma™). Melanoidin was synthesized [26] using glycine (99%), D-(+)-Glucose (99.5%) and bicarbonate of sodium (Sigma™). The degradation of lignin was carried out using H 2 O 2 (50%) (Fermont™) and a zinc ferrite catalyst, which was provided by the Federal University of São Carlos [27,28]. The degradation of Gallic acid and melanoidin was carried out using H 2 O 2 (50%) (Fermont™) and, respectively, an iron or a zirconium catalyst [29,30]. The TiSO 4 compound used in the analytical methods (see the next section), was obtained by reaction between titanium oxide (99%) and sulfuric acid (99%) (Sigma™). The Folin and Ciocalteu’s phenol reagent (Hycel™), as well as sodium carbonate (99.6%) (Fermont™) were used to quantify the phenol concentration.

2.2. Analytical Methods

Concentrations of lignin and melanoidin were measured by UV/Vis, at 280 nm and 420 nm, respectively, using a Genesys™10S spectrophotometer. The Folin–Ciocalteu method, which is a colorimetric technique for measuring phenols, was used to determine the concentration of Gallic acid at 760 nm also using the Genesys™10S spectrophotometer. Over time, the degradation of RC was monitored with typical variables, chemical oxygen demand (COD) and total organic carbon (TOC). For the determination of COD, TNT 822/Hach vials and COD-Reactor/Hach were used. The TOC was determined by using a Shimatzu™TOC analyzer. The H 2 O 2 concentration was determined by UV-Vis through the formation of the colored complex TiSO4/H 2 O 2 at 405 nm.

2.3. Reaction System

The reaction system (see Figure 1) consisted of a 0.5 L (effective liquid volume) reactor placed in the center of a LED camera. It was placed inside a box to keep the system isolated from sunlight to have a constant light source. The reactor was kept under continuous agitation to maintain homogeneous concentration conditions. In the upper box side, it was placed a peristaltic pump that provided the flow of H 2 O 2 . A water jacket surrounded the reactor to keep the temperature constant.

2.4. Experimental Procedure

Each RC was degraded separately, with an initial concentration of 200, 100, 600 ppm for Gallic acid, lignin, and melanoidin, respectively. The amount of catalyst was the same in all the experiments; in lignin, a zinc ferrite catalyst (0.25 g) was used, while in the case of Gallic acid and melanoidin, a mass of 0.25 g of the iron catalyst was used.
Solutions of 0.5 L were prepared with a pH of 2.8 with the corresponding recalcitrant compound to be degraded. The bath was adjusted to 30 C. The reactor was charged with the solution and the stirring was adjusted to 400 rpm. Then the catalyst was placed, and it was left under agitation for 5 min in darkness. Then, the source of light was connected. The irradiance was adjusted to 3400 μ Em 2 s 1 . Depending on the type of experiment, the following steps were carried out:
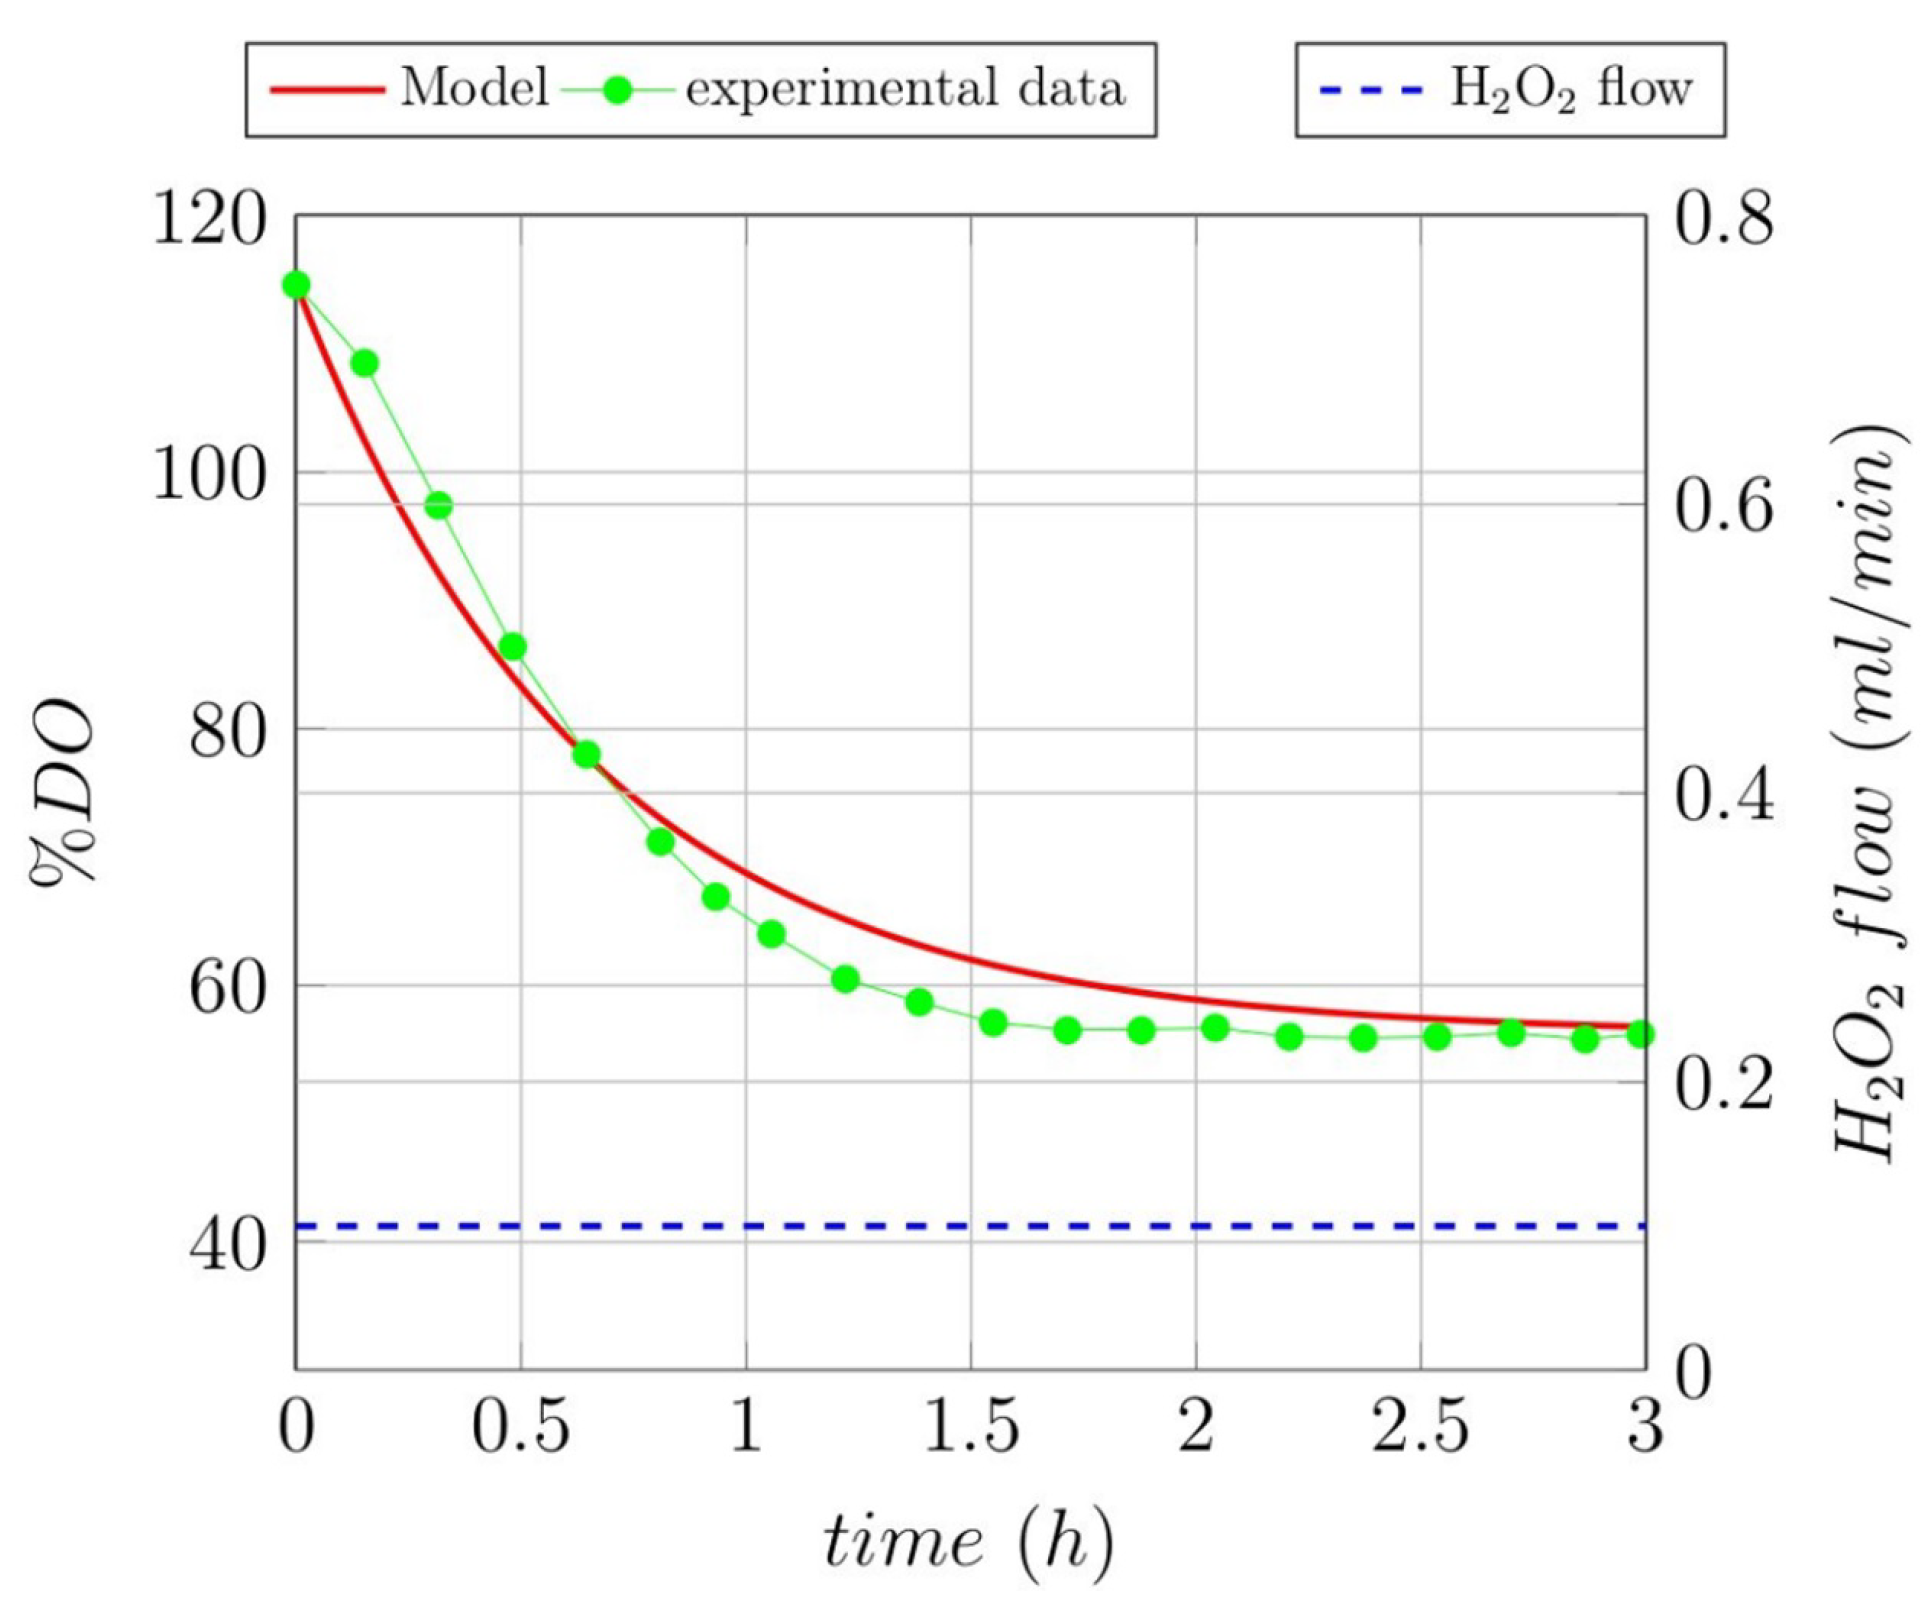
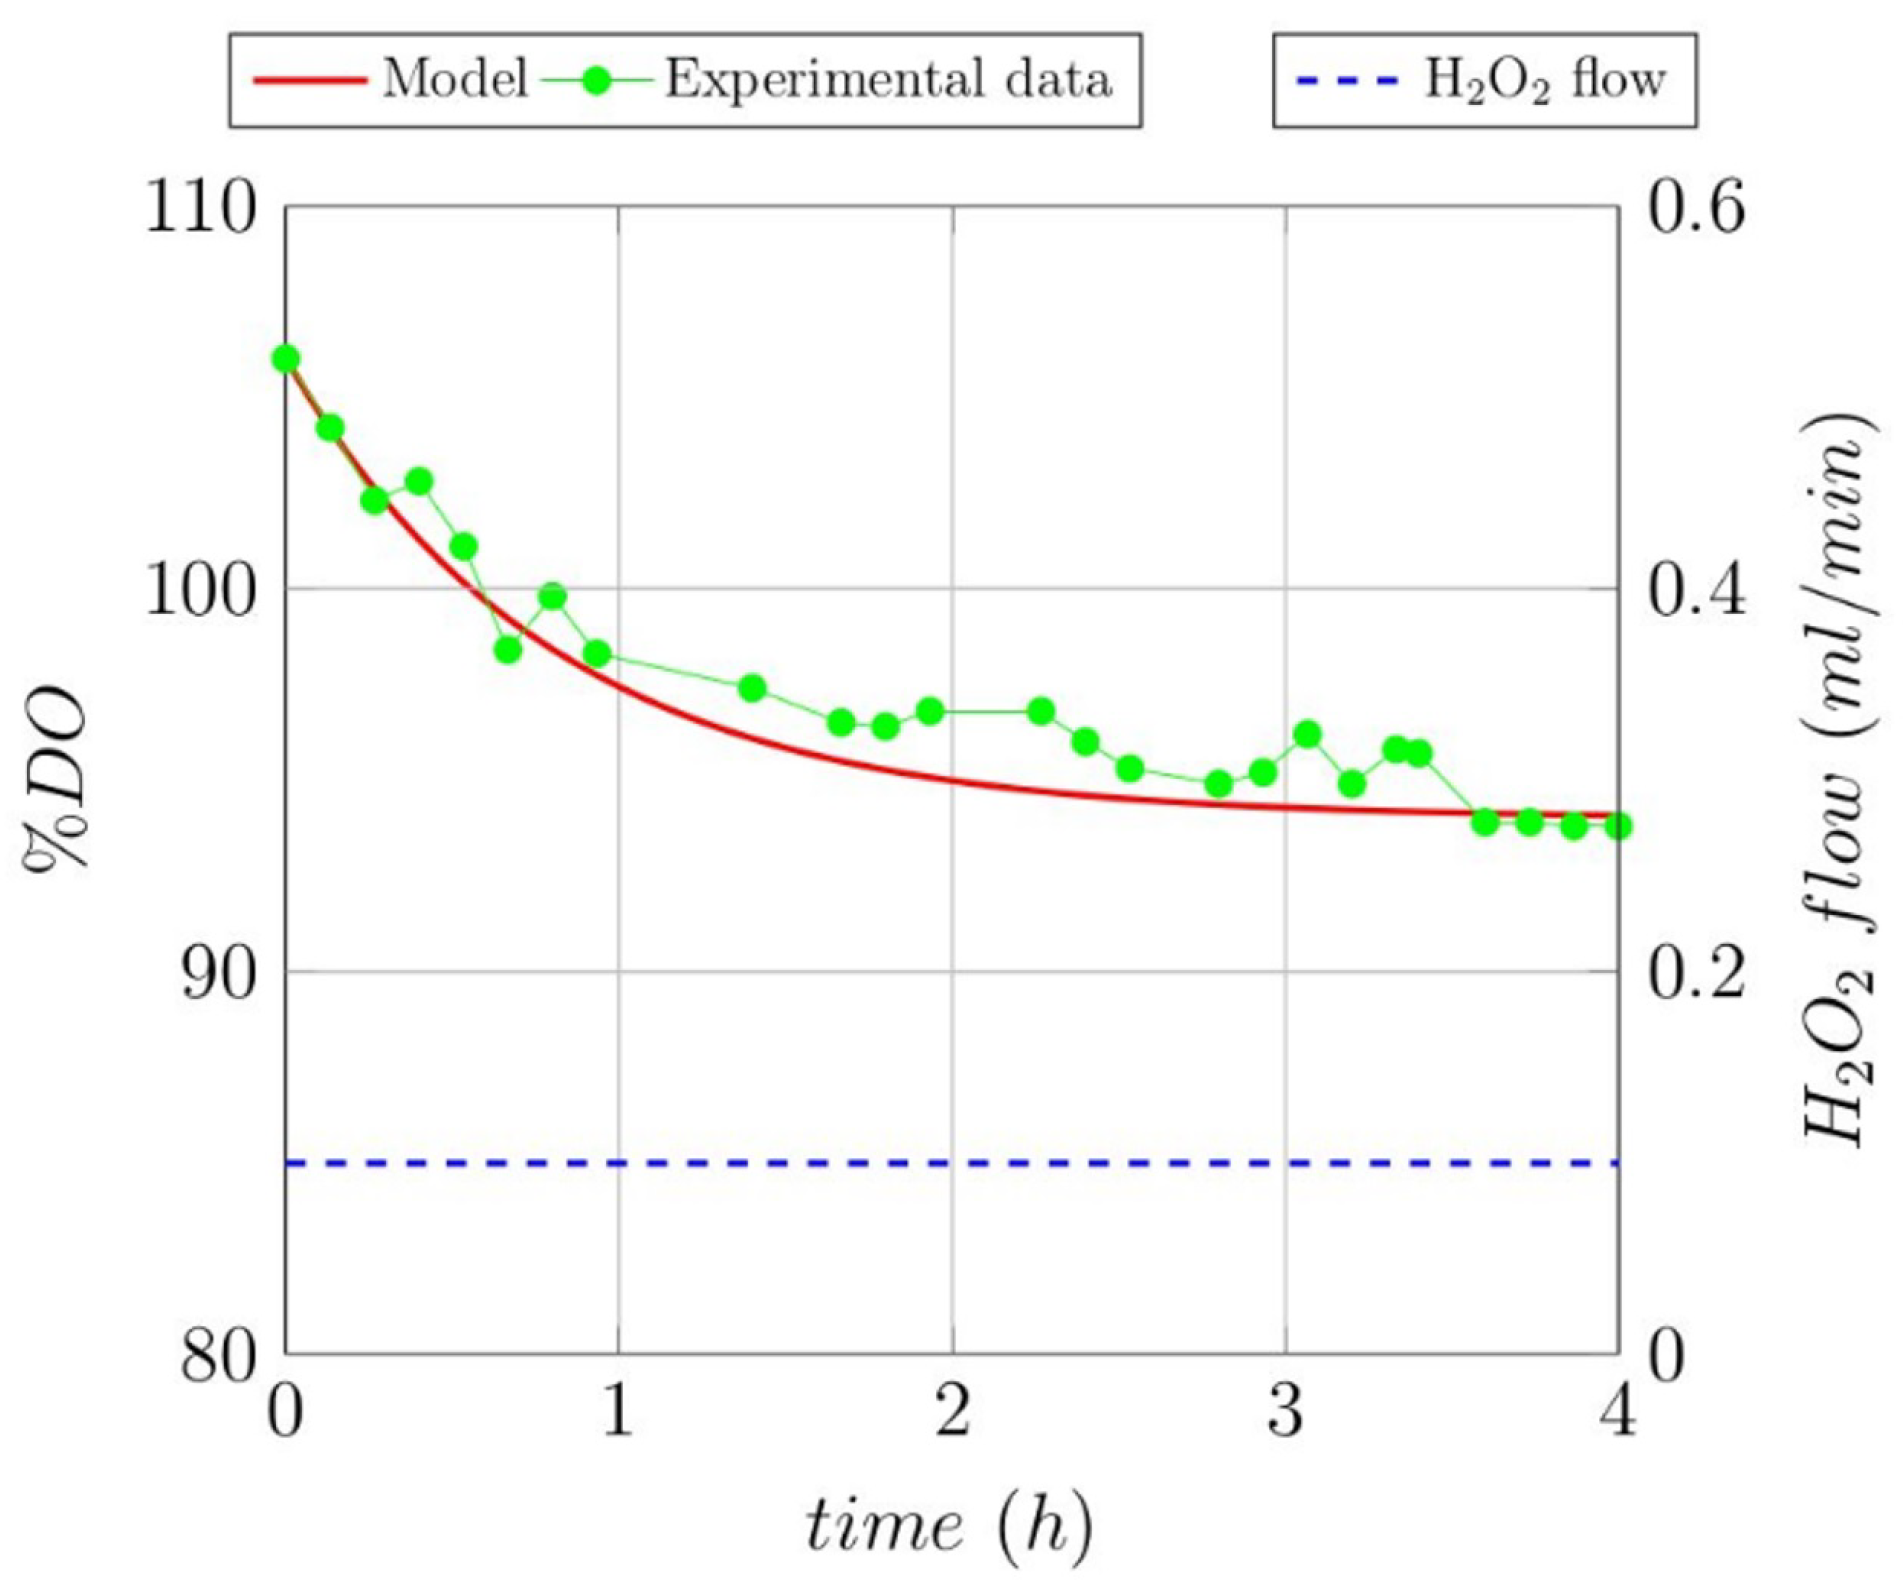
  • Open-Loop (OL) (Modeling) experiments: The reaction time began when the peristaltic pump started dosing 0.1 mL/min of a solution of H 2 O 2 with a concentration of 1000 ppm. The initial concentration of H 2 O 2 in the reactor was zero. Samples were taken through time;
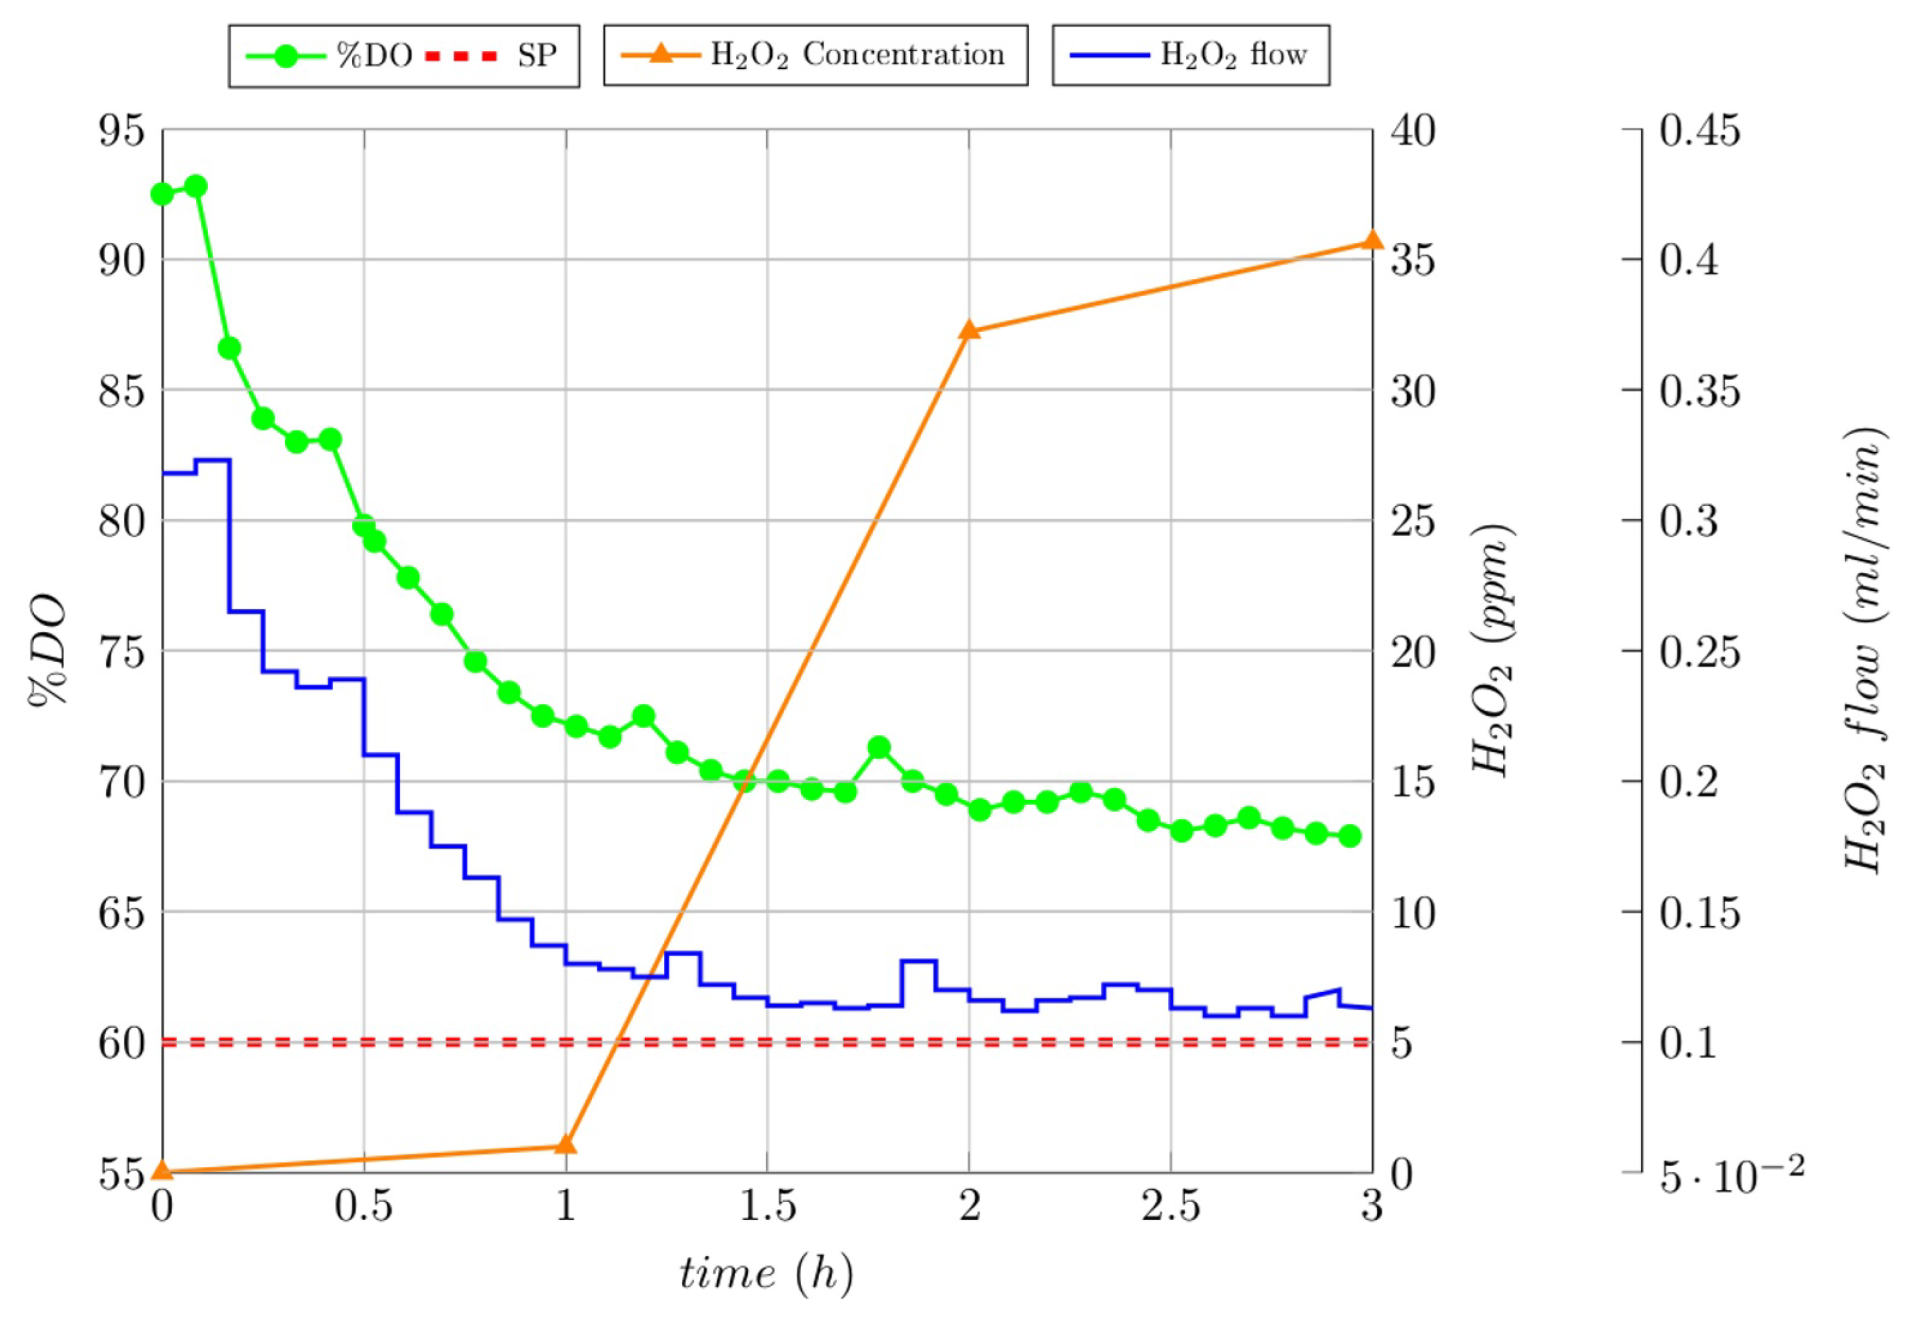
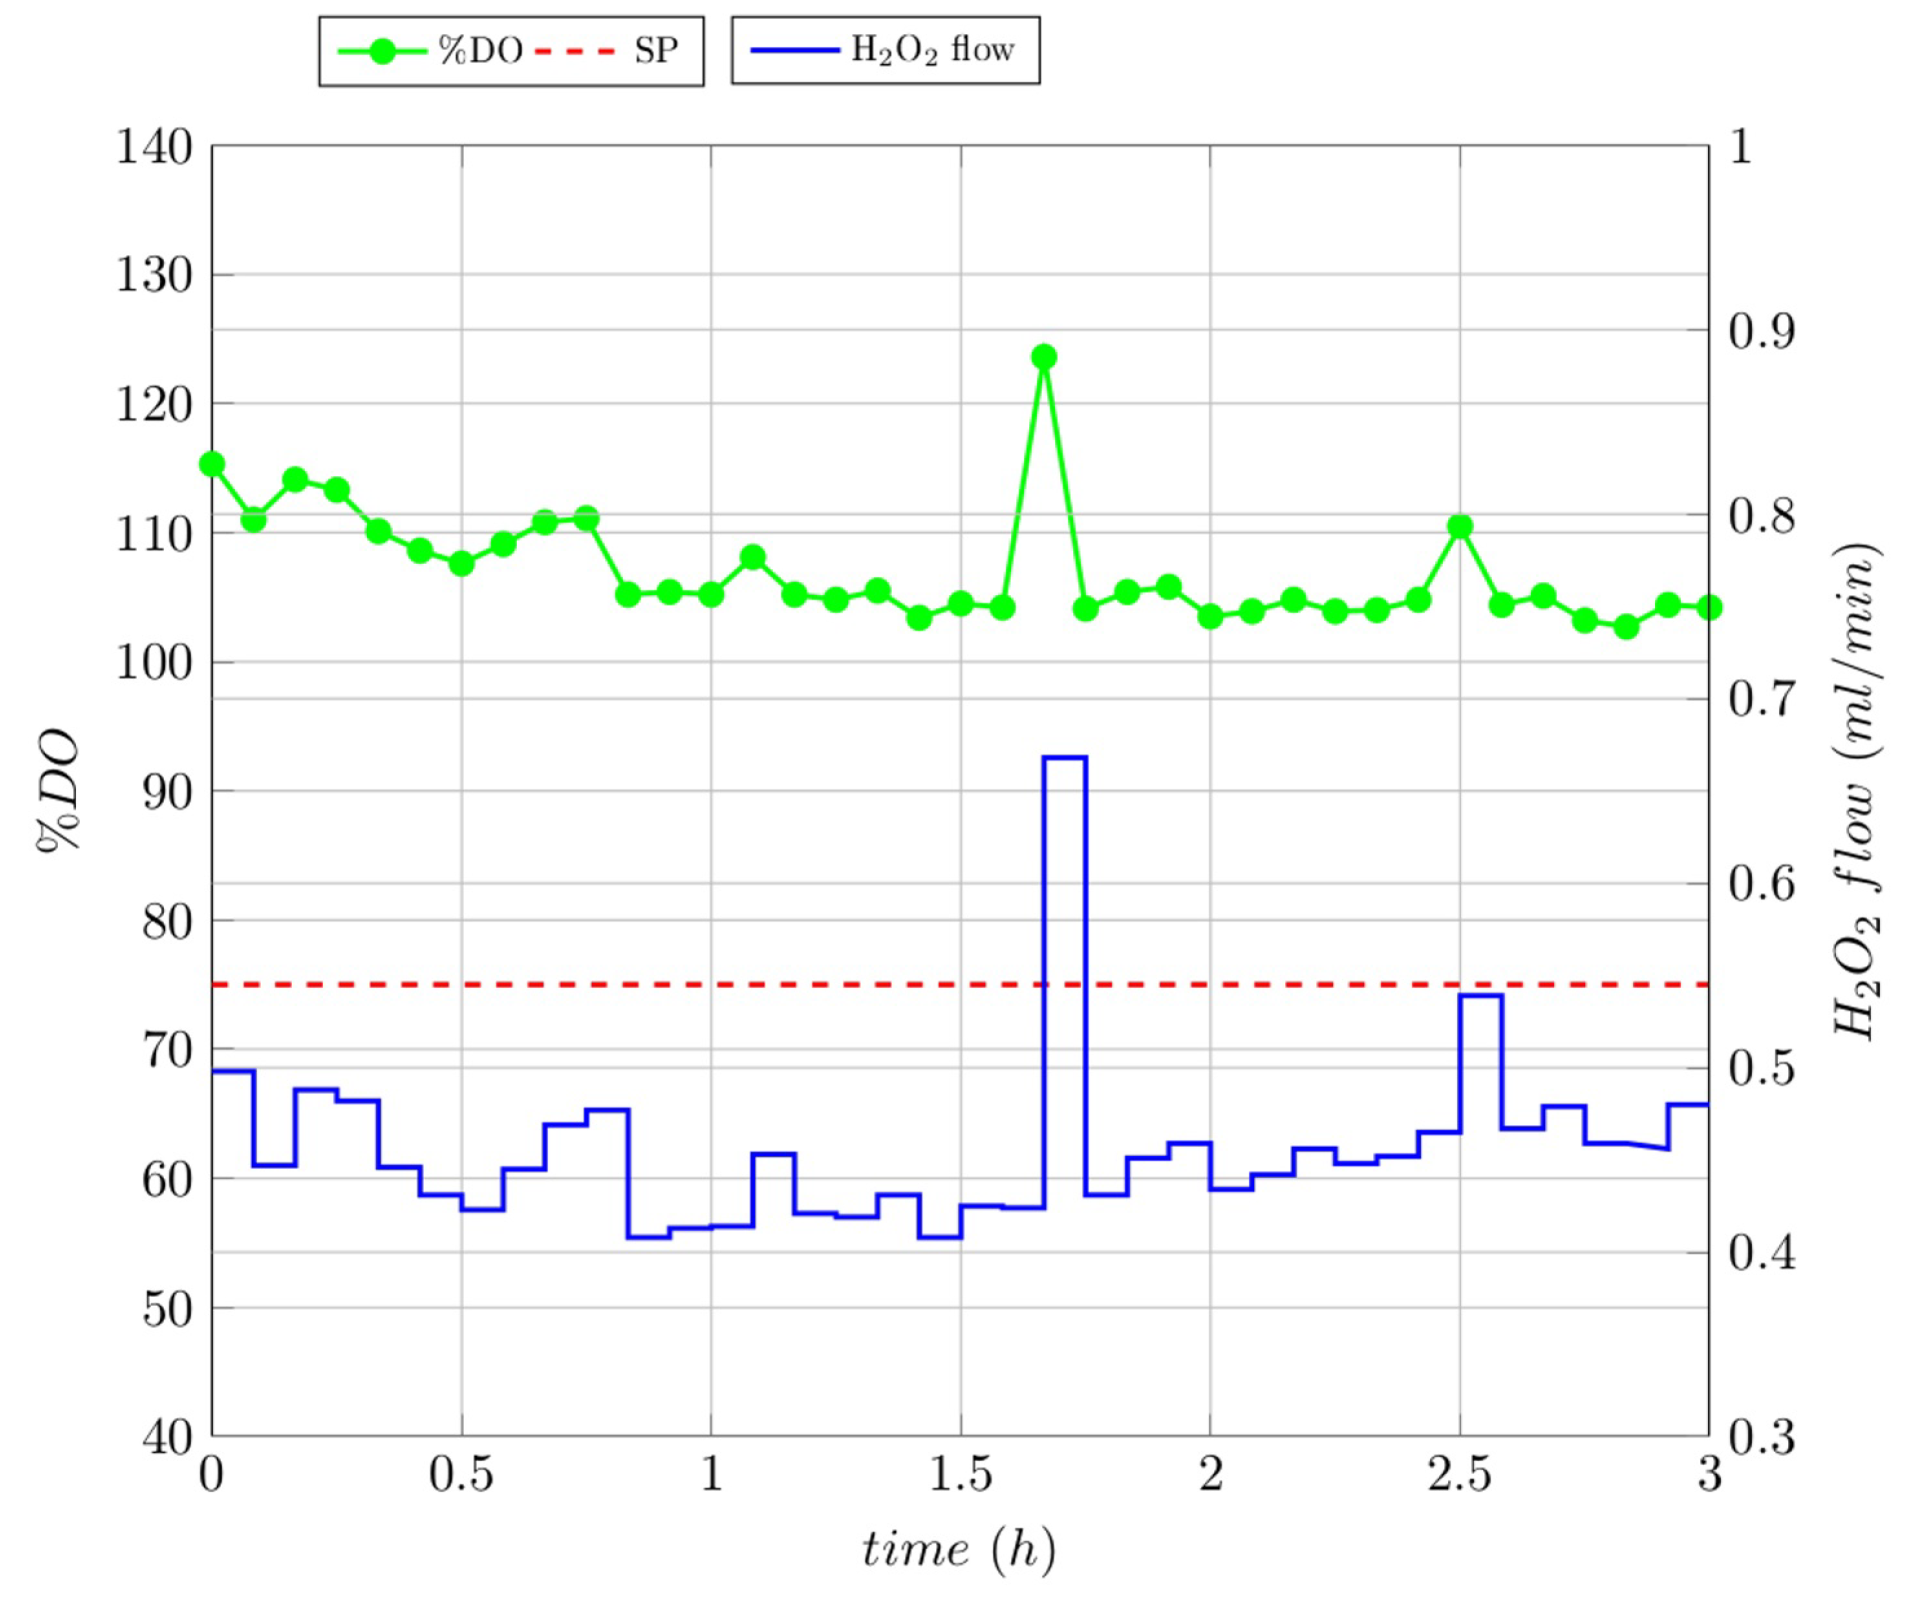
  • Closed-Loop (CL) (Automatic Control) experiments: The H 2 O 2 dosing was carried out automatically following the control law depicted in the following sections. The online DO measurement, which was used as an indirect control variable instead of true RC measurements, was measured every 5 min to calculate the new H 2 O 2 flow. The reaction started when the peristaltic pump was operated with the first calculated flow. During experiments, samples were taken to analyze the different variables.

2.5. Instrumentation

Atlas-Scientific™devices were used, i.e., the peristaltic pump (EZO-PMP/Atlas-Scientific) and the dissolved oxygen sensor (ENV-40-DO/Atlas-Scientific). The sensor had a card (DO-EZO/Atlas-Scientific) that supported the UART communication protocol. The data acquisition card was an Arduino-Mega UNO™, which facilitated the collection of data and sending of input signals to the peristaltic pump. The programs used were made in Python. Sensor data were taken every second.

2.6. Modeling and Control

As it was already depicted beforehand, the H 2 O 2 flow (mL/min) was used as the input variable (manipulable variable) and the dissolved oxygen as saturation percentage as the output variable (measurable variable). The modeling (OL experiments) was carried out applying the reaction curve method (which consists in registering the output variable response in the face of a step-change in the input variable) [31]. In all the cases, the applied step-change was 0.1 mL/ min of H 2 O 2 flow with a concentration of 1000 ppm. The system without the presence of H 2 O 2 was defined as the equilibrium point.
Following this method, a typical first-order behavior was observed for each RC as depicted in the following section. Thus, in consequence, a first-order transfer function in the Laplace domain was proposed for modeling the degradation of each RC under consideration as follows:
G ( s ) = κ τ s + 1
where the system gain κ is defined as the ratio between the change in the output variable and the change in the input variable, while the time constant τ , represents a measure of the system response velocity [31]. Once the first-order transfer function was obtained, the direct synthesis approach indicates that a PI controller should be used. Thus, this method was used to design and synthesize that PI controller, which resulted in the following discrete generic control input:
u ( k ) = K c ϵ ( k ) + Δ t τ i i = 0 k ϵ ( k )
where k is the discrete sampling counter, K c is the proportional gain, τ i is the integral time, ϵ ( k ) is the error between the measured dissolved oxygen concentration and its set-point (desirable value of dissolved oxygen), and Δ t is the sample time). According to the direct synthesis method, these parameters are calculated as follows: K c = τ / ( κ τ r ) , τ i = τ , where τ r is the time constant of a reference trajectory (usually a first-order one as well), while, κ and τ are obtained from Equation (6) [32].

3. Results and Discussions

3.1. Open-Loop Experiments

Figure 2, Figure 3 and Figure 4 show the reaction curves obtained for each RC. Table 2 shows the degradation of the RC at the end of the reaction time. The variables TOC, COD, and pollutant concentrations were analyzed to assess the degradation percentage concerning the initial concentration of each RC and to compare in the face of closed-loop experiments. Notice that in the case of Gallic acid and melanoidin, the initial DO percentage is reported as greater than 100%. Measurements are correct, but a possible explanation for this phenomenon is that from the first peroxide dosage, these RC released O 2 contributing to an initial increase. The H 2 O 2 consumption in the OL experiments was 70% for Gallic acid, 20% for lignin, and 55% for melanoidin. The percentage of H 2 O 2 consumption was evaluated considering the entire compound added throughout the experiment. In the case of lignin and melanoidin, which are colored compounds, the final sample showed a color difference concerning the initial ones. At the beginning of the experiment, a darker color was observed, but a clearer color was obtained at the end.
Although in the degradation of melanoidin, there was a reduction in the initial dark color, in the OL experiment, there was no appreciable TOC removal (0%), and the COD removal was minimal (5%), but its degradation was 70%. Considering this result, it may be possible that the melanoidin molecule was fractionated, not presenting an appreciable color; and anyway, it did not reach complete mineralization. In the OL experiments, the reaction time was 3 h for Gallic acid and lignin (see Figure 2 and Figure 3). On the other hand, the reaction time was 4 h for melanoidin (Figure 4) because to apply the reaction curve method, it was necessary to achieve stabilization of the dissolved oxygen concentration.

3.2. Modeling Ol Degradation of the Studied Recalcitrant Compounds

As depicted beforehand, first-order transfer functions (TF) (Equation (6) type) were obtained for each studied RC.
In addition, the OL experimental data, Figure 2, Figure 3 and Figure 4 show, the obtained model curve (in red) for each respective TF, as well as the constant H 2 O 2 flow applied to each experiment. The TF parameters are shown in Table 3. The system gain κ for each compound is negative because the DO tends to decrease with the progress of the reaction. Unlike the homogeneous photo-Fenton process, the release of oxygen is slower in the heterogeneous process, however this does not limit the degradation of pollutants.

3.3. Controllers Design by the Direct Synthesis Method

For calculating the parameters of the PI controllers, the sampling Δ t was set at 5 min, due to the specifications of the pump, which could dose a minimum volume of 0.5 mL in a time of 5 min, so the lowest flow that it could be dosed was 0.1 mL/min. These controller parameters are shown in Table 4.

3.4. Closed-Loop Experiments

The CL experiments were carried out through the automatic dosing of H 2 O 2 . A reaction time of 3 h was selected for each studied RC because the added volume of H 2 O 2 could not exceed 5% of the original volume in the reactor since if this happens, the solution would be diluted, affecting the results.
Similarly to Table 2, now Table 5 shows the degradation of the studied RC under the CL experimental conditions. Again, melanoidin showed low reduction values of TOC and COD, but it showed significant degradation. So, it can be considered as the most recalcitrant compound compared with Gallic acid and lignin. In the Gallic acid CL experiment, 73% of all the H 2 O 2 added was consumed. In its turn, only 36% of the H 2 O 2 added was consumed for lignin and 50% for melanoidin.
Figure 5, Figure 6 and Figure 7 show the degradation dynamics for the different RC in the CL experiments. In the degradation of Gallic acid (Figure 5) a Set-Point (SP) of 45% Dissolved Oxygen (DO) was selected, but through 3 h, the percentage of DO decreased faster within the first 45 min of reaction, and later it diminished slowly. After 3 h, it did not reach the SP, but it was very close. Maybe a larger reaction time should be necessary. The highest flows calculated by the controller were given at the beginning; thus, the greatest degradation occurred at this time.
A SP of 60% of DO was selected in the degradation of lignin at CL conditions (Figure 6). Similar to Gallic degradation, in this case, the SP was not fully achieved since an 18% control error persisted after a 3 h reaction time. However, in Figure 5 and Figure 6, it can be noted that the tendency to decrease the %DO continues so that the SP in both cases would be reached in a longer reaction time. However, such a situation would have involved unwanted reactor media dilutions. Therefore, to reach a defined SP, it is advisable to use a larger reactor volume or devices that dose smaller volumes at higher peroxide concentrations. On the other hand, in Figure 5 and Figure 6 it can be seen how the H 2 O 2 concentration increased slowly during the first hour of reaction and later began to accumulate. In this case, the more significant amount of H 2 O 2 was added at the beginning as well.
Figure 7 shows the degradation of melanoidin in the Closed-Loop mode. In this experiment, a SP of 75% of DO was selected. However, the obtained results showed a greater control error, even with percentages again greater than 100% in the cases of melanoidin degradation and Gallic acid degradation. As in the Open-Loop experiments, a possible explanation is that these RC released oxygen from the first peroxide addition, increase the initial DO concentration. However, as can be seen in this figure, despite this initial situation, a tendency to decrease was observed after that. Indeed, as stated above, melanoidin showed to be the most recalcitrant studied compound, and thus, a longer reaction time should be advisable but under different experimental design conditions (mainly volume) to avoid dilution effects. Nevertheless, even under experimental conditions showed in this work, the positive tendency to reach the SP is remarkable if the adopted degradation time had been enough.

3.5. Comparison between Ol and Cl Experiments

The removal of TOC was greater in the closed-loop experiments than in the Open-Loop ones. The removal of TOC in CL experiments was higher by 10% for Gallic acid, 17.5% for lignin and 7% for melanoidin. Similar results were obtained for COD in Gallic acid and melanoidin. Still, the COD removal of lignin at OL experimental conditions was better than at CL experimental conditions.
For Gallic acid and lignin, the decrease in the RC concentration was better at CL experimental conditions than those at OL experiment conditions, in which a difference between both of 20% for Gallic acid and 8.2% for lignin was observed.
In melanoidin, more significant degradation was obtained at OL experimental conditions because this experiment used a longer reaction time, even though the degradation difference was only 4%. From a general analysis and considering the mineralization variables, i.e., TOC, better degradation was achieved at Closed-Loop experimental conditions.
In addition, it is worth mentioning that the degradation of these compounds tends to slow down after the first hour, so the rate of degradation after this time decreased. However, in some cases, the degradation of these RC continued, although the removal of TOC and COD did not follow, suggesting that the molecules of lignin, Gallic acid, and melanoidin were fractionated into smaller molecules, but without achieving total degradation.
In a homogeneous photo-Fenton process, it has been observed that dissolved oxygen is released quickly during the reaction. Still, in the case of a heterogeneous photo-Fenton process, under the conditions used, this variable decreased, which indicates that the reaction is slower. However, even with this limitation, the %DO is still a variable to consider to improve lignin and Gallic acid degradation by a heterogeneous photo-Fenton process.

4. Conclusions

In the studied heterogeneous photo-Fenton process, dissolved oxygen as an output variable was useful to perform an automatic H 2 O 2 dosage because it can provide real-time data from the system, which is not possible to do with variables that require offline physicochemical analysis.
Applying the reaction curve method was a viable option for modeling the degradation of recalcitrant compounds in the heterogeneous photo-Fenton process. Modeling this process, starting from a pseudo-equilibrium (where the H 2 O 2 concentration was zero), was adequate because the degradation was faster at the beginning of the experiment and tended to decrease with time.
By calculating the parameters of the controller with the direct synthesis technique, it was possible to provide a quick way to perform the tuning of the controllers. Although the reference was not reached in a relatively short time, studied systems showed a sufficiently fast dynamic at the start to achieve acceptable results.

Author Contributions

Conceptualization, R.A.F.-E., V.A.-G. and L.A.M.R.; methodology, R.A.F.-E., V.A.-G., E.C., L.A.M.R. and E.U.-G.; software, K.E.S.-F.; validation, K.E.S.-F., R.A.F.-E. and V.A.-G.; formal analysis, K.E.S.-F., R.A.F.-E. and V.A.-G.; investigation, K.E.S.-F., B.G.d.S. and R.A.F.-E.; resources, V.A.-G., E.C., L.A.M.R. and E.U.-G.; writing—original draft preparation, K.E.S.-F.; writing—review and editing, K.E.S.-F., R.A.F.-E. and V.A.-G.; visualization, K.E.S.-F. and R.A.F.-E.; supervision, R.A.F.-E. and V.A.-G.; Project administration, V.A.-G. and E.U.-G.; funding acquisition, V.A.-G., E.C., L.A.M.R. and E.U.-G. All authors have read and agreed to the published version of the manuscript.

Funding

This research was funded by: the Mexican Council of Science and Technology (CONACyT), the Brazilian Coordination for the Improvement of Higher Education Personnel (CAPES), and Sustainable Water Management in Developing Countries - Higher Education Excellence in Development Cooperation (SWINDON-EXCEED) project financed by the German Academic Exchange Service (DAAD).

Acknowledgments

Authors are grateful to CAPES Brazilian Founding Agencies (Chemical Engineering Program at Federal University of São Carlos) for the financial support. Authors are also grateful to the SWINDON-EXCEED Project financed by DAAD (Germany), for the mobility training of K.E.S-F at Federal University of São Carlos, Brazil. V.A-G. acknowledges as well the sabbatical year stay CONACyT grant at UFSM. B.G.S. also thanks CAPES-Brazil for the Ph.D. fellowship.

Conflicts of Interest

The authors declare no conflict of interest.

Abbreviations

The following abbreviations are used in this manuscript:
ADAnaerobic Digestion
AOPAdvanced Oxidation Processes
CLClosed-Loop
CODChemical Oxygen Demand
DODissolved Oxygen
HPPHeterogeneous Photo-Fenton Process
OLOpen Loop
PIProportional Integral
RCRecalcitrant Compounds
SPSet-Point
TFTransfer Function
TOCTotal Organic Carbon

References

  1. Campos, C.R.; Mesquita, V.A.; Silva, C.F.; Schwan, R.F. Efficiency of physicochemical and biological treatments of vinasse and their influence on indigenous microbiota for disposal into the environment. Waste Manag. 2014, 34, 2036–2046. [Google Scholar] [CrossRef] [PubMed]
  2. Santos, J.F.; Canettieri, E.V.; Souza, S.M.A.; Rodrigues, R.C.L.B.; Acosta Martínez, E. Treatment of Sugarcane Vinasse from Cachaça Production for the Obtainment of Candida utilis CCT 3469 biomass. Biochem. Eng. J. 2019, 148, 131–137. [Google Scholar] [CrossRef]
  3. Instituto Brasileiro de Cachaça (IBRAC). Serviços Estatísticas Mercado. Available online: https://ibrac.net/servicos/mercado-interno (accessed on 18 October 2021).
  4. López-López, A.; Davila-Vazquez, G.; León-Becerril, E.; Villegas-García, E.; Gallardo-Valdez, J. Tequila vinasses: Generation and full scale treatment processes. Rev. Environ. Sci. Bio/Technol. 2010, 9, 109–116. [Google Scholar] [CrossRef]
  5. Consejo Regulador del Tequila (CRT). Estadísticas Consejo Regulator del Tequila. (Statistics Tequila Regulator Council). Available online: http://www.crt.org.mx/ (accessed on 18 October 2021).
  6. España-Gamboa, E.; Mijangos-Cortes, J.; Barahona-Perez, L.; Dominguez-Maldonado, J.; Hernández-Zarate, G.; Alzate-Gaviria, L. Vinasses: Characterization and treatments. Waste Manag. Res. 2011, 29, 1235–1250. [Google Scholar] [CrossRef] [PubMed]
  7. García-Sanchez, R.; Ramos-Ibarra, R.; Guatemala-Morales, G.; Arriola-Guevera, E.; Toriz-González, G.; Corona-González, R.I. Photofermentation of Tequila vinasses by Rhodopseudomonas pseudopalustris to produce hydrogen. Int. J. Hydrogen Energy 2018, 43, 15857–15869. [Google Scholar] [CrossRef]
  8. Iñiguez, G.; Acosta, N.; Martinez, L.; Parra, J.; González, O. Utilización de subproductos de la industria tequilera. Parte 7. Compostaje de bagazo de agave y vinazas tequileras (Use of by-products of the Tequila industry. Part 7. Composting of agave bagasse and Tequila vinasse). Rev. Int. Contam. Ambiental 2005, 21, 37–50. [Google Scholar]
  9. Pires, J.F.; Ferreira, G.M.R.; Reis, K.C.; Schwan, R.F.; Silva, C.F. Mixed yeasts inocula for simultaneous production of SCP and treatment of vinasse to reduce soil and fresh water pollution. J. Environ. Manag. 2016, 182, 455–463. [Google Scholar] [CrossRef]
  10. Méndez-Acosta, H.O.; Snell-Castro, R.; Alcaraz-Gonzalez, V.; González-Álvarez, V.; Pelayo-Ortiz, C. Anaerobic treatment of Tequila vinasses in a CSTR-type digester. Biodegradation 2010, 21, 357–363. [Google Scholar] [CrossRef]
  11. Santos, T.S.; Queiroz Cunha, G.P.; Lacerda Maia, J.; Vital do Carmo, A.L.; Lipra, G.C.; Morais, A.A. Analise dos efluentes da producção de Cachaça e seus impactos sobre os recursos hídricos monitorados em Itabira-MG. Associação Brasileira de Recursos Hídricos. In Proceedings of the XX Simpósio Brasileiro de Recursos Hídricos, Bento Gonçalves, RS, Brasil, 17–22 November 2013. [Google Scholar]
  12. Robles-González, V.; Galíndez-Mayer, J.; Rinderknecht-Seijas, N.; Poggi-Varaldo, H.M. Treatment of mezcal vinasses: A review. J. Biotechnol. 2012, 157, 524–546. [Google Scholar] [CrossRef] [PubMed]
  13. Fitzgibbon, F.J.; Nigam, P.; Singh, D.; Marchant, R. Biological treatment of distillery waste for pollution-remediation. J. Basic Microbiol. 1995, 35, 293–301. [Google Scholar] [CrossRef]
  14. Jiménez, A.M.; Borja, R.; Martın, A. Aerobic-anaerobic biodegradation of beet molasses alcoholic fermentation wastewater. Process Biochem. 2003, 38, 1275–1284. [Google Scholar] [CrossRef]
  15. Rahim Pouran, S.; Abdul Aziz, A.R.; Wan Daud, W.M.A. Review on the main advances in photo-Fenton oxidation system for recalcitrant wastewaters. J. Ind. Eng. Chem. 2015, 21, 53–69. [Google Scholar] [CrossRef]
  16. Mills, A.; Davies, R.H.; Worsley, D. Water Purification by Semiconductor Photocatalysis. Chem. Soc. Rev. 1993, 22, 417–425. [Google Scholar] [CrossRef]
  17. Moreira, F.C.; Boaventura, R.A.; Brillas, E.; Vilar, V.J. Electrochemical advanced oxidation processes: A review on their application to synthetic and real wastewaters. Appl. Catal. B 2017, 202, 217–261. [Google Scholar] [CrossRef]
  18. Poyatos, J.M.; Muñio, M.; Almecija, M.; Torres, J.; Hontoria, E.; Osorio, F. Advanced oxidation processes for wastewater treatment: State of the art. Water Air Soil Pollut. 2010, 205, 187–204. [Google Scholar] [CrossRef]
  19. Clarizia, L.; Russo, D.; Somma, I.D.; Marotta, R.; Andreozzi, R. Homogeneous photo-Fenton processes at near neutral pH: A review. Appl. Catal. B 2017, 209, 358–371. [Google Scholar] [CrossRef]
  20. Thomas, N.; Dionysiou, D.D.; Pillai, S.C. Heterogeneous Fenton catalysts: A review of recent advances. J. Hazard. Mater. 2021, 404, 124082. [Google Scholar] [CrossRef]
  21. Dowd, K.O.; Pillai, S.C. Photo-Fenton disinfection at near neutral pH: Process, parameter optimization and recent advances. J. Environ. Chem. Eng. 2020, 8, 104063. [Google Scholar]
  22. Herney-Ramirez, J.; Vicente, M.A.; Madeira, L.M. Heterogeneous photo-Fenton oxidation with pillared clay-based catalysts for wastewater treatment: A review. Appl. Catal. B 2010, 98, 10–26. [Google Scholar] [CrossRef]
  23. Xiangwei, Y.; Graells, M.; Miralles-Cuevas, S.; Cabrera-Reina, A.; Pérez-Moya, M. An improved hybrid strategy for online dosage of hydrogen peroxide in photo-Fenton processes. J. Environ. Chem. Eng. 2021, 9, 105235. [Google Scholar] [CrossRef]
  24. Ortega-Gómez, E.; Moreno Úbeda, J.C.; Álvarez Hervás, J.D.; Casas López, J.L.; Santos-Juanes, J.L.; Sánchez Pérez, J.A. Automatic dosage of hydrogen peroxide in solar photo-Fenton plants: Development of a control strategy for efficiency enhancement. J. Hazard. Mater. 2012, 237–238, 223–230. [Google Scholar] [CrossRef]
  25. Santos-Juanes, L.; García Sánchez, J.L.; Casas López, J.L.; Oller, I.; Malato, S.; Sáchez Pérez, J.A. Dissolved oxygen concentration: A key parameter in monitoring the photo-fenton process. Appl. Catal. B 2011, 104, 316–323. [Google Scholar] [CrossRef]
  26. Bernardo, E.C.; Egashira, R.; Kawasaki, J. Decolorization of molasses’ wastewater using activated carbon prepared from cane bagasse. Carbon 1997, 35, 1217–1221. [Google Scholar] [CrossRef]
  27. Souza, B.G. Catalisadores Magnéticos a Base de Ferritas de Co ou Zn de Heteroestruturas TiO2/Ferrita-Avaliação na Degradação Fotocatalitica de Lignina (Magnetic Catalysts Based on Co or Zn of Hetero-Structures TiO2/Ferrite-Evaluation on Photocatalytic Degradation of Lignin). Ph.D. Thesis, Center of Exact Sciences and Technology Research Center on Advanced Materials and Energy, Federal University of São Carlos, São Carlos, Brazil, 2018. [Google Scholar]
  28. Souza, B.G.; Figueira, G.; Carvalho, M.H.; Alcaraz-Gonzalez, V.; Saldaña-Flores, K.E.; Godinho, M.; Oliveira, A.J.A.; Kiminami, R.H.G.A.; Ruotolo, L.A.M.; Urquieta-Gonzalez, E. A novel synthesis route to obtain magnetic nanocrystalline cobalt ferrite with photo-Fenton activity. Mater. Chem. Phys. 2021, 257, 123741. [Google Scholar] [CrossRef]
  29. Gómez-Martínez, J.J. Degradación de los Principales Compuestos Recalcitrantes Presentes en Vinazas Tequilera Mediante Foto-Fenton heterogéneo (Degradation of the Main Recalcitrant Compounds Present in Tequila Vinasse by Heterogeneous Photo-Fenton). Master’s Thesis, Chemical Engineering Department, University of Guadalajara, Jalisco, Mexico, 2017. [Google Scholar]
  30. Souza, B.G. Catalisadores de Fe2O3, NiO e Fe2O3-NiO Suportados in Situ em Ce0,5Zr0,5O2 e Ce0,2Zr0,8O2 - Avaliação na redução de NO com CO (Fe2O3, NiO and Fe2O3-NiO Catalysts Supported in situ in Ce0,5Zr0,5O2 e Ce0,2Zr0,8O2 - Evaluation in the Reduction of NO with CO). Master’s Thesis, Center of Exact Sciences and Technology Research Center on Advanced Materials and Energy, Federal University of São Carlos, São Carlos, Brazil, 2014. [Google Scholar]
  31. Seborg, E.E.; Edgar, T.F.; Mellichamp, D.A.; Doyle, F.J. Process Dynamics and Control; John Wiley & Sons, Inc.: New York, NY, USA, 2017; pp. 109–110. [Google Scholar]
  32. Ogunnaike, B.A.; Ray, W.H. Process Dynamics, Modeling and Control; Gubbins, K.E., Ed.; Oxford University Press: New York, NY, USA, 1994; pp. 648–651. [Google Scholar]
Figure 1. Diagram of the photo-Fenton reaction system: (1) reactor, (2) dissolved oxygen sensor, (3) magnetic stirrer, (4) stirring plate, (5) water recirculation, (6) water pump, (7) water container, (8) peroxide container, (9) H 2 O 2 pump, (10) H 2 O 2 input, (11) wood box, (12) circular LED camera.
Processes 09 02167 g001
Figure 2. Degradation of Gallic acid during the Open-Loop experiment.
Processes 09 02167 g002
Figure 3. Degradation of lignin during the Open-Loop experiment.
Processes 09 02167 g003
Figure 4. Degradation of melanoidin during the Open-Loop experiment.
Processes 09 02167 g004
Figure 5. Degradation of Gallic acid under Closed-Loop experiment conditions.
Processes 09 02167 g005
Figure 6. Degradation of lignin under Closed-Loop experimental conditions.
Processes 09 02167 g006
Figure 7. Degradation of melanoidin under Closed-Loop experiment conditions.
Processes 09 02167 g007
Table 1. Composition of the Cachaça and Tequila vinasses.
ParameterUnitCachaça [9,11]Tequila [10]
pH, 25 C 3.5–4.83.35
Temperature C80–10050.4
Biochemical oxygen demand (BOD)gL 1 6–1813–24
Chemical oxygen demand (COD)gL 1 14–39.528–50
Total suspended solids (TSS)gL 1 0.1812
Volatile suspended solids (VSS)gL 1 20.39.8
Total volatile fatty acids (acetic acid)gL 1 na2.5–3.4
Total nitrogen (N T )gL 1 0.15–1.190.243
Total phosphorus (P T )gL 1 0.004–0.320.021
Fats and oilsgL 1 na0.018–0.031
na: data not available.
Table 2. Degradation of the studied RC obtained at the end of the applied OL experiments.
RCRC DegradationTOC RemovalCOD Removal
Gallic acid38%19%21%
Lignin28.8%21.5%20.8%
Melanoidin72%0%5%
Table 3. Transfer function parameters in the Laplace domain for each RC obtained from OL experiment data.
   κ (% DO h/mL) τ (h)
Gallic acid−9.970.65
Lignin−3.700.57
Melanoidin−2.000.80
Table 4. Calculated PI controller parameters, and considered reference-trajectory time constants for each RC according to Equation (7).
   K c (mL/(%DO h)) τ i (h) τ r (h)
Gallic acid−0.8560.650.01
Lignin−1.5420.570.10
Melanoidin−0.7410.800.09
Table 5. Degradation of the studied RC under CL experimental conditions.
RCRC DegradationTOC RemovalCOD Removal
Gallic acid58%29%57%
Lignin37%39%16%
Melanoidin68%7%6.5%
Publisher’s Note: MDPI stays neutral with regard to jurisdictional claims in published maps and institutional affiliations.

