Article

Computer-Aided Framework for the Design of Optimal Bio-Oil/Solvent Blend with Economic Considerations

by
Jia Wen Chong
1,
Lik Yin Ng
2,
Omar Anas Aboagwa
1,
Suchithra Thangalazhy-Gopakumar
1,
Kasturi Muthoosamy
3 and
Nishanth G. Chemmangattuvalappil
1,*
1
Department of Chemical and Environmental Engineering, University of Nottingham Malaysia, Jalan Broga, Semenyih 43500, Selangor, Malaysia
2
School of Engineering and Physical Sciences, Heriot-Watt University Malaysia, No. 1, Jalan Venna P5/2, Precinct 5, Putrajaya 62200, Wilayah Persekutuan Putrajaya, Malaysia
3
Nanotechnology Research Group, Centre of Nanotechnology and Advanced Materials, University of Nottingham Malaysia, Semenyih 43500, Selangor, Malaysia
*
Author to whom correspondence should be addressed.
Processes 2021, 9(12), 2159; https://doi.org/10.3390/pr9122159
Submission received: 29 October 2021 / Revised: 24 November 2021 / Accepted: 26 November 2021 / Published: 29 November 2021

Abstract

:
A major obstacle in utilising pyrolysis bio-oil as biofuel is its relatively low heating value, high viscosity, and non-homogeneity. Solvent addition is a simple yet practical approach in upgrading pyrolysis bio-oil. However, most solvents are often manufactured as specialty chemicals, and thus, this leads to a high production cost of solvents. It is crucial for the designed solvent-oil blend to achieve both fuel functionality and economic targets to be competitive with the conventional diesel fuel. Hence, the objective of this work is to generate feasible solvent candidates by solving this multi-objective optimisation (MOO) problem via a computer-aided molecular design (CAMD) approach. Initially, an optimisation model was developed to identify potential solvents that satisfied the predefined targeted properties. Next, a MOO model was developed via a fuzzy optimisation approach to identify the trade-off between profitability and heating value of the solvent-oil blend. A pricing model was employed to estimate the profitability of the solvent-oil blend. The production of bio-oil in a pyrolysis plant was used to illustrate the applicability of the pricing model. Lastly, phase stability analysis was conducted to ensure the stability and miscibility of the solvent-oil blend. With the developed framework, a promising and cost-effective solvent-oil blend can be generated while displaying optimal biofuel properties.

1. Introduction

The conversion of lignocellulosic biomass material, also called second generation biomass, into usable intermediates has attracted the attention as a potential renewable energy source. While the extent of carbon neutrality of biomass is debatable, the need to study alternative fuels produced from biomass conversion is critical in response to fast depleting resources and the rising demand for sustainable development, as well as to counter volatilities in crude petroleum oil prices. Various methods including thermochemical and biochemical techniques can be employed to convert biomass into liquid fuels. Among the thermochemical methods, fast pyrolysis received great attention and has been successful in its commercialisation due to the high yield of the main product pyrolysis bio-oil. High-quality pyrolysis bio-oil can be applied in engines, turbines, boilers, and in some cases, qualified as hydrocarbon and transportation fuels, although further improvement is required of the properties and cost-efficiency of bio-oil [1].
A pyrolysis bio-oil mixture is vaguely defined as one with water and oxygenated organic compounds, including carboxylic acids, aromatics, acetals, alcohols, aldehydes, esters, hemiacetals, olefins, phenolics, proteins, and sulphur compounds. The actual composition of a bio-oil is an intricate function of feedstock, oil production and purification techniques, a condensation system, and storage conditions [2]. The direct use of pyrolysis bio-oil as a fossil fuel substitute suffers from several drawbacks such as low heating value, high water content, high viscosity, low miscibility, high acidity, as well as storage instability due to product aging. The properties of pyrolysis bio-oils differ for different feedstock sources and production parameters, but the products are generally of poor quality compared to conventional fuels. Upgrading technologies have been actively studied and implemented in the effort to upgrade bio-oil properties, such as catalytic cracking, emulsification, esterification, hydrodeoxygenation, hydrogenation, steam reforming, and the manipulation of supercritical fluids [3]. Pidtasang et al. [4] found that adding a small proportion of alcohol solvents to bio-oil could improve its heating value, stability, and viscosity, although the values still could not meet the quality of conventional gasoline and diesel. Organic solvents such as acetone, acetone-methanol, ethanol, isopropanol, and methanol were also used for bio-oil upgrading [5].
The identification and selection of solvents often involve tedious experimentation through trial-and-error, and it could be time consuming to test all potential solvents and ineffective in optimising blend performance to meet the property targets. In response to these challenges, computer-aided molecular design (CAMD) techniques were commonly employed to identify potential candidates that satisfy a set of property targets and constraints in the design and optimisation of solvents [6]. CAMD is a reverse engineering approach which predicts, estimates, and constructs molecules from a given set of molecular building blocks based on predefined target properties [7]. To develop a CAMD framework, it is essential to have reliable property prediction models. One of the most widely used methods for the molecular property predictions is the Group Contribution (GC) methods [8]. GC methods predict the property of a molecule by summing up the contributions from the molecular groups in the compound according to the frequency of their appearance in the structure [8]. The ability of CAMD techniques to generate all possible non-intuitive solutions can be exploited to identify promising molecular structures for various applications. With these computer-aided methods, the search was focused on analysing the alternatives and rejecting infeasible solutions at the initial stages of the design process. The experiments were only performed during the final selection stage for verification.
In the past, the CAMD approach has been widely employed in solvent design problems for different applications [9]. Detailed review articles from Austin et al. [10] and Ng et al. [11] discussed the solution techniques, applications, and future opportunities of the CAMD tools. In addition, Chemmangattuvalappil [12] reviewed the recent development of CAMD applications in the design of solvents. Conventionally, the selection of solvents had formerly been tackled using a combination of fundamental physio-chemical knowledge, as well as heuristic and empirical approaches based on expert judgements. Using CAMD techniques, studies were able to identify solvents ranging from simple hydrocarbons such as methanol and ethanol [13] to more complex mixtures such as the methanol, N,N-dimethylformamide (DMF), and acetone blend [14]. A comprehensive review on the process system engineering tools, such as CAMD and group contribution (GC) models, for the design of ionic liquids and integrated biorefineries was presented by Chemmangattuvalappil et al. [15]. In one of the recent developments, CAMD tools were employed in a multi-objective optimisation (MOO) problem targeted at designing a green chemical product and integrated biorefinery process that incorporated green manufacturing while fulfilling the customer requirements [16]. In addition, the CAMD approach was also integrated with the miscibility characteristics to predict possible structures that would form stable blends with bio-oil [17,18].
A major obstacle in the commercialisation of biofuels is their high production cost as compared to that of the conventional diesel fuel. Their low heating value and the high cost of raw materials make biofuels more costly for heat generation [19]. As the biofuel ratio increases in the fuel, the fuel’s energy density decreases. Furthermore, the addition of solvents is often required to improve the biofuel’s properties. However, the solvents are generally associated with high cost as most of them are manufactured as specialty chemicals. This further increases the production cost of biofuels. Further, the existing and progressing biofuel legislative framework sparks the urge to assess the cost associated with upgrading bio-oil.
Various recent contributions have included the economic aspects such as product pricing, profitability, market share, and operating cost in the product design. In the design of a traditional Chinese medicinal supplement, customers’ preference on product quality and economic considerations was taken into account while developing the chemical product design framework [20]. Zhang et al. [21] provided an overview of chemical product design in the context of a multidisciplinary hierarchical framework including design issues such as project management, market study, economic analysis, product design, and process design. Moreover, an activated carbon production plant from industrial waste nutshells was proposed [22]. In the plant design, an economic analysis was developed by considering the cost of the main equipment, the price of the raw materials, basic services, and operations. On the other hand, application of neural network approach is often reported in cost estimation and investment evaluation. A neural network growth model was proposed to estimate potential of investment in renewables in Japan by Jehan, and Sultonov [23]. In addition to the existing growth model, the extended growth model considered both environmental risk diversion and risk mitigation. With the developed neural network-based approach, the establishment and operation of a renewable investment opportunity is possible. Further, an artificial neural network method was used to develop a cost estimation model for the tendering of engineering services [24]. However, previous research on the design of bio-oil solvent mainly focused on the functionality of the solvent itself. It is also important to incorporate the economic aspects into the development of bio-oil solvent for the designed solvent-oil blend to be competitive with the conventional diesel fuel. Generally, the heating value of pyrolysis bio-oil increases with the addition of solvent. However, as the amount of solvent increases, the cost of solvent-oil blend increases as well, resulting in lower profitability. Thus, MOO approach was adapted in this work to investigate the trade-off between high heating value and high profitability of solvent-oil blend.
The weighted sum method is a more common approach for handling MOO problem. In weighted sum method, each objective function was allocated with a weighting factor to convert different objectives into an aggregated scalar objective function [25]. However, in CAMD problem, the weighting factor of each objective is not always definable. In most cases, the relative importance of each objective is fuzzy or uncertain. In addition, these objectives might be contradictory to each other in nature [26]. Thus, a fuzzy optimisation approach was employed in this study to solve the MOO problem under the fuzzy environment. Zadeh [27] first established fuzzy set theory for decision making problems. Later, the fuzzy set theory was extended to address linear mathematical programming problems involving multiple objectives [28]. Within the fuzzy optimisation algorithms, the trade-off between the objective functions to be optimised can be identified by introducing the fuzzy membership function. As a result, an optimal compromised solution can be identified by achieving near optimality for all the objectives.
In the past, fuzzy optimisation approach has been applied in various CAMD applications. A systematic fuzzy optimisation-based method was developed to design molecules for chemical processes with both property superiority and robustness optimised [26]. Khor et al. [29] adapted the fuzzy optimisation via max-min aggregation in the CAMD of alternative solvents for oil extraction from palm pressed fibre. The developed approach was able to optimise the physical properties of the solvent simultaneously with the safety and health aspects. A similar approach was employed and extended with the introduction of disjunctive programming in the work by Ten et al. [30] to design solvent for gas sweetening process. Recently, a max-min aggregation fuzzy optimisation approach was employed along with CAMD method in the design of green solvents for pyrolysis bio-oil upgrading with consideration of environmental, health and safety aspect while ensuring minimal compromise on the fuel functionality [31]. The goal of this study is to design a solvent which is capable to enhance the properties of bio-oil with minimal addition of solvent via CAMD approach. Fuzzy optimisation approach was employed to investigate the trade-off between the functionality and profitability of the solvent-oil blend. With the developed methodology, the final solvent-oil blend should demonstrate promising property targets that fulfils the standards of biofuel while displaying desirable profit margin.
2. Methodology

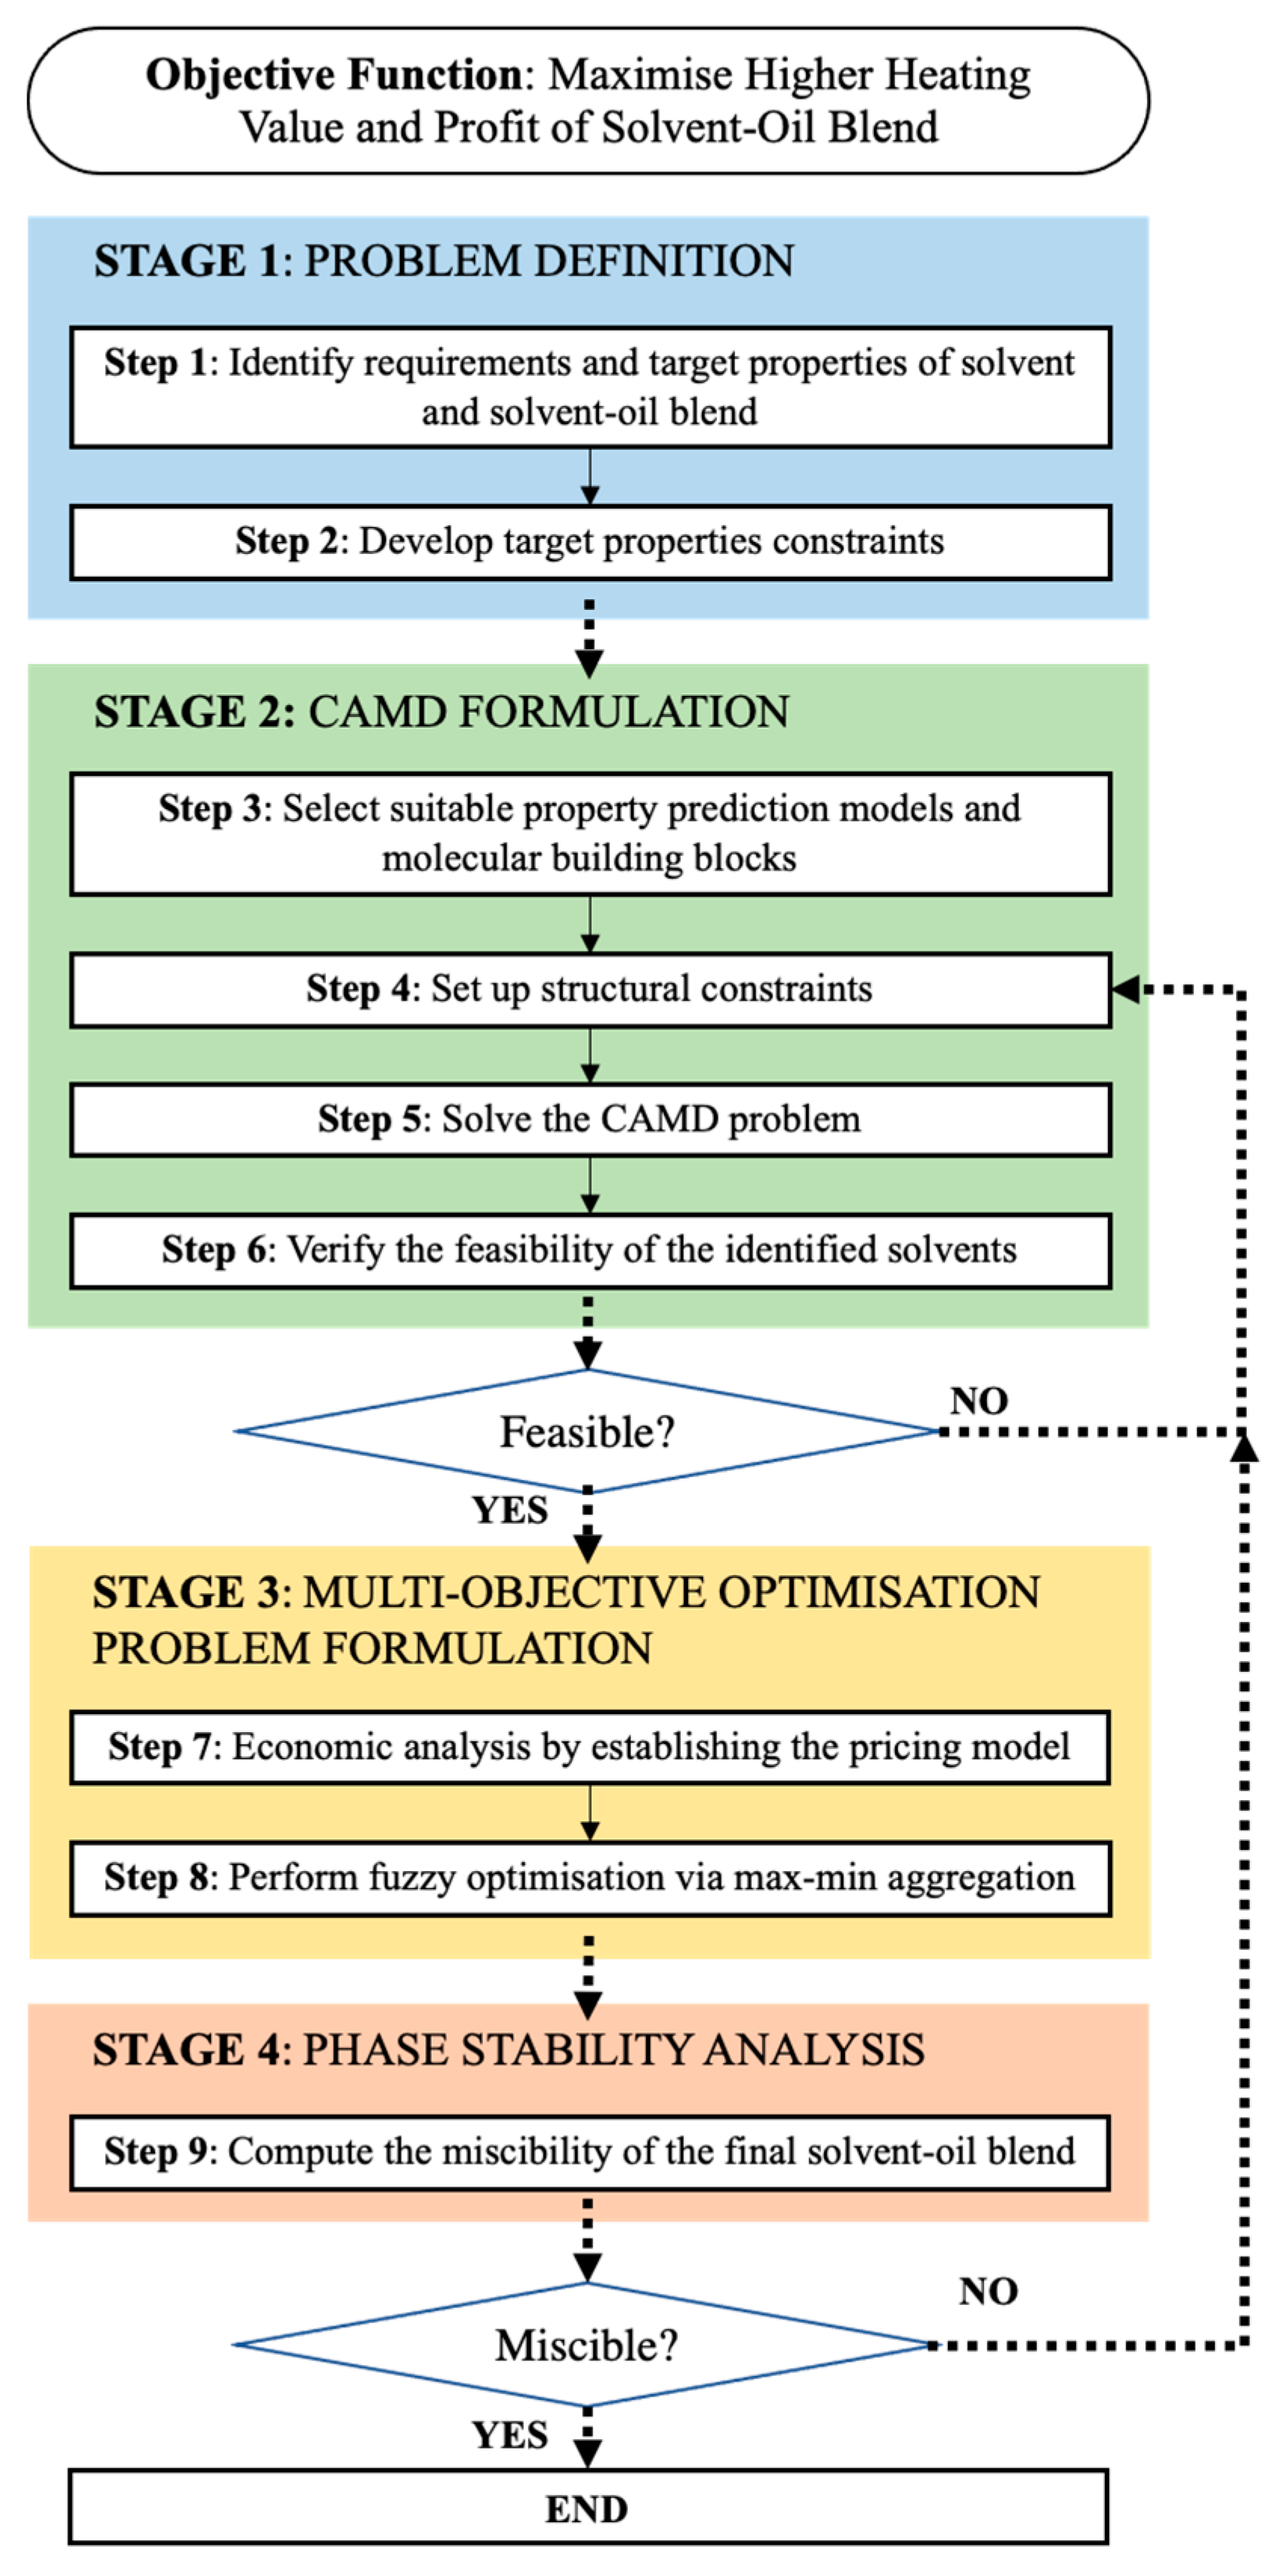
In this work, a MOO framework was established to solve the CAMD problem using fuzzy optimisation approach. The developed framework can be divided into four main stages (nine steps): Problem definition, CAMD formulation, Multi-objective optimisation problem formulation and Phase stability analysis. The detailed methodology for each stage will be further discussed in this section. Figure 1 demonstrates the overview of methodology for this CAMD problem.

2.1. Stage 1: Problem Definition

Identification of Product Requirements and Property Constraints

In the first stage, the product needs of solvent and the final solvent-oil blend were identified to infer the target properties and set their constraints based on the requirements from various regulations and specifications. The final requirement of the design problem is to have an alternative solvent-oil blend that can blend well with diesel, or to be applied directly to standard diesel engines. This is the principal product functionality and therefore, from these, the property targets can be developed based on commercial standards of biodiesel. In addition, the general safety and environmental regulatory requirements were also embedded in the target properties at this stage. Generally, the constraints in a product design problem took form as shown in Equation (1), bounded by upper and lower bounds [32].
v p L V p v p U ;   p = 1 ,   2 ,   P
Based on Equation (1), Vp is the value of the target property and p is the property index. The lower and upper bound value is represented by v p L and v p U , respectively. The ASTM D7544 biofuel standard was used to develop the constraints on the target properties [33]. The standard governed the pyrolysis liquid biofuel, which served as a guideline for the final solvent-oil blend’s targeted properties. To maintain the solvent as liquid at room temperature, the boiling point was set to be above 60 °C and the melting point was restricted at an upper bound of 10 °C, while the flash point was set to be greater than 45 °C. On the other hand, the lower bound for the density of mixture was set below that specified by the standard. That is to give more solutions, since eventually the solvent-oil blend is to be blended with other fuels such as diesel, which can have lower densities than those in the ASTM standard. The critical high heating value (HHV) property was restricted at a lower bound of 30 MJ/kg. Table 1 summarises the requirements of the solvent and the solvent-oil blend, which are then translated into the target properties along with its respective property constraint.

2.2. Stage 2: CAMD Formulation

2.2.1. Selection of Property Prediction Models

In the next stage, suitable property prediction models were selected to estimate the solvent’s target properties via a GC approach. In the GC approach, the property of a compound was defined as a function of structurally dependent parameters, which can be estimated by summing contributions per structural group according to their recurrence in the solvent molecule. The method was mainly attributed to the research done by Joback and Reid [8]. The general property estimation model via GC methods can be seen in Equation (2).
f ( X ) = i   N i C i + w j   M j D j + z k   O k E k
here, Ci is the contribution of the first order group of type i that occurs Ni times, while Dj is the contribution of the second order group of type j that occurs Mj times. Ek is the contribution of the third order group of type k that occurs Ok times. In addition, mixing rules were applied to determine the final values of the targeted solvent-oil blend. The selected property prediction models and mixing rules for targeted property estimation can be found in Appendix A: Table A1. In this study, crude bio-oil derived via the fast pyrolysis of palm kernel shells (PKS) was used as the basis [34]. However, only the organic phase of pyrolysis bio-oil was considered. The properties and components of the pyrolysis bio-oil applied in this study are summarised and listed in Appendix A: Table A2.

2.2.2. Structural Constraints

Other than the abovementioned property constraints, structural constraints were also included in the CAMD model to ensure the formation of a feasible molecule by limiting the molecule to that which favours the targeted properties. The molecular building blocks forming the solvent’s structure also need to be carefully tailored. Molecular design can utilise many functional group families and, in this work, several groups were selected, and are shown in Appendix A: Table A3, whereby their group-contribution variables for property estimation were available from the work of Marrero and Gani [34].
In addition, for completeness of the designed molecule, the final molecular structure must not have any free bonds. In other word, the free bond number (FBN) of the final solvent molecule must equal to zero, to be identified as a feasible molecule [35]. FBN can be expressed mathematically as Equation (3), where Nr is the number of rings in the structure and Ni is the number of acyclic groups in the molecule. Constraints were set for the parameter Nr and Ni to ensure there is a feasible length of groups included to form an aliphatic chain or cyclic ring.
F B N = Σ i N i F B N i 2 ( Σ i N i 1 ) 2 N r = 0
For acyclic structures: Ni 0. For cyclic structures: Ni 3. For ring molecules: Nr 1.

2.2.3. Formulation of CAMD Model

The CAMD model was formulated with generalised mathematical expressions as shown from Equations (4)–(8) [10]:
F o b j = max / min F ( x , p )
h 1 ( p , x ) 0
s 1 ( x ) 0
p k L p k p k U     k
x g L x g x g U     g
here, Fobj (Equation (4)) is the objective function, which is to minimise or maximise one or more parameters. Meanwhile, the F(x,p) is the vector to the objective function, which evaluate the performance of the designed solvent based on its property p. The target properties constraints can be formulated as Equation (5), which is the general function that correspond to the solvent design specification. As the properties of each solvent molecule are highly dependent on the presence of GC building blocks, this constraint can limit the number of appearances of specific GC groups in the designed solvent molecule. On the other hand, Equation (6) can be referred to as the general function that relates the molecular structure generation, to ensure structure feasibility of the generated solvent molecule. In Equations (7) and (8), pk indicates the property values for each property k and xg indicates the number of occurrences of each GC group g. Both equations represented the boundaries set on pk and xd. Here, p k L and x g L are the lower bounds for parameter pk and xg, respectively. On the other hand, p k U and x g U are the upper bounds for parameter pk and xg, respectively. With the developed CAMD framework, the list of solvent candidates that were feasible, available, and had a relatively established commercial or industrial scale presence were identified and applied in the next stage.

2.2.4. Database Verification

All solvent candidates generated from the CAMD model were verified by conducting a database search on online platforms such as PubChem, ChemSpider, etc. The main purpose of this step was to ensure that all the generated solvent candidates were feasible and practical enough to be applied in real life applications. For solvent candidates that could be found in the databases, property values estimated from the design problem were compared to validate the CAMD results. However, for solvent candidates that could be found in the database or proved to be infeasible, the previous step was revisited by revising the property attributes and constraints.

2.3. Stage 3: Multi-Objective Optimisation Problem Formulation

2.3.1. Formulation of Pricing Model

After the potential solvent candidates were identified in the previous stage, a detailed economic analysis was conducted to determine the selling price of the new solvent-oil blend based on the current market demand, availability and existing competitors identified via a comprehensive background study. The pricing model proposed by Bagajewicz [36] was employed to relate the product quality to demand and price of the product [37]. In the past, the pricing model has been incorporated in various product design such as wine [38], carpet deodorizers/disinfectants [39], skin moisturising lotion [40], die-attach adhesive [37] and dry-cleaning solvent [41]. The mathematical expression for the pricing has been shown in Equations (9) and (10).
A P T P = A C ( T P ) δ ( α β ) δ ( Y A P T P A C ) 1 δ
Y A P T P + A c T c
here, AP and TP refer to the price and demand of the new solvent-oil blend while AC and TC refer to the price and demand of the competitor’s product. In this study, AP can be obtained by summing up the cost of bio-oil production, cost of solvent and the profit obtained by selling the solvent-oil blend (Equation (11)).
A p = C o s t B i o o i l + C o s t S o l v e n t + P r o f i t
Y is the total market size for the solvent-oil blend and δ is the elasticity of substitution, which is an adjustable parameter that measures the change in the ratio of products demand in response to a change in the ratio of their prices. On the other hand, α is expressed as the consumer’s awareness on the new product, which can be raised by allocating higher budget in the marketing of new product. The value of parameter α ranges between 0 and 1, where α with value 0 indicates that the consumers have no knowledge about the new product, and vice versa. Lastly, β is the consumer preference coefficient that relates the consumer’s interest in the new product over the competing product, which can be determined using Equation (12), where the λC and λP are the consumer’s preference function of competitor’s product and new product, respectively. In this study, the consumer’s preference was related to the HHV of the solvent-oil blend, which possess a significant influence on the functionality of the solvent-oil blend.
β = λ C λ P
From Equation (12), the λC and λP refer to the consumer’s preference function of competitor’s product and new product, respectively. The new solvent-oil blend is said to be preferred by consumers if β is smaller than 1. However, the competitor’s product is preferred by consumers when the value of β greater than 1.
Based on the market analysis conducted, the total market size, Y of solvent-oil blend was identified to be USD 500 million annually [42]. The price elasticity was defined between the range of 0.11 to 0.33, based on the previous studies for diesel fuel. The demand of bio-oil blend was said to be price inelastic when the parameter δ lies between 0.1 to 1. Thus, in this work, the parameter δ was assumed to be 0.1 [43]. On the other hand, the parameter α was estimated to be at the value 0.85. These values should be revised and updated based on the response received once the solvent-oil blend was introduced into the market. The benchmark for this work is the reported solvent-oil blend consisting of 50 wt.% pyrolysis bio-oil and 50 wt.% of iso-propanol, with a HHV of 27.55 MJ/kg [44]. The cost of iso-propanol and bio-oil was assumed to be USD 1336.57 per tonne of iso-propanol and USD 354 per tonne of pyrolysis bio-oil [45,46]. The cost of the competitor’s solvent-oil blend can be calculated using Equation (13), where xi and Ci are the ratio and costs of the solvent and bio-oil, respectively.
C b l e n d = Σ i x i C i
Next, the selling price of competitor’s blend AC can be calculated by summing up the cost of solvent-oil blend and the profit obtained, which was assumed to be USD 50 per tonne of solvent-oil blend, in this case. Table 2 summarises the parameters and its respective values obtained from this market analysis.

2.3.2. Formulation of Fuzzy Multi-Objective Optimisation via Max-Min Aggregation

The HHV of pyrolysis bio-oil can be increased with the addition of solvent. The higher the mass fraction of solvent in the solvent-oil blend, the higher is the energy content. However, a higher amount of solvent was often associated with higher cost, and thus, lower profitability obtained from the solvent-oil blend. In this study, a MOO problem was developed to investigate the trade-off between high HHV and high profitability. Most of the current CAMD techniques focus on optimising a single objective or property of the chemical product [29], but having a multi-objective problem necessitates the use of more complex optimisation methods.
Thus, fuzzy mathematical programming was applied to solve the MOO design problem. The satisfaction degree of fuzzy, λ is introduced to both property functions that were to be optimised. The degree λ is a continues variable that lies between the value 0 and 1, where 0 indicates unsatisfactory and 1 is completely satisfactory (Equation (14)).
0 λ 1
The objective function of the fuzzy optimisation model was to maximise the overall satisfaction degree of fuzzy constraint λ as shown in Equation (15). The max-min aggregation was applied to the fuzzy programming, where every fuzzy constraint should be satisfied partially at least to the degree λ.
f o b j = max λ
Fuzzy goals for the HHV of solvent-oil blend and the profitability were expressed using a linear membership function, as shown in Equations (16) and (17).
λ p ( max ) =   { 0 ,   |   V p v p L V p v p L v p L v p L ,   |   v p L V p v p U 1 ,   |   V p v p U         p P
λ p   λ
where Vp is the target property values bounded by the lower and upper bounds, v p L and v p U , respectively. The values for the lower and upper bound can be obtained by performing single objective optimisation for both objective functions.

2.4. Stage 4: Phase Stability Analysis

With the identification of optimal solvent-oil blend ratio from the previous step, phase stability analysis was carried out to ensure the miscibility of the designed solvent-oil blend at the targeted mixing ratio. In this work, the phase stability analysis was conducted via computation of the tangent plane distance. With fixed temperature and pressure, Gibbs tangent plane distance function was employed for the phase stability analysis of N-component mixture (Equation (18)) [47]:
d ( x ) = i = 1 n x i [ ln x i γ i ( x ) ln z i γ i ( z ) ]
From Equation (18), z refers to the compositions of component i in mole fractions of the tested phase, x is the composition component i of a trial phase and γ is the activity coefficient of component i in respective phases. For a solvent-oil blend that is stable and demonstrates homogenous single-phase, Equation (19) can be followed [47]:
d ( x ) 0
Additional information on the computation of tangent plane distance can be found in the Appendix A: Equations (A1)–(A11). The solvent-oil blend can be concluded as stable if the tangent plane distance is non-negative. If otherwise, the previous steps are repeated by revising the property attributes and constraints.

3. Results and Discussion

A case study on solvent design for bio-oil applications was conducted to illustrate the application of this proposed methodology. The fast pyrolysis process considered in this work is related to an application in Malaysia. All pricing in this study was converted to U.S. Dollar at the exchange rate of RM 1 = USD 0.24 and adjusted to 2021 values using appropriate indices.

3.1. Identification of Feasible Solvent Candidates

In the initial part of CAMD optimisation, 32 feasible solvent candidates, which are mostly petroleum and natural gas-based solvents that are commonly used as lubricants, lubricant additives, and food additives, were identified according to the pre-defined target properties constraints. The candidates list included mostly higher alkanes and alkenes, with few esters and aromatic compounds. The list was also comprised of several alcohols and nitriles, which are known to be miscible in water. However, there are only a few that can be identified as common chemicals. Most of the molecules are complex and may be challenging to even validate in a lab-scale process, and may not be available at chemical suppliers. Among the favourable candidate was benzyl acetate which is a readily available ester often employed in the food industry as a flavouring agent. 1-Pentanol is also a well-known alcohol employed in the food industry and used as a solvent for lubricants.
Among the candidates for alkenes were 1-octadecene, 1-tetradecene, 1-hexadecene, and 1-dodecene. Most of these alkenes were produced through the oligomerisation of ethylene using triethyl-aluminium catalyst, followed by fractional distillation of the resulting alpha-olefin mixture. In other words, these chemicals were produced from downstream processing of petroleum- or natural gas-based raw materials. Therefore, their availability can be guaranteed, and the price variation could be related to that of the hydrocarbons. Comparatively, more alkanes were chosen as they are commonly used as industrial solvents and additives. Among those were octadecane, N-tridecane, dodecane and undecane. Only one nitrile molecule was included, which is decanenitrile. Among the chemicals used in the additives and food flavouring industry were three ketones: 1-octanone, 2-undecanone and 2-nonanone. Two aldehydes were included too: 1-nonanal and octanal. Hexyl acetate and nonyl acetate were some of the esters included in the list as well. Esters are particularly important for any further research into the reaction system in the blend as they may react with some of the components of pyrolysis bio-oil. Table 3 summarises the 32 solvent candidates identified along with their respective target properties estimated from the GC prediction models. Based on the potential solvent candidates identified in the previous stage, a thorough search was conducted on the cost of solvent as listed in Appendix A: Table A4. The solvents and chemicals were of analytical grade and the costs were obtained from chemical vendors.

3.2. Multi-Objective Optimisation Model

Here, a multi-objective optimisation model was developed via fuzzy max-min aggregation approach to optimise the higher heating value (HHV) and the profitability of the solvent-oil blend, simultaneously. Two case studies were presented to investigate the effect of different constraints on the outcome while optimising both objective functions.

3.2.1. Estimation of Pyrolysis Bio-Oil Production Cost

In this study, a pyrolysis plant was proposed to aid the estimation of pyrolysis bio-oil production cost. The pyrolysis plant was designed to produce 120 tonne of pyrolysis bio-oil from 200 dry tonne of PKS biomass daily via fast pyrolysis. The overall pyrolysis bio-oil yield was assumed to be 60%. It is expected for the pyrolysis plant to operate on a continuous operation daily for 24 h and 300 days, with a plant lifetime of 30 years. The production costs of the pyrolysis plant include the biomass, capital, labour, electrical and other operational costs. Assumption was made that the PKS biomass used in the pyrolysis plant were supplied by a palm oil mill at no cost.
On the other hand, the capital cost of the pyrolysis plant was estimated based on the sizing curve developed in Rogers et al. [48] which relates both the total plant cost and the plant capacity. In this case, the total plant cost of the designed pyrolysis plant was estimated to be USD 16 million. In addition, the capital cost for the biomass pre-processing plant was included, with an estimated cost of USD 2.98 million. As for the labour cost estimation, the following rough scenario was assumed where the designed pyrolysis plant operates on a shift-work basis, with 5 operators and 1 supervisor per shift. Three 8-h shifts pattern was implemented with 4 teams to provide 24/7 coverage. An average annual salary of USD 13 K was allocated for each employee, which cover the employers’ insurance cost, pension contribution, anti-social hours payments, training and administration charges [49].
A total electrical consumption of 240 kWh per dry tonne of biomass was estimated for both the biomass pre-processing plant and the pyrolysis plant [50]. The electric tariff of E1 for general industry with medium voltage as defined by Malaysia’s energy provider (Tenaga Nasional Berhad) was considered in this study. The price of tariff E1 is USD 0.08/kWh [51] was used to calculate the total cost of electricity. Lastly, an allowance of 4% of the total plant cost (USD 771.48 K per year) has been made to cover other miscellaneous cost such as repair, maintenance, insurance and business costs [50]. Thus, the total cost to produce 1 tonne of pyrolysis bio-oil was calculated to be USD 80.37, as shown in Table 4.

3.2.2. Fuzzy Optimisation

In case study 1, the constraint on solvent fraction added to the blend was relaxed to allow higher HHV value of the generated solvent-oil blend. The parameter β was set to be lesser than 0.75 in this case to achieve HHV of at least 35 MJ/kg. In case study 2, the constraint on consumer preference coefficient was relaxed, thus lowering the HHV requirement of solvent-oil blend to allow higher profitability. As mentioned above, the competitor’s product consisted of 50 wt.% solvent. Hence, the solvent fraction was set to be less than 0.5. Table 5 summarises the constraints defined in case study 1 and 2, respectively.
Firstly, single objective optimisation was conducted to generate the upper and lower bounds for both the objective functions, as shown in Table 6. The values obtained was then substituted into Equation (16) to solve the multi-objective fuzzy optimisation problem. The max-min aggregation approach was employed to study the trade-off between high HHV and high profitability.
Among the 32 solvents identified in the previous stage, only 4 solvents, including the octadecane, 1-octadecene, 1-tetradecene and 2-octanone, demonstrated promising performance in terms of functionality and economics. Table 7 shows the results obtained from case study 1 and 2. As the constraints on the HHV of the solvent-oil blend were relaxed in case study 1, higher HHV can be observed, ranging from 37.11 to 44.65 MJ/kg. However, a large amount of solvent was required to be blended with pyrolysis bio-oil, thus leading to the increased cost and low profitability. From Table 7, higher profit was obtained from case 2, which is a 1.6-fold increase as compared to the profit in case 1. Nonetheless, this was compensated with the lower HHV of solvent-oil blend ranging from 31.53 to 32.93 MJ/kg. The lowest profit was that of 2-octanone at USD 122.77 per tonne of solvent-oil blend. 2-octanone is a flavouring ingredient naturally present in apple, apricot, banana, papaya, wheat bread and alcoholic beverages. The ketone solvent was available on an industrial scale and should be delivered at a slightly higher cost than 1-tetradecene or octadecane, thus the lower profitability observed.
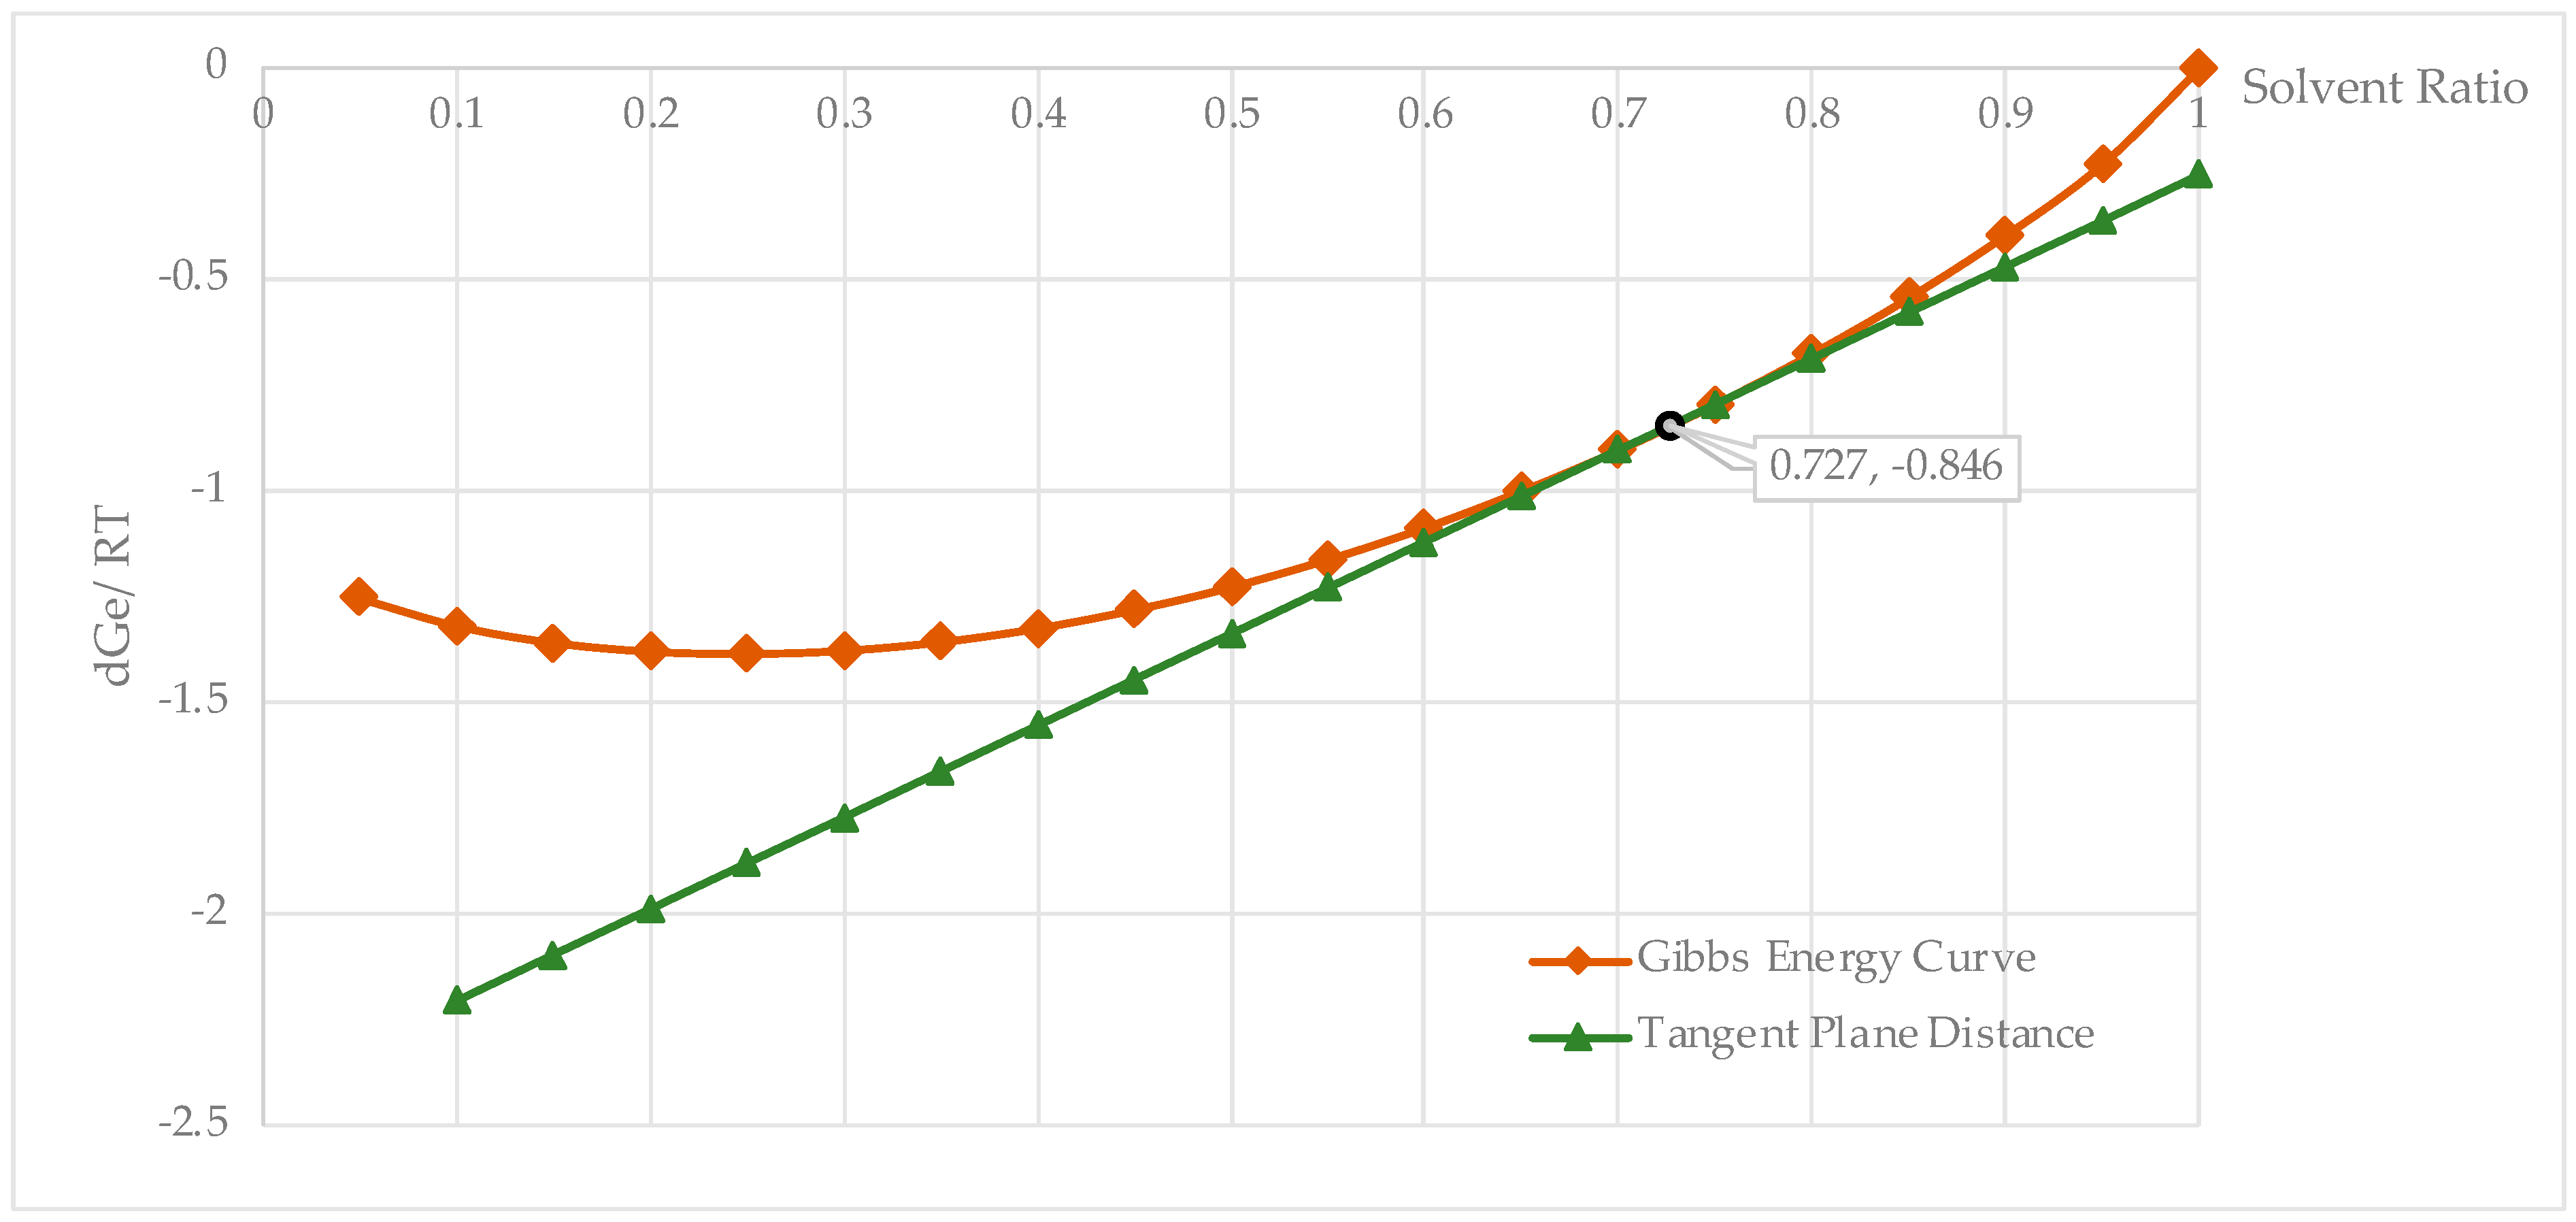
Apart from improving the HHV of solvent-oil blend, the miscibility of the final blend can also be improved with the addition of solvent candidates. Instead of dispersing in aqueous and organic phase, the strong intermolecular forces between the molecules in the crude pyrolysis bio-oil will attract each other [52]. However, the dispersion of bio-oil can be improved with addition of solvent candidates due to its amphiphilic properties, and thus improving the phase separation of bio-oil. In this work, the phase stability analysis was carried out by computing the tangent plane distance against the identified solvent candidates. Except for 2-octanone, the remaining solvent candidates identified in both case 1 and 2 (octadecane, 1-octadecene and 1-tetradecene) were immiscible with pyrolysis bio-oil at their respective solvent ratio. This could be explained by the existence of non-polar hydrocarbon groups in the solvent molecule. Figure 2 illustrates the Gibbs energy and tangent plot for 2-octanone-oil blend. The X-axis of the graph represents the mass fraction of 2-octanone solvent in solvent-oil blend, while the Y-axis indicates the calculated Gibbs Energy. As shown in Figure 2, the blend of 2-octanone and pyrolysis bio-oil is stable and demonstrated homogenous single-phase as the tangent line was completely plotted below the Gibbs energy curve. This may be due to the polar carbonyl (C=O) functional group found in the 2-octanone which helps in promoting the miscibility of the solvent-oil blend. As the final solvent-oil blend was expected to be homogenous while demonstrating promising properties, it can be concluded that solvent-oil blend with 85 wt.% of 2-octanone is the most promising blend with HHV of 37.11 MJ/kg and profit of USD 122.77/tonne of blend.

3.3. Economic Study on the Bio-Oil-Diesel Blend

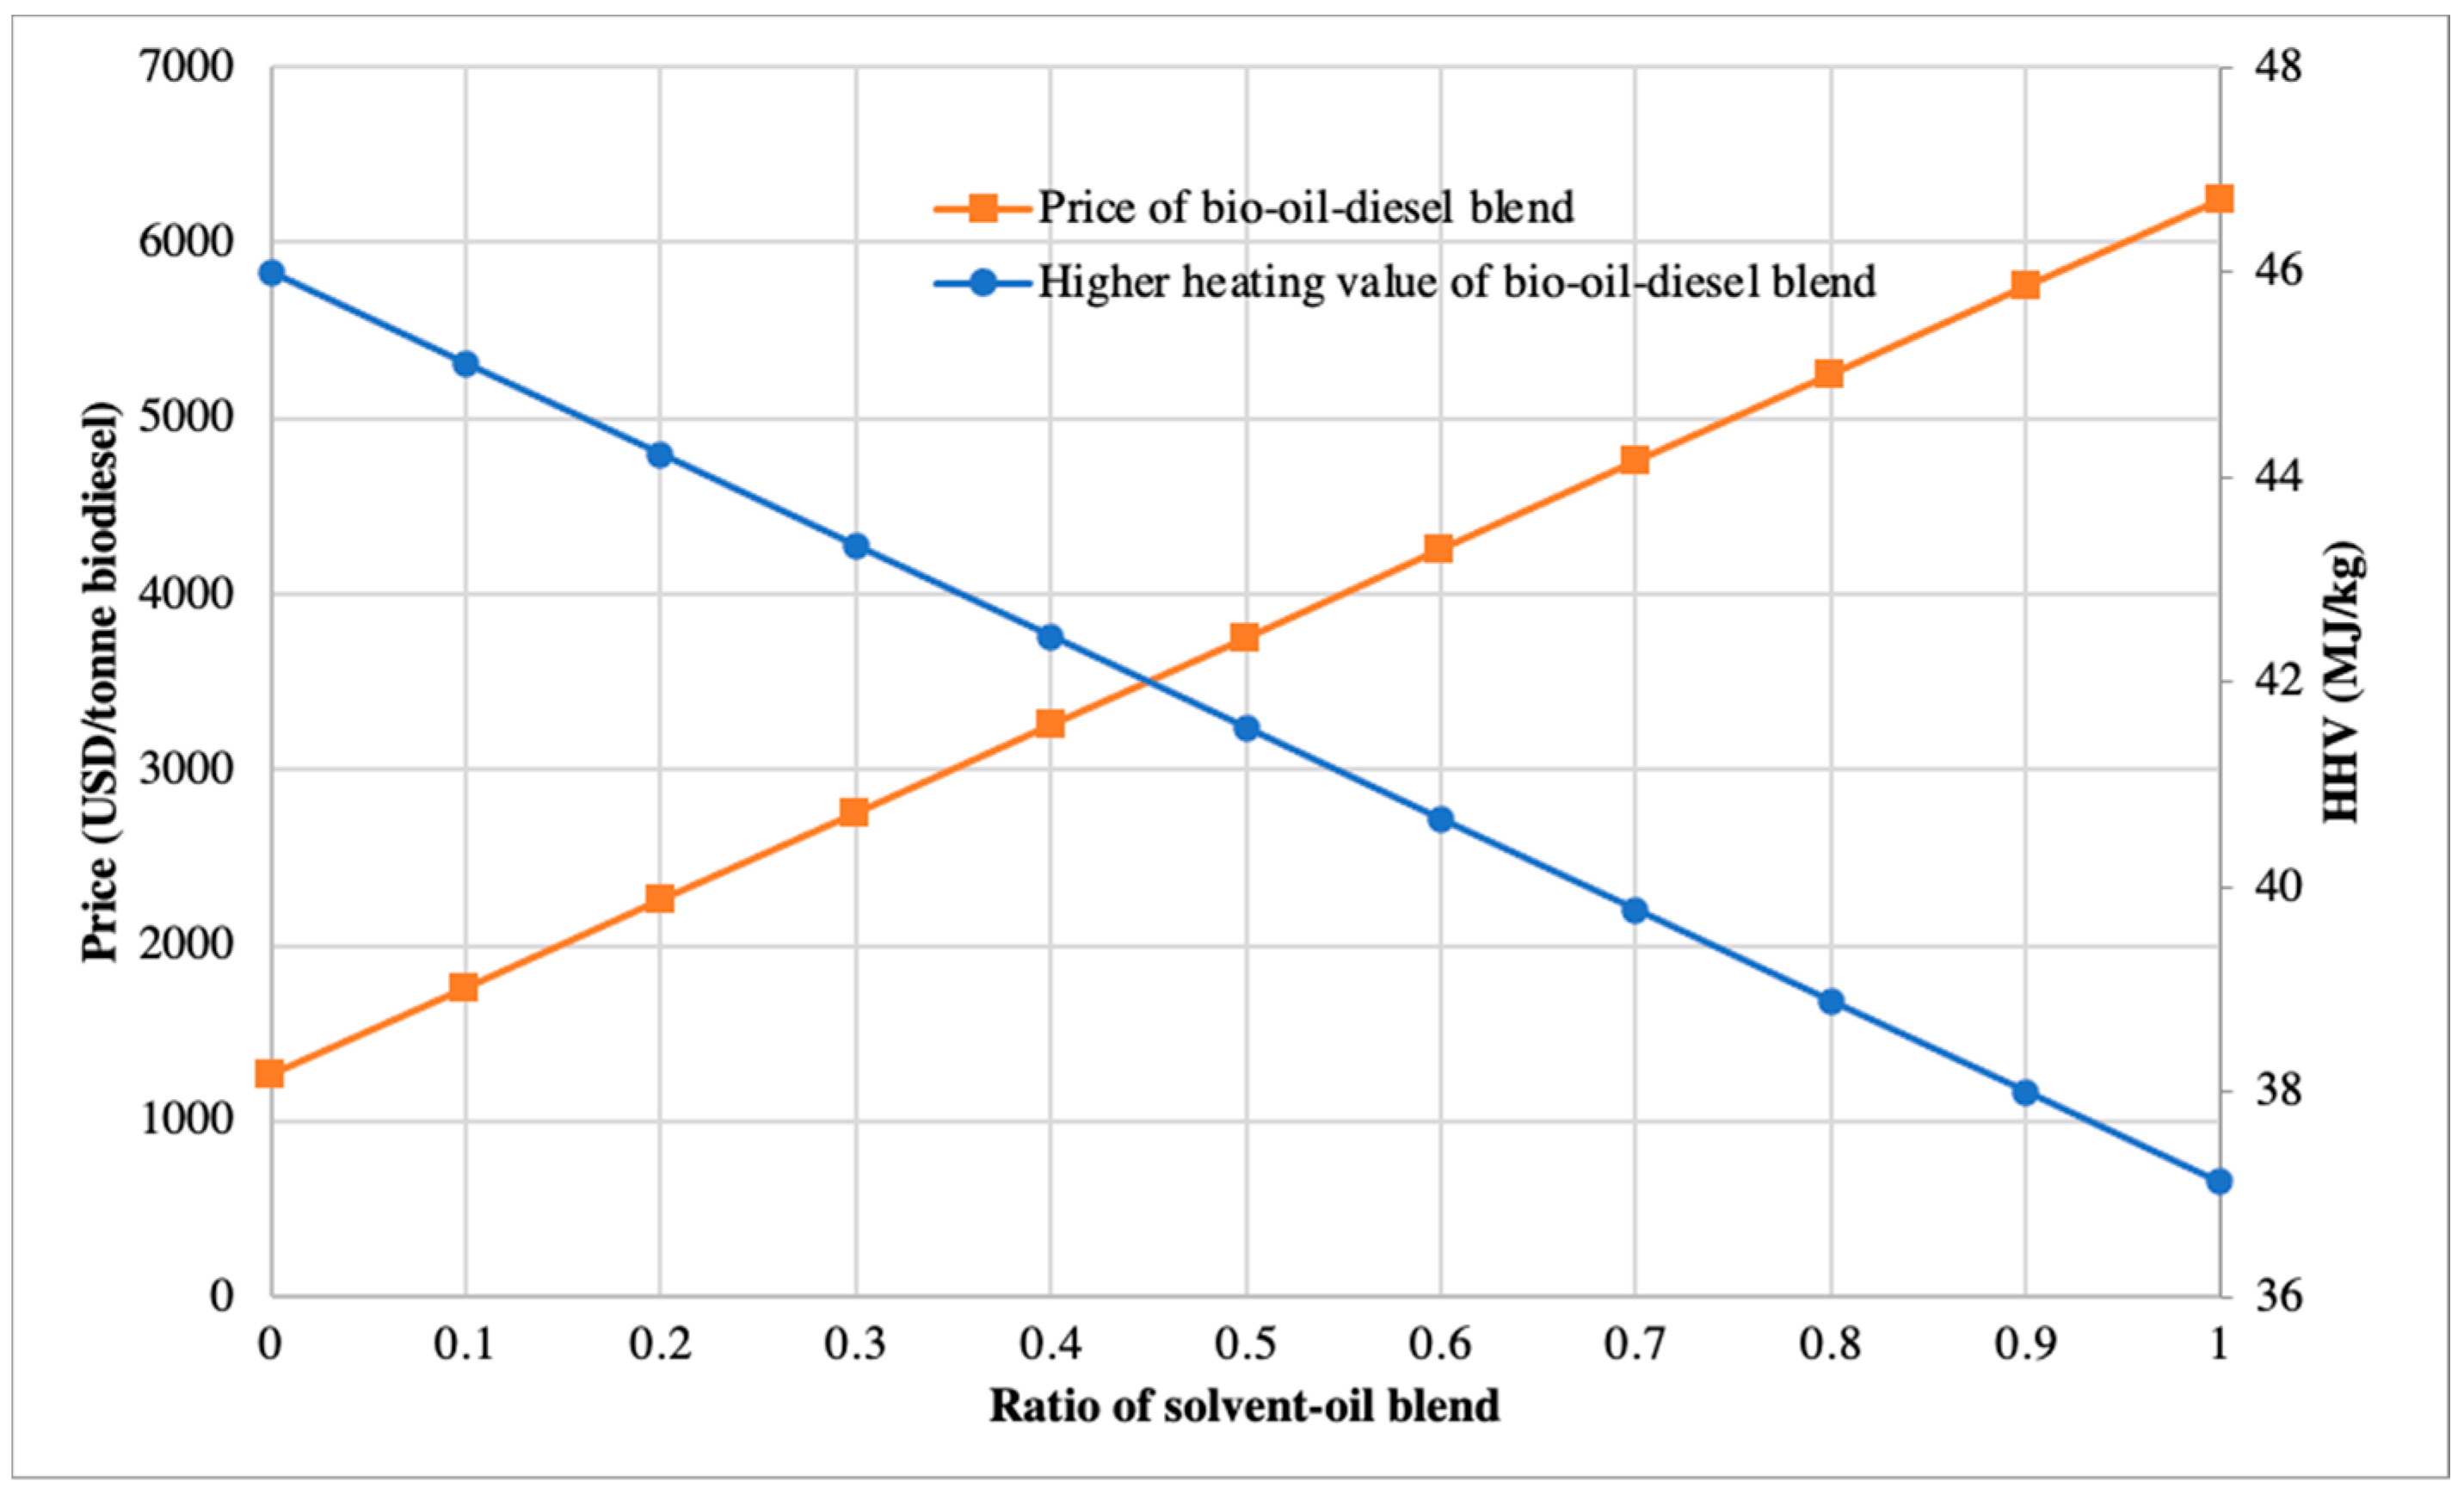
Based on the optimal solvent-oil blend identified in the previous section, an economic analysis was carried out to investigate the relationship between the ratio of bio-oil-diesel blend, the price and HHV of the bio-oil-diesel. The blend of bio-oil and petroleum diesel was commonly referred to as BX, where X refers to the volume percent of bio-oil in the blend. For example, B5, B10 and B100 consist of 5%, 10% and 100% bio-oil, respectively. Generally, bio-oil-diesel blend has a lower energy content and higher fuel consumption as compared to that of the conventional diesel. Although the bio-oil-diesel blend provides sufficient environmental advantages, the price of this blend is costlier than the conventional diesel fuel. As of September 2021, the average price of diesel around the world is USD 1.07 per litre [53]. Meanwhile, the energy content of the conventional diesel fuel generally ranged between 44 to 48 MJ/kg [54]. From the results obtained, the price of 2-octanone-oil blend was observed to cost USD 6249.38 per tonne of solvent-oil blend, with a HHV of 37.11 MJ/kg. Table 8 summarises the price and HHV of the solvent-oil blend and diesel fuel used in this study.
Figure 3 illustrates the effects of solvent-oil blend ratio on the price and HHV of the bio-oil-diesel blend. It was observed that as the ratio of solvent-oil blend increases, the price of bio-oil-diesel blend increases proportionately. However, the HHV of the bio-oil-diesel blend decreases as the amount of solvent-oil blend increases. In this study, biodiesel with HHV of 40 MJ/kg was used as benchmark to determine the desired ratio of solvent-oil-diesel blend. As shown in Figure 3, blending with at least 40 wt.% of diesel fuels, or 60 wt.% of solvent-oil blend was required to generate bio-oil-diesel with HHV of at least 40 MJ/kg. However, blending with 60 wt.% solvent-oil blend will cost approximately USD 4.2 K per tonne bio-oil-diesel, which is equivalent to a 3.4-fold increase as compared to pure diesel fuel. To be competitive with conventional diesel fuel, substantial subsidies and tax incentives from government are crucial. In addition, the demand for bio-oil-diesel could be stimulated with the introduction of legislation mandating the blending of biofuel in conventional diesel fuel, thus making the bio-oil-diesel demand independent of the diesel fuel price [55].

4. Conclusions

A CAMD framework was developed to design solvent molecules that can upgrade the properties of bio-oil upon blending, while achieving a low mixing ratio with pyrolysis bio-oil and maintaining profitability. At the initial stage, the requirements of the solvent and solvent-oil blend were identified and translated into target properties. Suitable property prediction models were used to build the structures of 32 promising solvent molecules. In the second stage, a MOO model was developed to investigate the trade-off between high HHV and high profitability of the solvent-oil blend. The HHV and profitability of the solvent-oil blend were optimised simultaneously via the fuzzy max-min aggregation approach. Meanwhile, a pricing model was introduced to evaluate the profitability of the solvent-oil blend. In addition, a pyrolysis plant was proposed to aid the estimation of pyrolysis bio-oil production cost. Solvent-oil blend with octadecane, 1-octadecene, 1-tetradecene and 2-octanone demonstrated positive performance in terms of functionality and economical. Among the four solvent-oil blends, the blend with 85 wt.% of 2-octanone was selected as the most promising solvent-oil blend with a HHV of 37.11 MJ/kg and profit of USD 122.77/tonne of blend, while displaying other desirable attributes. As a conclusion, the developed framework in this work can be applied in the design of bio-oil solvents with different bio-oil types and compositions. However, financial and legislative supports from government are also critical in the commercialisation of bio-oil-diesel blend. In addition, further upgrading of bio-oil via other approaches than solvent addition needs to be considered to add value on this developed framework. It is recommended that the stability of said blends be experimentally verified and the results to be validated. Further investigation on the life cycle sustainability assessment is recommended to compare the sustainability to conventional diesel fuel.

Author Contributions

Conceptualization, J.W.C., N.G.C. and L.Y.N.; methodology, J.W.C., N.G.C. and S.T.-G.; software, O.A.A.; validation, S.T.-G. and K.M.; formal analysis, J.W.C.; investigation, J.W.C., S.T.-G. and K.M.; resources, N.G.C.; data curation, O.A.A. and S.T.-G.; writing—original draft preparation, J.W.C. and L.Y.N.; writing—review and editing, S.T.-G. and K.M.; visualization, L.Y.N.; supervision, N.G.C., S.T.-G. and K.M.; project administration, N.G.C., S.T.-G. and K.M.; funding acquisition, N.G.C. All authors have read and agreed to the published version of the manuscript.

Funding

This research was funded by the Ministry of Higher Education, Malaysia, Grant number FRGS/1/2019/TK02/UNIM/02/1.

Institutional Review Board Statement

Not applicable.

Informed Consent Statement

Not applicable.

Data Availability Statement

Not applicable.

Conflicts of Interest

The authors declare no conflict of interest.

Appendix A

Table A1. Property prediction models and mixing rules.
PropertyProperty Prediction Model
Normal boiling point, Tb (K) [34] exp ( T b T b 0 ) = Σ i N i T b 1 , i
T b 0 = 222.543   K
Normal melting point, Tm (K) [34] exp ( T m T m 0 ) = Σ i N i T m 1 , i
T m 0 = 147.450   K
Dynamic viscosity, μ (mPa.s) [56] ln ( μ ) = Σ i N i μ ( 1 , i )
Kinematic viscosity, ν (mm2/s) ν = 1000 × ( μ ρ )
Molar volume, V1 (m3/kmol) [57] V 1 d = Σ i N i ν 1 i
d = 0.01211   m 3 / kmol
Density, ρ (kg/m3) ρ = N i M i V 1
Flash Point, FPT (K) [58] F P T 180.594 23.3514 = Σ i N i F P T i
Higher Heating Value, HHV (MJ/kg) [59] H H V = Σ i N i H i Σ i N i M i
Mixing Rules
Kinematic viscosity ln ( ν m i x ) = Σ i x i ln ( ν i )
Density 1 ρ m i x = Σ i ( x i ρ i )
Higher heating value H H V m i x = Σ i x i H H V i
Table A2. Pyrolysis bio-oil properties.
PropertyValues
Moisture content16 wt.%
Kinematic viscosity17.4 mm2/s
Higher Heating Value19.0 MJ/kg
Density1150 kg/m3
ComponentsMole Fraction
Phenol0.62
2,6-dimethoxyphenol0.11
2-methoxyphenol0.11
Furfural0.08
1,2-benzenediol0.08
Acetic acid0.07
Table A3. The functional groups considered for the solvent molecular design.
FamilyFunctional Group
Alkanes C H 3 , C H 2 , C H , C
Alkenes C H 2 = C H ,   C H = C H , C H 2 = C , C H = C
Aromatics a C H , a C C H 3 , a C C H 2 , a C C H , a C C , a C C G = C H 2 , a C C H = C H ,
a C C = C H 2 , a C O H
Alcohols O H
Ketones C H 3 C O , C H 2 C O
Aldehydes C H O
Esters C H 3 C O O , C H 2 C O O , C H C O O , C C O O
Ethers C H 3 O , C H 2 O , C H O
Carboxyl C O O H , a C C O O H
Nitriles C H 3 C N , C H 2 C N , C H C N , C C N , a C C N
Amides C O N H C H 3 , C O N H C H 2 , C O N ( C H 3 ) 2
Table A4. Cost of solvent candidates.
No.Compound NameCost (USD/g Solvent)
S11-Pentanol0.09
S21-Hexanol0.40
S31-Octanone0.07
S4Octanal0.45
S5Hexyl acetate0.26
S6Pentyl propionate0.04
S7Phenylacetaldehyde0.22
S8Benzyl Acetate0.07
S92-Nonanone0.24
S101-Nonanal0.48
S11Hexyl propionate0.12
S12Benzyl acetone0.12
S13Decanenitrile0.70
S14Octyl acetate0.09
S15Hexyl butyrate0.49
S164-tert-Butyltoluene0.13
S172-Undecanone0.13
S18Undecanal0.24
S19Nonyl acetate0.22
S20Undecane0.26
S211-Dodecene0.28
S22Dodecanal0.15
S23Dodecane0.22
S24N-Tridecane0.57
S251-Tetradecene0.04
S26Tetradecane0.33
S27N-Pentadecane0.58
S281-Hexadecene0.19
S29N-Hexadecane0.21
S30N-Heptadecane0.41
S311-Octadecene0.06
S32Octadecane0.04

Phase Stability Analysis

To estimate the activity coefficients in non-ideal liquid mixture, group contribution estimation approach developed by [60] was applied. In this work, the GC prediction model combines the solution-of-functional-groups concept with a model for activity coefficient based on UNIQUAC. In a multi-component mixture, the UNIQUAC equation for the activity coefficient of component i is given by:
ln γ i = ln γ i C + ln γ i R
In Equation (A1), C represent the combinatorial part while the residual part is denoted as R. Here, Equations (A2) and (A3) calculates the value ln γ i C and ln γ i R :
ln γ i C = ln ϕ i x i + 5 q i ln θ i ϕ i + l i ϕ i x i j x j l j
ln γ i R = k v k ( i ) ( ln Γ k ln Γ k ( i ) )
Equations (A4)–(A11) represents the calculation for terms in Equations (A2) and (A3):
l j = 5 ( r i q i ) ( r i 1 )
ϕ i = r i x i j r j x j
θ i = q i x i j q j x j
r i = k v k ( i ) R k
q i = k v k ( i ) Q k
ln Γ k = Q k [ 1 ln m ϑ m ψ m , k m ϑ m ψ m , k n ϑ n ψ n , m ]
ϑ m = Q m X m n Q n X n
ψ m , n = exp ( a m n T ) l j = 5 ( r i q i ) ( r i 1 )
where γi = activity coefficient of component i,
ϕi = segment fraction (volume fraction) of component i,
θi = area fraction of component i,
xi = mole fraction of component i,
ri = pure component molecular van der Waals volume parameter,
qi = pure component molecular surface areas parameter,
vk(i) = number of groups of type k in molecule i,
Rk = group volume parameters,
Qk = group area parameters,
Γk = group residual activity coefficient,
Γk(i) = residual activity coefficient of group k in pure component i,
ϑm = area fraction of group m,
ψm,k = group interaction parameter,
Xm = mole fraction of group m in the mixture,
am,n = group interaction parameters obtained from experimental phase equilibrium data.

References

  1. Czernik, S.; Bridgwater, A.V. Overview of applications of biomass fast pyrolysis oil. Energy Fuels 2004, 18, 590–598. [Google Scholar] [CrossRef]
  2. Diebold, J.P.; Czernik, S. Additives to lower and stabilize the viscosity of pyrolysis oils during storage. Energy Fuels 1997, 11, 1081–1091. [Google Scholar] [CrossRef]
  3. Zhang, X.; Wang, T.; Ma, L.; Zhang, Q.; Jiang, T. Hydrotreatment of bio-oil over ni-based catalyst. Bioresour. Technol. 2013, 127, 306–311. [Google Scholar] [CrossRef] [PubMed]
  4. Pidtasang, B.; Udomsap, P.; Sukkasi, S.; Chollacoop, N.; Pattiya, A. Influence of alcohol addition on properties of bio-oil produced from fast pyrolysis of eucalyptus bark in a free-fall reactor. J. Ind. Eng. Chem. 2013, 19, 1851–1857. [Google Scholar] [CrossRef]
  5. Zhang, L.; Liu, R.; Yin, R.; Mei, Y.; Cai, J. Optimization of a mixed additive and its effect on physicochemical properties of bio-oil. Chem. Eng. Technol. 2014, 37, 1181–1190. [Google Scholar] [CrossRef]
  6. Achenie, L.E.K.; Gani, R.; Venkatasubramanian, V. Computer Aided Molecular Design: Theory and Practice, 1st ed.; Elsevier: Amsterdam, The Netherlands, 2003. [Google Scholar]
  7. Harper, P.M.; Gani, R. A multi-step and multi-level approach for computer aided molecular design. Comput. Chem. Eng. 2000, 24, 677–683. [Google Scholar] [CrossRef]
  8. Joback, K.G.; Reid, R.C. Estimation of pure-component properties from group-contributions. Chem. Eng. Commun. 1987, 57, 233–243. [Google Scholar] [CrossRef]
  9. Papadopoulos, A.I.; Tsivintzelis, I.; Linke, P.; Seferlis, P. Computer-aided molecular design: Fundamentals, methods, and applications. In Reference Module in Chemistry, Molecular Sciences and Chemical Engineering; Elsevier: Amsterdam, The Netherlands, 2018. [Google Scholar] [CrossRef]
  10. Austin, N.D.; Sahinidis, N.V.; Trahan, D.W. Computer-aided molecular design: An introduction and review of tools, applications, and solution techniques. Chem. Eng. Res. Des. 2016, 116, 2–26. [Google Scholar] [CrossRef] [Green Version]
  11. Ng, L.Y.; Chong, F.K.; Chemmangattuvalappil, N.G. Challenges and opportunities in computer-aided molecular design. Comput. Chem. Eng. 2015, 81, 115–129. [Google Scholar] [CrossRef]
  12. Chemmangattuvalappil, N.G. Development of solvent design methodologies using computer-aided molecular design tools. Curr. Opin. Chem. Eng. 2020, 27, 51–59. [Google Scholar] [CrossRef]
  13. Xiu, S.; Shahbazi, A. Bio-Oil production and upgrading research: A Review. Renew. Sustain. Energy Rev. 2012, 16, 4406–4414. [Google Scholar] [CrossRef]
  14. Zhu, L.; Li, K.; Zhang, Y.; Zhu, X. Upgrading the storage properties of Bio-Oil by adding a compound additive. Energy Fuels 2017, 31, 6221–6227. [Google Scholar] [CrossRef]
  15. Chemmangattuvalappil, N.G.; Ng, D.K.S.; Ng, L.Y.; Ooi, J.; Chong, J.W.; Eden, M.R. A review of process systems engineering (PSE) tools for the design of ionic liquids and integrated biorefineries. Processes 2020, 8, 1678. [Google Scholar] [CrossRef]
  16. Lee, J.W.Y.; Ng, L.Y.; Andiappan, V.; Chemmangattuvalappil, N.G.; Ng, D.K.S. Inverse molecular design techniques for green chemical design in integrated biorefineries. Processes 2021, 9, 1569. [Google Scholar] [CrossRef]
  17. Mah, A.X.Y.; Chin, H.H.; Neoh, J.Q.; Aboagwa, O.A.; Thangalazhy-Gopakumar, S.; Chemmangattuvalappil, N.G. Design of Bio-Oil additives via computer-aided molecular design tools and phase stability analysis on final blends. Comput. Chem. Eng. 2019, 123, 257–271. [Google Scholar] [CrossRef]
  18. Chong, J.W.; Thangalazhy-Gopakumar, S.; Muthoosamy, K.; Chemmangattuvalappil, N.G. Design of Bio-Oil additives via molecular signature descriptors using a multi-stage computer-aided molecular design framework. Front. Chem. Sci. Eng. 2021, 1, 1–15. [Google Scholar] [CrossRef]
  19. Clemente, J. Why Biofuels Can’t Replace Oil. Forbes; Forbes: Jersey City, NJ, USA, 2015; p. 1. [Google Scholar]
  20. Cheng, Y.S.; Fung, K.Y.; Ng, K.M.; Wibowo, C. Economic analysis in product design—A case study of a tcm dietary supplement. Chin. J. Chem. Eng. 2016, 24, 202–214. [Google Scholar] [CrossRef]
  21. Zhang, L.; Fung, K.Y.; Wibowo, C.; Gani, R. Advances in chemical product design. Rev. Chem. Eng. 2018, 34, 319–340. [Google Scholar] [CrossRef] [Green Version]
  22. León, M.; Silva, J.; Carrasco, S.; Barrientos, N. Design, cost estimation and sensitivity analysis for a production process of activated carbon from waste nutshells by physical activation. Processes 2020, 8, 945. [Google Scholar] [CrossRef]
  23. Jehan, S.N.; Sultonov, M. Green investment policy initiatives in Japan. In Proceedings of the 15th International Scientific and Practical Conference of the Russian Society for Ecological Economics Strategies and Tools, Stavropol, Russia, 2–5 July 2019; pp. 21–32. [Google Scholar]
  24. Matel, E.; Vahdatikhaki, F.; Hosseinyalamdary, S.; Evers, T.; Voordijk, H. An artificial neural network approach for cost estimation of engineering services. Int. J. Constr. Manag. 2019, 1–14. [Google Scholar] [CrossRef] [Green Version]
  25. Fishburn, P.C. Method of estimating additives utilities. Manag. Sci. 1967, 13, 435–453. [Google Scholar] [CrossRef]
  26. Ng, L.Y.; Chemmangattuvalappil, N.G.; Ng, D.K.S. Robust chemical product design via fuzzy optimisation approach. Comput. Chem. Eng. 2015, 83, 186–202. [Google Scholar] [CrossRef]
  27. Zadeh, L.A. Fuzzy sets. Inf. Control 1965, 8, 338–353. [Google Scholar] [CrossRef] [Green Version]
  28. Zimmermann, H.-J. Fuzzy programming and linear programming with several objective functions. Fuzzy Sets Syst. 1978, 1, 45–55. [Google Scholar] [CrossRef]
  29. Khor, S.Y.; Liam, K.Y.; Loh, W.X.; Tan, C.Y.; Ng, L.Y.; Hassim, M.H.; Ng, D.K.S.; Chemmangattuvalappil, N.G. Computer aided molecular design for alternative sustainable solvent to extract oil from palm pressed fibre. Process. Saf. Environ. Prot. 2017, 106, 211–223. [Google Scholar] [CrossRef]
  30. Ten, J.Y.; Hassim, M.H.; Ng, D.K.S.; Chemmangattuvalappil, N.G. A molecular design methodology by the simultaneous optimisation of performance, safety and health aspects. Chem. Eng. Sci. 2017, 159, 140–153. [Google Scholar] [CrossRef]
  31. Neoh, J.Q.; Chin, H.H.; Mah, A.X.Y.; Aboagwa, O.A.; Thangalazhy-Gopakumar, S.; Chemmangattuvalappil, N.G. Design of Bio-Oil additives using mathematical optimisation tools considering blend functionality and sustainability aspects. Sustain. Prod. Consum. 2019, 19, 53–63. [Google Scholar] [CrossRef]
  32. Qin, X.; Gabriel, F.; Harell, D.; El-Halwagi, M.M. Algebraic techniques for property integration via componentless design. Ind. Eng. Chem. Res. 2004, 43, 3792–3798. [Google Scholar] [CrossRef]
  33. ASTM D7544-12. Standard Specification for Pyrolysis Liquid Biofuel; ASTM International: West Conshohocken, PA, USA, 2017. [Google Scholar] [CrossRef]
  34. Asadullah, M.; Ab Rasid, N.S.; Kadir, A.A.S.A.; Azdarpour, A. Production and detailed characterization of bio-oil from fast pyrolysis of palm kernel shell. Biomass Bioenergy 2013, 59, 316–324. [Google Scholar] [CrossRef]
  35. Marrero, J.; Gani, R. Group-contribution based estimation of pure component properties. Fluid Phase Equilibria 2001, 183-184, 183–208. [Google Scholar] [CrossRef]
  36. Eljack, F.T.; Eden, M.R.; Kazantzi, V.; Qin, X.; El-Halwagi, M.M. Simultaneous process and molecular design—A property based approach. AIChE J. 2007, 53, 1232–1239. [Google Scholar] [CrossRef]
  37. Bagajewicz, M.J. On the role of microeconomics, planning, and finances in product design. AIChE J. 2007, 53, 3155–3170. [Google Scholar] [CrossRef]
  38. Fung, K.Y.; Ng, K.M.; Zhang, L.; Gani, R. A grand model for chemical product design. Comput. Chem. Eng. 2016, 91, 15–27. [Google Scholar] [CrossRef]
  39. Whitnack, C.; Heller, A.; Frow, M.T.; Kerr, S.; Bagajewicz, M.J. Financial risk management in the design of products under uncertainty. Comput. Chem. Eng. 2009, 33, 1056–1066. [Google Scholar] [CrossRef]
  40. Street, C.; Woody, J.; Ardila, J.; Bagajewicz, M. Product design: A case study of slow-release carpet deodorizers/disinfectants. Ind. Eng. Chem. Res. 2008, 47, 1192–1200. [Google Scholar] [CrossRef]
  41. Bagajewicz, M.; Hill, S.; Robben, A.; Lopez, H.; Sanders, M.; Sposato, E.; Baade, C.; Manora, S.; Hey Coradin, J. Product design in price-competitive markets: A case study of a skin moisturizing lotion. AIChE J. 2011, 57, 160–177. [Google Scholar] [CrossRef]
  42. Lai, Y.Y.; Yik, K.C.H.; Hau, H.P.; Chow, C.P.; Chemmangattuvalappil, N.G.; Ng, L.Y. Enterprise decision-making framework for chemical product design in integrated biorefineries. Process. Integr. Optim. Sustain. 2019, 3, 25–42. [Google Scholar] [CrossRef]
  43. Energy Industry Review. Waste-Derived Pyrolysis Oil Market to Close in on USD 500 Mn Valuation by 2029; Energy Industry Review: Ploiesti, Romania, 2020. [Google Scholar]
  44. Dahl, C.A. Measuring global gasoline and diesel price and income elasticities. Energy Policy 2012, 41, 2–13. [Google Scholar] [CrossRef]
  45. Omar, S.; Alsamaq, S.; Yang, Y.; Wang, J. Production of renewable fuels by blending bio-oil with alcohols and upgrading under supercritical conditions. Front. Chem. Sci. Eng. 2019, 13, 702–717. [Google Scholar] [CrossRef] [Green Version]
  46. China Market Price: Monthly Avg: Organic Chemical Material: Propan 2 ol, Isopropyl Alcohol 99%. Available online: https://www.ceicdata.com/en/china/china-petroleum--chemical-industry-association-petrochemical-price-organic-chemical-material/cn-market-price-monthly-avg-organic-chemical-material-propan-2-ol-isopropyl-alcohol-99 (accessed on 27 September 2021).
  47. EUBIA. Pyrolysis. Available online: https://www.eubia.org/cms/wiki-biomass/pyrolysis-and-gasification/pyrolysis/ (accessed on 27 September 2021).
  48. Prausnitz, J.M. Molecular Thermodynamics of Fluid-Phase Equilibria; Prentice-Hall: Michigan, MI, USA, 1969. [Google Scholar]
  49. Rogers, J.G.; Brammer, J.G. Estimation of the production cost of fast pyrolysis Bio-Oil. Biomass Bioenergy 2012, 36, 208–217. [Google Scholar] [CrossRef]
  50. Factory and Manufacturing Average Salaries in Malaysia 2021. Available online: https://www.salaryexplorer.com/salary-survey.php?loc=130&loctype=1&job=33&jobtype=1 (accessed on 27 September 2021).
  51. Pricing & Tariffs—Industrial Tariffs. Available online: https://www.tnb.com.my/commercial-industrial/pricing-tariffs1 (accessed on 27 September 2021).
  52. Manara, P.; Bezergianni, S.; Pfisterer, U. Study on phase behavior and properties of binary blends of Bio-Oil/Fossil-based refinery intermediates: A step toward Bio-Oil refinery integration. Energy Convers. Manag. 2018, 165, 304–315. [Google Scholar] [CrossRef]
  53. Diesel Prices, Liter, 27 September 2021. Available online: https://www.globalpetrolprices.com/diesel_prices/ (accessed on 27 September 2021).
  54. Heat Values of Various Fuels. Available online: https://world-nuclear.org/information-library/facts-and-figures/heat-values-of-various-fuels.aspx (accessed on 27 September 2021).
  55. Chin, M. Biofuels in Malaysia: An Analysis of the Legal and Institutional Framework; CIFOR: Bogor, Indonesia, 2011. [Google Scholar] [CrossRef] [Green Version]
  56. Conte, E.; Martinho, A.; Matos, H.A.; Gani, R. Combined group-contribution and atom connectivity index-based methods for estimation of surface tension and viscosity. Ind. Eng. Chem. Res. 2008, 47, 7940–7954. [Google Scholar] [CrossRef]
  57. Constantinou, L.; Gani, R.; O’Connell, J.P. Estimation of the acentric factor and the liquid molar volume at 298 k using a new group contribution method. Fluid Phase Equilibria 1995, 103, 11–22. [Google Scholar] [CrossRef]
  58. Albahri, T.A. MNLR and ANN structural group contribution methods for predicting the flash point temperature of pure compounds in the transportation fuels range. Process. Saf. Environ. Prot. 2015, 93, 182–191. [Google Scholar] [CrossRef]
  59. Walters, R.N. Molar group contributions to the heat of combustion. Fire Mater. 2002, 26, 131–145. [Google Scholar] [CrossRef]
  60. Fredenslund, A.; Jones, R.L.; Prausnitz, J.M. Group-contribution estimation of activity coefficients in nonideal liquid mixtures. AIChE J. 1975, 21, 1086–1099. [Google Scholar] [CrossRef]
Figure 1. Graphical summary of the work carried out in this research.
Processes 09 02159 g001
Figure 2. Gibbs energy and tangent plot for 2—Octanone in case study 1.
Processes 09 02159 g002
Figure 3. The relationship between the price, HHV and ratio of the biodiesel blend.
Processes 09 02159 g003
Table 1. Target properties identified and their respective constraints.
RequirementTarget PropertyLower BoundUpper BoundASTM D7544 Standard
Solvent
Liquid at room conditionsNormal boiling point60 °C
Normal melting point10 °C
SafetyFlash point45 °C
Bio-oil blend
Consistency of fuel flowDensity800 kg/m31200 kg/m31100–1300 kg/m3
Kinematic viscosity1.0 mm2/s5.0 mm2/sMaximum 5.0 mm2/s
Fuel combustion qualityHigher heating value30 MJ/kgMinimum 15 MJ/kg
Homogeneous formGibbs energy of mixingTo be determined
Table 2. Parameters and values from market analysis.
ParametersValues
Total market size, YUSD 500,000,000 per year
Consumer’s awareness coefficient, α0.85
Elasticity of substitution, δ 0.10
Price of competitor’s product, ACUSD 895.29 per tonne solvent-oil blend
HHV of competitor’s product, λC27.55 MJ/kg
Table 3. Feasible solvent candidates generated from Stage 1 Optimisation.
No.Compound NameChemical FormulaMelting Point (K)Boiling Point (K)Flash Point (K)Density
ρ (kg/m3)
Viscosity
v (mm2/s)
HHV
(MJ/kg)
S11-PentanolC5H12O221.44408.63320.35805.743.8337.97
S21-HexanolC6H14O229.47432.62334.83812.144.7039.31
S31-OctanoneC8H16O234.67449.51325.07817.421.0540.24
S4OctanalC8H16O243.73453.46322.20818.041.4540.90
S5Hexyl acetateC8H16O2208.70449.66329.02872.421.1434.75
S6Pentyl propionateC8H16O2205.48449.57329.02870.320.9634.75
S7PhenylacetaldehydeC8H8O265.52468.63336.741025.681.7435.36
S8Benzyl AcetateC9H10O243.14483.92358.031056.671.7531.21
S92-NonanoneC9H18O242.03469.65339.54820.951.2940.98
S101-NonanalC9H18O250.66473.27336.68821.521.7941.58
S11Hexyl propionateC9H18O2214.41469.71343.49868.911.1935.91
S12Benzyl acetoneC10H12O270.12501.17368.55987.481.9937.14
S13DecanenitrileC10H19N238.23521.90387.44822.902.4543.60
S14Octyl acetateC10H20O2225.69488.25357.97869.501.7636.87
S15Hexyl butyrateC10H20O2222.82488.18357.97867.741.4836.87
S164-tert-ButyltolueneC11H16246.79462.25335.65858.440.2643.19
S172-UndecanoneC11H22O255.73505.18368.49826.341.9642.10
S18UndecanalC11H22O263.62508.26365.63826.822.7242.60
S19Nonyl acetateC11H22O2233.50505.29372.44868.372.1837.69
S20UndecaneC11H24191.06466.22324.06737.021.1848.49
S211-DodeceneC12H24209.17484.87334.48754.081.1948.46
S22DodecanalC12H24O269.70523.89380.11828.883.3542.99
S23DodecaneC12H26200.87484.96338.53745.481.4448.43
S24N-TridecaneC13H28210.08502.25353.01752.801.7648.38
S251-TetradeceneC14H28226.11518.22363.43766.991.7848.36
S26TetradecaneC14H30218.74518.30367.48759.212.1648.34
S27N-PentadecaneC15H32226.92533.26381.96764.852.6548.30
S281-HexadeceneC16H32241.30547.21392.38776.962.6948.28
S29N-HexadecaneC16H34234.67547.28396.44769.873.2648.27
S30N-HeptadecaneC17H36242.03560.47410.91774.354.0148.24
S311-OctadeceneC18H36255.07572.86421.34784.904.0848.23
S32OctadecaneC18H38249.04572.92425.39778.394.9348.21
Table 4. Summarised pyrolysis bio-oil production cost.
Production CostCost (USD/Tonne of Bio-Oil)
Biomass CostN/A
Capital Cost17.86
Labour Cost8.67
Electrical Cost32.35
Other Operating Cost21.43
Total Production Cost80.37
Table 5. Comparison of constraints for case study 1 and 2.
CaseConsumer Preference Coefficient, βSolvent Fraction
Case 1<0.75<0.99
Case 2<0.9<0.5
Table 6. Results from single objective optimisation of HHV and profitability of solvent-oil blend.
CaseObjective FunctionMax HHVblendMax Profitabilityblend
Case 1HHVblend (MJ/kg)47.9336.73
Profitabilityblend (USD/tonne of blend)0.003627.62
Case 2HHVblend (MJ/kg)33.6130.61
Profitabilityblend (USD/tonne of blend)3086.004438.22
Table 7. Results for solvent blend candidates.
Case StudySolventHHVblend (MJ/kg)Profit
(USD/Tonne of Blend)
Solvent RatioMiscibility
Case 1Octadecane44.652564.740.88No
1-Octadecene41.451527.300.77No
1-Tetradecene38.162174.280.99No
2-Octanone37.11122.770.85Yes
Case 2Octadecane32.934132.130.48No
1-Octadecene31.533498.170.43No
Table 8. Price and HHV for both solvent-oil blend and diesel fuel.
PropertiesPrice (USD/Tonne)HHV (MJ/kg)
Solvent-oil blend6249.3837.11
Diesel fuel1258.8246.00
Publisher’s Note: MDPI stays neutral with regard to jurisdictional claims in published maps and institutional affiliations.