Article

Status Quo, Development and Utilization Efficiencies of Wind Power in China

1
School of Economy and Management, Northeast Electric Power University, Changchun Road No. 169, Jilin 132012, China
2
Quality Inspection Center, CNPC Jilin Petrochemical Company, Zunyi East Road No. 7, Jilin 132021, China
*
Author to whom correspondence should be addressed.
Processes 2021, 9(12), 2133; https://doi.org/10.3390/pr9122133
Submission received: 18 October 2021 / Revised: 22 November 2021 / Accepted: 23 November 2021 / Published: 26 November 2021
(This article belongs to the Section Energy Systems)

Abstract

:
As a kind of green and pollution-free renewable energy, wind energy has great development prospects. How to promote the development of the wind power industry and improve the efficiency of wind power development and utilization is an urgent problem that needs to be solved. On the basis of analyzing the current situation of China’s power development, especially wind power development, a data envelopment analysis (DEA) method was used to analyze China’s wind power development and utilization efficiencies from 2005 to 2020. The results show that the development efficiency of China’s wind power was mainly affected by pure technical efficiency, while the utilization efficiency of China’s wind power was mainly affected by scale efficiency. Therefore, when considering wind power development, the management of wind power development should be strengthened, in order to realize the optimal allocation of resources. In terms of wind power utilization, the output scale of wind power utilization should be expanded to increase the contribution of wind power products to the national economy.

1. Introduction

Energy plays an indispensable role in promoting the development of human society. As a kind of pollution-free renewable energy, wind energy has great development prospects. Especially for remote areas such as coastal islands, mountainous areas, grasslands, and pastures, where traffic is inconvenient, wind energy, as a reliable way to solve the problem of production and domestic energy, is of great significance and has been paid increasing attention. Compared with conventional energy, wind energy is abundant and inexhaustible, as well as being a clean energy.
Over the past decade, the research on wind power has been extensive, mainly focused on wind energy efficiency, factors influencing the development of the wind power industry, and the impact of wind power on regional economies, etc.
Regarding wind energy efficiency, Rodriguez, Regueiro, and Doldán (2020) provided an empirical analysis of the evolution of total factor productivity among Spanish wind farms [1]. The results indicated that the growth in productivity (around 2% annually) was mainly due to changes in the technical efficiency growth rate, specifically in the component of pure technical efficiency. Papież, Śmiech, and Frodyma (2019) assessed the efficiency of EU countries, in terms of their wind power investment in 2015 [2]. The results indicated that economic instruments used within renewable energy policy had a positive effect on wind power efficiency, while policy support and regulatory instruments impacted negatively. Zhong et al. (2018) proposed a system dynamics model for wind power performance evaluation [3]. The simulation results indicated that the demand side response affected the economic development, through a generation cost mechanism, and that technical progress on the power generation side and the transmission side can effectively improve the efficiency of the wind power utilization and reduce CO2 emissions; while reasonable government regulation was beneficial to the improvement of both the economic and environmental benefits of the wind power. Gao (2016) used a direction distance function to calculate the energy efficiency of China’s provinces and municipalities from 2005 to 2012 [4].
Some scholars have investigated the factors influencing the wind energy industry: Shen and Lyu (2019) analyzed the relationship between different influencing factors of wind power growth and found that the delegation of approval authority led to the growth of the installed regional wind power capacity [5]. Yao and Zhu (2019) analyzed the main factors affecting the development and utilization of wind energy in Jilin Province, China [6]. The results showed that the wind power market was the main factor affecting the development level of wind energy in Jilin Province, and the main factor hindering the utilization level of wind energy was infrastructure. Lv et al. (2018) summarized the main bottlenecks of the current wind power industry, from the following nine perspectives: the problem of power limit, production cost, independent innovation ability, manufacturing and supporting capacity, construction of standard system, policies and measures, grid connection, and social identity [7].
Other scholars have investigated the impact of wind power on the regional economy. Jenniches, Worrell, and Fumagalli (2019) studied the regional impacts of wind power developments in a small German region and proved that wind power was the most beneficial electricity in comparison to PV and lignite [8]. Xia and Song (2017) conducted an ex post econometric assessment of the effect of wind power installation on the local economy in China. They found that the installed wind power capacity had a small positive effect on GDP but affected local fiscal income negatively [9].
A data envelopment analysis method was used in this paper. Since being proposed by Charnes, Cooper, and Rhodes (1978), the DEA method has been widely used to evaluate production and operational efficiency in different industries and departments [10]. Zhao et al. (2020) carried out an evaluation of hospital efficiency in China at the macro and micro levels [11]. Chen and Xu (2019) assessed China’s energy efficiency from 2000 to 2015 under environmental constraints [12]. Liu et al. (2019) evaluated the environmental efficiency of 27 coal-fired power plants in China [13]. Liu and Wu (2017) performed an evaluation of the energy and environmental efficiency of 30 regional transportation sectors in China based on a slack DEA approach [14]. Lozano (2017) proposed two DEA models to assess the technical and environmental efficiency of a two-stage production and abatement system [15]. Yao and Zhu (2019) analyzed the wind power development and utilization efficiency of Jilin Province in China, based on a DEA method [16].
In summary, the research findings related to wind energy are relatively rich, but the research on the influencing factors on the wind power industry is mainly based on qualitative analysis; the empirical research is only combined with local data, and no quantitative analysis has been made for the overall situation of China. Efficiency studies have mainly focused on wind energy efficiency abroad, energy efficiency, environmental efficiency, and hospital efficiency in China. Relatively few empirical studies have been conducted on the development and utilization efficiency of wind power in China. Therefore, on the basis of analyzing the current situation of China’s power development, especially wind power development, data envelopment analysis (DEA) has been used to carry out empirical research on the efficiency of China’s wind power development and utilization, to further enrich the research in this field.
The remainder of this paper is structured as follows: Section 2 presents the overall status of China’s power production, not only analyzing the trend of China’s total electric power production and consumption, but also discussing its power production structure in recent years. Section 3 details the status quo of China’s wind power industry from the following three perspectives: China’s wind energy resource potential, new and accumulated wind power installed capacity, and the status quo and trends in wind power. Section 4 introduces the DEA method, to analyze the development and utilization efficiencies of China’s wind power from 2005 to 2020. Conclusions and recommendations are presented in Section 5.

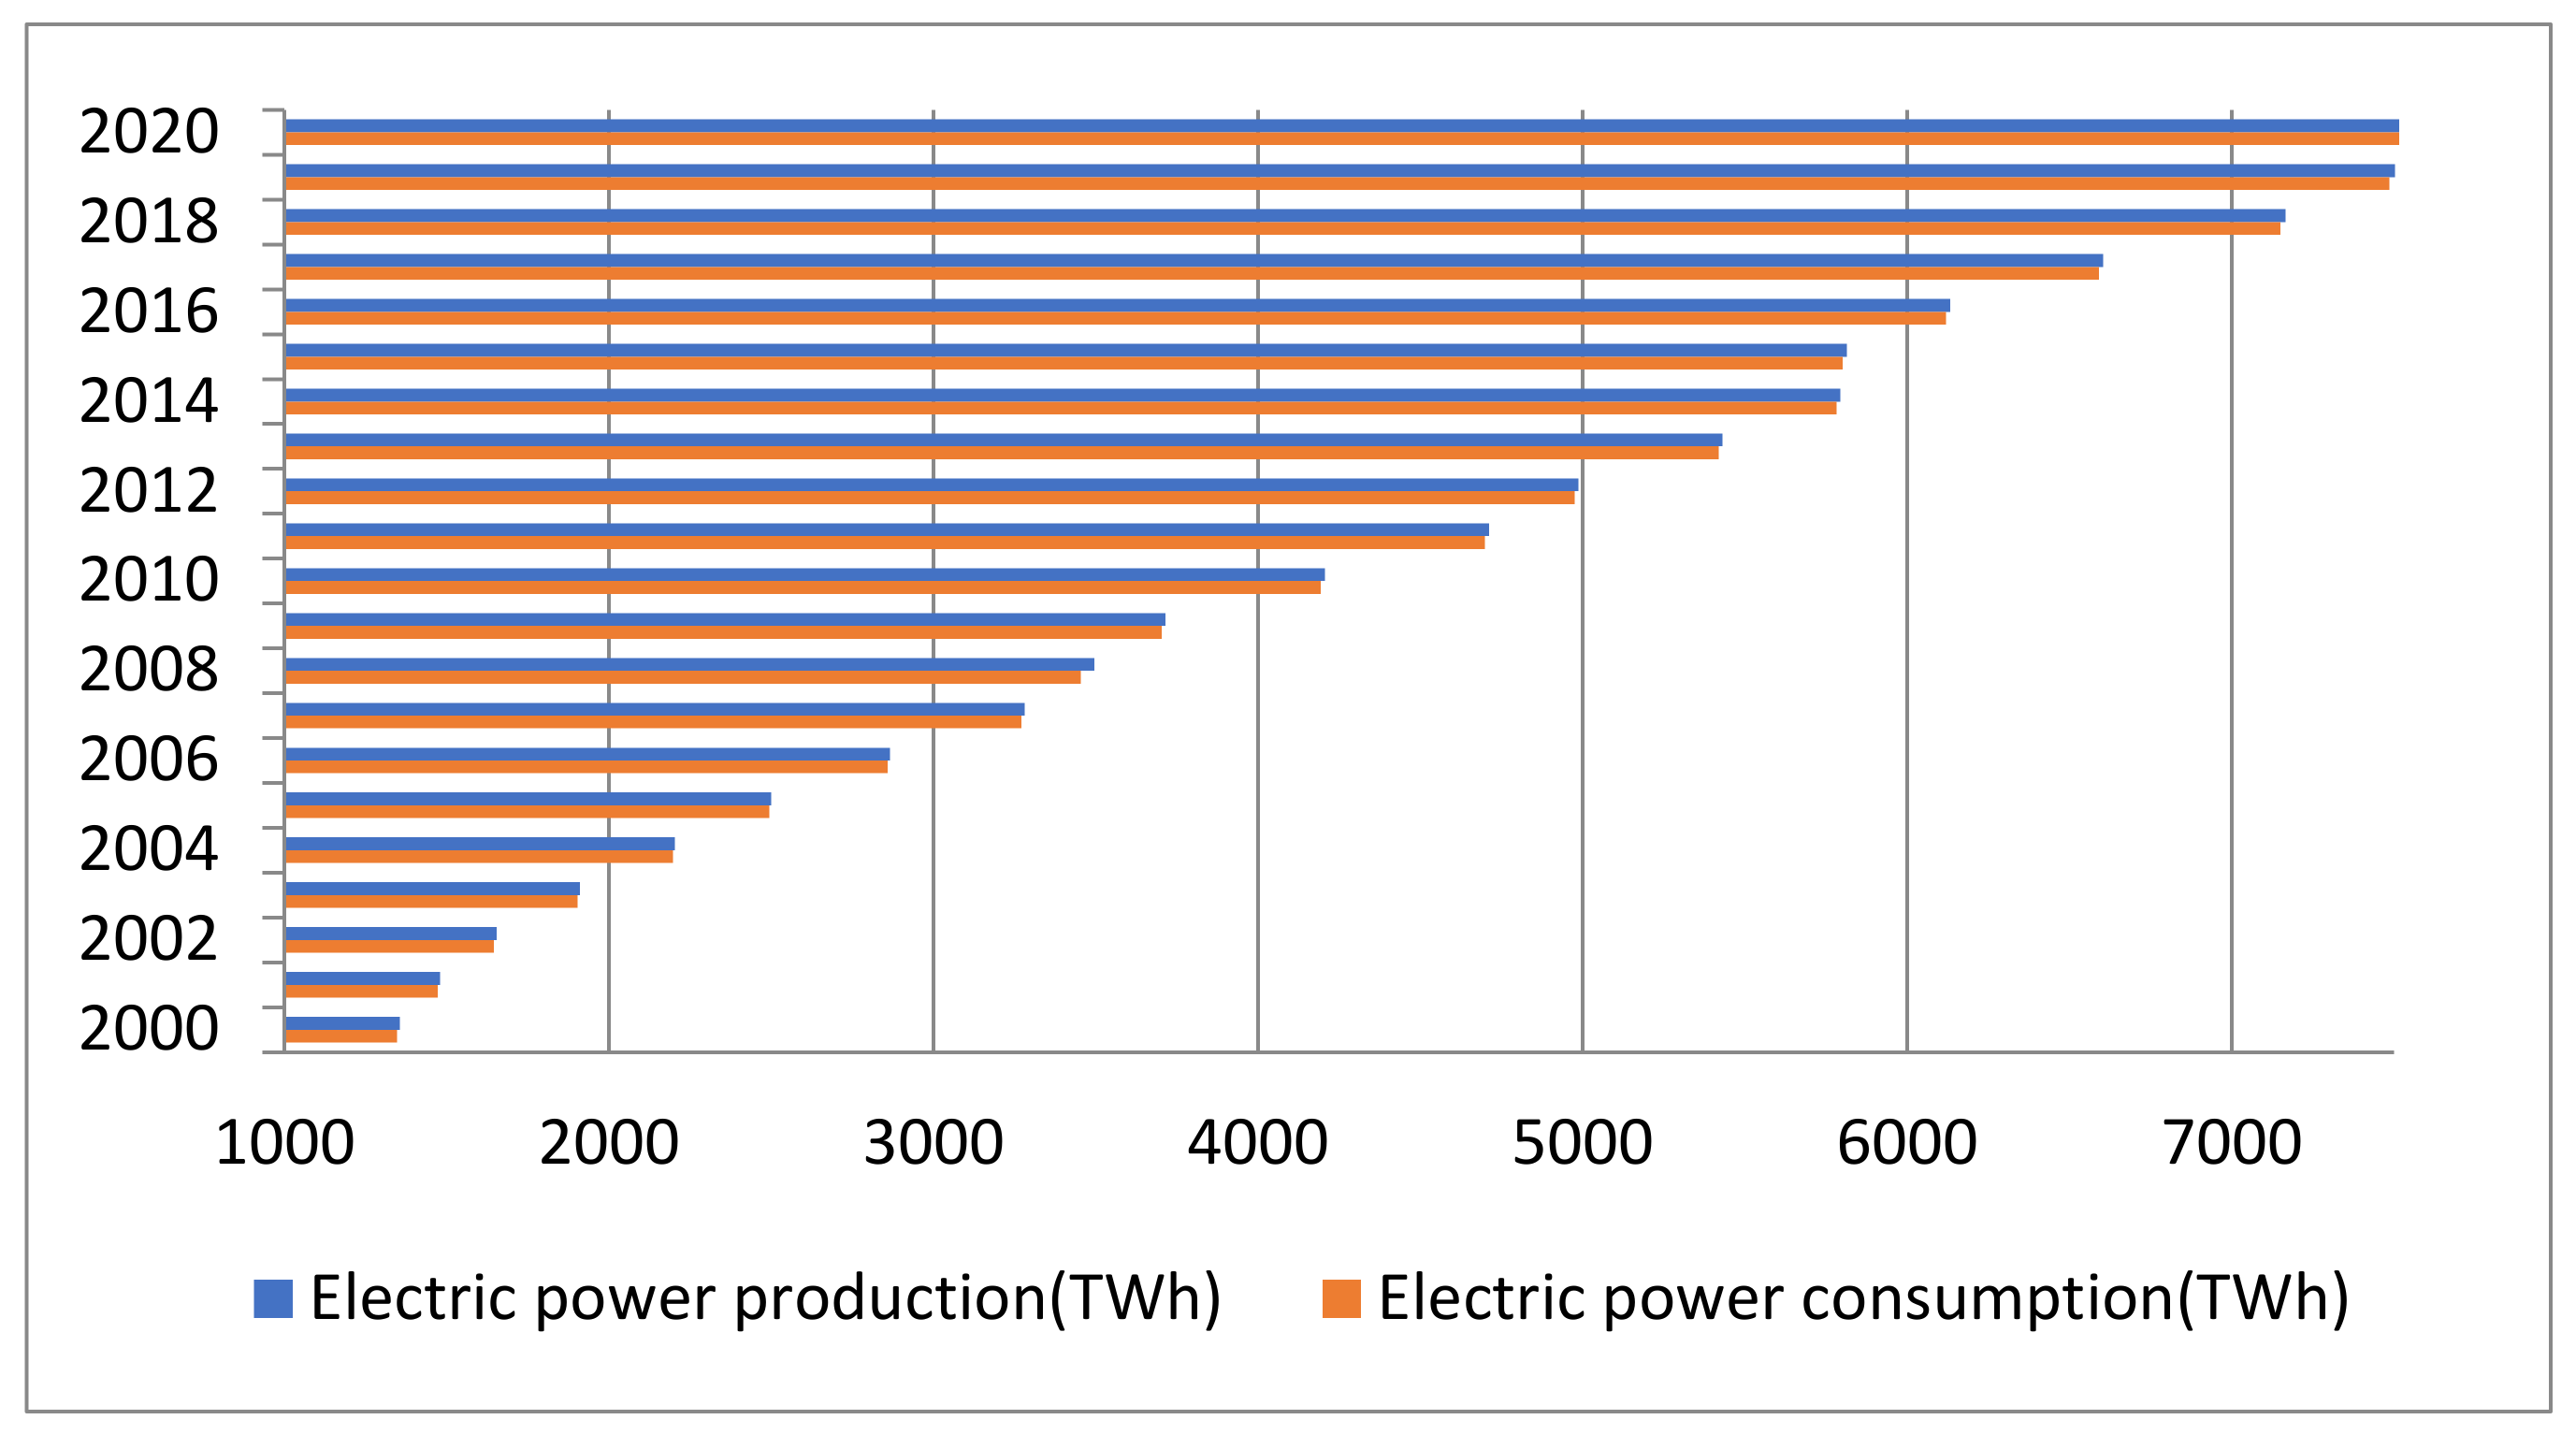
2. Overview of China’s Power Production

Electric power is an important material basis for production and life in modern society. With the development of industrialization in various countries, the electricity demand is increasing year by year. Whether a large amount of cheap, high-quality, and reliable electricity can be provided directly affects the process of national economic development. According to the report ‘BP statistical review of world energy 2021’, China is the largest power producer in the world, generating 7779.1 TWh in 2020; an increase of 3.4% over 2019 and accounting for 29% of the world total [17]. As can be seen from Figure 1, the total electric power production and consumption in China has been increasing continuously since 2000, and the total electric power production is always higher than consumption, indicating that China’s electricity production can meet the needs of production and living.
Being an important direction in power development, renewable energy generation refers to hydropower generation, wind farm generation, biomass power generation, photovoltaic power generation, geothermal power generation, solar thermal power generation, and marine energy power generation. According to BP’s 2021 report, the global renewable energy power generation was 3147.0 TWh in 2020, accounting for 11.73% of the global total of 26,823.2 TWh [17].
The development of wind energy, solar energy, and other renewable energies in China is at a leading level globally. In 2020, China’s renewable energy generation capacity was 863.1 TWh, accounting for 11.1% of the country’s total power generation and 27.43% of the world’s total renewable energy generation; mainly due to hydropower, wind power, and photovoltaic power generation. The power production structure of China since 2011 is shown in Table 1.
As can be seen from Table 1, China’s electric power production is still dominated by thermal power generation, but the proportion of it of the total has been declining; dropping to 67.88% in 2020. Hydropower was second, accounting for 17.77% of the total. In third place was wind power, which surpassed nuclear power in 2013 and accounted for 6.12% of the total in 2020. Nuclear power ranked fourth, accounting for 4.80% in 2020.

3. Status Quo of Wind Power in China

3.1. Potential of Wind Energy Resources in China

The cost of wind power is close to that of natural gas, and it is one of the more economical renewable energy sources [18]. China has a vast territory and a long coastline, with a land area of 9.6 million square kilometers and a coastline (including islands) of 32,000 km. It is rich in wind energy resources and has great potential for wind energy development. The regions rich in wind energy resources in China are mainly concentrated in the southeast coast, nearby islands, and the northern regions (northeast, north, and northwest), while there are also individual wind-energy-rich points inland. The southeast coast and its islands include an area nearly 10 km wide along the coast of Shandong, Jiangsu, Shanghai, Zhejiang, Fujian, Guangdong, Guangxi, and Hainan provinces (cities). The annual wind power density is above 200 watts/square meter, and the wind power density line is parallel to the coastal line. The northern region is rich in wind energy, including the three northeast provinces, and Hebei, Inner Mongolia, Gansu, Ningxia, and Xinjiang provinces (autonomous regions), with a width of nearly 200 km. The wind power density is more than 200–300 watts/square meter, and some can reach more than 500 watts/square meter. The power density of the inland wind is generally below 100 watts/square meter, but some areas are also rich in wind energy, due to the influence of lakes and special topography [19].
China’s wind energy resources have a strong seasonality, generally rich in spring, autumn, and winter, but poor in summer, which is complementary to hydropower resources. China is rich in hydropower resources in summer; therefore, the large-scale development of wind power generation can make up for the shortage of power and electricity in the dry season of hydropower in winter and spring to a certain extent.

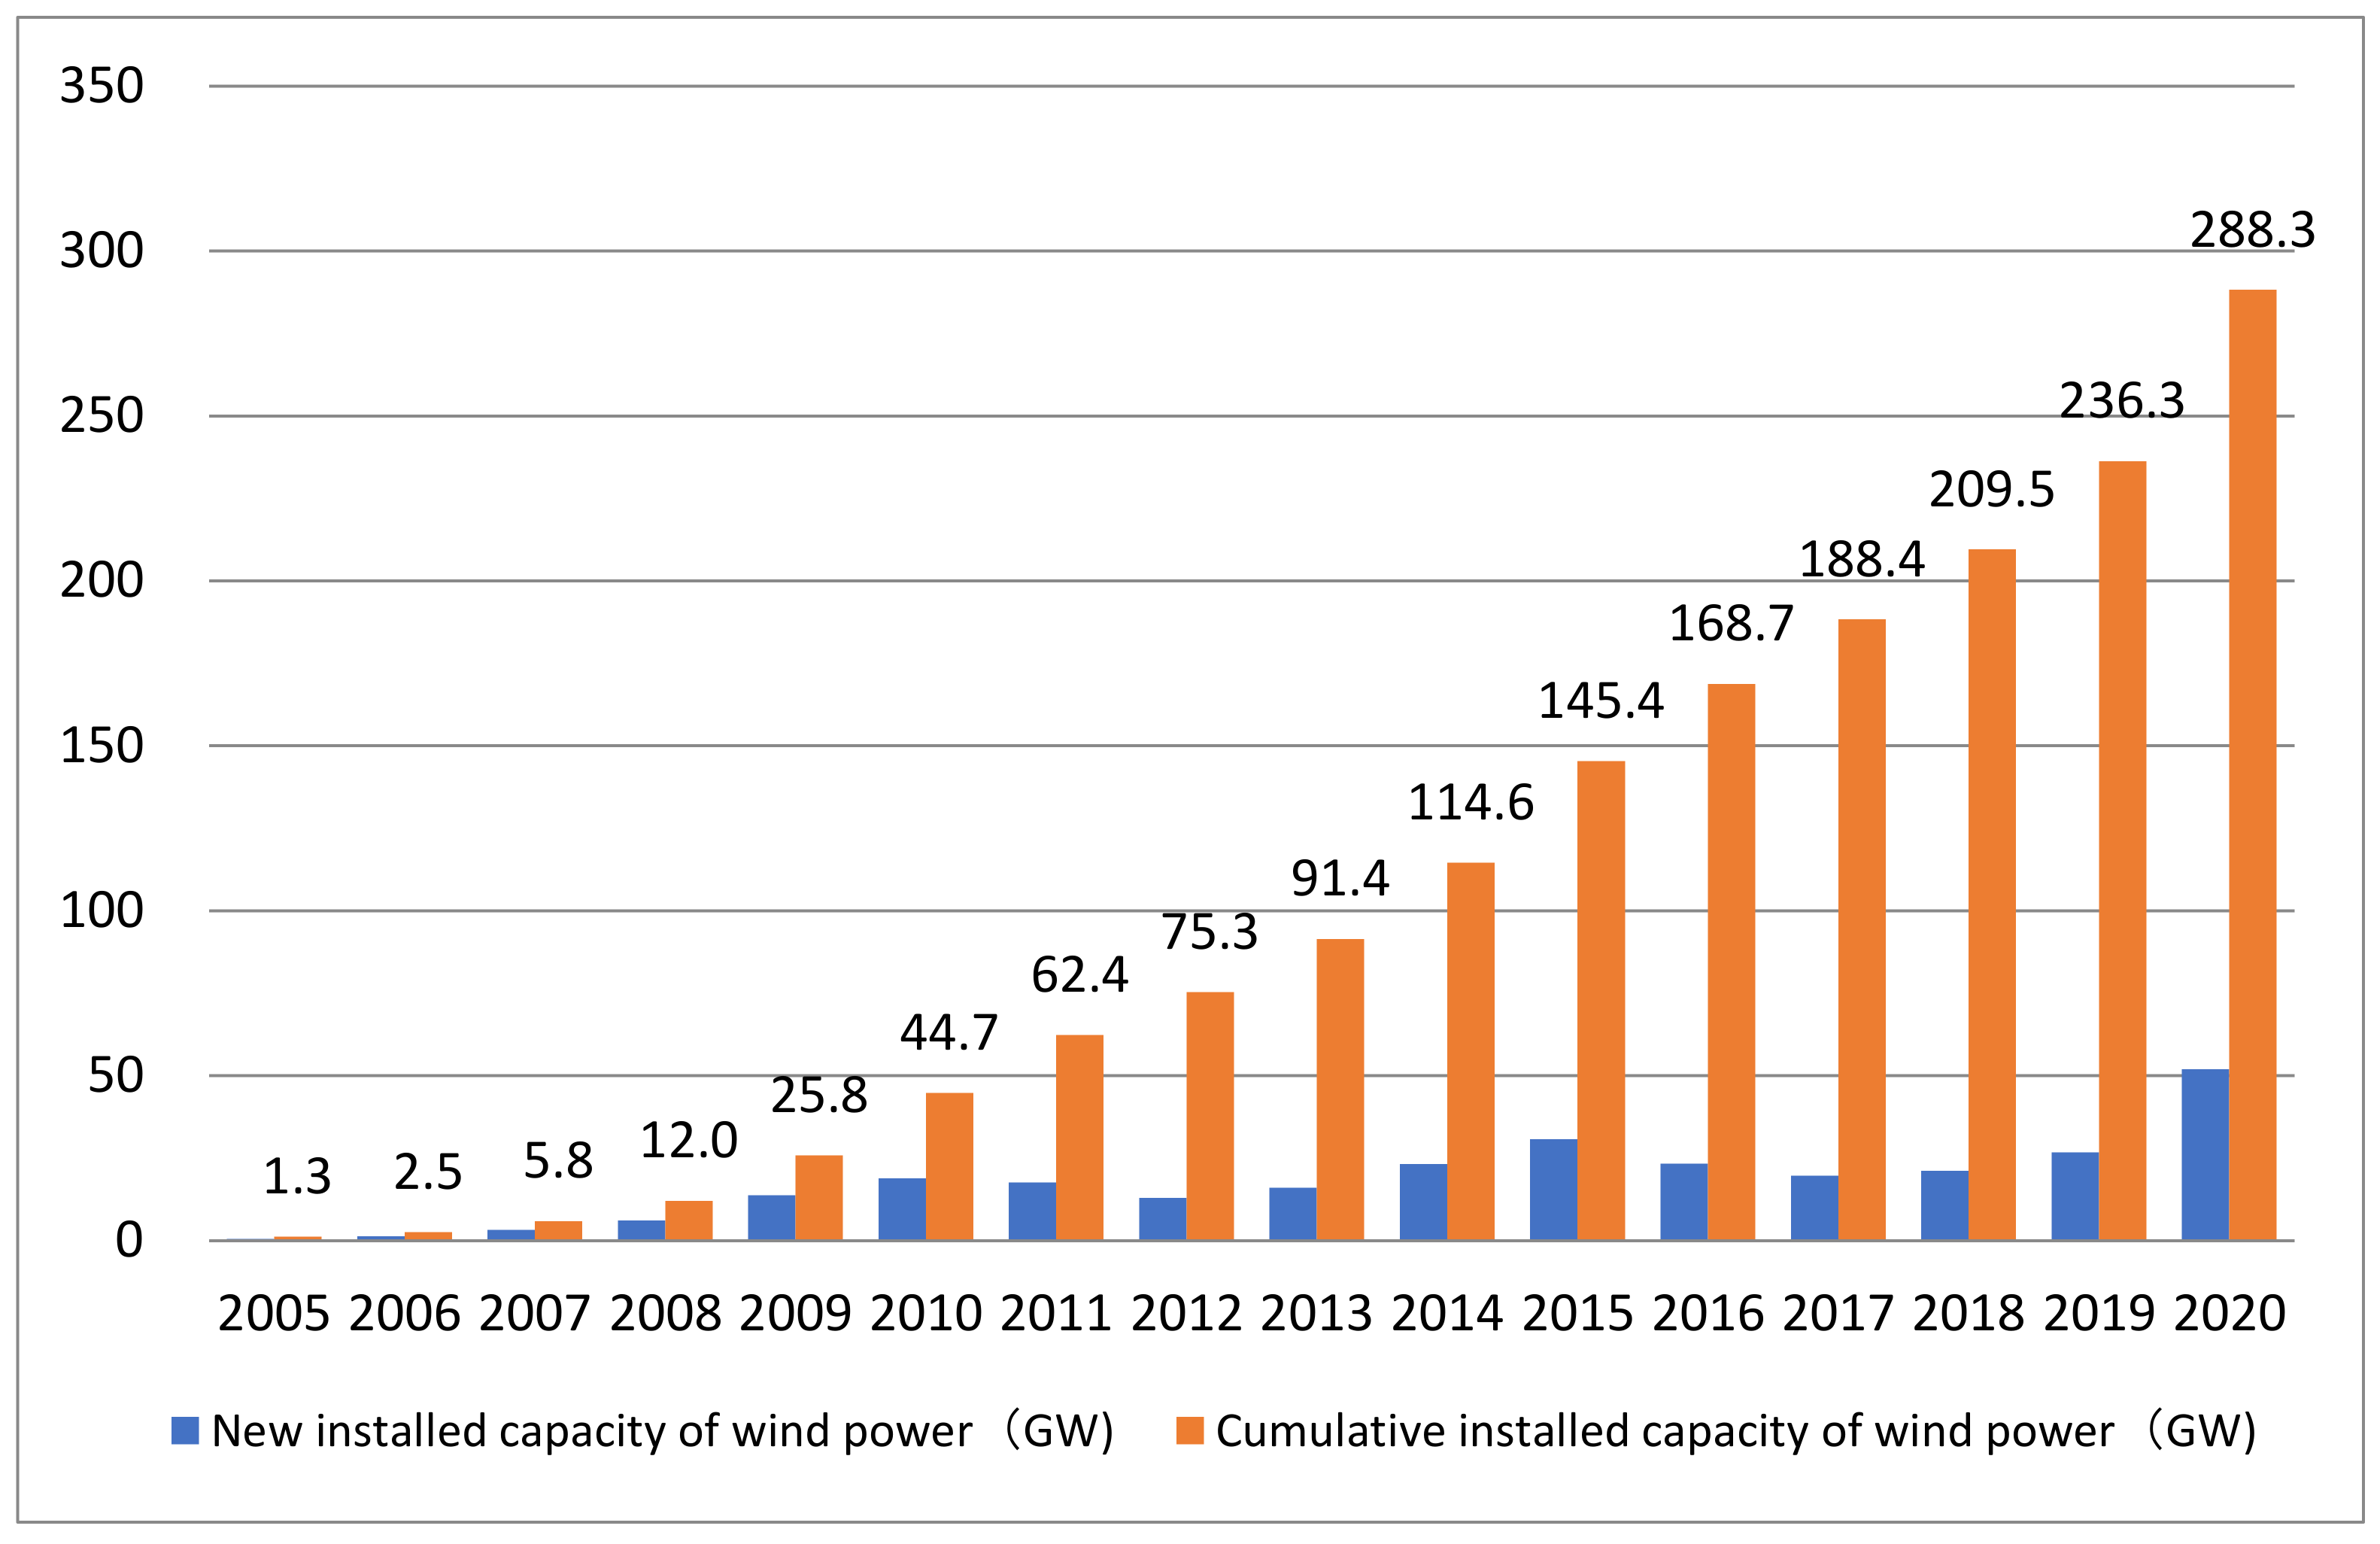
3.2. Changes in Newly Added and Accumulated Installed Wind Power Capacity

With the deepening understanding of environmental issues around the world, as well as the continuous improvement of comprehensive renewable energy utilization technology, the global wind power industry has developed rapidly in recent years. In 2020, the world’s newly installed capacity was 93 GW. While, the cumulative installed capacity of wind power reached 743 GW at the end of 2020. China, the United States of America, India, Spain, and Sweden are the top five countries in the world in terms of installed wind power capacity [17]. For nine consecutive years, China has been the country with the largest installed capacity in the world. The cumulative installed capacity of wind power accounts for more than one third of the global total. The annual newly installed capacity of wind power accounts for about 56% of the global total. The annual new and cumulative installed wind power capacity since 2005 is shown in Figure 2.
As can be seen from Figure 2, since 2005, the annual growth of China’s newly installed wind power capacity has shown a certain fluctuation. After reaching 18.93 GW in 2010, it fell slightly and reached 30.75 GW in 2015, then declined again, until peaking at 52.0 GW in 2020. The two periods of increase in wind power installation were the result of policy boosting, and the slowdown of wind power installation growth in recent years was also affected by certain policies. From 2003 to 2009, bidding for wind power concessions was implemented, which promoted the large-scale commercial application of wind power and reduced costs. In 2005, a full purchase system was established, which was revised to a full guarantee purchase system in 2009, and a benchmark on-grid price of wind power were implemented from then on. In 2011, a technical standard of wind power access to the power system and the management method of wind power grid compulsory testing were issued. In 2015, the benchmark feed-in tariff of wind power was lowered three times. In 2016, an annual development and construction plan for wind power was implemented, stopping the development and construction of wind power construction projects in areas with serious power restriction, establishing a wind power monitoring and early warning mechanism, and releasing the monitoring and early warning results of wind power investment. Therefore, China’s annual change in new wind power installed capacity shows a strong policy dependence.
From the perspective of accumulative installed wind power capacity, the overall construction scale of wind power in China has been expanding continuously, showing a relatively obvious increasing trend. In 2020, it reached 288.3 GW, ranking first in the world. Wind power has become an important source in China’s power structure, which cannot be ignored.

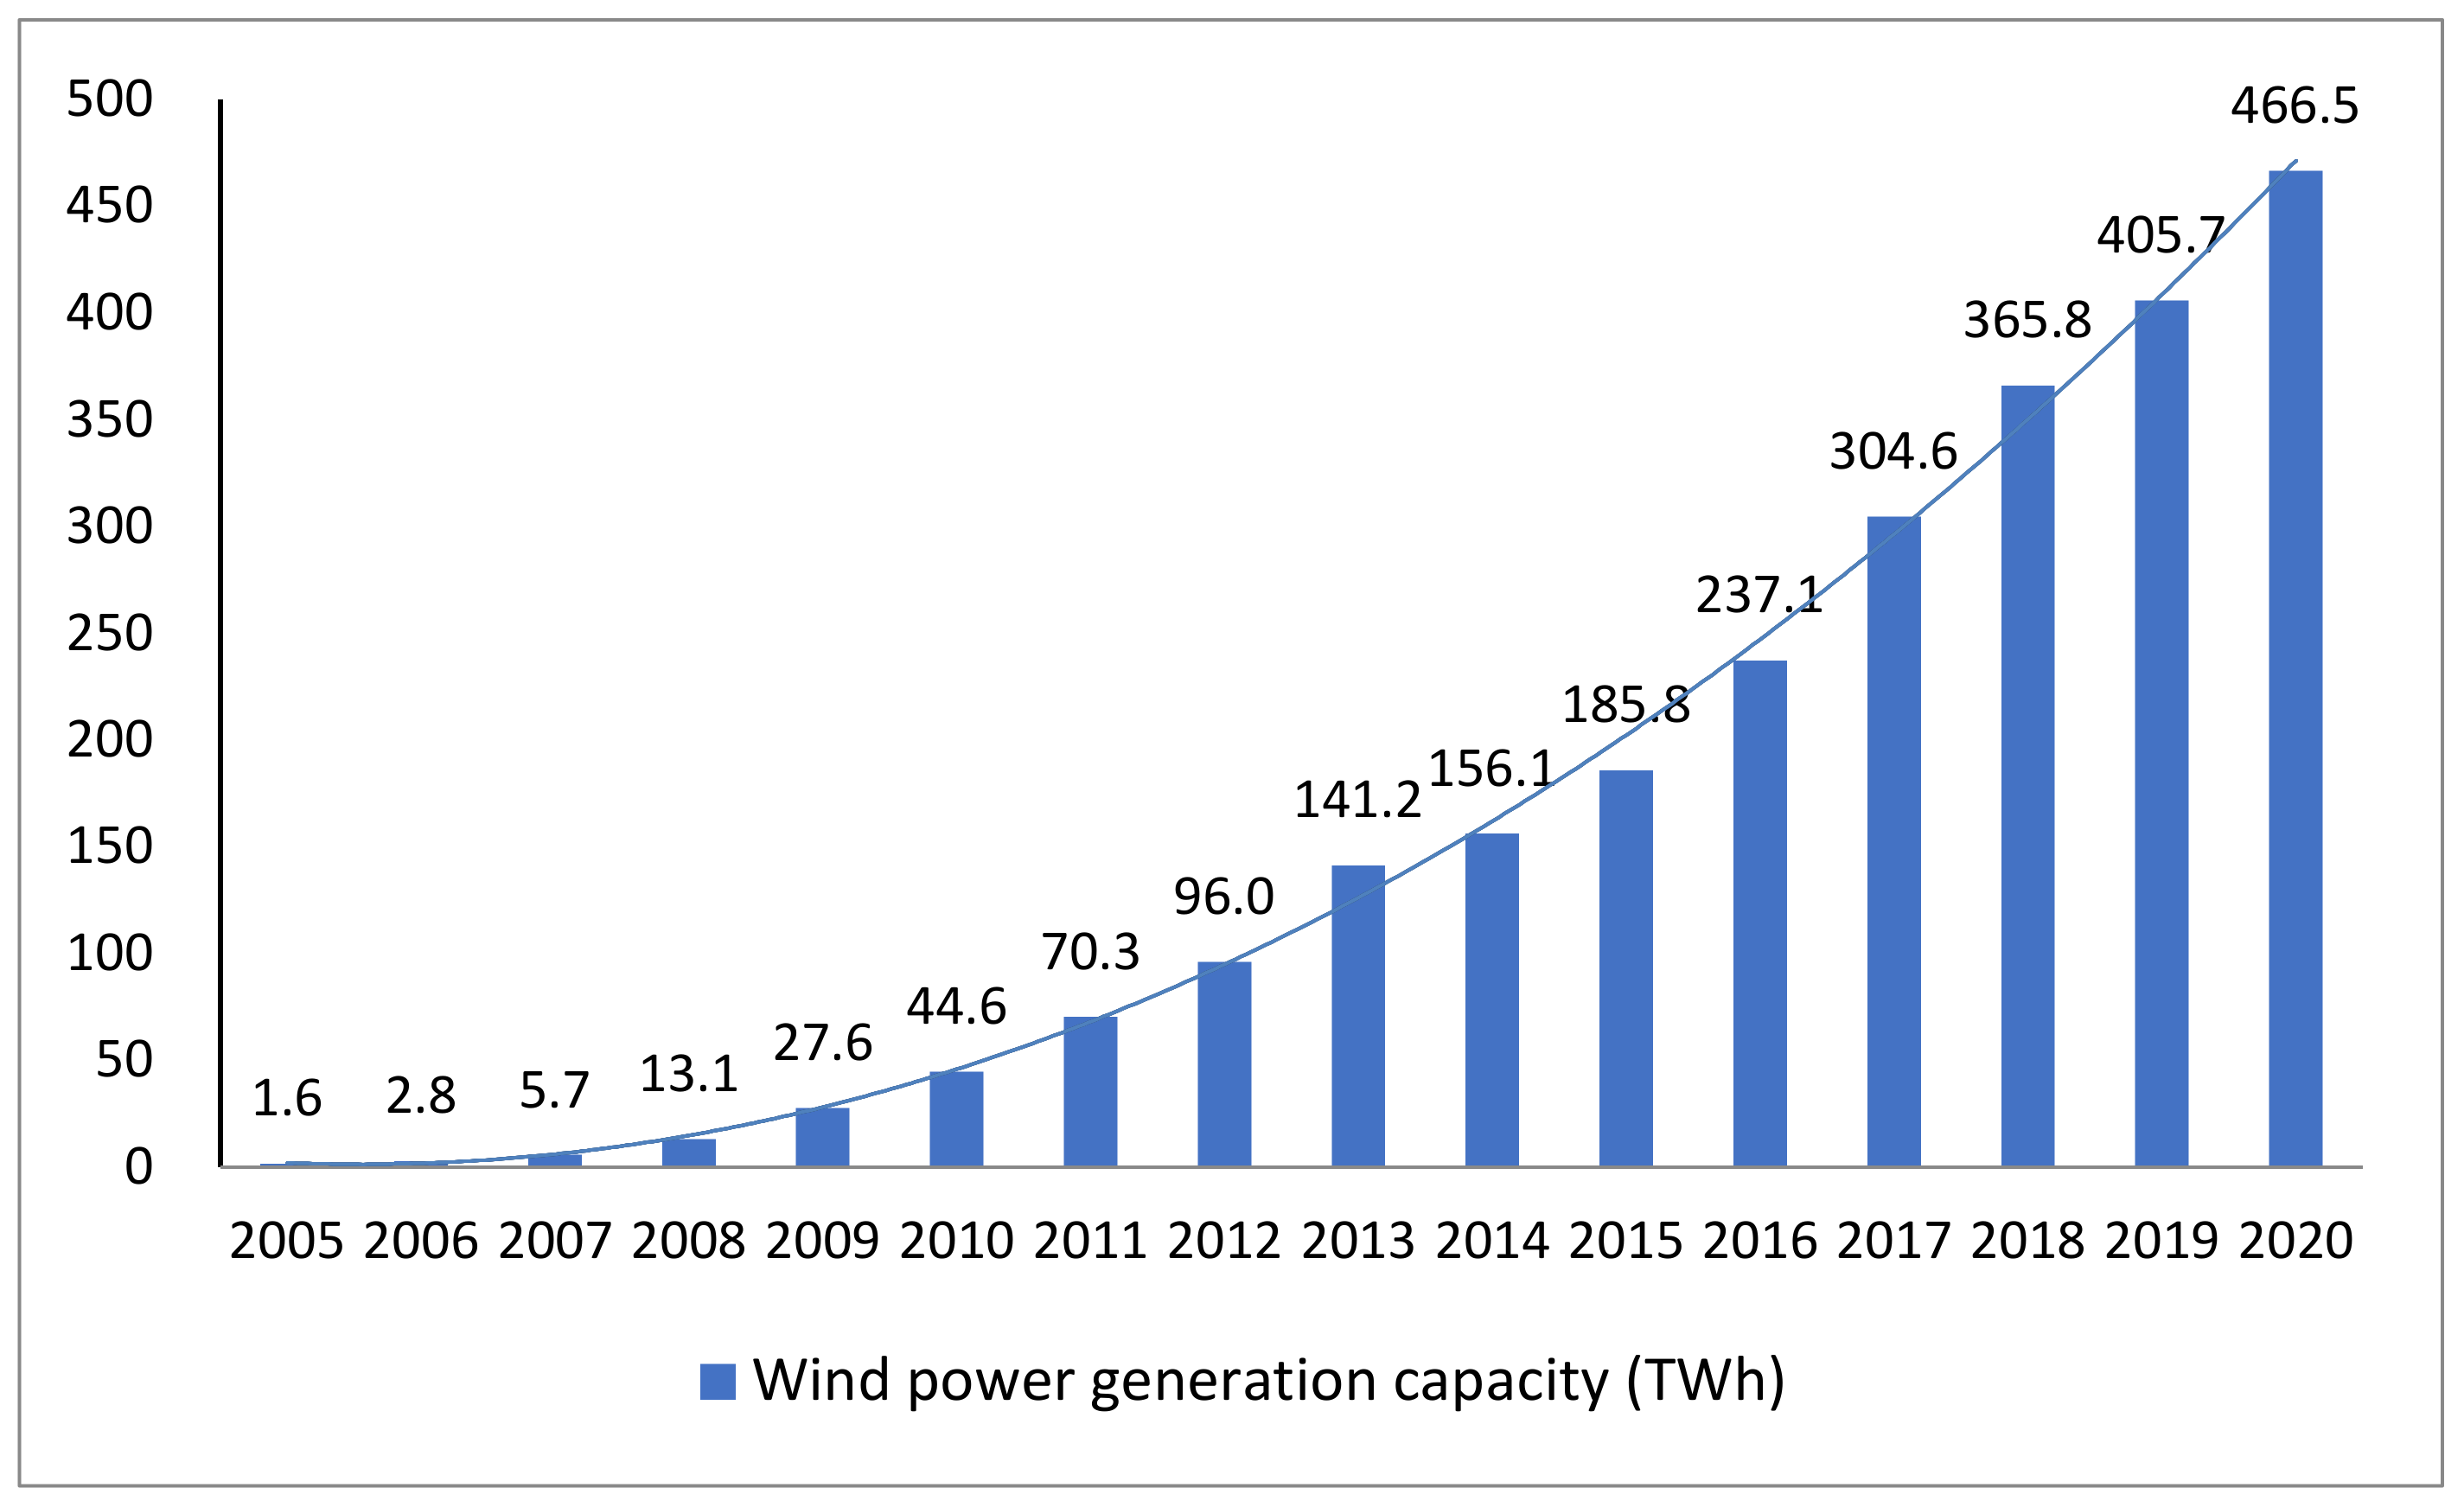
3.3. Status Quo and Historical Trend of Wind Power

3.3.1. Status Quo of Wind Power in China

According to BP’s 2021 report, the annual growth rate of global wind farms in 2020 was 11.9%, and the power generation was 1591.2 TWh. The country with the largest power generation was China (466.5 TWh); the United States of America (340.9 TWh) ranked second, followed by Germany (131 TWh), the United Kingdom (75.6 TWh), India (60.4 TWh), and Spain (53.2 TWh) [17]. They account for around 70% of the world’s wind farm output. As shown in Table 2, China’s wind power generation surpassed that of the United States of America in 2016, ranking first in the world, and accounting for 29.32% of the global total in 2020.

3.3.2. Historical Trend of Wind Power in China

Since 2005, the amount of China’s wind power has been increasing year by year. Using curve fitting, it can be seen that the trend of wind power generation is consistent with a quadratic polynomial curve, as shown in Figure 3.
In this study, the trend of wind power generation in China was analyzed using regression, with the results shown in Model 1.
WINDPOWER = 6.776 − 7.013 × T + 2.253 × T2
WINDPOWER represents the capacity of China’s wind power since 2005, where T is the number of periods, with T equal to 1 in 2005. The results show that the adjusted R-squared, F-statistic, and prob (F-statistic) are 0.997, 2386.398, and 0.000, respectively, which indicates that the fitting effect of the regression model is good and reflects the exponential growth trend of wind power generation in China. According to Model 1, it can be predicted that China’s wind power generation will be about 538.5 TWh in 2021.

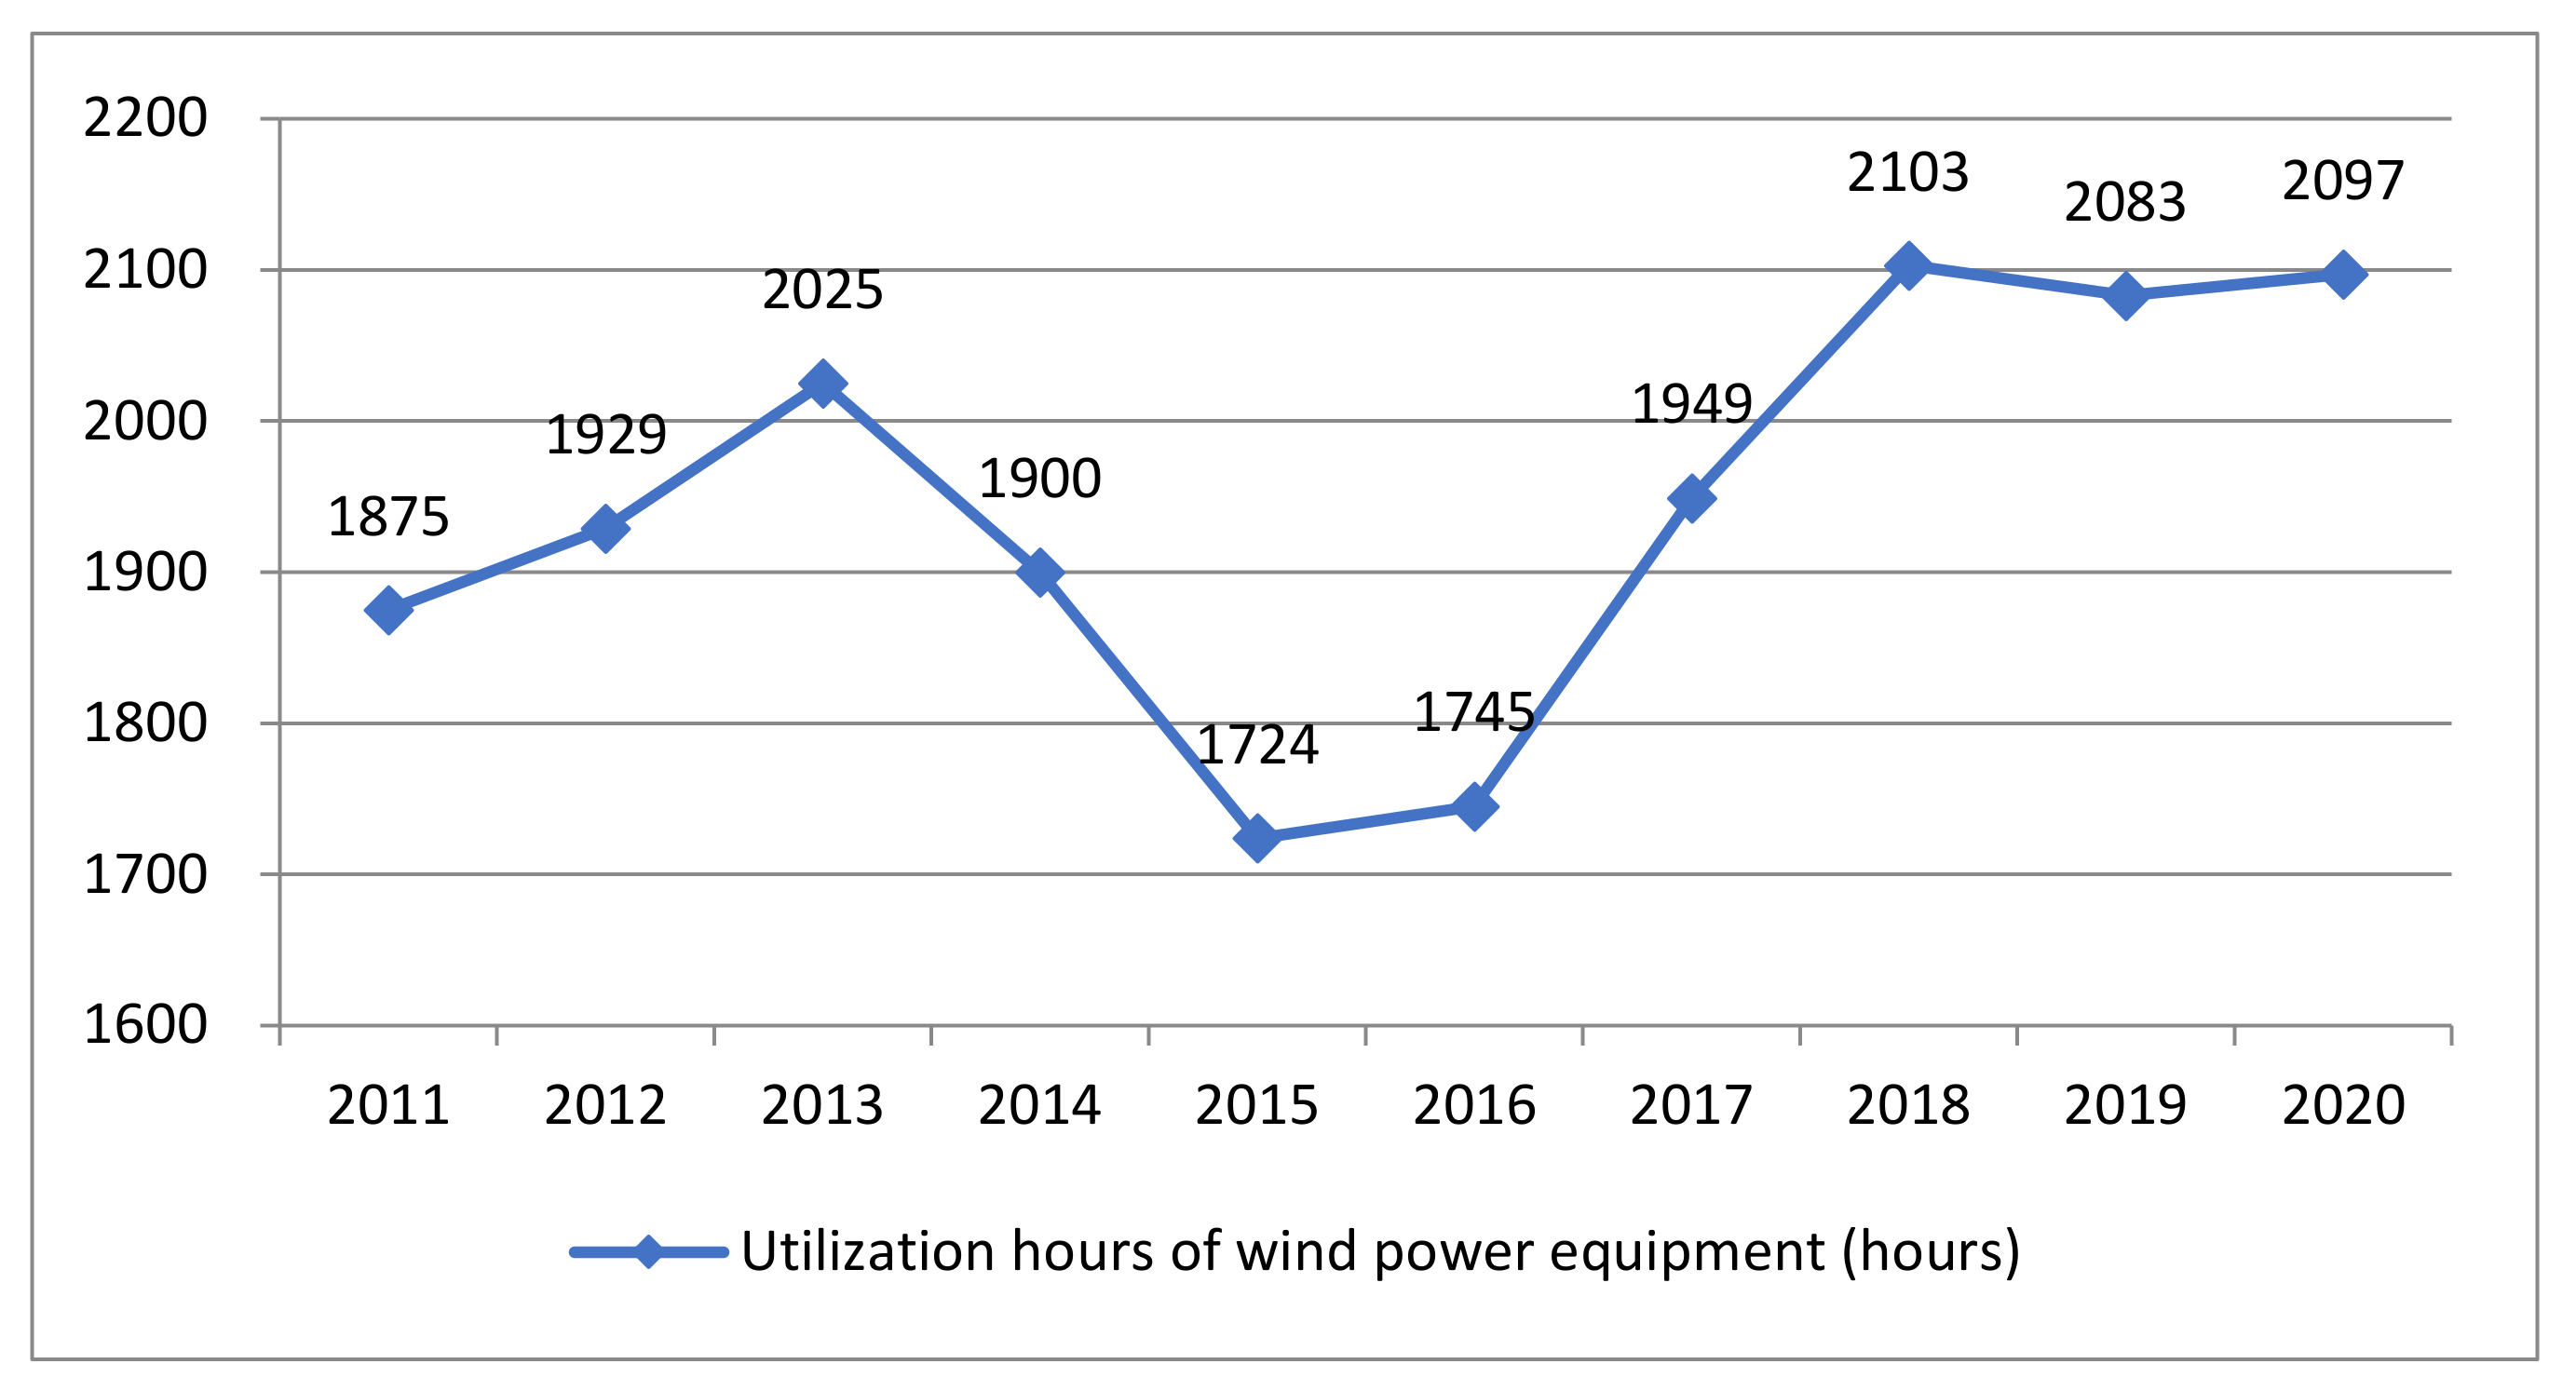
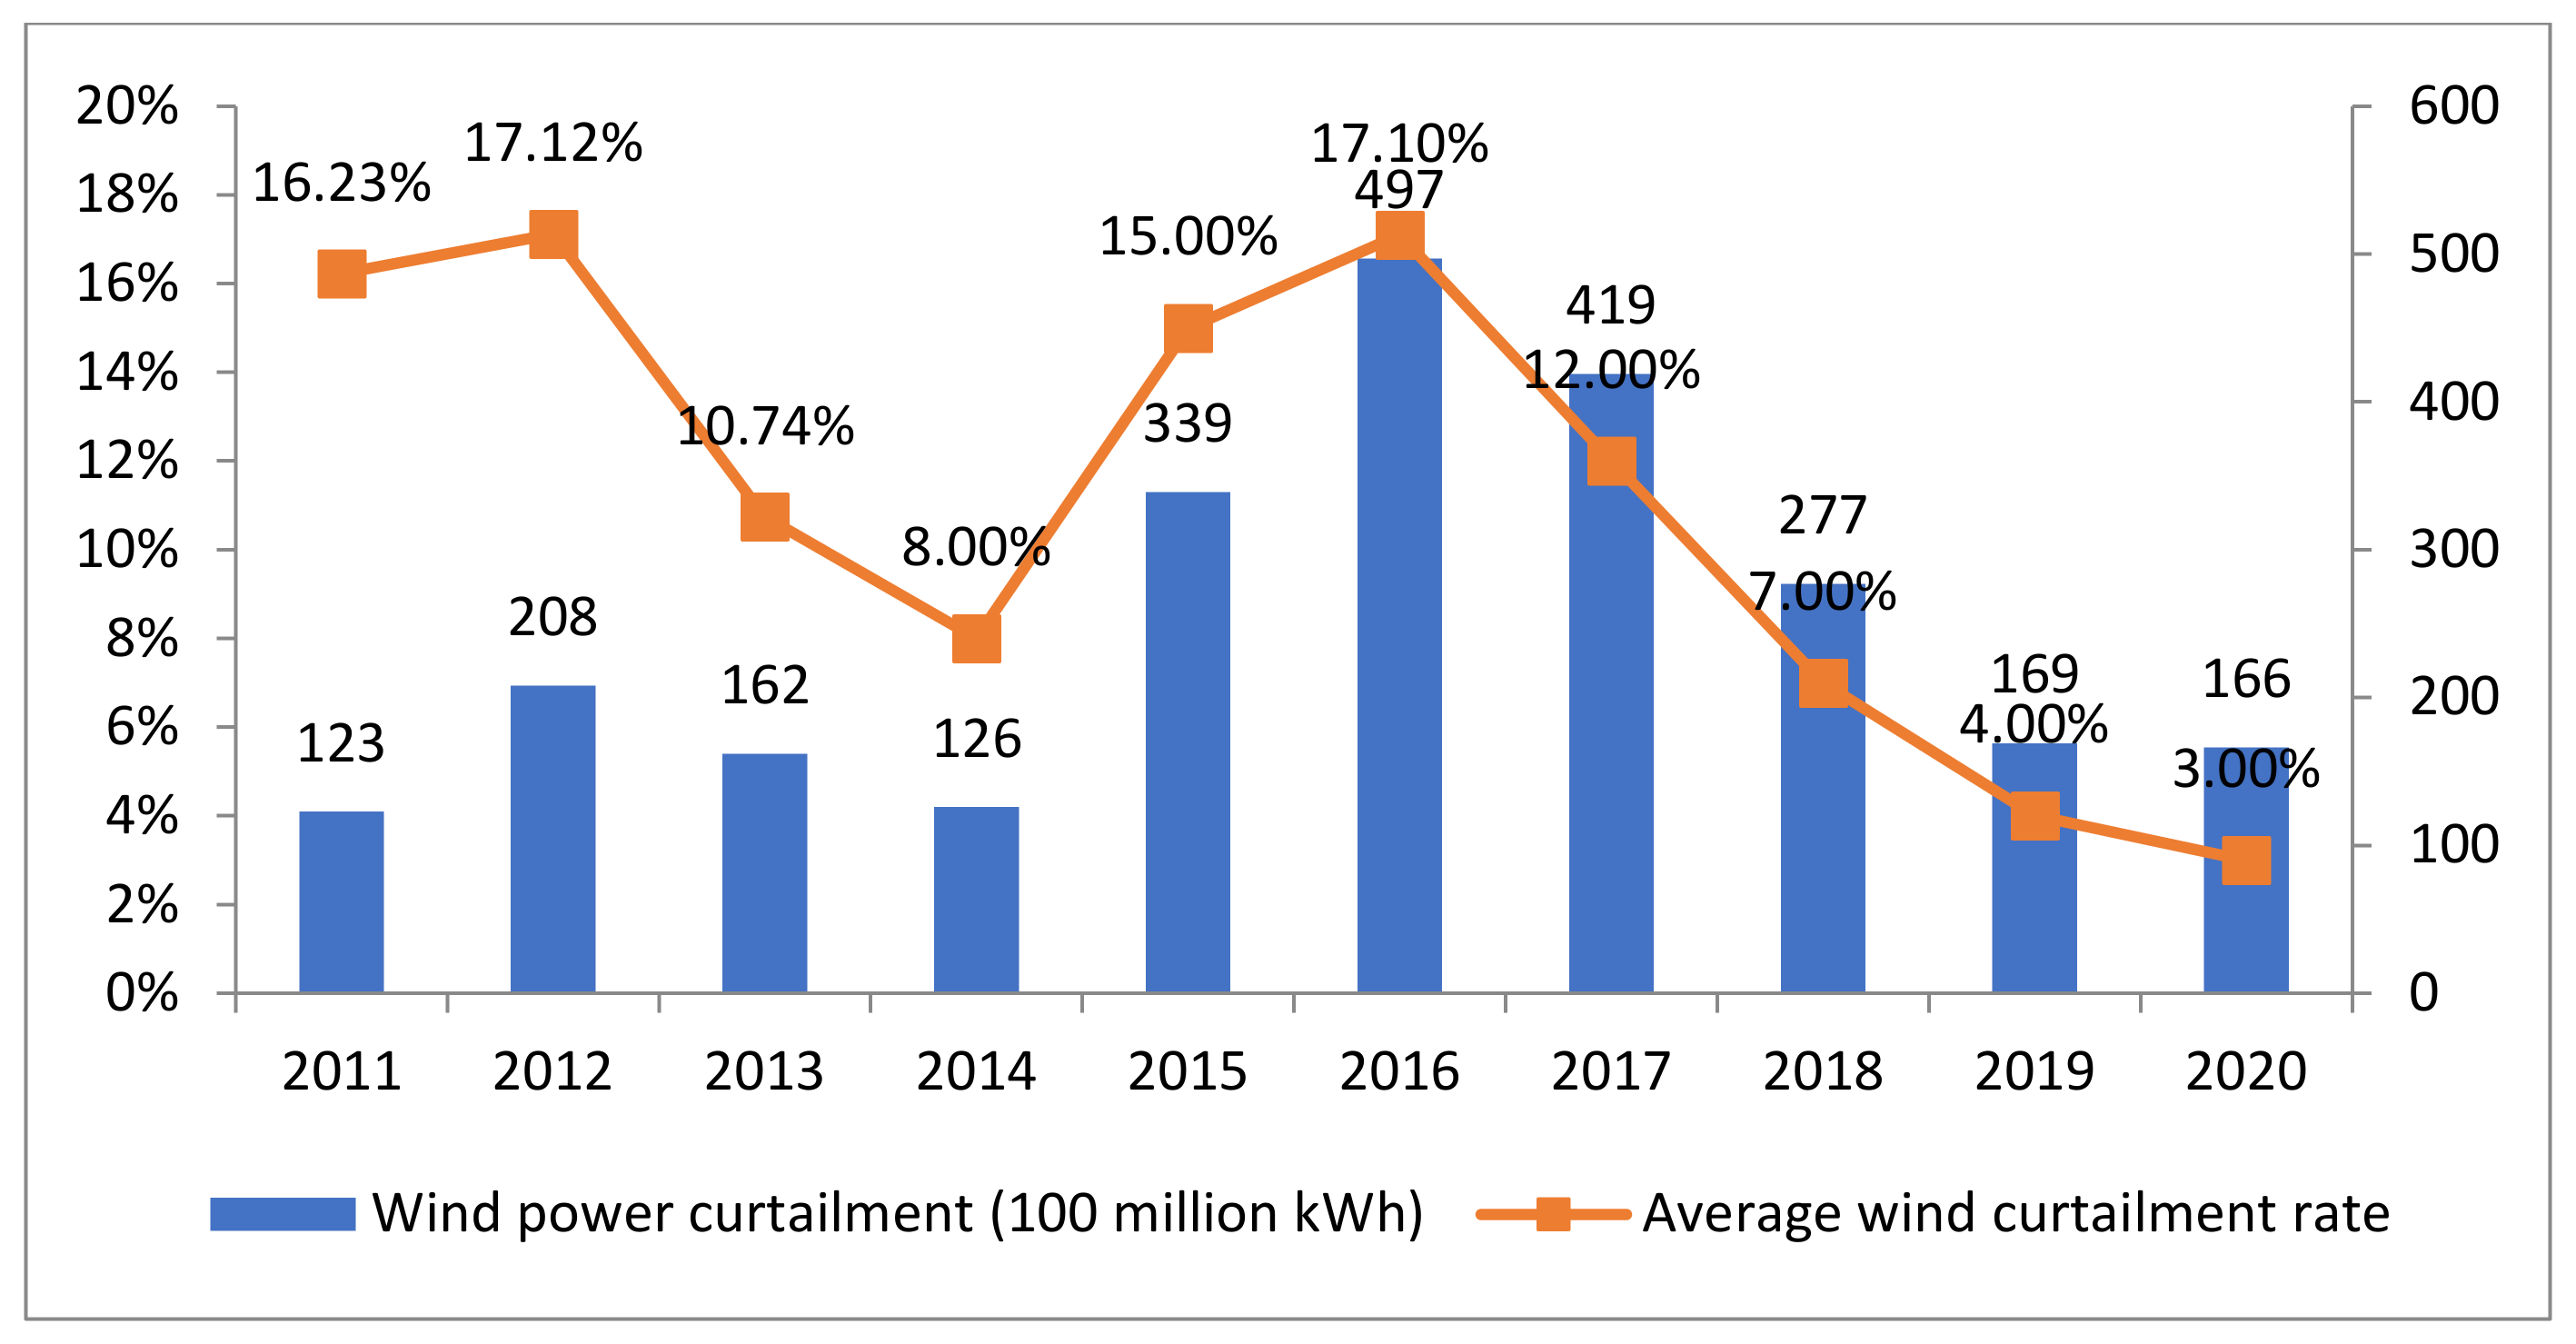
3.3.3. Wind Power Utilization in China

The utilization hours of wind power in China since 2011 are shown in Figure 4. Utilization hours refer to the annual power produced, divided by rated power. As can be seen from Figure 4, the utilization hours of China’s wind power generation equipment fluctuated to a certain extent, with the lowest point of 1724 h in 2015 and the highest value of 2103 h in 2018. In 2020, the country’s average wind power utilization hours were 2097 h; with Fujian (2880 h), Yunnan (2837 h), Guangxi (2745 h), and Sichuan (2537 h) leading the way.
Meanwhile, from the statistics of China’s wind curtailment data in recent years, the situation of wind abandonment and power rationing has fluctuated, as shown in Figure 5. Among them, wind abandonment was the most serious in 2012, with the wind curtailment rate reaching 17.12%. After a series of policy guidance and active adjustments of the industry, the phenomenon of wind abandonment was alleviated somewhat in 2013, and the wind curtailment rate dropped to 10.74%, and further to 8% in 2014. However, the wind curtailment rate rose again to 15% in 2015 and reached as high as 17.10% in 2016. The corresponding wind curtailment power also increased significantly in 2015, reaching a maximum of 49.7 TWh in 2016. Since 2017, China has implemented a policy of ‘double reduction’ of wind curtailment power and wind curtailment rate for two consecutive years. In 2020, the wind curtailment rate reached a historical low of 3%. The situation in most areas with serious wind curtailment and power curtailment has improved, but there was still 16.6 TWh of abandoned wind power. Among them, Xinjiang, Gansu, and Inner Mongolia, located in the northwest and north China, had the most serious problem of wind curtailment, with wind curtailment rates of 10.3%, 6.4%, and 7%, respectively.

4. Development and Utilization Efficiency of Wind Power in China

4.1. Method

Data envelopment analysis (DEA) is a new field of operation research, management science, and mathematical economics. It is a quantitative analysis method to evaluate the relative effectiveness of comparable units of the same type, using a linear programming method, according to input and output indexes. Taking the weight coefficients of input and output indexes of a decision making unit (DMU) as variables, a mathematical programming model was used to project the decision making unit onto the DEA production frontier, and the relative effectiveness of the DMU was evaluated comprehensively by comparing the deviation degree of the decision making unit from the DEA production frontier. Units achieving a 100% efficiency are believed to be relatively efficient, while those scoring less than 100% efficiency are called inefficient units. Through the comparison of inefficient and efficient units, a method of reducing inefficiency can be found.
The advantages of the DEA method are as follows: First of all, the weight coefficients of input–output indexes in the DEA model do not need to be set in advance. They are generated by mathematical programming based on original data and not affected by subjective factors. Second, the DEA method is characterized by unit invariance. Its measurement results are not affected by the units of input–output data. It can process both proportional and non-proportional data at the same time. Third, the DEA method does not need to specify the production function of input–output indexes in advance, and can be used to evaluate the production and operational efficiency of decision making units with multiple input–output indexes and complex production relations. Fourth, by analyzing the evaluation results of the DEA model, the utilization of resources of decision making units can be clarified, providing a reference for managers in making business decisions. The disadvantage of the DEA method is that its evaluation results are easily affected by extreme values. Based on the above factors, the DEA method was selected to conduct follow-up analyses.

4.2. Index Selection

4.2.1. Principle of Index Selection

First, the purpose of the evaluation should be considered in the selection of indicators. Second, the index selection should be concise, because too many input and output indicators will lead to a decline in the DEA analysis effectiveness. Third, there should be a logical correlation between indexes, not a numerical correlation. Fourth, diversity should be considered in the selection of indicators.

4.2.2. Index Selection of Wind Power Development Efficiency

The input indexes are mainly considered as the input of people, money, and materials. Since all the inputs ultimately result in the wind power installation, this paper takes the accumulative installed wind power capacity as the input index, and the wind power generation as the output index, as shown in Table 3.

4.2.3. Index Selection of Wind Power Utilization Efficiency

The utilization of wind power is mainly considered from the perspective of the contribution of wind power generation to the regional economy; therefore, this paper takes wind power generation as the input index, which is consistent with the output index in development efficiency. Considering that the contribution of various new energies to the economy can be replaced by the proportion of new energy in the total energy, the percentage of wind power generation in the total electricity generation was selected as the output index, as shown in Table 4.

4.3. Measurement and Analysis of China’s Wind Power Development Efficiency

4.3.1. Measurement of China’s Wind Power Development Efficiency

The efficiency of wind power development refers to the efficiency of the wind energy production process. From the perspective of the wind energy production process, the rationality of input scale and the utilization of various input resources are calculated. Based on the data from 2005 to 2020, China’s wind power development efficiency was measured, with the results shown in Table 5.

4.3.2. Results Analysis

From the perspective of pure technical efficiency, the data shows a certain fluctuation, which was equal to 1 in 2005, 2018, 2019, and 2020; indicating that the output of wind power development (i.e., wind power generation) in China reached the maximum relative to the input (cumulative wind power installed capacity) in these years, and, thus, realizing the optimal allocation of resources. While the data in other years was basically between 0.5 and 0.8, especially from 2007 to 2011, the pure technical efficiency was lower than 0.7, indicating that there were some problems in the operation and management of wind energy development in China during these years. Compared with the input, the output was not maximized.
From the perspective of scale efficiency, excepting 2005 and 2006, the data of other years were close to or equal to 1, indicating that China’s wind energy development investment has realized scale efficiency and that the development trend has been very good.
From the perspective of comprehensive efficiency, the pure technical efficiency was 1 in 2005, 2018, 2019, and 2020, so the corresponding comprehensive efficiency was mainly affected by scale efficiency. In terms of the overall trend, the comprehensive efficiency basically showed an upward trend, reaching 1 in 2018 and declining slightly in 2019 and 2020.
From the perspective of returns to scale, China’s wind power development has seen increasing returns to scale from 2005 to 2015, indicating that the construction scale of wind power development should have been expanded during this period to obtain greater benefits. From 2016 to 2018, the returns to scale remained unchanged, indicating that the current scale of wind power development and construction should have been maintained at this stage. From 2019, the returns to scale began to decrease, indicating that the construction speed of wind power development should be slowed down appropriately and the construction scale controlled.

4.4. Measurement and Analysis of China’s Wind Power Utilization Efficiency

4.4.1. Measurement of China’s Wind Power Utilization Efficiency

Wind power utilization efficiency investigates the role of wind energy products in promoting regional economic growth. Using the index of wind power utilization efficiency determined above, and based on the data from 2005 to 2020, China’s wind power utilization efficiency was measured, with the results shown in Table 6.

4.4.2. Results Analysis

In 2005, all the efficiencies of wind power utilization in China were 1, indicating that compared with other years, China’s wind power utilization in 2005 was, not only reasonable in scale, but also highly efficient in operation and management, achieving an optimal allocation of resources. It also indicated that all the wind power produced in that year had been put into the national economy, and the wind power utilization in 2005 was relatively stable. The annual contribution rate to national economy was the highest, and the energy utilization efficiency also reached the maximum.
From the perspective of pure technical efficiency, except for the values in 2007 and 2014 that were 0.951 and 0.986, respectively, the data for other years were all 1, indicating that the output of China’s wind power utilization (i.e., the contribution of wind power to economic growth) had realized the optimal allocation of resources relative to the input (i.e., wind power generation), and also indicating that the operation and management of China’s wind power utilization in these years was effective.
From the perspective of scale efficiency, the scale efficiency has been declining since 2005 and dropped to 0.350 in 2020. At the same time, China’s wind power utilization always has decreasing returns to scale, indicating that the input scale of wind power utilization was relatively large relative to the output, resulting in a negative marginal output of input. Therefore, from an economic point of view, the contribution rate of wind power products to the national economy should be improved; that is, increase the proportion of wind power generation in the total power generation and give full play to the role of wind energy as a renewable energy in the national economic growth.
From the perspective of comprehensive efficiency, except for the data of 1 in 2005, the comprehensive efficiency of other years was decreasing, mainly affected by the scale efficiency.

5. Conclusions

Through the above research, this paper draws the following conclusions: (1) Since 2000, the total amount of power production and consumption in China has been increasing continuously, and the total amount of power production was always higher than that of power consumption, indicating that China’s power production could guarantee production and domestic needs. (2) In recent years, although the majority of China’s power production is still from thermal power, the proportion of renewable energy power generation has been increasing significantly, especially wind power. (3) China’s wind power industry is developing rapidly. By 2020, it had become the country with the largest installed capacity in the world for nine consecutive years, accounting for about one third of the world’s total and ranking first in the world. (4) China’s wind power generation has shown an exponential growth trend; surpassing that of the U.S.A. in 2016, ranking first in the world, and it is expected to reach 538.5 TWh in 2021. (5) Since 2017, China has implemented a policy of ‘double reduction’ of wind power curtailment and wind curtailment rate for two consecutive years, which has achieved remarkable results. In 2020, the wind curtailment rate reached a historical low of 3%, and the situation in most regions with serious wind curtailment has improved. Based on the above analysis on the status quo of China’s electric power and wind power industry, it can be seen that China can, not only guarantee its own production and domestic needs for electric energy in terms of total amount, but also pay more attention to sustainable economic development, in terms of structure, and strengthen the development and utilization of renewable energy. In particular, the wind power industry is developing rapidly, with wind power generation growing exponentially, ranking first in the world. (6) Except for 2005, 2018, 2019, and 2020, China’s wind energy development efficiency was mainly affected by pure technical efficiency, showing that China’s wind energy development failed to realize the optimal allocation of resources and failed to maximize output relative to input during this period. Therefore, it is necessary to further strengthen the operation and management of wind energy development. (7) China’s wind power utilization efficiency is mainly affected by scale efficiency, and always with diminishing returns of scale, indicating that the input scale of wind power utilization is relatively large compared with the output, resulting in a negative marginal output of input. Therefore, the contribution of wind power in the national economy should be increased, to give full play to the role of wind energy in the national economic growth. Of course, there are many factors affecting the development and utilization of wind energy, including policies, regulations, economic development level, technological level, geographical and ecological environmental factors, energy security, and so forth, which need to be studied further in the future.

Author Contributions

Both authors contributed to this work through collaboration. F.Y. contributed to conceptualization. J.Y. conducted an extensive search of the literature on the development of wind energy, analyzed data and prepared the manuscript. Both authors contributed to the discussion and information collection. All authors have read and agreed to the published version of the manuscript.

Funding

This research received no external funding.

Institutional Review Board Statement

Not applicable.

Informed Consent Statement

Not applicable.

Data Availability Statement

The data that supports the findings of this study are available within the article.

Acknowledgments

Special thanks to F.Y. for her support.

Conflicts of Interest

The authors declare no conflict of interest.

References

  1. Rodríguez, X.A.; Regueiro, R.M.; Doldán, X.R. Analysis of productivity in the Spanish wind industry. Renew. Sustain. Energy Rev. 2019, 118, 109573. [Google Scholar] [CrossRef]
  2. Papież, M.; Śmiech, S.; Frodyma, K. Factors affecting the efficiency of wind power in the European Union countries. Energy Policy 2019, 132, 965–977. [Google Scholar] [CrossRef]
  3. Zhong, K.L.; Zhao, W.H.; Tan, Z.F.; Ye, D. A System Dynamics Simulation for Wind Power Performance Evaluation. Power Syst. Clean Energy 2018, 5, 61–68. [Google Scholar]
  4. Gao, M. Research on China’s provincial energy efficiency based on DDF function and meta frontier model. Stat. Decis. Mak. 2016, 1, 146–150. [Google Scholar]
  5. Shen, X.C.; Lyu, S.J. Wind power development, government regulation structure, and vested interest groups: Analysis based on panel data of Province of China. Energy Policy 2019, 128, 487–494. [Google Scholar] [CrossRef]
  6. Yao, J.; Zhu, Y. Research on the main factors affecting the development and utilization of wind energy in Jilin Province, China. J. Renew. Sustain. Energy 2019, 11, 015904. [Google Scholar] [CrossRef]
  7. Lv, W.C.; Ma, J.L.; Chen, J.X.; Wu, Y.Q. Current situation and restriction bottleneck of the development of wind power in-dustry. Renew. Energy Resour. 2018, 8, 1214–1218. [Google Scholar]
  8. Jenniches, S.; Worrell, E.; Fumagalli, E.M. Regional economic and environmental impacts of wind power developments: A case study of a German region. Energy Policy 2019, 132, 499–514. [Google Scholar] [CrossRef]
  9. Xia, F.; Song, F. Evaluating the economic impact of wind power development on local economies in China. Energy Policy 2017, 110, 263–270. [Google Scholar] [CrossRef]
  10. Charnes, A.; Cooper, W.W.; Rhodes, E. Measuring the efficiency of decision making units. Eur. J. Oper. Res. 1978, 2, 429–444. [Google Scholar] [CrossRef]
  11. Zhao, L.; Wang, L.; Yao, S.L.; Zhang, Y. Evaluation and analysis of hospital efficiency in China based on macro- and mi-cro-level analyses. J. Publ. Health Theory Pract. 2020, 28, 191–197. [Google Scholar]
  12. Chen, Y.; Xu, J.-T. An assessment of energy efficiency based on environmental constraints and its influencing factors in China. Environ. Sci. Pollut. Res. 2019, 26, 16887–16900. [Google Scholar] [CrossRef] [PubMed]
  13. Liu, X.; Zhu, Q.; Chu, J.; Ji, X.; Li, X. Environmental Performance and Benchmarking Information for Coal-Fired Power Plants in China: A DEA Approach. Comput. Econ. 2016, 54, 1287–1302. [Google Scholar] [CrossRef]
  14. Liu, X.; Wu, J. Energy and environmental efficiency analysis of China’s regional transportation sectors: A slack-based DEA approach. Energy Syst. 2015, 8, 747–759. [Google Scholar] [CrossRef]
  15. Lozano, S. Technical and environmental efficiency of a two-stage production and abatement system. Ann. Oper. Res. 2015, 255, 199–219. [Google Scholar] [CrossRef]
  16. Yao, J.; Zhu, Y. Measurement and Analysis of the Development and Utilization Efficiency of Wind Energy in Jilin Province. IOP Conf. Ser: Earth Environ. Sci. 2019, 237, 042011. [Google Scholar] [CrossRef]
  17. BP. Statistical Review of World Energy. 2021. Available online: https://www.bp.com/en/global/corporate/energy-economics/statistical-review-of-world-energy.html (accessed on 5 November 2021).
  18. Global Power Report 2018—Analysis of Energy Structure in Various Countries. Available online: https://www.sohu.com/a/284616918_131990 (accessed on 8 November 2021).
  19. Analysis on the Current Situation and Future Development Trend of China’s Wind Power Industry in 2017. Available online: https://www.chyxx.com/industry/201708/548371.html (accessed on 8 November 2021).
Figure 1. Trend of China’s electric power production and consumption. (Data source: National Bureau of Statistics).
Processes 09 02133 g001
Figure 2. New and cumulative installed wind power capacity in China. (Data source: China’s wind power installed Capacity Statistics 2006–2020; BP Statistical Review of World Energy 2021).
Processes 09 02133 g002
Figure 3. Trend of China’s wind power generation capacity. (Data source: National Bureau of Statistics).
Processes 09 02133 g003
Figure 4. Utilization hours of wind power equipment in China. (Data source: National Energy Administration).
Processes 09 02133 g004
Figure 5. Average wind curtailment rate and power in China. (Data source: National Energy Administration).
Processes 09 02133 g005
Table 1. Power production structure in China from 2011 to 2020.
YearHydropowerThermal PowerNuclear PowerWind PowerSolar Power
201114.83%81.34%1.83%1.49%0.82%
201217.49%78.05%1.95%1.92%0.50%
201316.94%78.19%2.05%2.60%0.59%
201418.84%75.56%2.35%2.76%0.21%
201519.44%73.68%2.94%3.19%0.50%
201619.43%72.24%3.47%3.86%0.75%
201718.51%71.10%3.84%4.72%1.83%
201817.61%70.41%4.22%5.23%2.53%
201917.77%68.88%4.76%5.53%3.05%
202017.77%67.88%4.80%6.12%3.42%
Data source: Assembled and computed according to the National Bureau of Statistics.
Table 2. Proportion of wind power generation in countries with highest wind farm power generation.
Country201220132014201520162017201820192020
China19.41%21.76%22.64%22.32%25.04%26.71%28.81%28.58%29.32%
U.S.A26.81%26.68%26.00%23.17%23.83%22.53%21.69%21.08%21.42%
Germany9.74%8.30%8.29%9.70%8.31%9.27%8.66%8.88%8.23%
U.K.3.74%4.47%4.53%4.84%3.87%4.35%4.48%4.53%4.75%
India5.17%4.72%4.74%3.94%4.52%4.62%4.75%4.46%3.80%
Spain9.32%8.78%7.37%5.93%5.08%4.31%4.01%3.74%3.34%
Total74.19%74.70%73.56%69.91%70.64%71.78%72.41%71.27%70.86%
Data source: Assembled and computed according to ‘BP statistical review of world energy 2021’.
Table 3. Input–output indexes of wind power development efficiency.
YearInput Index
(Cumulative Installed Capacity of Wind Power (MW))
Output Index
(Wind Power Generation Capacity (TWh))
200512501.6
200625372.8
200758485.7
200812,00213.1
200925,80527.6
201044,73444.6
201162,36470.3
201275,32496.0
201391,413141.2
2014114,609156.1
2015145,360185.8
2016168,730237.1
2017188,392304.6
2018209,534365.8
2019236,320405.7
2020288,320466.5
Data source: Assembled according to Statistics of China Wind Power Installed Capacity 2006–2021 and the EPS Data Platform.
Table 4. Input–output indexes of wind power utilization efficiency.
YearInput Index
(Windpower Generation Capacity (TWh))
Output Index
(Proportion of Wind Power Generation to the Total (%))
20051.60.06
20062.80.10
20075.70.17
200813.10.38
200927.60.75
201044.61.06
201170.31.49
201296.01.92
2013141.22.60
2014156.12.76
2015185.83.20
2016237.13.86
2017304.64.72
2018365.85.23
2019405.75.54
2020466.56.12
Data source: Assembled and calculated according to the EPS Data Platform.
Table 5. Measurement results of China’s wind power development efficiency.
DMUCrsteVrsteScaleTrend
20050.73310.733IRS
20060.6320.7270.869IRS
20070.5580.5910.944IRS
20080.6250.6420.974IRS
20090.6130.620.989IRS
20100.5710.5740.994IRS
20110.6460.6480.996IRS
20120.730.7320.997IRS
20130.8850.8870.998IRS
20140.780.7810.999IRS
20150.7320.7330.999IRS
20160.8050.8051-
20170.9260.9261-
2018111-
20190.98310.983DRS
20200.92710.927DRS
Mean0.7590.7920.963
Note: 1. IRS and DRS refer to increasing returns to scale and diminishing returns to scale. 2. Crste, Vrste, and Scale stand for comprehensive technical efficiency, pure technical efficiency and scale efficiency, respectively. Pure technical efficiency refers to the production efficiency affected by management and technology factors, while scale efficiency is the production efficiency affected by scale factors. Meanwhile, Crste = Vrste × Scale.
Table 6. Measurement results of China’s wind power utilization efficiency.
DMUCrsteVrsteScaleTrend
2005111-
20060.95210.952DRS
20070.7950.9510.837DRS
20080.77410.774DRS
20090.72510.725DRS
20100.63410.634DRS
20110.56510.565DRS
20120.53310.533DRS
20130.49110.491DRS
20140.4710.9860.478DRS
20150.45910.459DRS
20160.43410.434DRS
20170.41310.413DRS
20180.38110.381DRS
20190.36410.364DRS
20200.35010.350DRS
Mean0.5840.9960.587
Publisher’s Note: MDPI stays neutral with regard to jurisdictional claims in published maps and institutional affiliations.

