Article

Manual Application versus Autonomous Release of Water Repellent Agent to Prevent Reinforcement Corrosion in Cracked Concrete

1
Magnel-Vandepitte Laboratory for Structural Engineering and Building Materials, Department of Structural Engineering and Building Materials, Faculty of Engineering and Architecture, Ghent University, Technologiepark Zwijnaarde 60, 9052 Ghent, Belgium
2
SANACON bv, Spin-Off Company Magnel-Vandepitte Laboratory for Structural Engineering and Building Materials, Nijverheidsweg 1/A, 9820 Merelbeke, Belgium
3
PProGRess-UGCT, Department of Geology, Faculty of Science, Ghent University, Krijgslaan 281, S8, 9000 Ghent, Belgium
4
Environmental Hydrogeology, Department of Earth Sciences, Faculty of Geosciences, Utrecht University, Princetonlaan 8A, 3584 CD Utrecht, The Netherlands
*
Author to whom correspondence should be addressed.
Processes 2021, 9(12), 2101; https://doi.org/10.3390/pr9122101
Submission received: 8 November 2021 / Revised: 19 November 2021 / Accepted: 22 November 2021 / Published: 23 November 2021
(This article belongs to the Section Materials Processes)

Abstract

:
Cracks in reinforced concrete are preferential ingress paths for aggressive substances such as chlorides. As soon as a critical amount of chlorides has reached the steel reinforcement, corrosion will occur. Therefore, crack healing is of utmost importance. However, manual crack repair is very labour intensive. Therefore, the potential of self-healing through the release of a water repellent agent from embedded capsules was compared with the effectiveness of applying this agent on the concrete surface before or after cracking and the effectiveness of injection of the agent into a crack. From the electrochemical corrosion measurements, it was shown that only uncracked samples were able to withstand 135 weekly cycles of exposure to a 33 g/L chloride solution without corrosion initiation of the reinforcement. While samples with manually injected and autonomously healed cracks resisted the exposure conditions for about 50 cycles or more, samples for which the water repellent agent was applied onto the surface after cracking resisted the exposure conditions for 5–42 cycles, while samples for which the agent was applied onto the surface before cracking showed an immediate corrosion initiation similar as was noted for the untreated cracks. From a visualization of the chloride ingress front and determination of the chloride content in the vicinity of the crack, it was noticed that none of the crack treatment techniques performed as well as the uncracked series. Visual inspection of the corroded rebars and determination of the corroded volume of the rebars through computed tomography and macro-cell corrosion current measurements proved again that the uncracked series outperformed the other series. While the corroded volume of the rebars from the uncracked series was almost zero, this value ranged from 15–95 mm3 for the rebars of the other series. However, the latter investigations also showed that release of the agent into the crack, whether this was done in a manual way or autonomously through release from embedded capsules, resulted in a delayed corrosion initiation and lower corrosion propagation rate compared to the application of a water repellent agent onto the surface. This is a beneficial outcome for the further implementation of self-healing approaches, more specifically though the release of encapsulated water repellent agent, in the market.

1. Introduction

Although reinforced concrete is one of the most widely used construction materials, one of its most important drawbacks is its vulnerability to corrosion. Corrosion of reinforcement steel leads to the formation of corrosion products with an increased volume of about 6–10 times the original steel volume [1] causing concrete cracking and spalling. In addition, it leads to a reduction in rebar cross section due to metal dissolution causing an impairment of the structural safety. Multiple approaches have been suggested to mitigate corrosion of reinforcement steel, among which reducing the concrete permeability [2], making use of corrosion inhibitors mixed into the concrete or applied onto the steel or concrete surface [3,4,5,6,7], and using corrosion protective coatings or paints applied onto the steel bars or the concrete surface [8]. Some time ago, the use of self-healing coatings or self-healing concrete has also been suggested as method to prevent or delay reinforcement corrosion. In the study of Sharma et al. [9], a nano-modified epoxy coating with self-healing properties through the use of encapsulated tung oil was applied onto the rebars and resulted in a reduction in steel mass loss when the rebars were exposed to an accelerated impressed current corrosion test with a 3.5% NaCl solution. In the study of Dong et al. [10,11], two types of corrosion inhibitors were embedded inside ethyl cellulose microcapsules. In this way, they counteract the negative effect of these inhibitors prematurely binding with unhydrated cement [12]. By a reduction of the pH inside the concrete, the system is activated and it was shown by X-ray micro-computed tomography (X-ray μCT) that depassivation and cracking caused by corrosion was delayed. In the study of Xu et al. [13], self-healing properties were added to the concrete matrix through the use of ureolytic bacteria immobilized in porous ceramsite particles. In the latter study, deterioration of the reinforcement was caused by carbonation induced corrosion. It was shown that crack widths up to 450 μm could be sealed in 120 days and this caused a significant discrepancy for the corrosion currents deduced from the Tafel plots. Ersan et al. [14] suggested another microbiological pathway in order to prevent reinforcement corrosion. They suggested to make use of denitrifying bacteria, due to their enhanced CaCO3 precipitation and an additional corrosion inhibiting effect from the metabolic intermediate product of NO2. Osman et al. [15] explored the impact of introducing different microbes, among which two types of bacteria and one of algae, on the possibility to heal concrete cracks and prevent reinforcement corrosion. Making use of an accelerated corrosion test in which the samples were exposed to a 3.5% NaCl solution while being exposed to a 1 mA/cm2 current density showed that corrosion inhibition was successful. In previous research performed by the authors of this manuscript [16,17,18], it was investigated whether the encapsulation of polyurethane based healing agents could help to cause crack healing and prevent corrosion in reinforced concrete. They noticed that the crack healing efficiency depended on the viscosity of the polyurethane based healing agent and that autonomous crack healing delayed the onset of corrosion, but was not able to show a behaviour similar as the one noticed for uncracked samples. In previous research performed by the authors [19], also the encapsulation of a water repellent agent (WRA) to reduce the risk of reinforcement corrosion was investigated. However, experiments in the latter study only lasted for 12 weeks and did not consider the long-term effect of the WRA. Dai et al. [20,21], on the other hand, did focus on the effectiveness of a silane-based WRA on the longer term. They had proven from their one year long test program that surface impregnation with silane is an effective measure to reduce water absorption, to create a chloride barrier and subsequently to suppress the initiation of steel reinforcement corrosion. In case cracks existed in the concrete surface before hydrophobic impregnation, the efficiency mainly depended on the penetration depth and better results were obtained when silane based creams and gels were used instead of silane liquids. However, when cracks were formed in the reinforced concrete after surface impregnation with silane, it seemed that chloride penetration could not be totally prevented.
In none of the before mentioned research studies, experiments running for more than one year have been performed to investigate the efficiency of the proposed self-healing approach on a long term. Moreover, while the efficiency of surface impregnation with silanes for cracked concrete has been investigated in a one year running test program, local release of silanes and, more specifically, the use of an encapsulated silane-based, liquid WRA to prevent the ingress of chloride ions and thus prevent reinforcement corrosion in cracked concrete, has never been tested in a long-term test program.
In this study, the efficiency of four different concrete crack treatment techniques was compared. In all cases, crack healing was envisaged through the use of a WRA. Although from previous research silane based creams and gels seemed to outperform silane liquids [20], a liquid based WRA was chosen in this study as the low viscosity of this agent would improve the outflow from the capsules. While in two cases, the WRA was applied on the surface of the test specimen, for one series before and for the other series after crack formation, the two remaining crack treatment techniques consisted of local, manual or autonomous application of WRA into the crack. The efficiency of the four crack treatment techniques was compared against an untreated cracked test series and a series with uncracked samples. The macro-cell corrosion current was monitored during the 135 weeks cyclic exposure to a 33 g/L chloride solution. In addition, electrochemical measurements (corrosion potential (Ecorr), ohmic voltage drop (IR drop), Open Circuit Potential (OCP), and linear polarization resistance (LPR)) were performed during the exposure period on a regular basis. After exposure, the chloride content in the vicinity of the rebar was measured and the chloride ingress front was defined for all samples after splitting. Finally, the rebars were taken out of the samples for visual evaluation and to define the volume of corroded material through X-ray μCT scanning for comparison with the steel mass loss calculated from the macro-cell corrosion current measurements.

2. Materials

2.1. Healing Agent

The healing efficiency of a WRA was investigated within this study. The used WRA is a commercially available one-component agent Sikagard 705 L (Sika Belgium nv, Nazareth, Belgium). This WRA, based on reactive silanes, penetrates into the cementitious material and causes a water repellent effect reducing the absorption of harmful, in water dissolved substances such as chlorides from sources such as de-icing salts or from marine environments. This healing agent has a very low viscosity of ±8 mPaS at 25 °C and a density of 0.9 g/cm3.

2.2. Capsules

For some of the test series under investigation, encapsulation of the healing agent was performed by cylindrical borosilicate glass capsules with an internal diameter of 3.00 ± 0.05 mm and a wall thickness of 0.18 ± 0.03 mm. Capsules were cut from tubes to a length of 50 mm. After cutting to the desired length, one end of the capsules was sealed by means of a two-component polymethylmethacrylate (PMMA) glue. After injection of the healing agent into the capsules by means of a syringe with a needle, the other end was also sealed with PMMA.

2.3. Concrete

A fly ash containing concrete mixture with a water to binder ratio (W/B) of 0.41 and a fly ash to binder ratio (FA/B) of 0.15 was used. The mixture was designed to be a representative reference mixture for concrete in exposure class XS2, i.e., reinforced concrete which is submerged and susceptible to corrosion initiated by chloride ions. The concrete composition is shown in Table 1.
To prepare the concrete batches the following mix procedure was used. Sand, aggregates, cement (CEM I 52.5 N), and fly ash were brought together into the mixer and mixed for one minute. Subsequently, water was added while mixing was continued for another 2 min. Then, superplasticizer (MasterGlenium®51, Master Builders Solutions, Ham, Belgium) was added and the mixture was mixed for another two minutes. Immediately after mixing each batch, a slump test and a flow test were performed according to the prescriptions of the standards EN 12350-2 [22] and EN 12350-5 [23], respectively, to determine the workability of the mixture. Subsequently, the density of the fresh mixture was determined according to the standard EN 12350-7 [24]. Finally, next to the samples used for corrosion monitoring (see Section 3.1), three concrete cubes (150 mm × 150 mm × 150 mm) were produced for every batch of concrete to determine the compressive strength according to the standard EN 12390-1 [25]. The latter samples were stored in an air-conditioned room at a temperature of 20 °C and a relative humidity of more than 90% for a time frame of 24 h. After demoulding, the specimens were placed in the same air-conditioned room for 27 days. In total, two batches of concrete were made to prepare all samples. Table 2 gives an overview of the properties of each batch.

3. Methods

3.1. Preparation of Concrete Samples

Reinforced concrete beams with dimensions of 120 mm × 120 mm × 500 mm were made. As in a later stage a crack was created in the middle of the beams (see Section 3.2), a triangular plastic strip with a height of 3 mm was provided at the bottom of the moulds to create a notch. The steel reinforcement (BE500S) inside the beams consisted of two parts: two reinforcement cages, one at each side of the beams, and a central rebar, respectively serving as cathode and anode in the corrosion process. The reinforcement cages were made out of four longitudinal rebars (Ø 8 mm, length 160 mm) welded to five stirrups (Ø 6 mm, 80 mm × 80 mm). The intermediate distance between the stirrups amounted to 36 mm. The centrally located steel bar (Ø 10 mm) had a total length of 250 mm. Both ends of this rebar were coated with two layers of cement paste (water to cement ratio (W/C) of 0.4), to prevent crevice corrosion, and two layers of epoxy coating (SikaCor 277, Sika Belgium nv, Nazareth, Belgium). This way, only the central part of the rebar, with a length of 50 mm, was exposed to the surrounding concrete and could act as anode. The central rebar was accurately positioned by attaching it to the reinforcement cages with plastic straps. The anode and cathode were electrically separated from each other and were both electrically connected to the exterior using an insulated copper wire (red wire for anode and blue wire for cathode in Figure 1). To enable both reinforcement cages to act as a cathode, they were electrically connected to each other through insulated copper wires (green wire in Figure 1). The electrical connections between the steel reinforcement and the copper wires were made by point welding a copper screw to the reinforcement and connecting the copper wire to the screw by means of a cable shoe locked in between two brass nuts. Subsequently, all copper wire connections were coated with epoxy resin (SikaCor 277, Sika Belgium nv, Nazareth, Belgium) to avoid galvanic corrosion. Next to the steel reinforcement, four glass fibre reinforced polymer bars (AslanTM 100, Fortius, Diest, Belgium) were positioned inside the beams. These were needed as structural reinforcement to prevent brittle failure of the beams during crack creation. They had a diameter of 6 mm and a length of 460 mm. The glass fibre reinforcement bars were connected to the steel reinforcement cages with steel wires. An internal Mn/MnO2 reference electrode (ERE 20, Force Technology, Brondby, Denmark) was provided inside each concrete beam. The reference electrode was fixed at the central anodic rebar, close to the crack by means of straps. The sample configuration (Figure 1) is based on the configuration used by Hiemer at al. [26,27] and Keβler et al. [28] and was also used in previous research to evaluate the corrosion behaviour of concrete in which cracks were healed autonomously by encapsulated polyurethane [16].
In case beams were provided with self-healing properties, two layers of six capsules each, filled with WRA, were positioned at mid-span of the concrete beam. One layer of capsules was placed above the anodic rebar, while the other one was placed below the rebar, with a distance to the test surface (upper surface) of the beams of 14 mm and 44 mm, respectively. The capsules were glued on two thin nylon wires, assuring that the distance from the outer capsules to the sides of the moulds amounted to 10 mm and the distance between the capsules amounted to 20 mm. After preparation of the moulds, concrete was cast in two layers, each compacted by placing the moulds on a vibration table. After casting, samples were placed in an air-conditioned room (temperature 20 °C, relative humidity >90%). 24 h later, samples were demoulded and they were placed again in the aforementioned room until the age of 28 days. From 28 days onwards, the anodic and cathodic part of the steel reinforcement inside the concrete beams was connected with each other by means of the external copper wires.

3.2. Crack Creation

After a curing period of 28 days, all beams, except the beams from the uncracked test series (UNCR, see Section 3.3), were loaded in a three-point bending test to create a crack with a target width of about 500 µm. For every individual concrete beam, a three-point bending test frame was constructed (Figure 2A). This consisted of an UAP 200 profile with four through going threaded rods, creating two linear load positions made out of 30 mm square hollow profiles. The intermediate distance between the 30 mm square profiles amounted to 450 mm. In between the concrete beam and the UAP 200 profile, a steel roller with a diameter of 20 mm was positioned in order to obtain the three-point bending test configuration. Cracking was initiated by manually tightening the frames in which the beams were positioned while a portable microscope was used to investigate whether the intended crack width of 500 µm was already reached. Due to the presence of the triangular notch in the middle of the beams, it was expected that the crack would initiate from this position, and thus definitely cross the anodic steel reinforcement bar. However, it has to be mentioned that for some of the beams the formation of some additional cracks was noticed. These additional cracks were small transversal cracks, which were connected to the mean crack in or near the notch. After crack creation, all samples were stored in a climate room (temperature of 20 °C, relative humidity 60%). During the complete test campaign, the concrete beams remained loaded in these test frames to keep the crack open at the same crack width during testing.

3.3. Crack Healing

The efficiency of different healing mechanisms to prevent reinforcement corrosion was investigated in this study. The first method that was tested was manual crack healing by injection of the WRA into the crack by means of a syringe with a needle. In order to prevent leakage of the healing agent on the test surface, the zone around the crack was taped before injection of the healing agent. Another healing mechanism that was tested was spraying (two layers) of WRA on the entire test surface of the beams, either before or after crack creation. The last method that was tested was autonomous crack healing, making use of embedded capsules filled with WRA. For these samples, crack creation caused the embedded capsules to break, thus the WRA was autonomously released into the crack. Capsule breakage could be noticed by a popping sound during crack creation.
In Table 3, an overview is given of the different test series that were investigated in this study. For each test series, three replicates were prepared (except for the CR series, which consisted of four replicates).

3.4. Crack Width Measurement

The crack width of the concrete beams was measured microscopically using a stereomicroscope (Leica 8 APO with DFC 2956 camera). Five microscopic images were taken along the length of the crack. The crack width was then measured three times on each image using the software program ImageJ. For each beam, the average crack width was calculated, which then represented the crack width of each test sample. The crack width of all beams was measured three times, once before starting the wet-dry cycles, once after seven weeks of exposure and once when finishing the wet-dry cycles. While measuring the crack width, the samples always remained inside the three-point bending load frames.

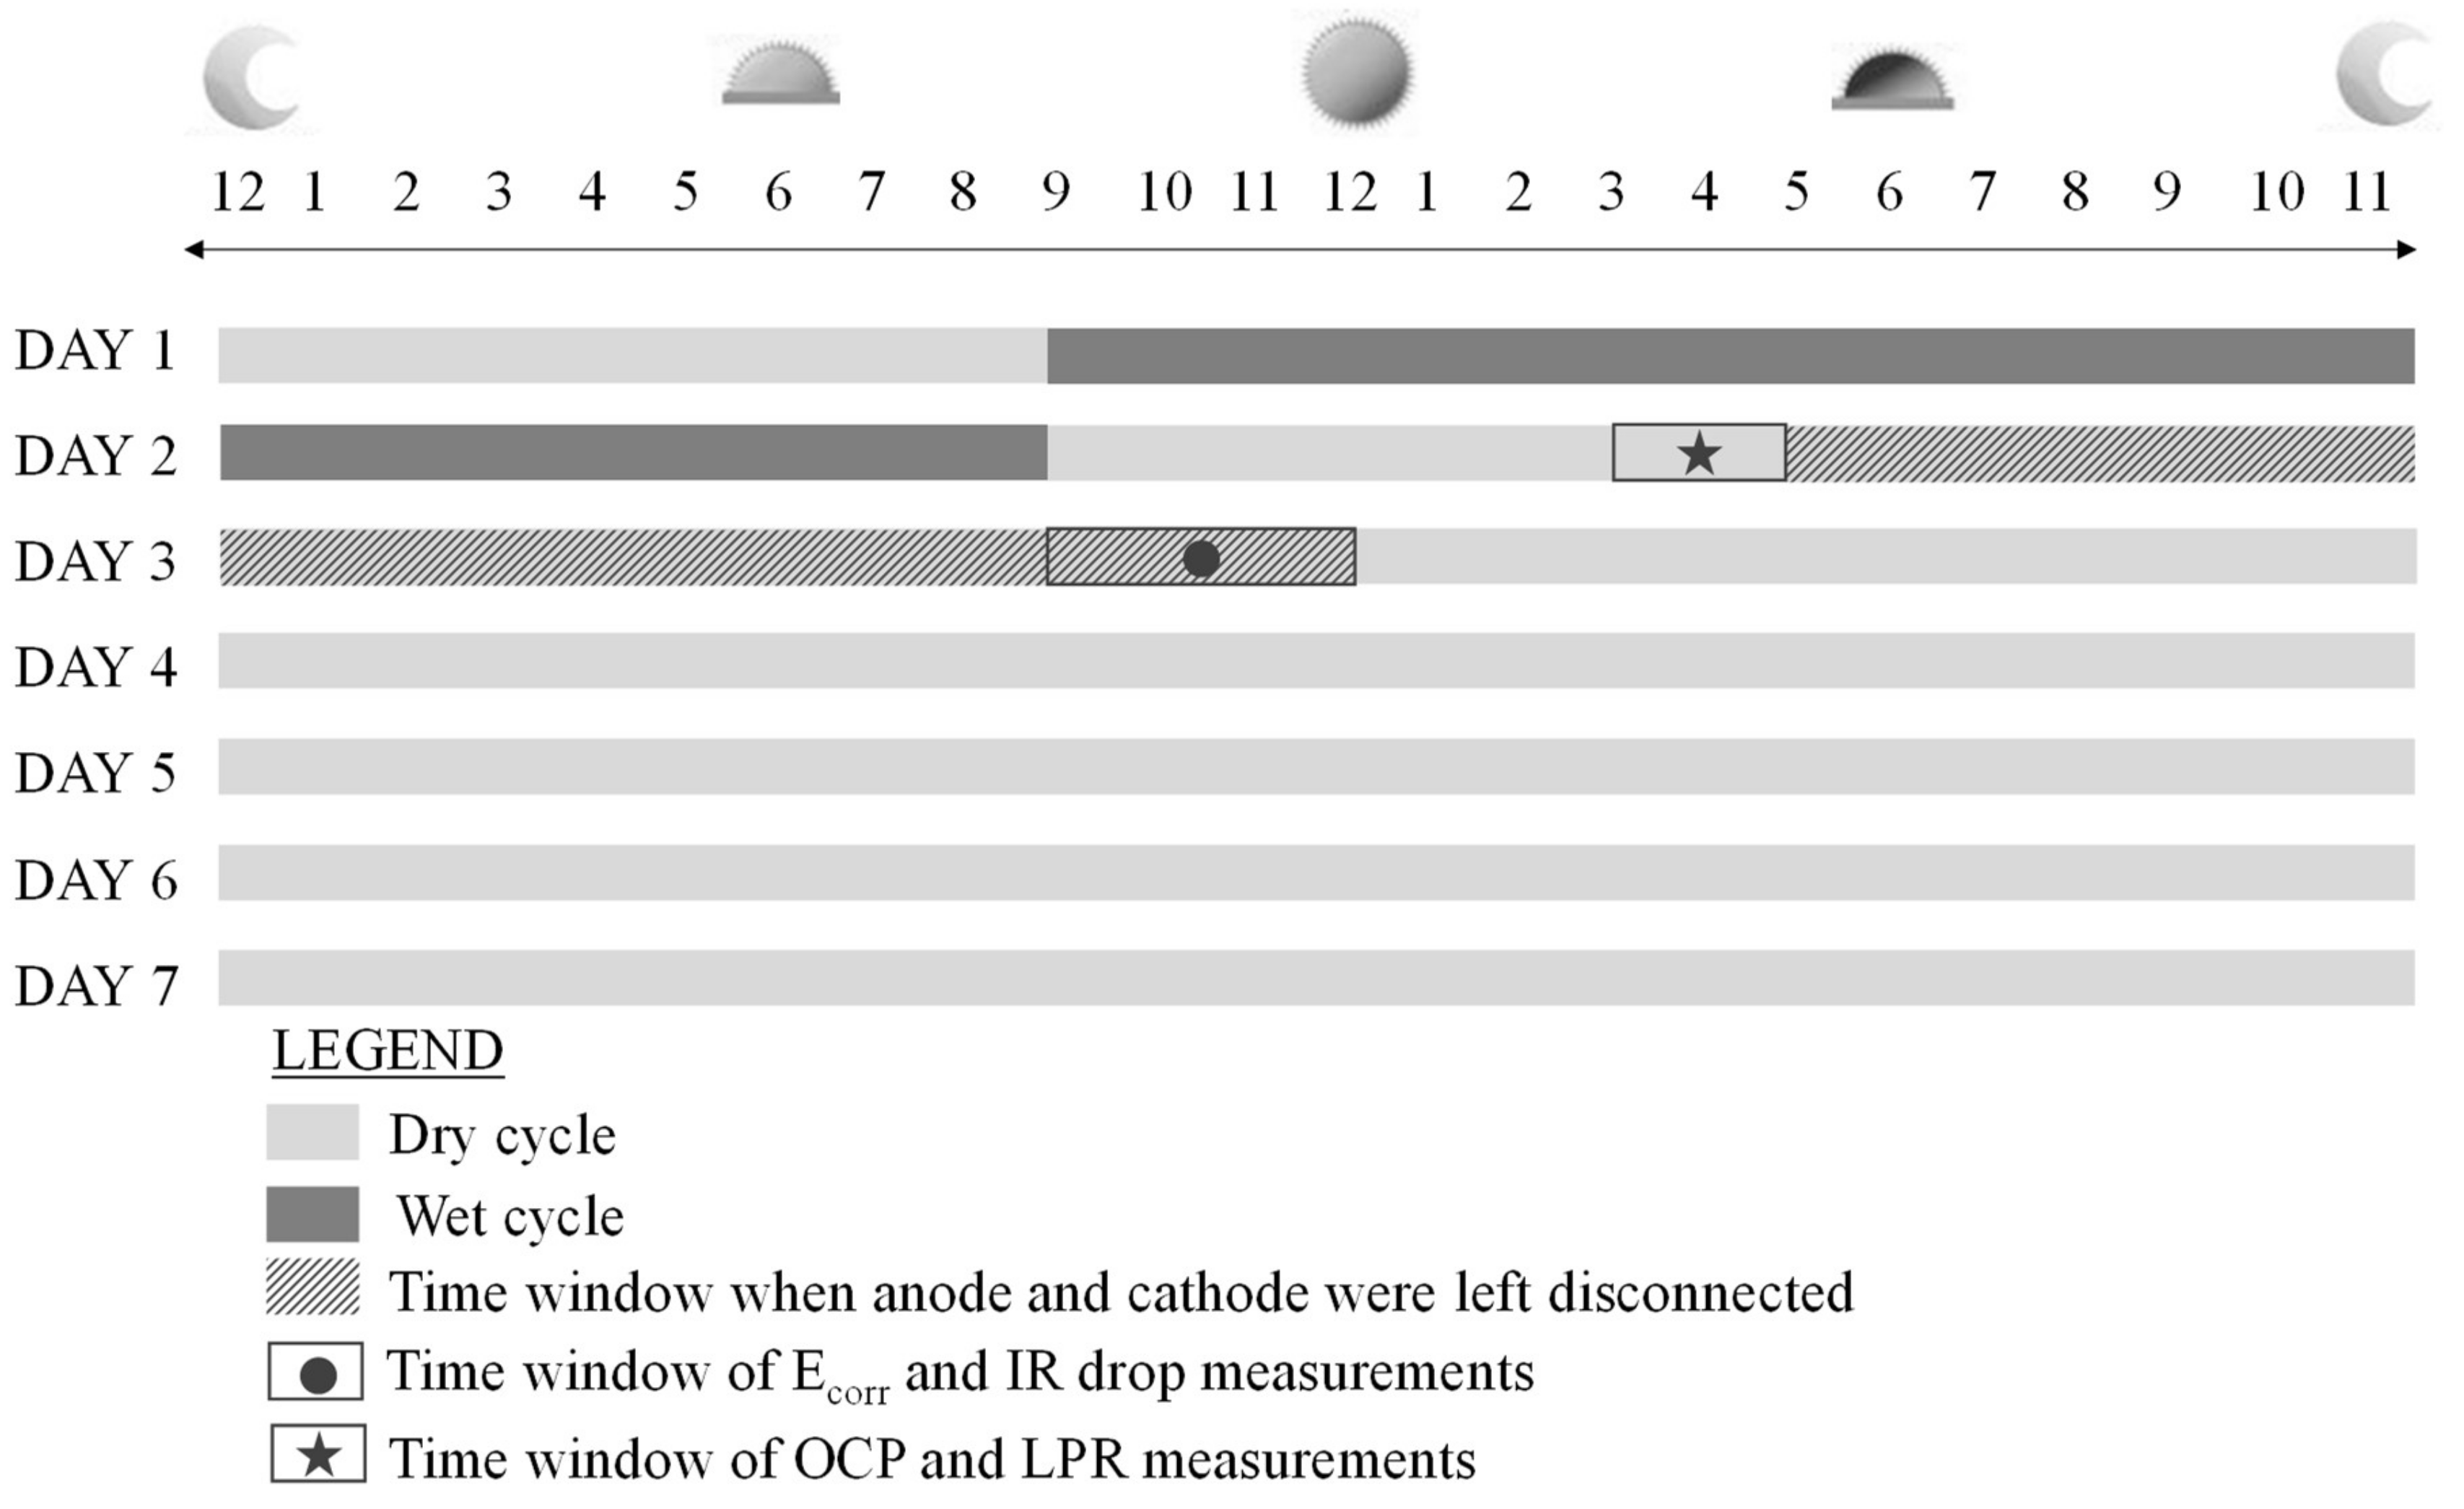
3.5. Cyclic Exposure Regime

Before mounting the samples in the three-point bending test frame, all sides of the beams, except the test surface, being the upper surface containing the notch, and the bottom surface were covered with aluminium butyl tape. In this way, only the bottom and upper surface of the beams were directly exposed to the environment (a temperature of 20 °C and a relative humidity of 60%). By the use of this tape, a reservoir was made on top of the beams (cracked side). This reservoir was divided into three compartments by the use of two PVC plates (Figure 2B). The central compartment had dimensions of 100 mm × 120 mm and the dimensions of the two outer compartments amounted to 150 mm × 120 mm. All edges of the reservoirs were sealed with silicone, to ensure liquid tightness. The beams were subjected to a cyclic exposure of chloride solution (1 day wet and 6 days dry) for a period of 135 weeks. During the wet period, the central compartment (i.e., region of the beam above the anodic rebar) was filled up to a height of 20 mm with a NaCl solution with a concentration of 33 g/L in order to simulate a chloride containing environment in the cracked region of the prisms. The side compartments (i.e., regions of beam above the cathodic reinforcement cages) were filled up to a height of 20 mm with Ca(OH)2 solution with a concentration of 1.15 g/L, in order to obtain an even moisture distribution in the concrete beams and simultaneously prevent dissolution of Ca(OH)2 and depassivation of the cathodic reinforcement cages.

3.6. Corrosion Monitoring

Before onset of the cyclic exposure regime, the below discussed electrochemical parameters, were measured once before crack creation (uncracked state; week-1) and once after crack creation (cracked state; week 0). Subsequently, during the cyclic exposure, electrochemical measurements were performed at different time intervals. During the first 12 weeks of exposure, electrochemical corrosion measurements were performed on a weekly basis. From then onwards, until week 100 of the exposure period, electrochemical measurements were performed every 12–16 weeks. The last measurement, after a total of 135 exposure cycles, was performed with a time gap in between the last and the previous measurement of 36 weeks.

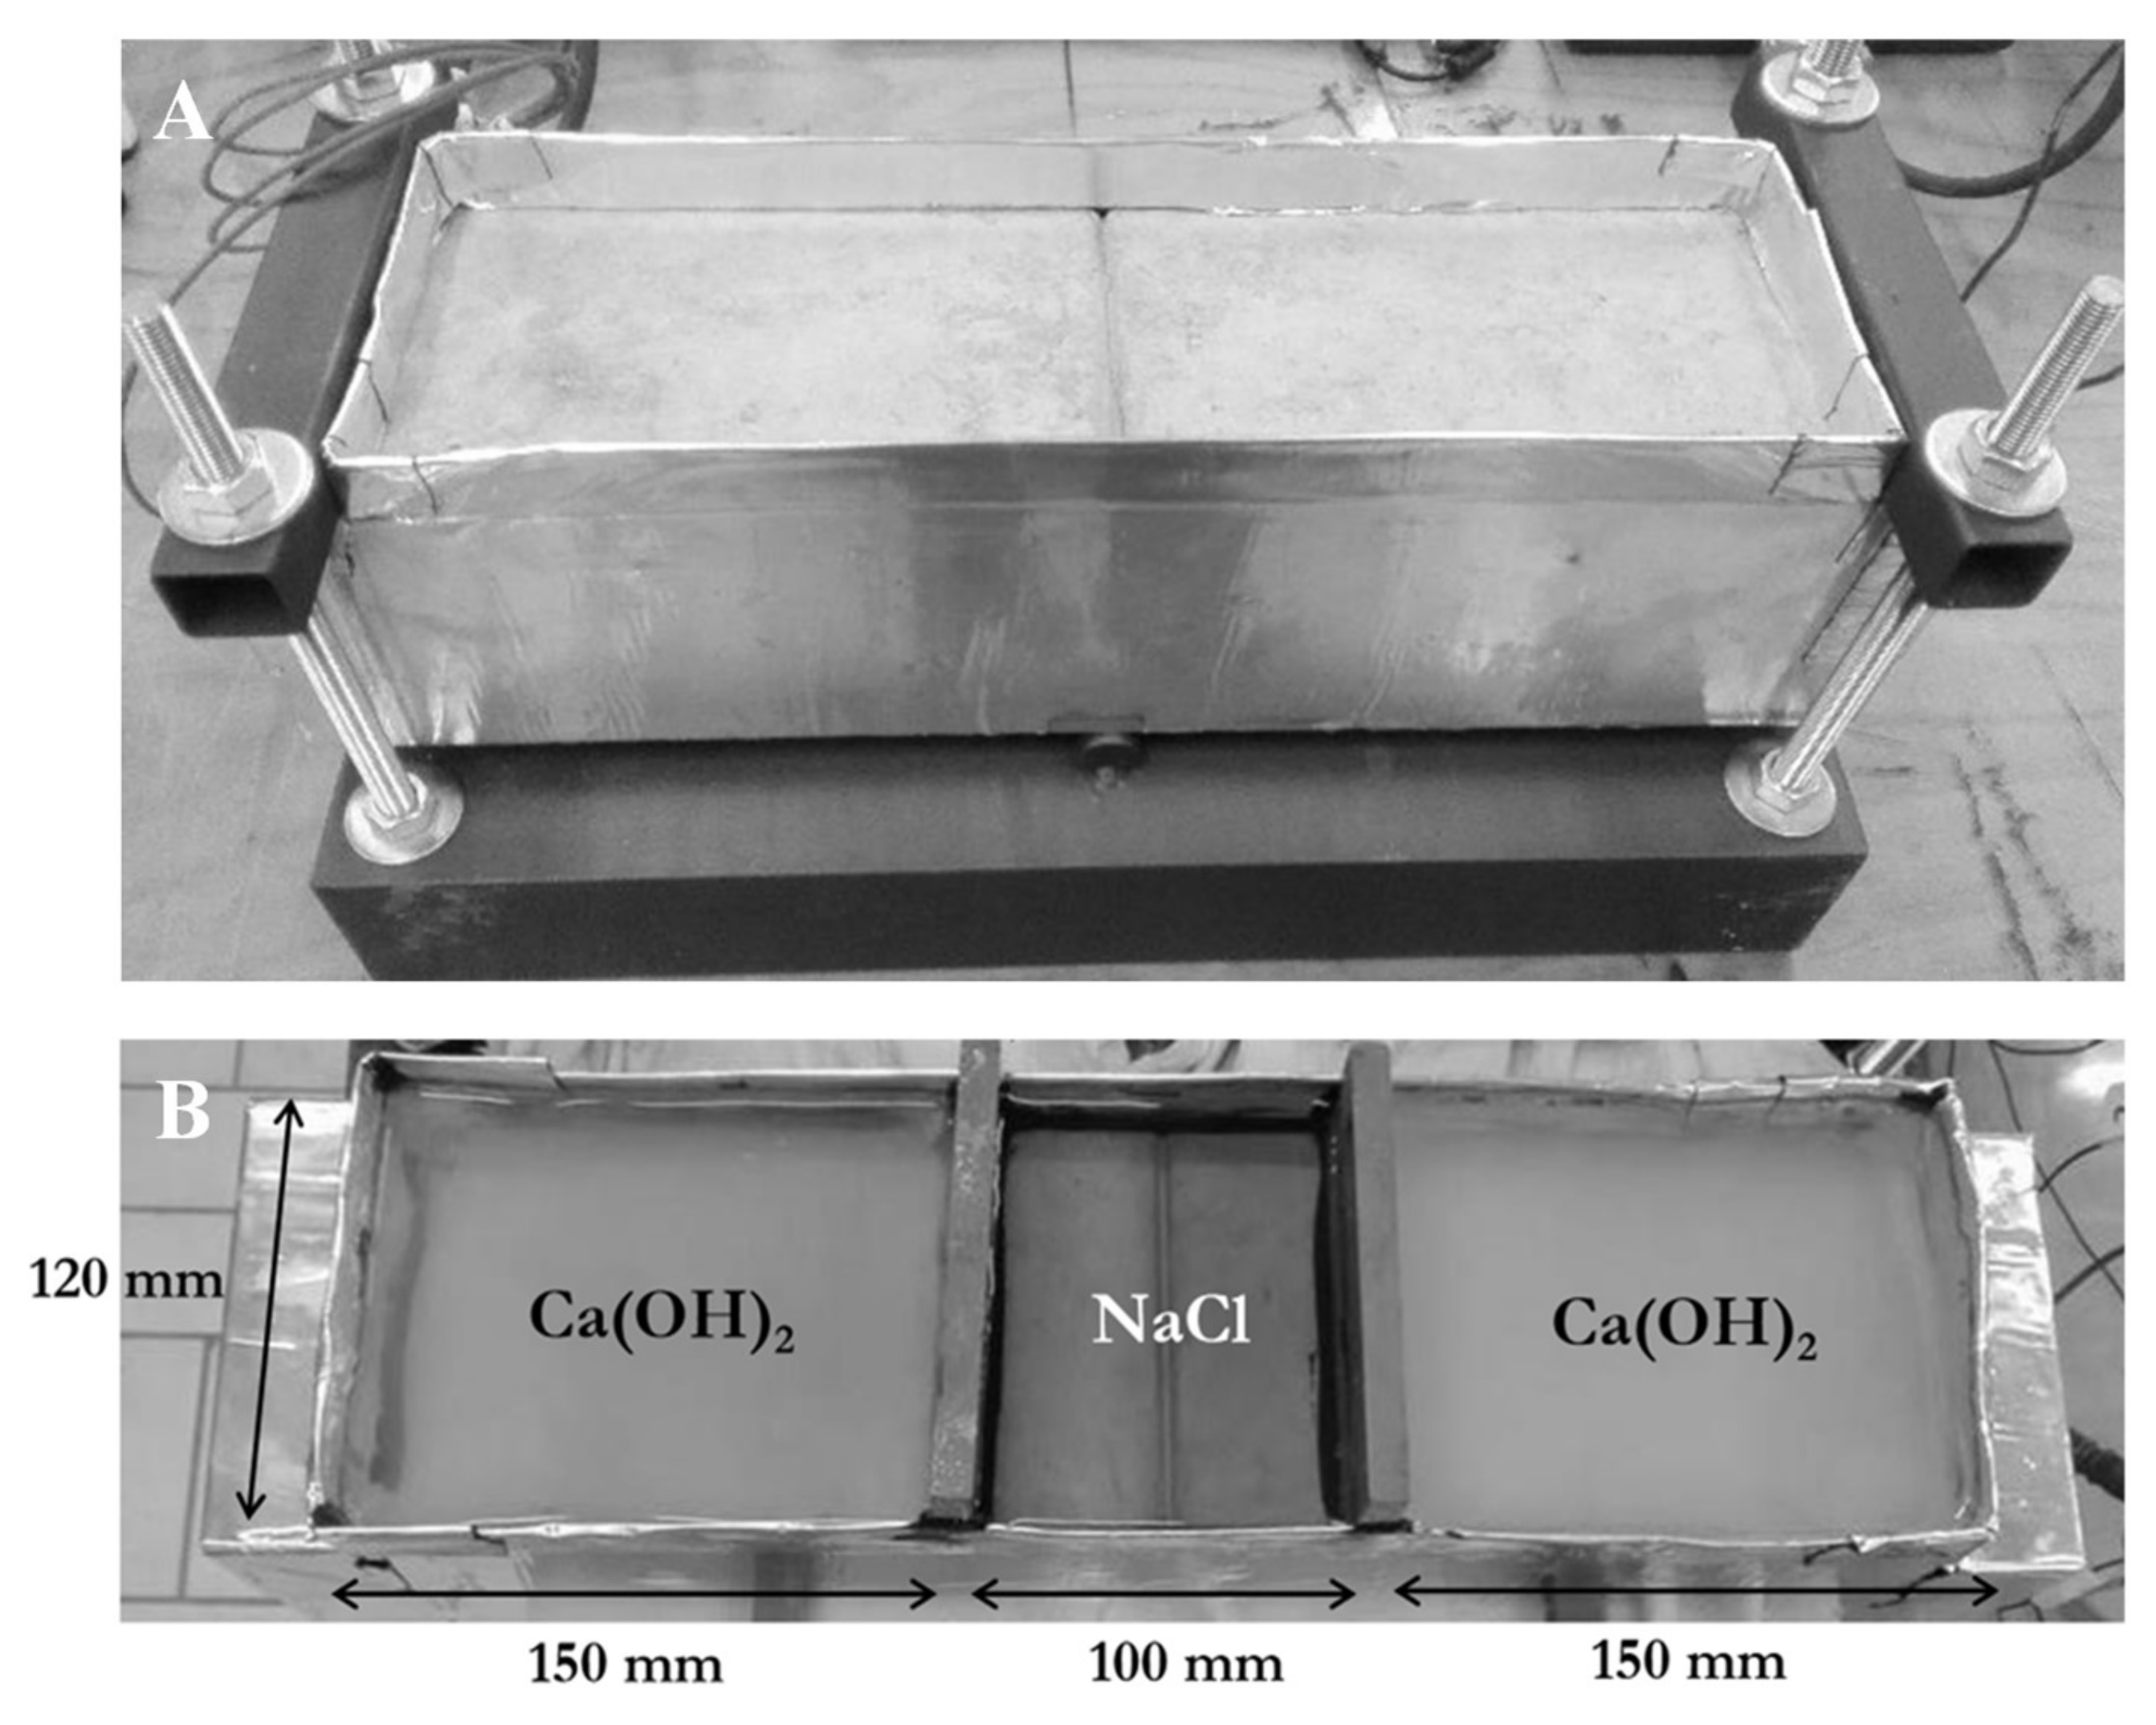
3.6.1. Measurement of the Macro-Cell Corrosion Current

The first characteristic that was measured was the macro-cell corrosion current (Imacro). This parameter was measured automatically using a multiplexer switch module (National Instruments; PXI-2527), to which the external connection wires of the anode and the cathode of every tested beam were constantly connected. With a 30 min time interval, a low resistance amperemeter (National Instruments; PXIe-4081) was automatically placed in the anode-cathode circuit to measure the macro-cell corrosion current. When connected to the current monitoring system, Imacro was measured approximately every hour (measurements of all beams took about 30 min and also a 30 min time interval was foreseen between two subsequent measurement rounds). Only to perform the other electrochemical measurements (see Section 3.6.2 and Figure 3), the anode and cathode were disconnected from the data acquisition system.

3.6.2. Electrochemical Corrosion Measurements

Due to the electrical separation of anode and cathode within the concrete beams, the electrochemical corrosion characteristics of both anodic and cathodic partial reactions could be measured. The electrochemical measurements were performed with a potentiostat (Gamry Interface 1000E) using the internal Mn/MnO2 reference electrode in the beams. Measurements started about 6 h after the solutions were removed from the beams (see Figure 3) and were always performed in the same sequence, as described below with a time period of about 16 h in between the Ecorr and IR drop measurements on the one hand and the OCP and LPR measurements on the other hand. During all measurements, the reference cable of the potentiostats was always connected to the internal reference electrode of the concrete beams and the floating ground cell was connected to a Faraday shield. The first measured characteristic was the Ecorr of the steel (anodic and cathodic part connected together). This parameter was measured by connecting the interconnected anode and cathode to the working electrode and working sense of the potentiostats. The initial setup for the IR drop measurement was similar as for the Ecorr measurement. About 40 s after the start of the measurement, the anode and cathode were disconnected, leaving the anode still connected to the working electrode. This generated a drop in the corrosion potential curve, defined as the IR drop. After this measurement, the anode and cathode were left disconnected, in order to depolarize, for a time period of about 16 h (see Figure 3). The open circuit potential of the anode (OCPA) and the cathode (OCPC) were determined by measuring the voltage difference between the internal reference electrode and respectively the anode and cathode. Finally, the linear polarization resistance of the anode and cathode, respectively RP,A and RP,C, were determined. This polarization ranged from −20 mV to +20 mV versus OCP, at a scan rate of 0.125 mV/s. To measure the cathodic polarization resistance, an inox mesh was used as counter electrode. This mesh was placed on the concrete surface, close to the crack mouth, inside a wet cloth in order to make good electrical contact. The linear polarization resistance was defined as the slope of the tangent of the obtained curve at current E = Ecorr.

3.6.3. Determination of the Mass and Volume Loss of the Anode

The steel mass loss caused by the macro-cell corrosion reaction can be calculated from the measured macro-cell corrosion current using Faraday’s law (Equation (1)) [18].
m = Q . M F . z
where m is the liberated mass of iron (g), Q is the total electric charge that passed through the iron (C, could be calculated by taking the integral of the measured current over time), M is the molar mass of iron (=55.845 g/mol), F is the Farday constant (=96,485 C/mol), and z is the valency number of ions (=2 for the oxidation reaction of iron).
The steel volume loss can subsequently be calculated taking into account the density of the reinforcement steel (0.00785 g/mm3).

3.7. Determination of the Chloride Profile

3.7.1. Chloride Concentration Determined by Potentiometric Titration

After the corrosion monitoring period, the chloride ingress in the cracked area of the concrete beams was determined by means of chloride profile grinding and subsequent potentiometric titration. This profile was defined for one sample per test series. Grinding was performed with a diamond coated drilling head having a diameter of 8 mm and being installed on a column drill. By the use of this setup, material was ground from the crack surface in a zone next to the anodic rebar and with dimensions of 10 mm × 30 mm (Figure 1). In each zone, 10 progressive layers with a thickness of 4 mm were ground parallel to the crack surface up to a total distance of 40 mm from the top surface of the sample.
After grinding and collecting the powders, the total chloride content of each layer was determined. First, powders were dried in an oven at 105 °C for at least seven days and then they were left to cool down to room temperature. After the acid-soluble extraction in a nitric acid (HNO3) solution, the potentiometric titration was carried out with a Metrohm 862 Compact Titrosampler automatic titrator.

3.7.2. Visual Evaluation by Spraying Silver Nitrate Solution

After obtaining the required powders, the beam ends, with a length of 50 mm, were sawn off to visualize the exact position of the longitudinal reinforcement (both the glass fiber reinforcement and the longitudinal steel reinforcement of the cathodic cages). Subsequently, a saw cut with a length of 150 mm was provided in longitudinal direction in between the anodic rebar and the longitudinal reinforcement for both remaining beam ends. This saw cut was made as close as possible to the visible longitudinal reinforcement to guarantee that the anodic rebar was not damaged. This procedure assured that the stirrups were cut through. On the remaining samples, a splitting test with a load plane perpendicular to the crack plane was performed to create a fracture plane orthogonal to the crack. The fracture plane of both sample halves was then sprayed with 0.1 M silver nitrate solution. The chloride penetration front could finally be measured from the visible white silver chloride precipitation (see Figure 4). The discoloration boundary, representing the front, was indicated with a marker about two hours after application of the spray. Afterwards, a ruler was placed on top of the split surface and the depth of the chloride front was measured from the exposure surface every 5 mm from the crack position towards both sample ends.

3.8. Visual Inspection of the (Corroded) Reinforcement Bars

3.8.1. Visual Inspection through Photography

Once the chloride ingress was visualized on both sample halves by spraying silver nitrate, the anodic rebar was taken out of the samples by crushing the remaining concrete around. Subsequently, these rebars were cleaned in a chemical cleaning solution (HCl:H2O = 1:1 + 3 g/L urotropine) [16] for 24 h in order to remove all corrosion products and residual concrete pieces left on the rebars. Subsequently, all rebars were visually inspected and photographs were taken to investigate possible pitting of the rebars due to chloride induced corrosion.

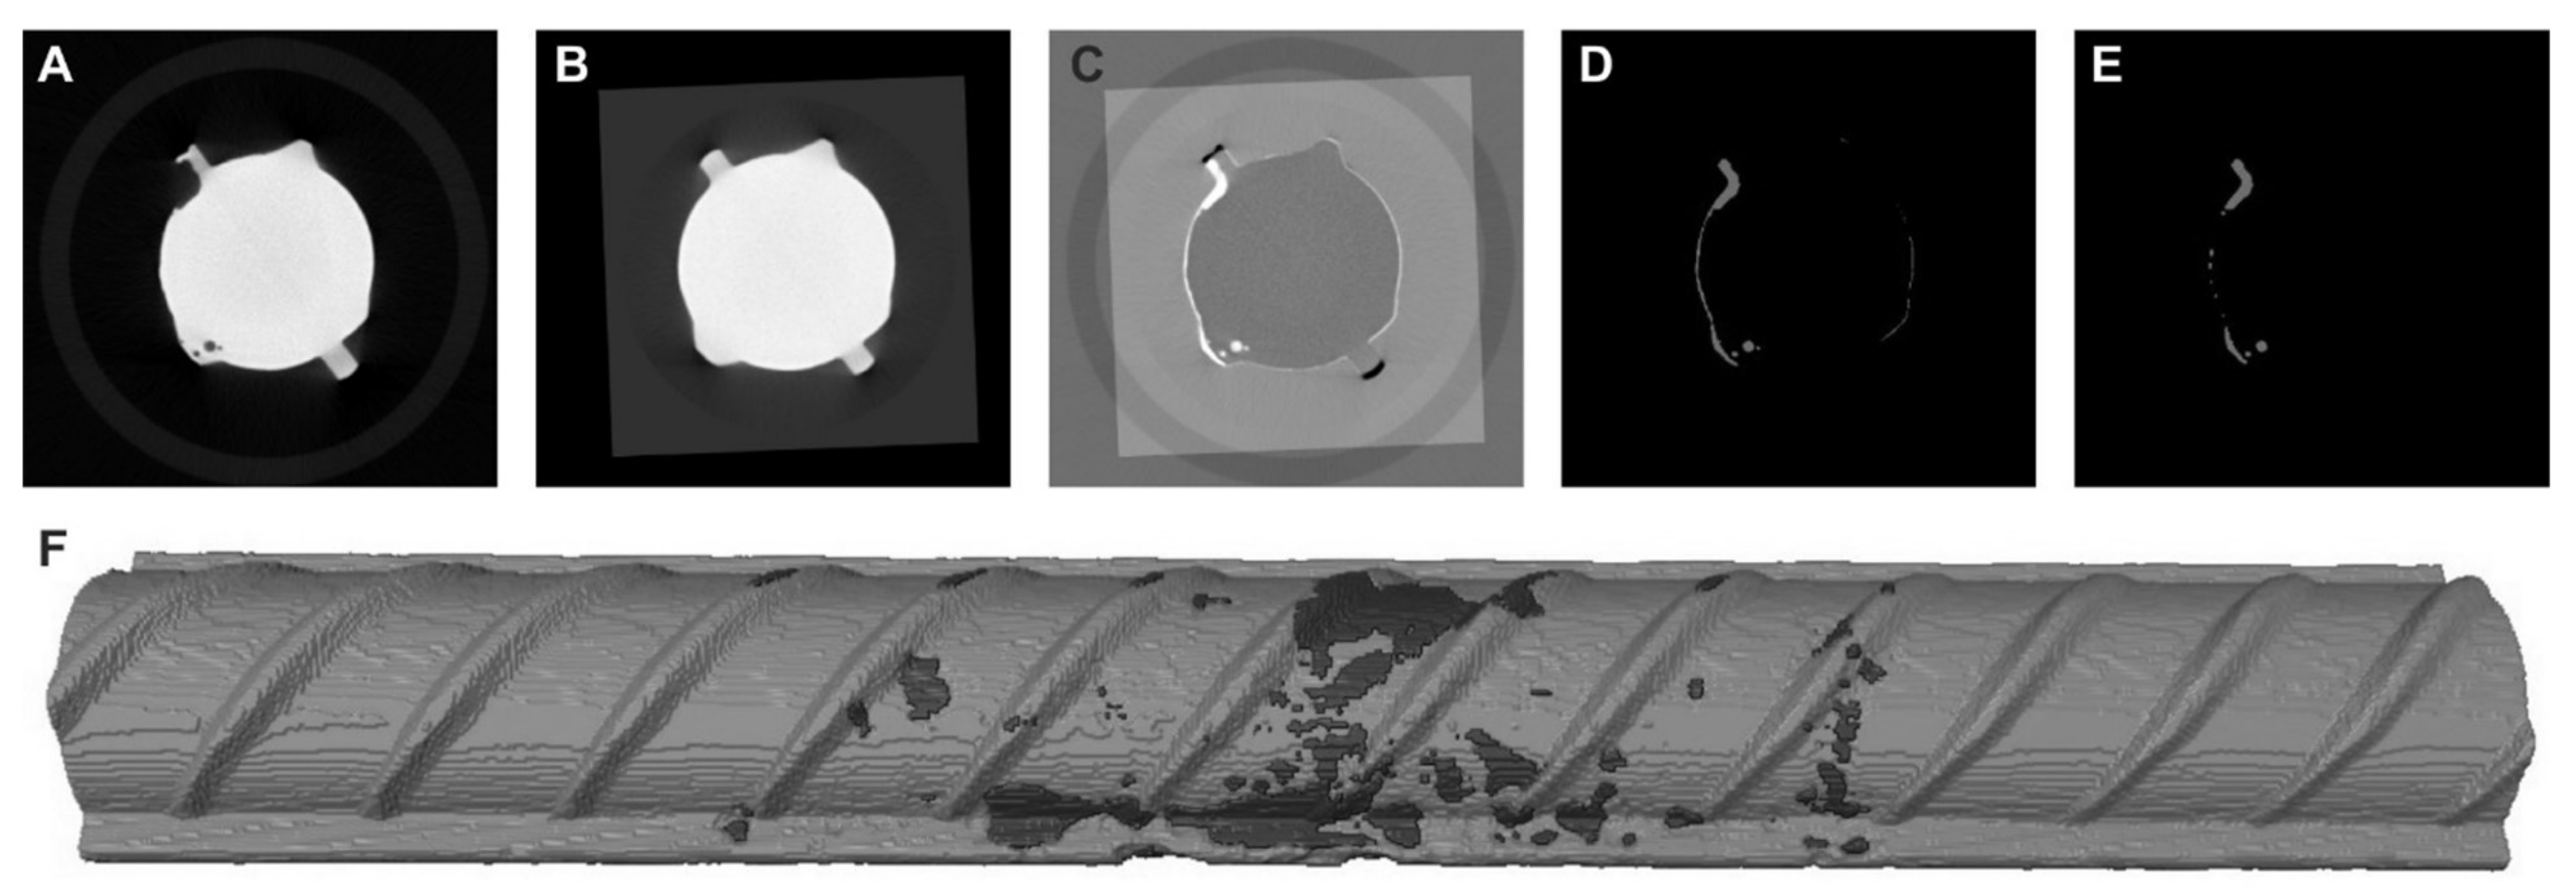
3.8.2. X-ray Computed Microtomography Acquisition, Analysis and Visualization

In this part of the study, the steel mass loss of the reinforcement bars due to corrosion was defined through the use of X-ray µCT measurements, as from previous studies [29,30] it was concluded that there is a good correlation between the steel mass loss defined by weighing and by X-ray µCT. X-ray µCT acquisitions of all anodic rebars were obtained before and after the corrosion tests (once before the anodic rebars were cast in the concrete beams and a second time about 2.5 years later, after the corrosion testing, when the anodic rebars were removed from the beams again) with the HECTOR device [31] of the Ghent University Center for Tomography (UGCT), resulting in a reference and corroded dataset, respectively. The HECTOR scanner is optimized for the use of high energies to generate the X-rays, which is necessary to penetrate steel or dense objects. In this case, the X-ray tube was operated at 200 keV and 45 W. A single millimeter of copper was used to filter the low-energy X-rays from the X-ray beam. Over the full sample rotation, 801 radiographs were made with an exposure of 2 s each. The magnification of the object was 4.13 times, resulting in a voxel size of 48.3 µm. The radiographs were reconstructed into a 3D dataset with Octopus Reconstruction software [32]. A total of 18 steel rebars (3 samples for each of the 6 test series) were submitted to X-ray µCT inspection for this study, resulting in 2 times (scanning before and after corrosion) 18 X-ray µCT volumes.
The 3D datasets were subsequently analysed to quantify the volume of steel that had corroded from the rebar. The reference and corroded datasets for each individual rebar needed to be processed through image registration to overcome differences in scanning positions. This was performed with the Dataviewer software (Bruker). After registration, differential imaging was applied [33] in which the corroded dataset (Figure 5A) is subtracted from the reference dataset (Figure 5B).
To quantify the differences in the X-ray µCT volume, the differential images (Figure 5C) were subsequently loaded into Avizo software (Thermofisher Scientific, Waltham, MA, USA) and the bright areas (i.e., the differences in the X-ray µCT volumes) were segmented (Figure 5D). Slight misregistration of the images resulted in oversegmentation along the rebars’ edges, which could be removed from the segmented data by an ‘opening’ binary operation (Figure 5E). The resulting segmented volume represents the total corroded volume, which was then quantified by the amount of segmented pixels and the voxel size. The 3D renders (Figure 5F) were also made with the Avizo software package.

3.9. Statistical Analysis

For each of the experiments, an ANOVA-test was performed to define whether or not the means of various groups were equal. First, homogeneity of variances was verified by means of a Levene’s test (p = 0.01). When equal variances were assumed, an S-N-K test (p = 0.05) was performed. For data with non-homogeneous variances, a Dunnett’s T3 test (p = 0.05) was used.

4. Results and Discussion

4.1. Crack Widths

Figure 6 shows that the initial crack width, measured before onset of the corrosion measurements, varied between 440 and 480 µm. It is noticed that the variation in crack width among the different test series remained limited which is of importance for this study. When the crack width measurements were repeated after 7 weeks, the obtained crack width still varied around the same mean value as the initial one with for some test series a somewhat decreased and for others a somewhat increased width. However, when the crack widths were measured once more at the moment the corrosion measurements were finished, it could be clearly seen that for all of the series the crack width did decrease and that final crack widths varied around 300 µm, but still remained similar for the different test series.

4.2. Corrosion Monitoring

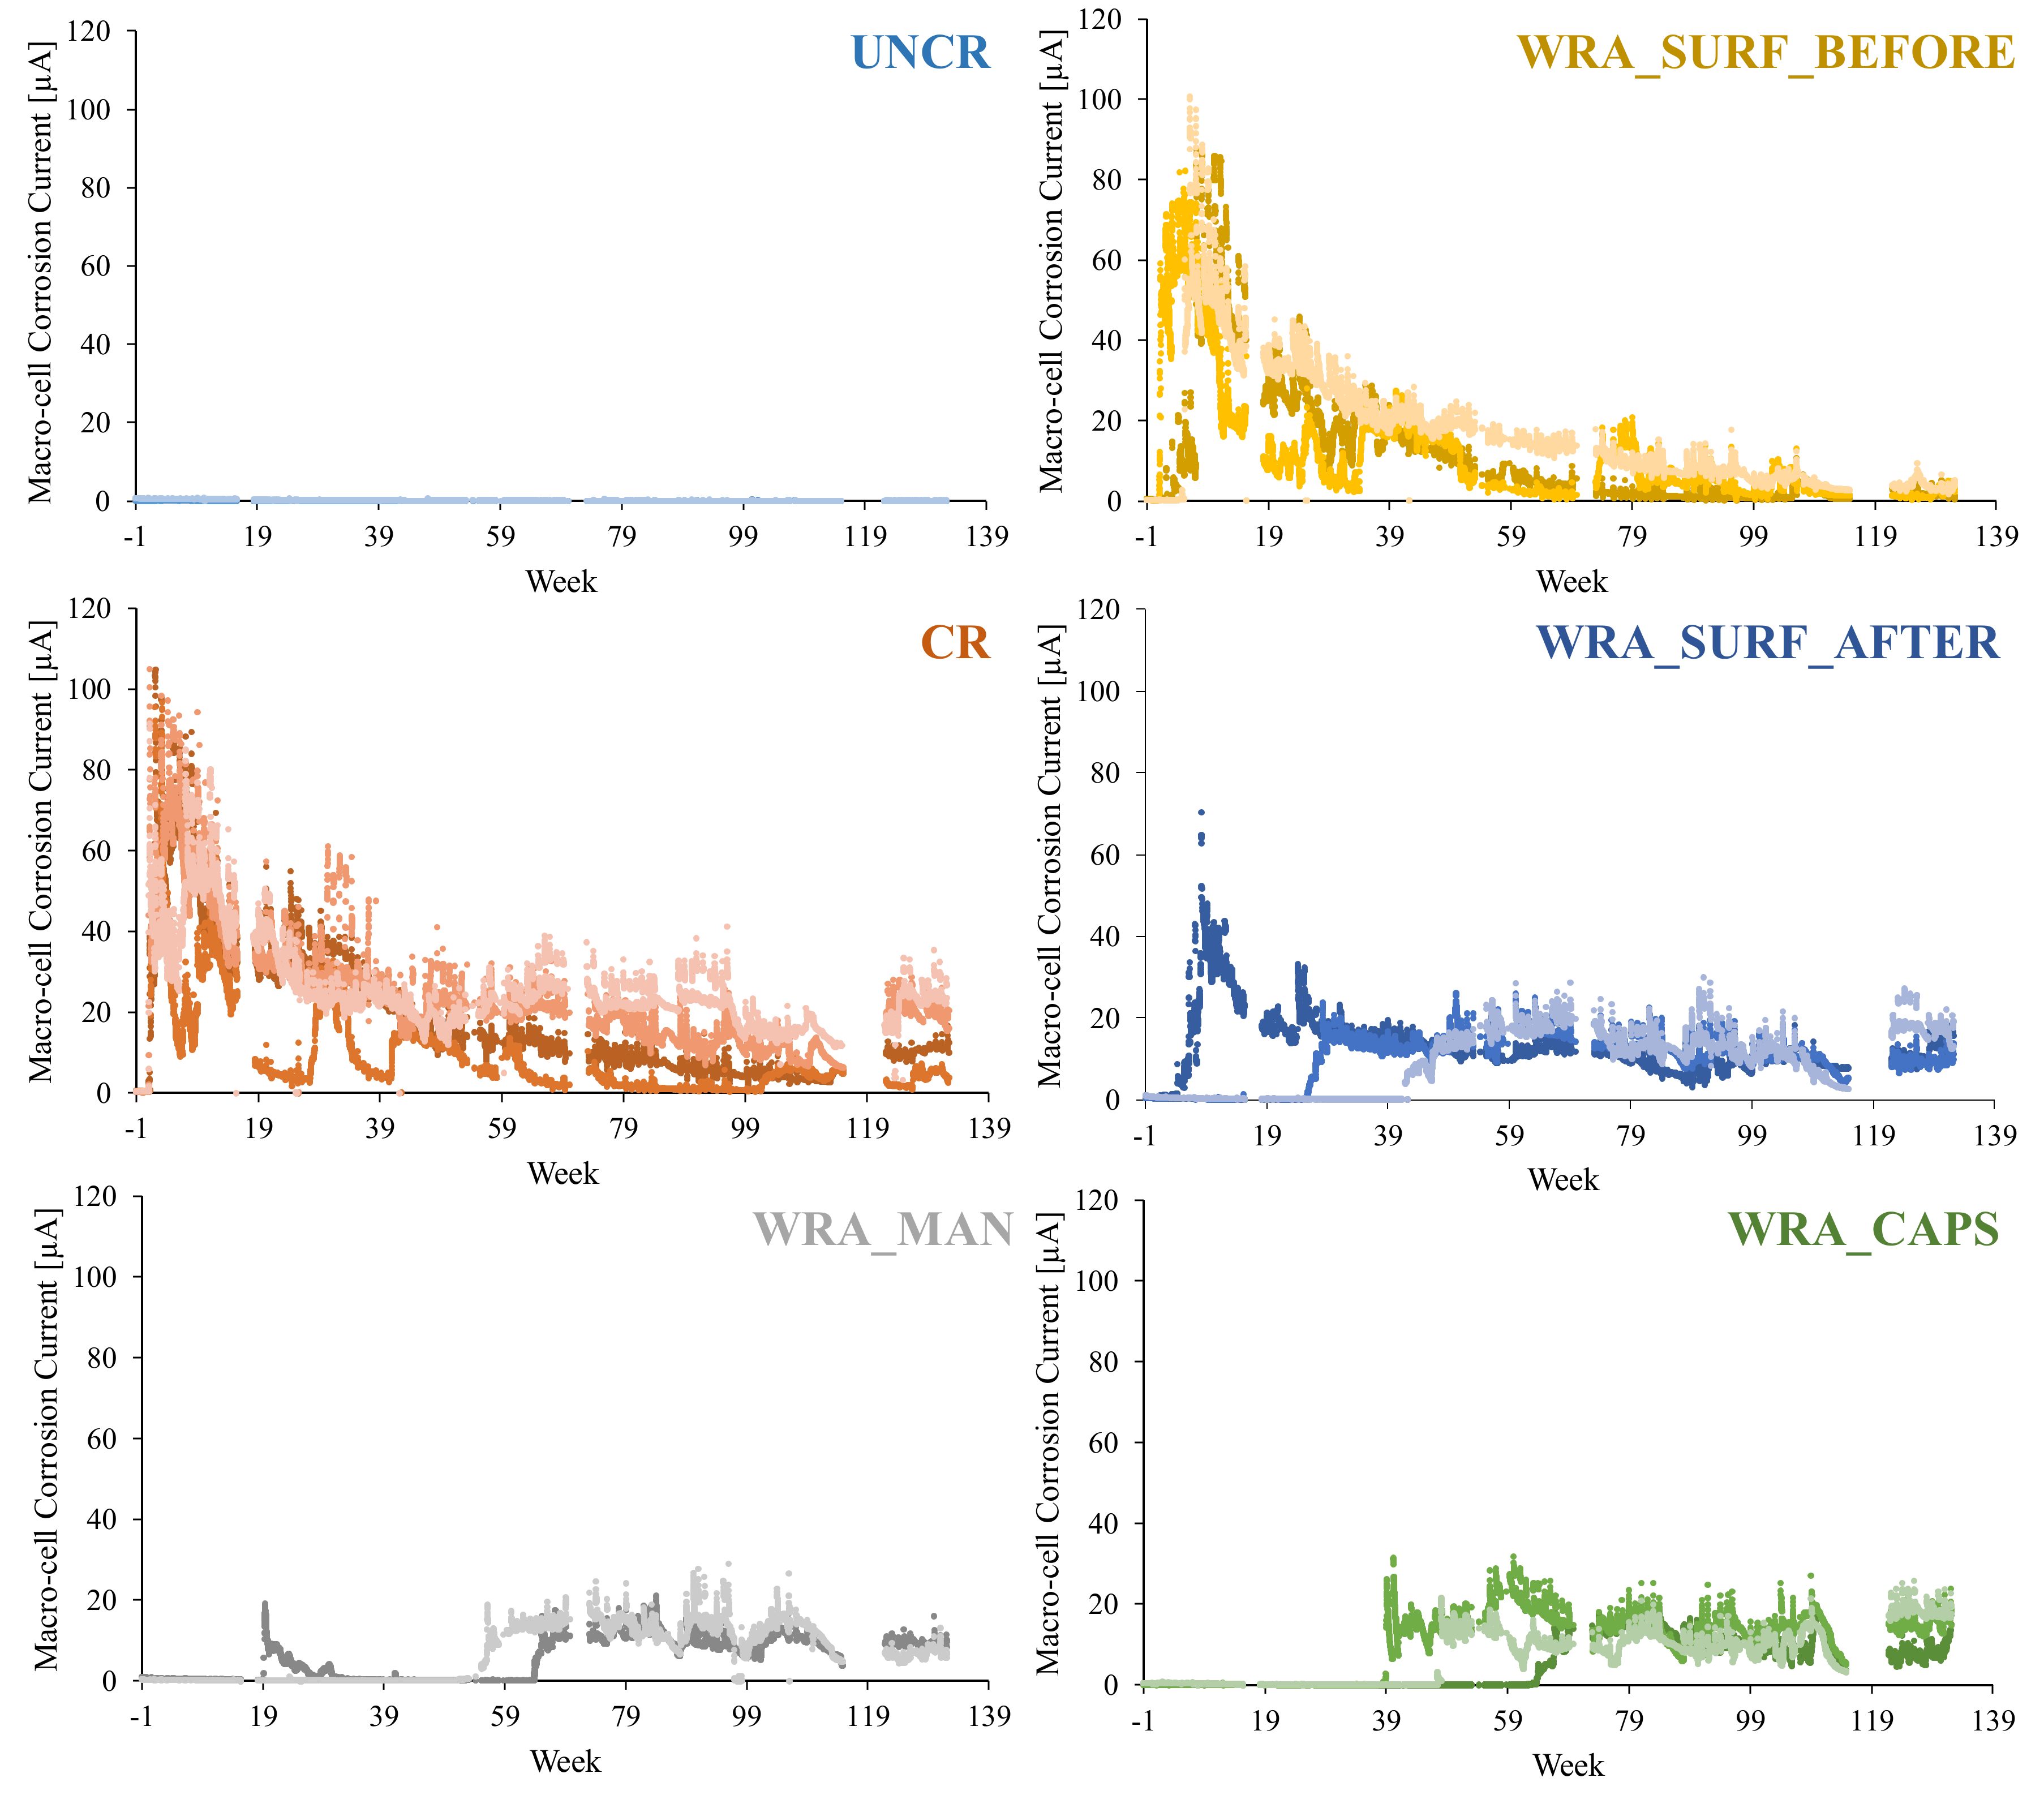
4.2.1. Measurement of the Macro-Cell Corrosion Current

As the current measured by the data acquisition system could be directly related to the rate of the macro-cell corrosion reaction, this value results in a direct quantification of the corrosion rate. Figure 7 shows that, for the uncracked samples, a nearly zero macro-cell corrosion current was measured for the whole exposure period, indicating that corrosion was not initiated in uncracked concrete. The presence of a crack led to a completely different corrosion behaviour compared to the uncracked series. From the moment that the chloride solution was poured onto the cracked samples, an immediate increase of the macro-cell corrosion current varying around 100 µA was noticed. This immediate rise in macro-cell corrosion current is a clear sign that corrosion initiates from the first exposure cycle onwards. After the first wetting cycle the macro-cell corrosion current decreased again during the dry cycle, and periodically increased every wet cycle. Next to this periodic increase and decrease, related to the wetting and drying cycles, the macro-cell corrosion current also showed a generally decreasing trend over time, evolving towards values ranging between 5 and 25 µA after 135 exposure cycles. This overall decrease in current can possibly be explained by the fact that corrosion products, precipitated near the location of the anode coinciding with the crack location, cause clogging of the crack as was also noted by Marcotte and Hansson [34]. These corrosion products may block the penetration of additional chlorides at that location, resulting in a decreasing current. Another possible cause for the decrease in current may be the increase in concrete resistivity over time. Similar as for the samples with untreated cracks, the samples for which a WRA was applied onto the surface before crack creation, showed an almost immediate increase in macro-cell corrosion current. While for one out of the three samples an increase was seen from the first exposure cycle onwards, a delay of four and six weeks was seen for the two other samples. The value of the macro-cell corrosion current immediately after initiation varied between 80 and 100 μA and the current tended towards 1 to 5 μA after 135 exposure cycles, showing a slightly reduced corrosion propagation compared to the samples with untreated cracks. The application of WRA onto the surface caused a very small delay in the onset of corrosion and slightly reduced the corrosion propagation, however, in general it could be stated that the application of a WRA on the surface before crack formation does not seem to be effective in order to completely prevent corrosion. This finding is in accordance with the results published by Dai et al. [20,21], where it was also clearly noticed that surface impregnation before crack creation seemed less effective to prevent reinforcement corrosion. Similar as reported by Dai et al. [20,21], also in this study, the efficiency improves when the WRA is applied onto the surface after crack creation. While for one out of the three samples a steep rise in macro-cell corrosion current is still seen in the first weeks of exposure to the chloride solution, week 5 to be exact, for the two remaining samples of that series corrosion initiation was only noticed after 26 and 42 weeks of cyclic chloride exposure. It was also noticed a slower corrosion propagation compared to the samples with untreated cracks, as the macro-cell corrosion current after initiation only varied between 25 and 70 μA, to evolve towards values ranging between 5 and 15 μA. An even further improvement of the situation is seen when the WRA is released inside the crack rather than being applied on the surface. It can be noticed that for the samples where the WRA was manually injected into the crack, up until 19 weeks of exposure, no signs of active corrosion were noticed. At week 19, for one sample, a sudden increase in the macro-cell corrosion was recorded; however, this value later decreased again towards zero to show a clear steep rise in current towards a value of 20 μA only after 64 weeks of chloride exposure. At that time also for the second sample of that test series, a macro-cell corrosion current of about 20 µA was measured starting from week 56 onwards. Autonomous release of the WRA from embedded capsules does seem to result in a similar efficiency as manual injection of the WRA into the crack. For the first 39–64 weeks of cyclic chloride exposure no signs of active corrosion could be noticed but after some time the WRA seems to partially lose its efficiency, similar as noticed for the manually injected cracks, and a steep rise in the macro-cell corrosion current was noticed. However, although corrosion initiated, the measured macro-cell corrosion current remained limited and values no higher than 20–30 μA were recorded, showing a reduced corrosion rate during propagation.

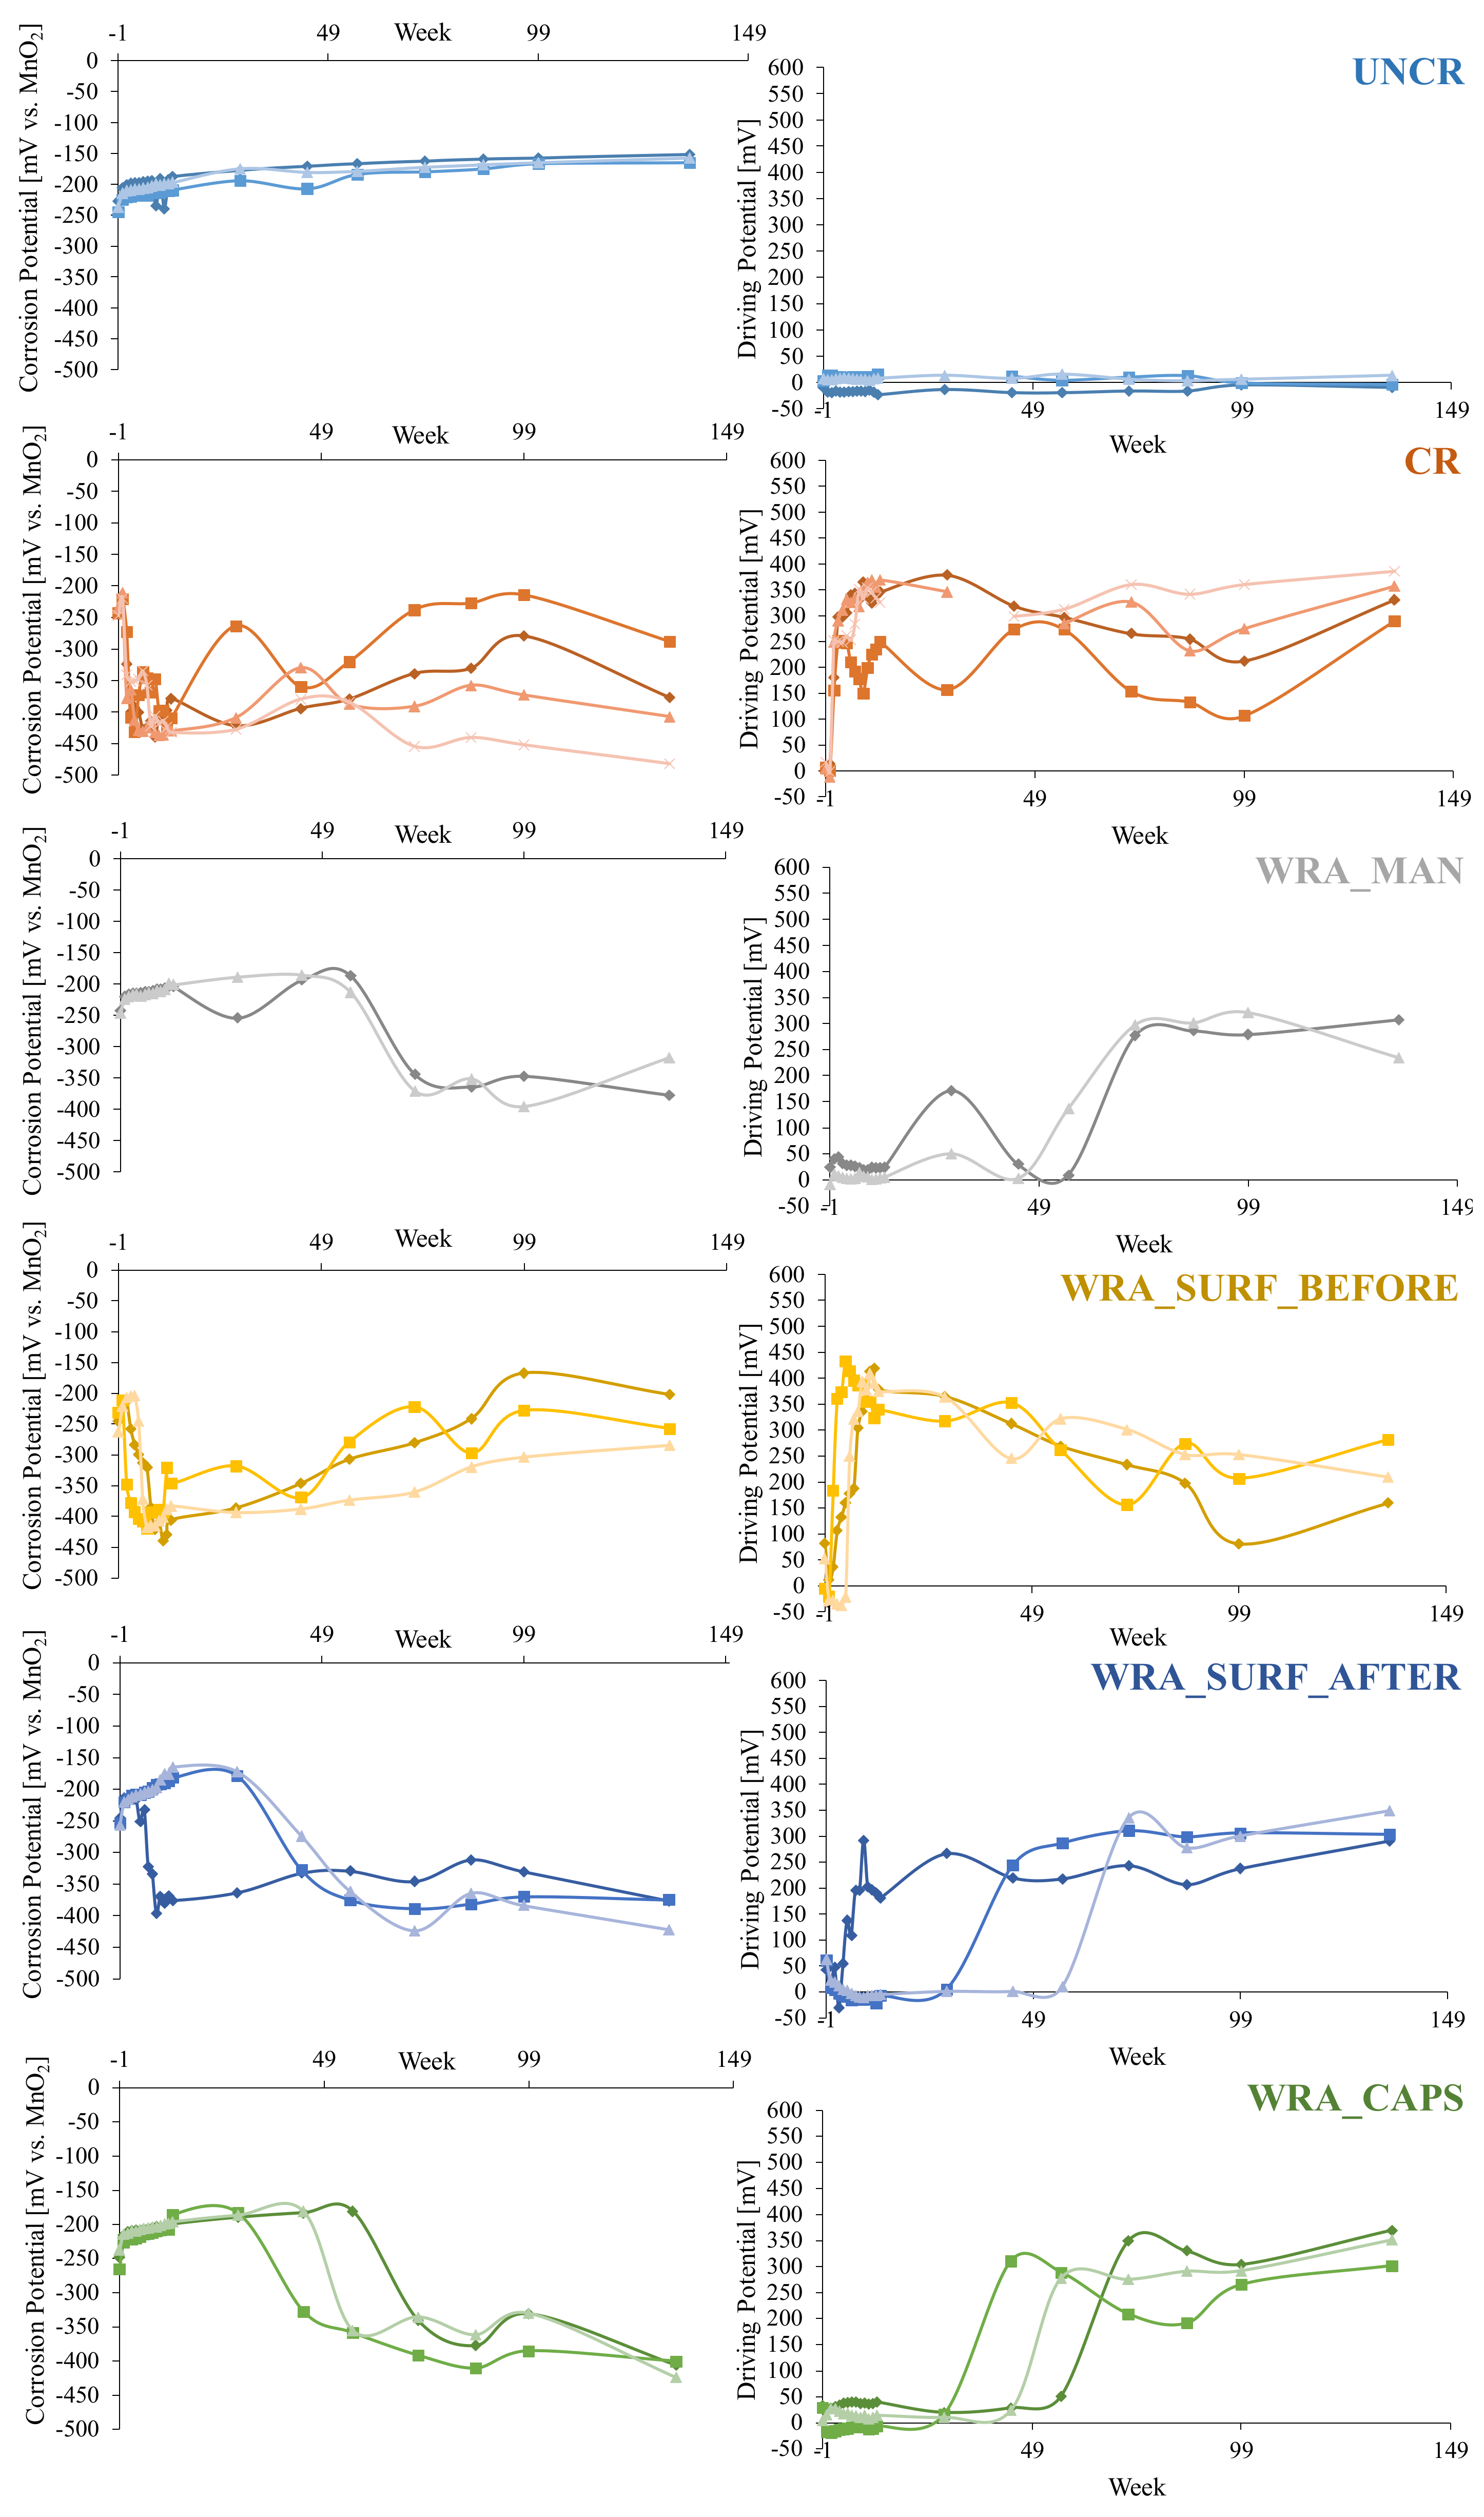
4.2.2. Electrochemical Corrosion Measurements

In case of active corrosion, the OCP value of the anode is expected to be more negative than the corrosion potential, due to the loss of electrons as a result of the anodic reaction. Since the corrosion potential is the potential at equilibrium between the anodic and cathodic reaction, the OCP value of the cathode should, contrary to the anode, be less negative than the corrosion potential. The difference between the two OCP values is defined as the driving potential (ΔE). A higher driving potential indicates a more active corrosion state of the rebar.
Both the corrosion potential and the driving potential are represented in Figure 8 (represented driving potential is corrected by the mean driving potential measured for the uncracked series). Similar findings as stated based on the macro-cell corrosion current measurements could be made. Only the uncracked samples showed no state of active corrosion during the whole exposure period. While the untreated cracked samples showed an immediate drop in the corrosion potential and increase in the driving potential and thus an immediate onset of corrosion, each of the crack treatment techniques caused a delay of the corrosion onset. However, when the WRA was applied onto the concrete surface before crack creation, this delay was marginal. When the WRA was applied onto the surface after crack creation for two out of the three samples, a clear delay in corrosion onset was noticed. However, a further improvement in efficiency was seen when the agent was released inside the crack. Samples for which the healing agent was manually injected into the crack or released via embedded capsules only showed a drop in the corrosion potential, which was accompanied by an increase in the driving potential, after about 50 weeks. While for the series WRA_MAN, WRA_SURF_AFTER, and WRA_CAPS, the corrosion and driving potential remain at a similar level after the sudden decrease and respective increase, it is clear that for the WRA_SURF_BEFORE series, the corrosion potential increases again over time and the driving potential gradually decreases again, showing that the corrosion rate decreases over time for this crack treatment technique, although it could not prevent almost immediate corrosion initiation. This decrease in corrosion rate over time was also noticed from the measured macro-cell corrosion current.
Comparable to the cracked series, for the test series where the WRA was applied onto the surface before crack creation, the value of the anodic polarization resistance already dropped below 2.7 kΩ from week 2 onwards. This finding confirms the active corrosion state of the rebars for this test series. When the surface was impregnated after the cracks were created, good sealing performances were obtained for two out of the three specimens for the first 28 weeks of exposure. However, for the third sample, a drop in anodic polarization resistance was seen already at week 8. A possible cause for this may be the incomplete penetration of WRA in the crack. For the two other samples, this drop was noticed after 28 and 44 weeks of exposure. Crack sealing by encapsulation of WRA resulted in an even higher initial polarization resistance of the anode compared to the value measured for the anode of the uncracked beams. For the uncracked series, an increase of 10 to 15 kΩ was found before the start of the wet/dry cycles, while for the test series with encapsulated WRA this increase amounted to 15 to 25 kΩ. Thus, an even better resistance against corrosion occurred with this healing mechanism. In addition, all three beams of the WRA_CAPS test series also showed a slightly increasing anodic polarisation resistance. However, between week 28 and week 56, a sudden drop in anodic polarization resistance occurred. This shows that although the WRA seemed initially very efficient to prevent reinforcement corrosion, the efficiency of this agent seems to disappear after about 30 weeks. The same conclusions could be drawn in case the WRA is injected manually into the crack.
When considering the evolution of the cathodic polarization resistance, little difference is seen between the test series as all cathodic cages in every series are exposed to the same conditions. When comparing the graphs for all test series in Figure 9, no significant differences were found in the mean cathodic polarization resistance. For all series, the same general increasing trend was noticed. Starting from values between 0.5 kΩ and 0.65 kΩ, a small rise could be noticed after week 0 to values ranging from 0.75 kΩ to 1 kΩ. This rise was followed by a small drop at week 1, after which a general increasing trend was noticed during the continuation of the experiment evolving for all test series towards values of about 5 to 6 kΩ.

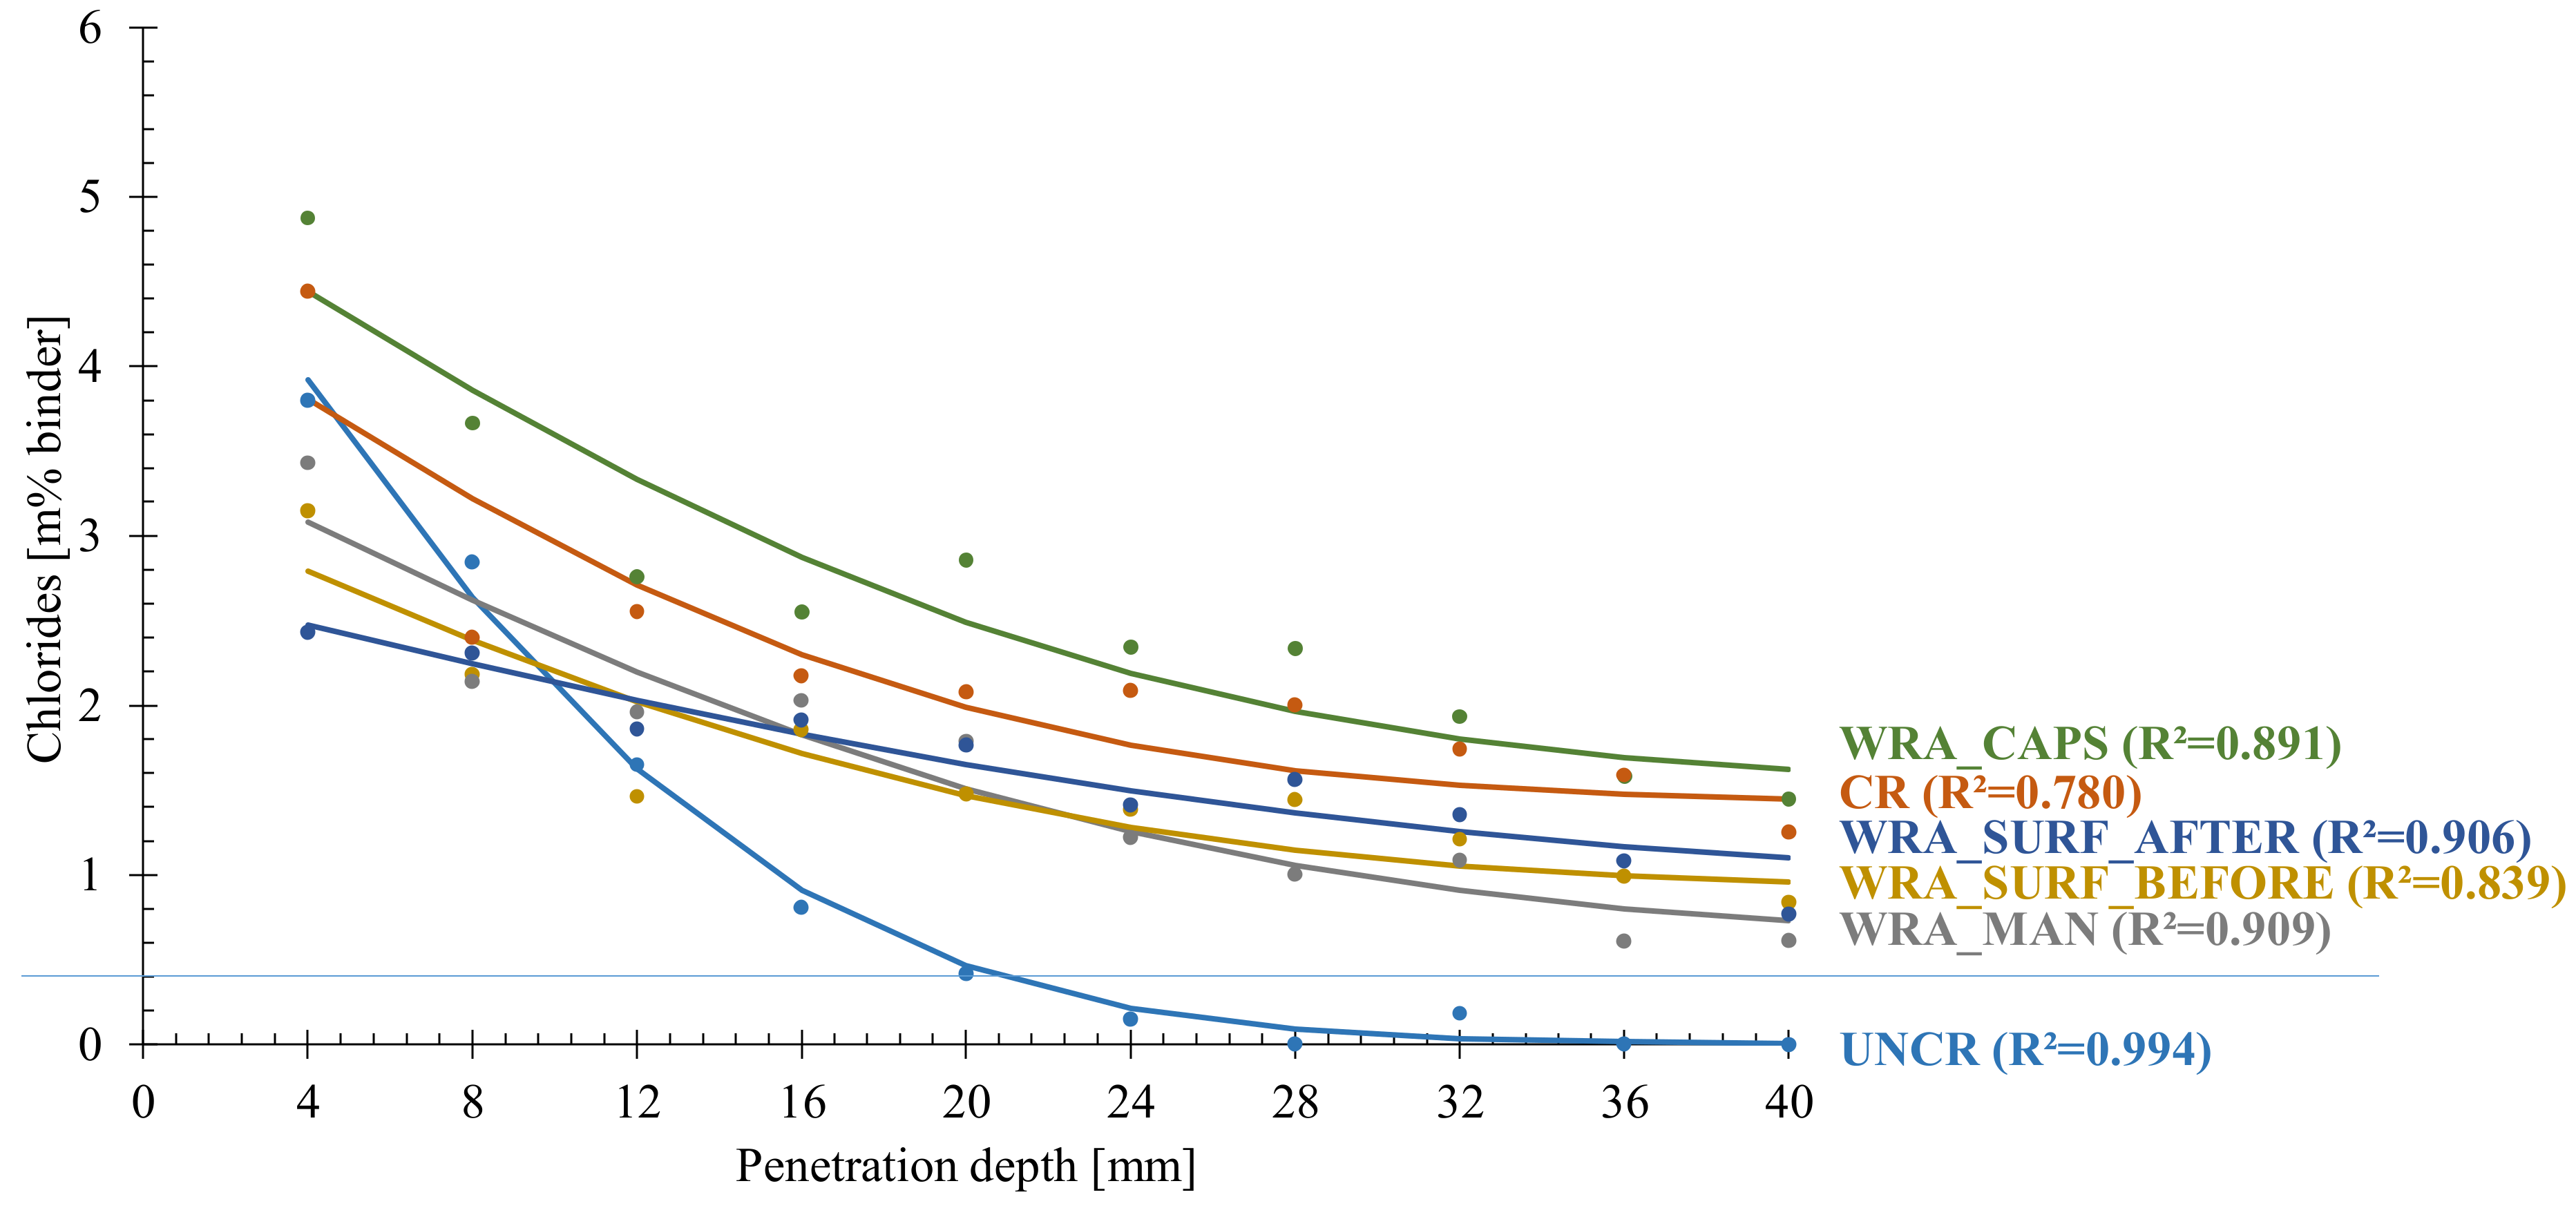
4.3. Chloride Ingress Profile

When drafting the fitted chloride ingress profiles for the zone under investigation, extending until a depth of 40 mm underneath the exposure surface (Figure 10), the first conclusion which can be drawn is that the samples containing encapsulated WRA behaved the worst. This series even showed to perform worse than the series with untreated cracks. Samples in which WRA was applied onto the surface, before or after crack formation, showed a somewhat improved performance compared to the samples with untreated cracks. Cracked samples where the WRA was manually injected into the crack performed even better as they evolved towards the lowest amount of chlorides at a depth of 40 mm. However, none of the crack treatment techniques could significantly reduce ingress of chlorides through the cracks.
As chloride contents and profiles were only defined after samples were exposed to 135 weekly cycles of chloride ingress, when the efficacy of the WRA was mainly lost, for none of the crack treatment techniques a real benefit could be seen compared to the series with untreated cracks. These findings are in agreement with previously published findings about the long term performance of silane-based WRA. Dai et al. [20,21] also reported that silane-based WRA seems to lose its effectiveness on the long term, as it could be destroyed by UV radiation, physical absorption etc. They stated that larger penetration depths could help to delay this effect, which corresponds with our finding that injection or release into the crack outperforms surface impregnation. In addition, they also stated that silane based creams and gels seem to behave superior compared to silane liquids as used in this study. However, in combination with the capsule-based self-healing approach in this study we are in favour of the silane liquid because of its low viscosity and subsequent easy release from the capsules.
As was seen from the previous measurements, for all series, except the uncracked series, corrosion was initiated as the chloride content at the position of the anodic rebar reached values above the critical chloride content. For the uncracked series, the chloride content remained below this limit at the position of the anode, which is in accordance with previous measurements that showed that for this series no onset of corrosion took place.

4.4. Chloride Ingress Front

After being exposed to 135 cycles of chloride ingress, samples of all series were split so the chloride ingress front on a plane perpendicular to the crack plane could be visualised (Figure 11). Knowing that the middle compartment in which the chloride solution was poured had a width of 100 mm with the crack being positioned in the middle of that compartment, it makes sense that for most series the ingress took place in a zone of about 50 mm at both sides of the crack. For the uncracked series, a more uniform ingress front was noticed due to the absence of a crack for this series. For all split surfaces belonging to the uncracked series, the penetration depth remained below 20 mm as in this case ingress only occurred via the undamaged matrix. On the contrary, for the cracked series, the maximum penetration depth is noticed at the crack position and penetration depths up to 70 mm are seen. For these samples, chlorides entered the crack from the first exposure cycle onwards and this caused the chlorides to penetrate into the matrix from both the exposure surface and from the crack faces as could be seen from the ingress front. In case WRA was manually injected into the crack before exposure to chloride ingress, the ingress front seemed to be significantly reduced compared to the cracked series. The ingress depth remained below 40 mm and also the horizontal ingress from the crack faces is lower compared to the cracked series. However, similar as for the cracked series, preferential ingress at the crack position is noticed, showing that the WRA was not able to resist chloride ingress for 135 exposure cycles. If a WRA is used to cover the complete area of the sample surface that is exposed to chlorides before creation of the crack, it could be noticed that for the outer sides of the compartments ingress remains limited, but as the agent was applied before crack creation, it seems that upon exposure, chlorides immediately enter the crack until the crack tip and start to move from the crack faces onwards in horizontal direction. As for this series, no WRA was available inside the crack, the chlorides could easily move until the crack tip and again rather high penetration depths, in this case reaching until 50 mm, are noticed. When the WRA is applied onto the surface after crack creation, the situation seems to improve and an ingress front comparable to the one seen for the manually injected cracks is noticed. Again, it is clear that the agent is not able to resist the chloride ingress for 135 cycles and preferential ingress via the crack is seen but the situation is improved compared to the series were the WRA is applied before crack creation and definitely compared to the series where cracks are left untreated. In case the WRA is released from the embedded capsules at the moment of crack formation, preferential ingress via the crack is largely reduced. Although the penetration depth is still highest at the crack location (where depths ranging from 20 to 30 mm are measured), compared to the other cracked series, a more uniform ingress front is noted again, showing that the released WRA was at least partially able to resist the chlorides to enter the matrix.

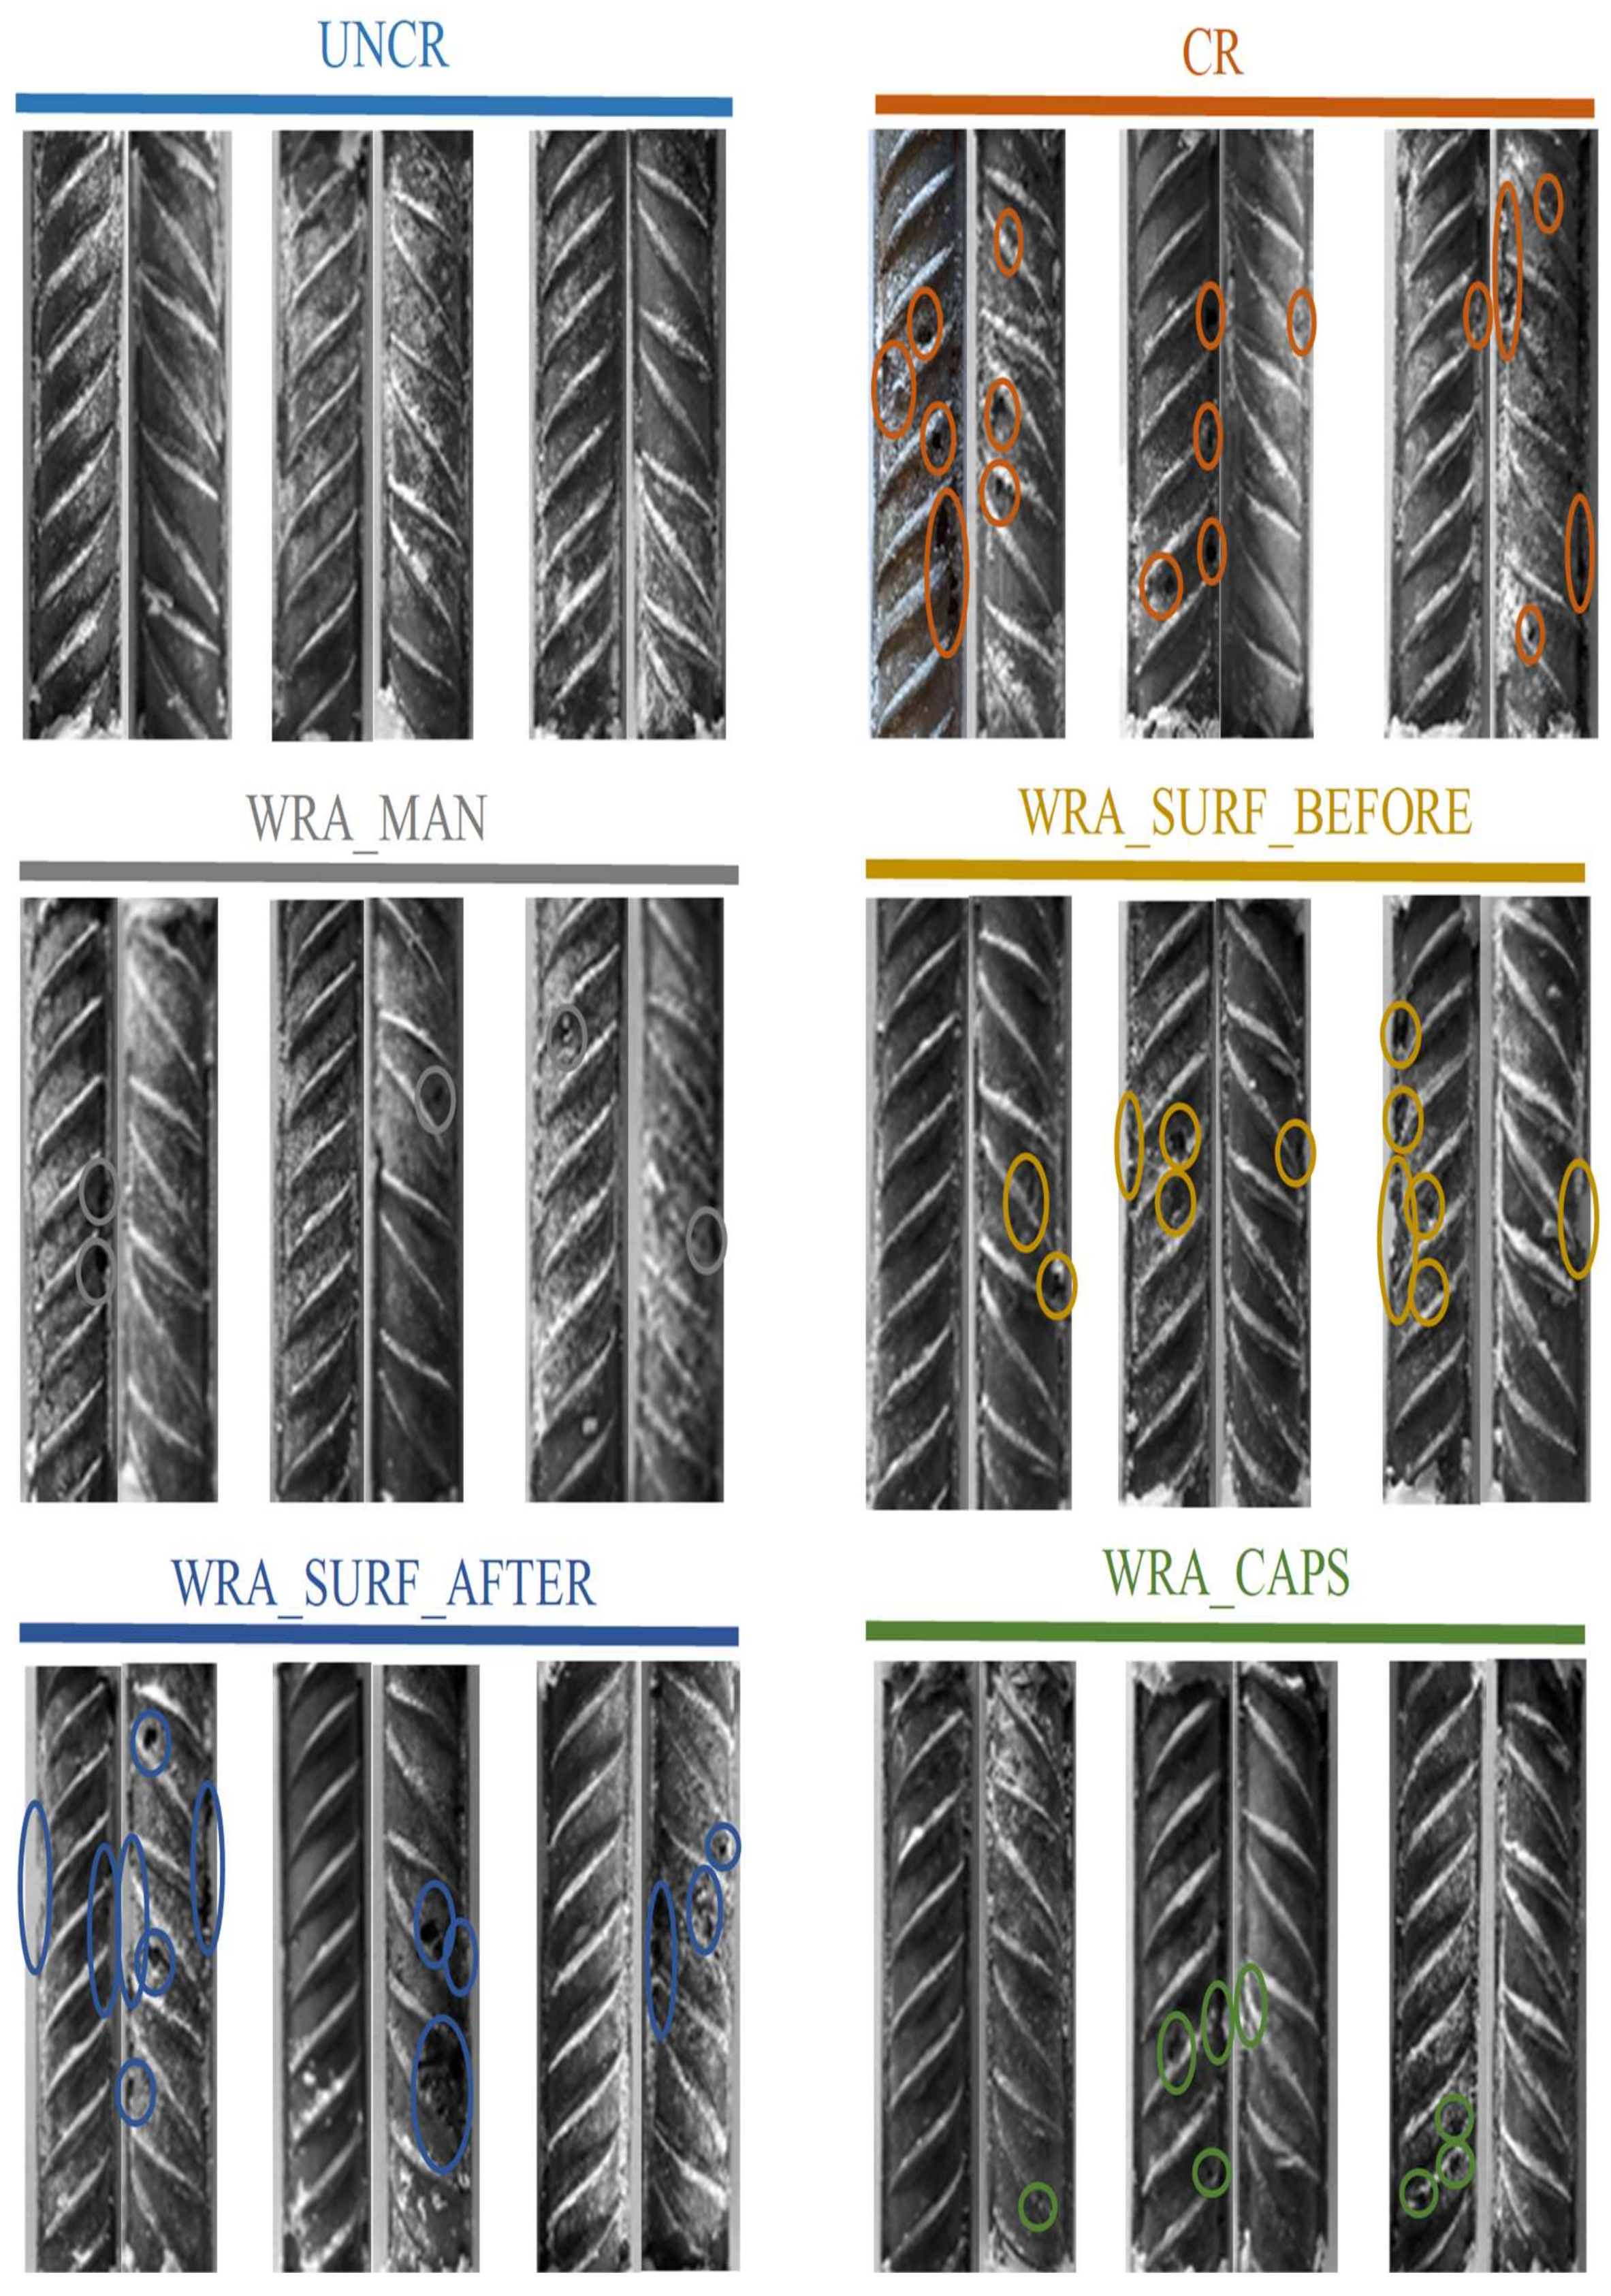
4.5. Visual Inspection Reinforcement Bars

Both sides of the anode were photographed after rebars were taken out of the samples. It could be clearly seen from Figure 12 that apart from the rebars embedded in the uncracked samples, all rebars showed signs of pitting corrosion. To improve the visibility pits are indicated by means of oval markings. When comparing the rebars which were embedded in samples with treated cracks (WRA_MAN, WRA_SURF_BEFORE, WRA_SURF_AFTER and WRA_CAPS) in comparison to the rebars from the untreated cracked series, a decreased number of pits could be noticed. From all crack treatment techniques, manual injection of WRA into the crack seemed to result in the lowest number of pits. Additionally, release of the WRA from embedded capsules seemed to result in a decreased number of pits in comparison with the situation where the agent was applied onto the surface of the sample (regardless of whether the agent was applied before or after crack creation). This finding corresponds with the conclusions drawn based on the monitored macro-cell corrosion current. It was seen that the series WRA_MAN and WRA_CAPS only showed an increase in corrosion current after about 40 weeks or later and thus these series delayed the onset of corrosion most which also resulted in a decreased number of pits compared to the other test series.

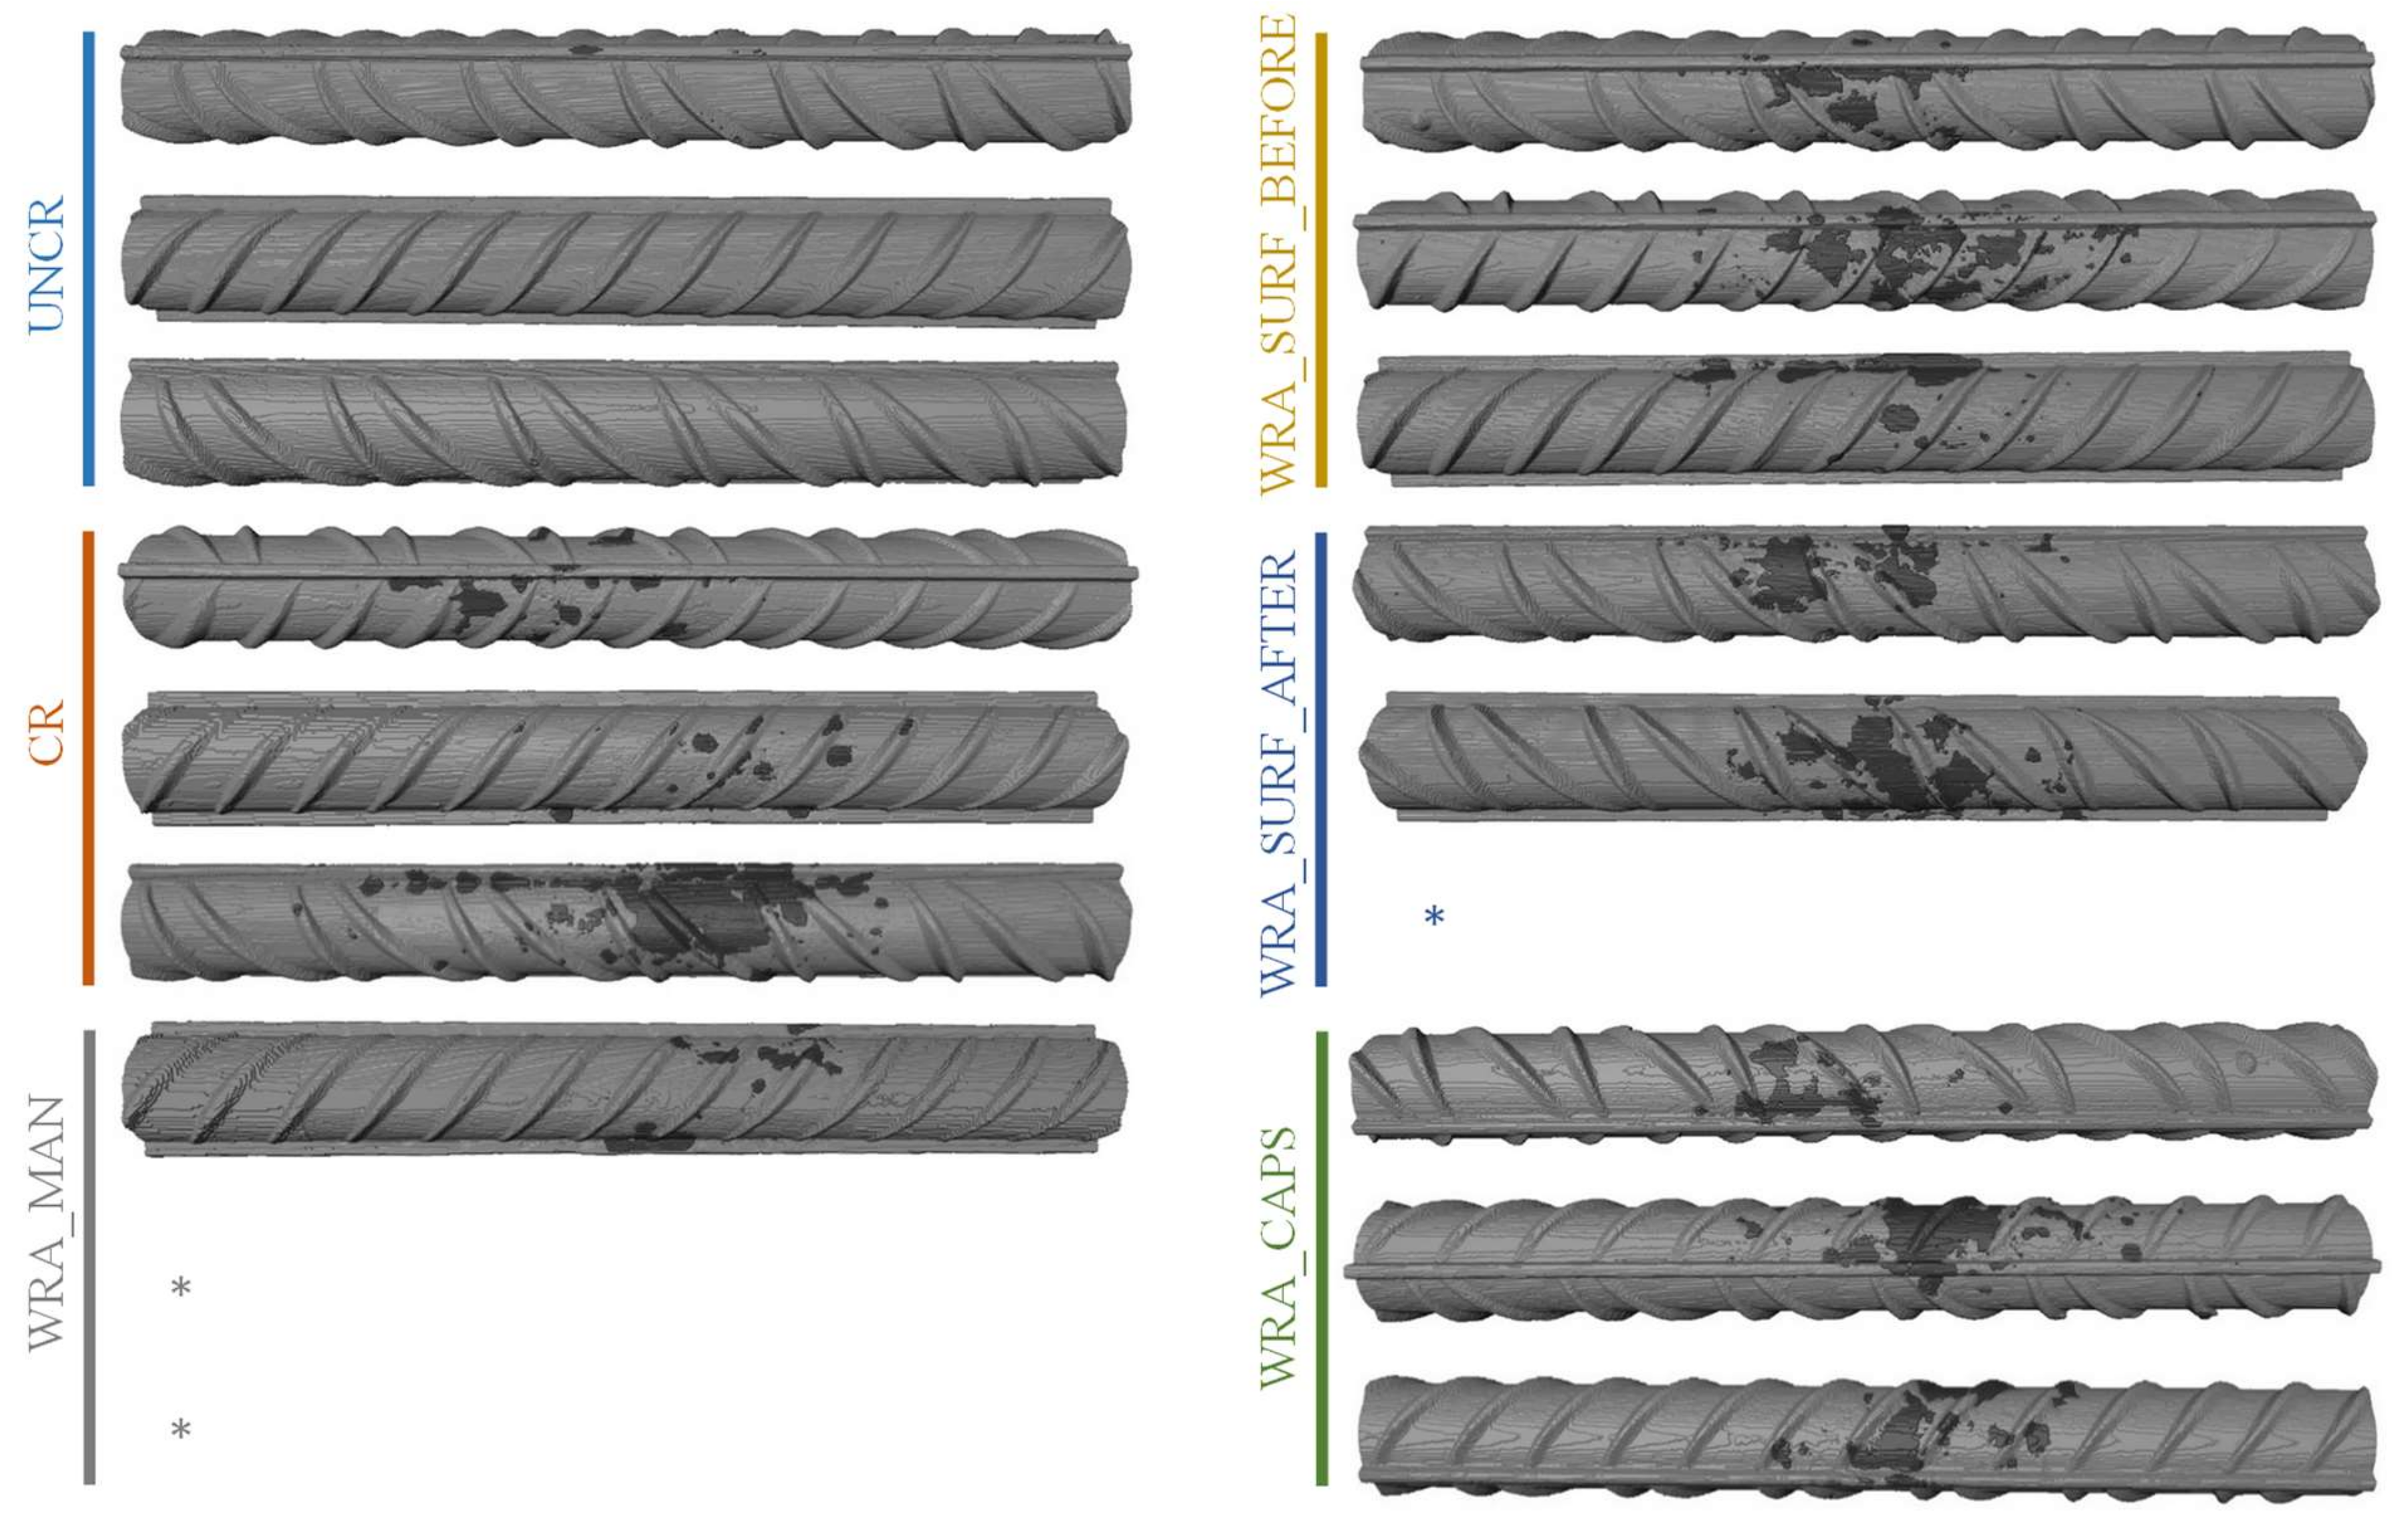
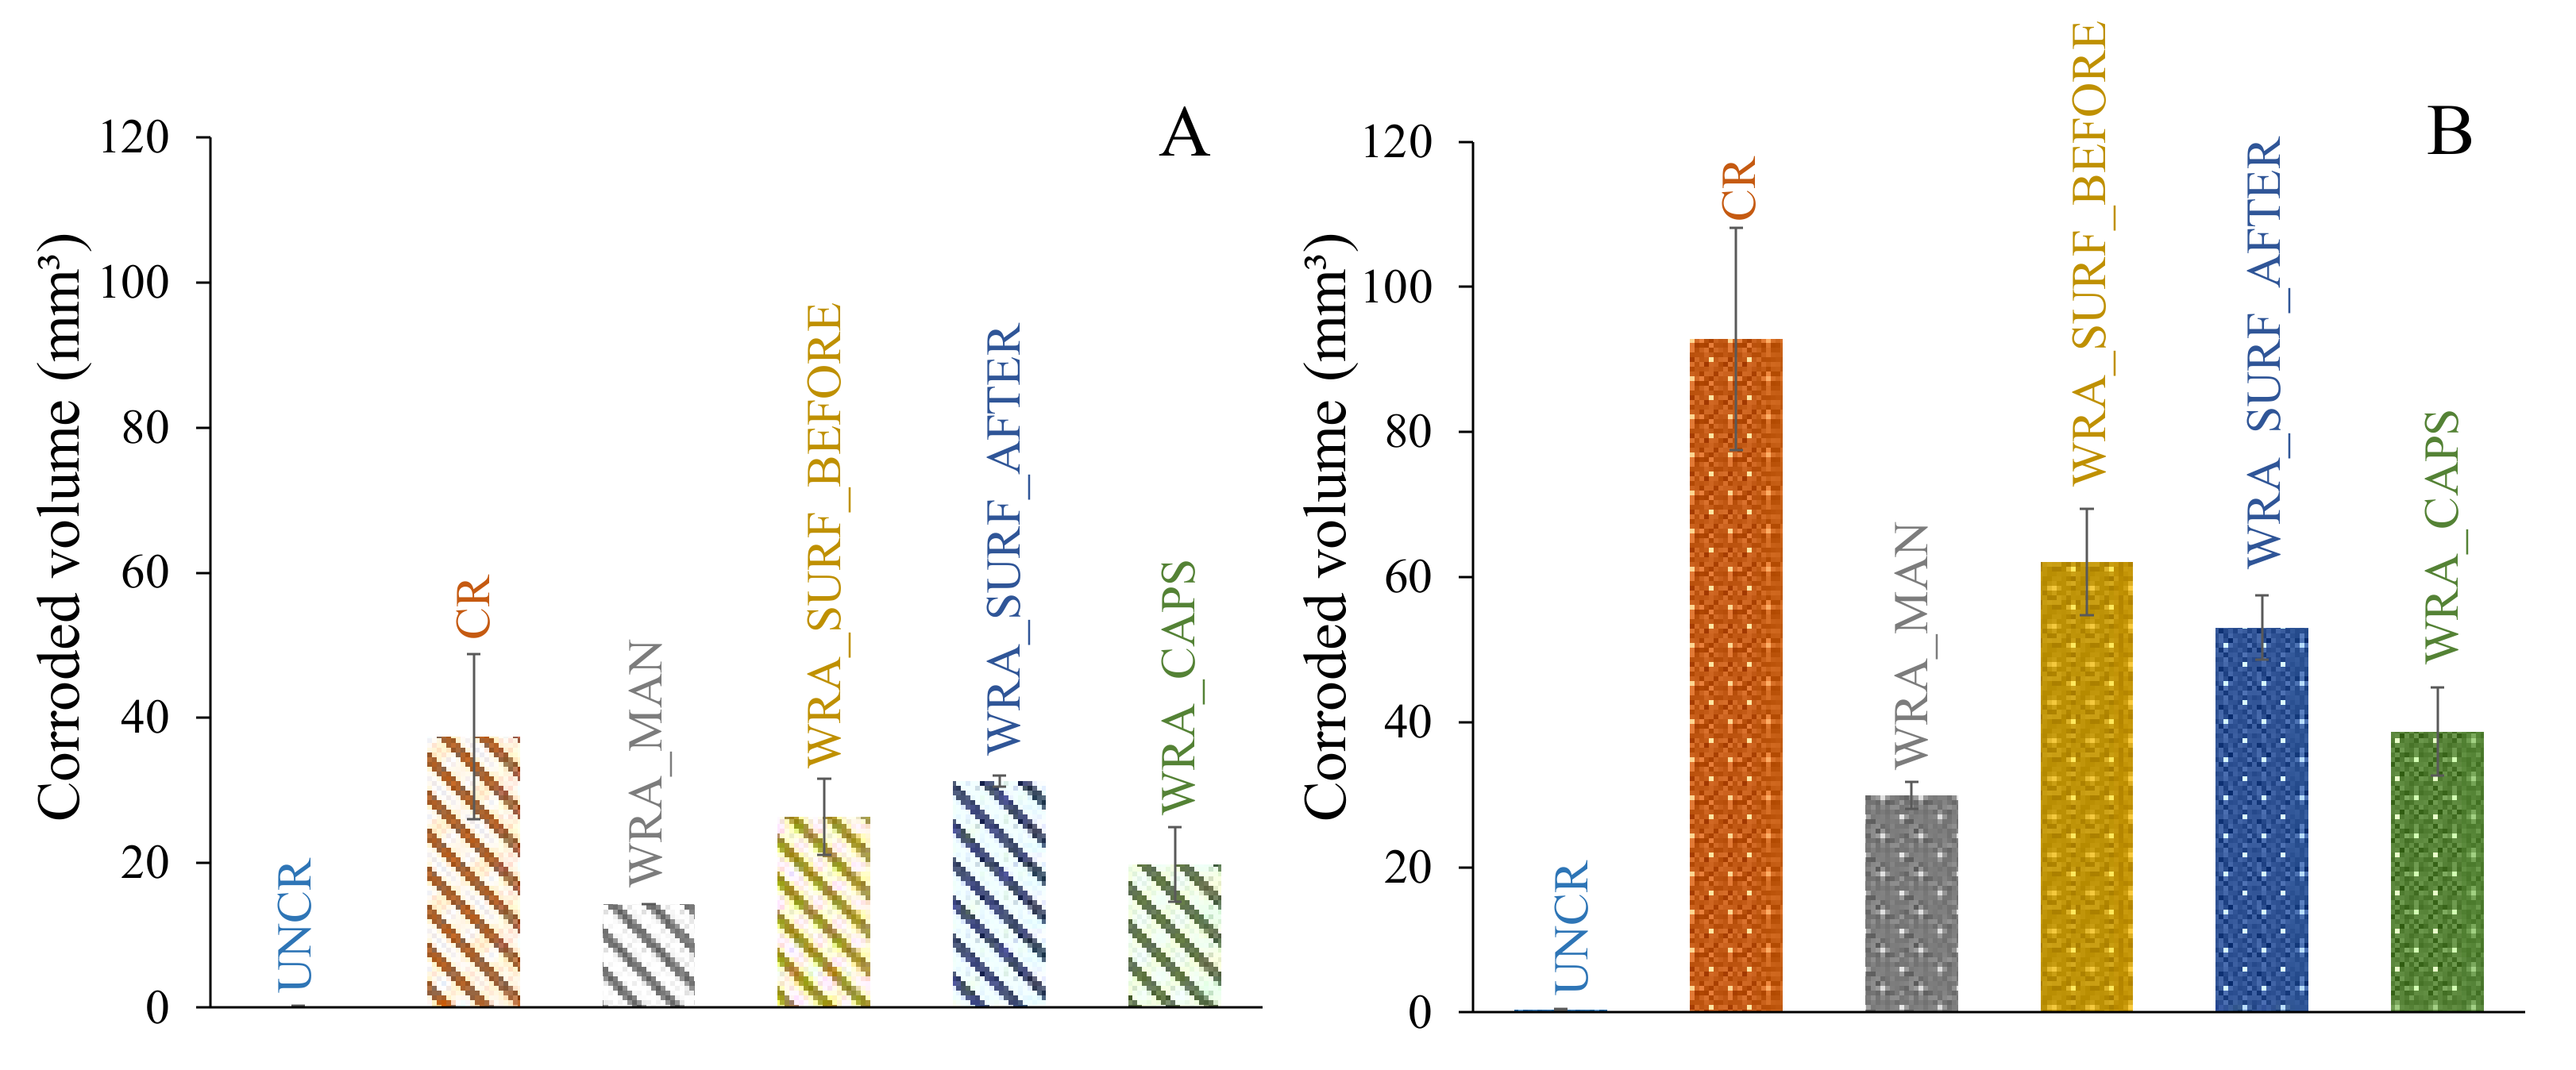
4.6. Inspection of Reinforcement Bars through X-ray μCT

From the 3D renders shown in Figure 13, it can be concluded that from all scanned rebars only the rebars taken out of the uncracked samples did not show reinforcement corrosion. Although only one half of the rebars is visualized in Figure 13, it is quite clear that all cracked samples, whether the crack was sealed or not, did show reinforcement corrosion after exposure to 135 cycles of chloride ingress. It is clear that pitting corrosion was concentrated at the position where the crack crossed the rebar and a small zone around as detachment between the rebar and the concrete matrix probably occurred in the zone around the crack causing chlorides to penetrate also in between. In order to allow for a more quantitative evaluation of the test results, the corroded volume was calculated by comparison of the scanned rebars before (reference image) and after (corroded image) cyclic exposure to the chloride solution. As explained before, the steel mass and volume loss was also calculated from the macro-cell corrosion current measurements. Both volume loss estimations are shown in Figure 14.
From these volume loss measurements, it is confirmed again that, apart from the uncracked test series, all test series did show reinforcement corrosion. Some rebars bended while taking them out of the concrete samples which made the comparison of the X-ray µCT scan before and after corrosion impossible. Therefore, no sound statistical investigation could be performed and no firm conclusions could be drawn. However, based on the data available and the comparison of the calculated volume loss of the X-ray μCT scans and the macro-cell corrosion current, untreated cracked samples tend to show the highest volume in corroded material. When cracks were treated with WRA, the amount of corroded material somewhat decreased and this decrease seemed to be most pronounced when the agent was foreseen inside the crack itself, with a slightly better performance when being injected manually compared to the situation where the agent was released from the capsules.

5. Conclusions and Future Recommendations

As the risk of chloride-induced corrosion is much higher when cracks are present in reinforced concrete, appropriate crack repair is required. In this study, four different crack repair techniques among which manual crack injection, surface application before crack creation, surface application after crack creation, and autonomous crack repair were compared. In all of the cases, a silane-based WRA was used as healing agent. From this study, the following conclusions could be drawn.
  • It was clear that only the uncracked test series was able to completely prevent the occurrence of rebar corrosion after 135 weekly cycles of chloride exposure.
  • In case untreated cracked samples were submitted to a cyclic chloride exposure, all samples showed immediate initiation of corrosion.
  • When the WRA was applied onto the surface before crack creation, a small delay in corrosion onset was seen; however, after 4–6 weeks, the first signs of corrosion became visible and when considering the corrosion propagation, not that much improvement compared to the untreated samples was noticed.
  • When the WRA was applied on the surface after crack formation, one sample already showed signs of corrosion after 5 weeks, but the two other samples were able to resist corrosion for 26–42 weeks.
  • A real improvement in terms of delay of corrosion initiation and corrosion propagation was noticed when the healing agent was injected into the crack. When the agent was manually injected some signs of corrosion were seen after 19 weeks; however, only after 64 weeks a clear onset of corrosion occurred. When the agent was released through embedded capsules, clear signs of corrosion onset were noticed after 39–64 weeks. Moreover, for both of the latter test series, the measured macro-cell corrosion current was clearly lower compared to the other series, which was a proof that the corrosion propagated slower.
As a general conclusion, it could be stated that this long-term test campaign clearly proved that the protective effect of a silane-based WRA decreases over time, but that local release of this agent into a crack, regardless of whether the agent is released manually or autonomously, seems effective to prevent ingress of chloride ions and thus to prevent reinforcement corrosion for a timeframe of up to 30 weeks.
In this study, liquid silane was used as healing agent, as the low viscosity of this agent would favour the release from the capsules. For silane based creams and gels, it would be less effective to obtain a proper release of the agent from the capsules, although it was seen from previous research that the latter agents seem better to keep their long-term effectiveness. As vascular-based self-healing concrete allows to stimulate the flow of the healing agent into the crack through the application of pressure at the inlet of the vascular network, it is recommended that, in the future, the effectiveness of silane based creams or gels in combination with a vascular-based self-healing approach are investigated in order to prevent reinforcement corrosion in cracked concrete.

Author Contributions

Conceptualization, K.V.T., B.V.B. and P.V.d.H.; methodology, K.V.T., B.V.B., P.V.d.H. and R.C.; formal analysis, K.V.T.; investigation, K.V.T., B.V.B., P.V.d.H. and R.C.; data curation, K.V.T., B.V.B., P.V.d.H., J.V.D.P., R.C., J.V.S. and M.D.; writing—original draft preparation, K.V.T.; writing—review and editing, K.V.T., B.V.B., P.V.d.H., J.V.D.P., J.V.S., M.D., V.C. and N.D.B.; visualization, K.V.T.; supervision, V.C. and N.D.B.; project administration, N.D.B.; funding acquisition, N.D.B. and K.V.T. All authors have read and agreed to the published version of the manuscript.

Funding

This research was partly funded by the Research Foundation—Flanders (FWO) grant number G062720N (Philip Van den Heede is a postdoctoral researcher of the Research Foundation—Flanders (FWO)).

Institutional Review Board Statement

Not applicable.

Informed Consent Statement

Not applicable.

Conflicts of Interest

The authors declare no conflict of interest.

References

  1. Verma, S.K.; Bhadauria, S.S.; Akhtar, S. Monitoring Corrosion of Steel Bars in Reinforced Concrete Structures. Sci. World J. 2014, 2014, 1–9. [Google Scholar] [CrossRef] [PubMed] [Green Version]
  2. Bargaheiser, K.; Butalia, T.S. Prevention of corrosion in concrete using fly ash concrete mixes. In Proceedings of the Concrete Technology Forum, Dallas, TX, USA, 22–25 May 2007. [Google Scholar]
  3. Kaur, K.; Goyal, S.; Bhattacharjee, B.; Kumar, M. Efficiency of Migratory-Type Organic Corrosion Inhibitors in Carbonated Environment. J. Adv. Concr. Technol. 2016, 14, 548–558. [Google Scholar] [CrossRef] [Green Version]
  4. Kaur, K.; Goyal, S.; Bhattacharjee, B.; Kumar, M. Electrochemical Impedance Spectroscopy to Study the Carbonation Behavior of Concrete Treated with Corrosion Inhibitors. J. Adv. Concr. Technol. 2017, 15, 738–748. [Google Scholar] [CrossRef] [Green Version]
  5. Söylev, T.A.; Richardson, M. Corrosion inhibitors for steel in concrete: State-of-the-art report. Constr. Build. Mater. 2008, 22, 609–622. [Google Scholar] [CrossRef]
  6. Okeniyi, J.; Omotosho, O.; Ajayi, O.; Loto, C.A. Effect of potassium-chromate and sodium-nitrite on concrete steel-rebar degradation in sulphate and saline media. Constr. Build. Mater. 2014, 50, 448–456. [Google Scholar] [CrossRef]
  7. Garcés, P.; Saura, P.; Zornoza, E.; Andrade, C. Influence of pH on the nitrite corrosion inhibition of reinforcing steel in simulated concrete pore solution. Corros. Sci. 2011, 53, 3991–4000. [Google Scholar] [CrossRef]
  8. Brenna, A.; Bolzoni, F.; Beretta, S.; Ormellese, M. Long-term chloride-induced corrosion monitoring of reinforced concrete coated with commercial polymer-modified mortar and polymeric coatings. Constr. Build. Mater. 2013, 48, 734–744. [Google Scholar] [CrossRef]
  9. Sharma, N.; Sharma, S.; Sharma, S.K.; Mehta, R. Evaluation of corrosion inhibition and self healing capabilities of nanoclay and tung oil microencapsulated epoxy coatings on rebars in concrete. Constr. Build. Mater. 2020, 259, 120278. [Google Scholar] [CrossRef]
  10. Dong, B.; Ding, W.; Qin, S.; Fang, G.; Liu, Y.; Dong, P.; Hong, S. 3D visualized tracing of rebar corro-sion-inhibiting features in concrete with a novel chemical self-healing system. Constr. Build. Mater. 2018, 168, 11–20. [Google Scholar] [CrossRef]
  11. Dong Biqin, D.; Weijian, Q.; Shaofeng, H.; Ningxu, F.; Guohao, L.; Yuqing, X.; Feng, H.; Shuxian, H. Chemical self-healing system with novel microcapsules for corrosion inhibition of rebar in concrete. Cem. Concr. Compos. 2017, 85. [Google Scholar]
  12. Çopuroğlu, O.; Fraaij, A.; Bijen, J. Effect of sodium monofluorophosphate treatment on microstructure and frost salt scaling durability of slag cement paste. Cem. Concr. Res. 2006, 36, 1475–1482. [Google Scholar] [CrossRef]
  13. Xu, J.; Tang, Y.; Wang, X.; Wang, Z.; Yao, W. Application of ureolysis-based microbial CaCO3 precipitation in self-healing of concrete and inhibition of reinforcement corrosion. Constr. Build. Mater. 2020, 265, 120364. [Google Scholar] [CrossRef]
  14. Erşan, Y.; Van Tittelboom, K.; Boon, N.; De Belie, N. Nitrite producing bacteria inhibit reinforcement bar corrosion in cementitious materials. Sci. Rep. 2018, 8, 1–10. [Google Scholar] [CrossRef] [PubMed] [Green Version]
  15. Osman, K.M.; Taher, F.M.; El-Tawab, A.A.; Faried, A.S. Role of different microorganisms on the mechanical characteristics, self-healing efficiency, and corrosion protection of concrete under different curing conditions. J. Build. Eng. 2021, 41, 102414. [Google Scholar] [CrossRef]
  16. Van Belleghem, B.; Kessler, S.; Heede, P.V.D.; Van Tittelboom, K.; De Belie, N. Chloride induced reinforcement corrosion behavior in self-healing concrete with encapsulated polyurethane. Cem. Concr. Res. 2018, 113, 130–139. [Google Scholar] [CrossRef]
  17. Van Tittelboom, K.; Van Belleghem, B.; Boone, M.N.; Van Hoorebeke, L.; De Belie, N. X-ray radiography to visualize the re-bar-cementitious matrix interface and judge the delay in corrosion through self-repair by encapsulated polyurethane. Adv. Mater. Interfaces 2018, 5, 1701021. [Google Scholar] [CrossRef]
  18. Van Belleghem, B. Effect of Capsule-Based Self-Healing on Chloride Induced Corrosion of Reinforced Concrete. Ph.D. Thesis, Ghent University, Ghen, Belgium, 2018; p. 328. [Google Scholar]
  19. Van Tittelboom, K.; De Maesschalck, C.; Van Belleghem, B.; Van den Heede, P.; Kessler, S.; De Belie, N. Self-Healing of Concrete Cracks by the Release of Embedded Water Repellent Agents and Corrosion Inhibitors to Reduce the Risk of Reinforcement Corrosion. In Proceedings of the IV DBMC 14th International Conference on Durability of Building Materials and Components (XIV DBMC 2017), Paris, France, 29–31 May 2017; De Schutter, G., De Belie, N., Janssens, A., Van Den Bossche, N., Eds.; RILEM Publications: Paris, France, 2017; pp. 1–10. [Google Scholar]
  20. Dai, J.; Akira, Y.; Kato, E.; Yokota, H. Investigation of Chloride Ingress in Cracked Concrete Treated with Water Repellent Agents. In Proceedings of the Hydrophobe V, Fifth International Conference on Water Repellent Treatment of Building Materials, Brussels, Belgium, 15–16 April 2008; Aedificatio Publishers: Freiburg, Germany, 2008; pp. 299–310. [Google Scholar]
  21. Dai, J.-G.; Akira, Y.; Wittmann, F.; Yokota, H.; Zhang, P. Water repellent surface impregnation for extension of service life of reinforced concrete structures in marine environments: The role of cracks. Cem. Concr. Compos. 2010, 32, 101–109. [Google Scholar] [CrossRef]
  22. NBN. EN 12350-2 Testing Fresh Concrete—Part 2: Slump-Test 2009; NBN: Brussels, Belgium, 2009. [Google Scholar]
  23. NBN. EN 12350-5 Testing Fresh Concrete—Part 5: Flow Table Test; NBN: Brussels, Belgium, 2019. [Google Scholar]
  24. NBN. EN 12350-7 Testing Fresh Concrete—Part 7: Air Content-Pressure Methods; NBN: Brussels, Belgium, 2009. [Google Scholar]
  25. NBN. EN 12390-1 Testing Hardened Concrete—Part 1: Shape, Dimensions and other Requirements for Specimens and Moulds; NBN: Brussels, Belgium, 2012. [Google Scholar]
  26. Hiemer, F.; Keßler, S.; Gehlen, C.; Wiedmann, A.; Kotan, E.; Müller, H. Reinforcement corrosion behavior in bending cracks after short-time chloride exposure. In Proceedings of the 4th International Conference on Concrete Repair, Rehabilitation and Retrofitting, Leipzig, Germany, 5–7 October 2015. [Google Scholar] [CrossRef]
  27. Hiemer, F.; Keßler, S.; Gehlen, C. Development of chloride induced reinforcement corrosion in cracked concrete after Application of a Surface Protection System. In Proceedings of the Concrete Solutions 6th International Conference on Concrete Repair, Thessaloniki, Greece, 20–23 June 2016. [Google Scholar]
  28. Keßler, S.; Hiemer, F.; Gehlen, C. Einfluss einer Betonbeschichtung auf die Mechanismen der Bewehrungkorrosion in gerissenem Stahlbeton. Beton Stahlbetonbau 2017, 112, 198–206. [Google Scholar] [CrossRef]
  29. Van Steen, C.; Wevers, M.; Verstrynge, E. X-Ray Computed Tomography for the Detection of Corrosion-Induced Damage at the Reinforcement-Concrete Interface. In Proceedings of the 7th Conference on Industrial Computed Tomography, Leuven, Belgium, 7–9 February 2017. [Google Scholar]
  30. Michel, A.; Pease, B.J.; Geiker, M.R.; Stang, H.; Olesen, J.F. Monitoring reinforcement corrosion and corrosion-induced cracking using non-destructive x-ray attenuation measurements. Cem. Concr. Res. 2011, 41, 1085–1094. [Google Scholar] [CrossRef]
  31. Masschaele, B.; Dierick, M.; Van Loo, D.; Boone, M.N.; Brabant, L.; Pauwels, E.; Cnudde, V.; Van Hoorebeke, L. HECTOR: A 240kV Micro-CT Setup Optimized for Research. J. Phys. Conf. Ser. 2013, 463, 012012. [Google Scholar] [CrossRef]
  32. Vlassenbroeck, M.J.; Dierick, M.; Masschaele, B.; Cnudde, V.; Van Hoorebeke, L.; Jacobs, P. Software tools for quantification of X-ray microtomography at the UGCT. Nucl. Instrum. Methods Phys. Res. Sect. A Accel. Spectrometers Detect. Assoc. Equip. 2007, 580, 442–445. [Google Scholar] [CrossRef]
  33. Boone, M.; De Kock, T.; Bultreys, T.; De Schutter, G.; Vontobel, P.; Van Hoorebeke, L.; Cnudde, V. 3D mapping of water in oolithic limestone at atmospheric and vacuum saturation using X-ray micro-CT differential imaging. Mater. Charact. 2014, 97, 150–160. [Google Scholar] [CrossRef]
  34. Marcotte, T.D.; Hansson, C.M. The influence of silica fume on the corrosion resistance of steel in high performance concrete exposed to simulated sea water. J. Mater. Sci. 2003, 38, 4765–4776. [Google Scholar] [CrossRef]
Figure 1. Schematic representation of the reinforcement scheme in the concrete samples with indication of the capsule positions for the samples with self-healing properties (dimensions in mm). The red, blue, and green lines represent the insulated copper wires which were used to make the electrical connections to the exterior and between the anode and cathode.
Processes 09 02101 g001
Figure 2. Concrete beam mounted in the three-point bending test frame (A), reservoirs on (uncracked) beam for the weekly exposure to NaCl exposure in the middle compartment and Ca(OH)2 solution in the outer compartments (B).
Processes 09 02101 g002
Figure 3. Detailed overview of the cyclic chloride exposure (dark grey represents wet cycle and light grey represents dry cycle) and the electrochemical corrosion measurements (hatched zone refers to time window when anode and cathode were left disconnected, star refers to the time window of the Ecorr and IR drop measurements and circle refers to the time window of the OCP and LPR measurements).
Processes 09 02101 g003
Figure 4. Visualization of the chloride ingress front on both surfaces obtained after splitting open of the beams.
Processes 09 02101 g004
Figure 5. An overview of the image processing with (A) the reconstructed corroded image, (B) the reference image, (C) the differential image originating from subtracting the corroded image from the reference image, (D) the segmented image in which the bright grey values of C were withheld, and (E) the segmented image after an ‘opening’ operation. (F) The segmented dataset (from (E), dark grey) is rendered together with the original corroded dataset (from (A), light grey). The rebar diameter amounts to 10 mm.
Processes 09 02101 g005
Figure 6. Mean crack width measured for each of the test series at different time periods.
Processes 09 02101 g006
Figure 7. Macro-cell corrosion current measured for each of the different test series (result for one sample of the WRA_MAN series is missing as the internal electrical connection with the anode was damaged during concrete casting, different shades of the colours are used to represent the repetitions per test series).
Processes 09 02101 g007
Figure 8. Evolution of the corrosion potential and driving potential over time (result for one sample of the WRA_MAN series is missing as the internal electrical connection with the anode was damaged during concrete casting, different shades of the colours are used to represent the repetitions per test series).
Processes 09 02101 g008
Figure 9. Evolution of the polarization resistance of the anode and cathode and the concrete resistance (polarization resistance anode for one sample of the WRA_MAN series is missing as the internal electrical connection with the anode was damaged during concrete casting, different shades of the colours are used to represent the repetitions per test series).
Processes 09 02101 g009
Figure 10. Chloride ingress values and fitted profiles (with Fick’s second law of diffusion) obtained after titration of the ground powders.
Processes 09 02101 g010
Figure 11. Visualization of the chloride ingress front for each of the different test series (different shades of the colours are used to represent the repetitions per test series).
Processes 09 02101 g011
Figure 12. Photograph of each side of the anode after 135 cycles of chloride exposure (oval markings indicate the positions of the pits).
Processes 09 02101 g012
Figure 13. 3D render of the middle part of the anode showing the corroded zones at one side of the reinforcement bar (dark area) (* indicates that the X-ray µCT analysis was not successful for this rebar as some bars bended while taking them out of the concrete samples).
Processes 09 02101 g013
Figure 14. Average corroded volume of rebar calculated from the X-ray µCT -scans (A) and the macro-cell corrosion current measurements (B) for each of the test series (for the series WRA_MAN and WRA_SURF_AFTER only one, respectively, two out of the three rebars could be investigated with X-ray μCT and when considering the corrosion current measurements the WRA_MAN series consisted of only two replicates, error bars represent the standard error).
Processes 09 02101 g014
Table 1. Concrete composition.
ComponentAmount
Sand 0/4 (natural river sand)696 kg/m3
Aggregates 2/8 (rounded gravel)502 kg/m3
Aggregates 8/16 (rounded gravel)654 kg/m3
Cement317.6 kg/m3
Fly ash56 kg/m3
Water153 kg/m3
Superplasticizer3 mL/kg binder
Table 2. Properties of concrete batches.
PropertyBatch 1Batch 2
Slump classS3S3
Flow class
Density [kg/m3]
F3
2371 ± 6.6
F3
2363 ± 10.7
Compressive strength [N/mm2]61.3 ± 0.663.4 ± 3.6
Table 3. Overview of test series.
Series CodeCrackedHealedFurther Details
UNCR Uncracked beams
CR Cracked beams of which the crack was left untreated
WRA_MANCracked beams of which the crack was manually injected with WRA
WRA_SURF_BEFORECracked beams of which the test surface was sprayed with WRA before cracking
WRA_SURF_AFTERCracked beams of which the test surface was sprayed with WRA after cracking
WRA_CAPSCracked beams with embedded capsules filled with WRA
Publisher’s Note: MDPI stays neutral with regard to jurisdictional claims in published maps and institutional affiliations.

