Communication

Increase of Cycling Stability in Pilot-Scale 21700 Format Li-Ion Cells by Foil Tab Design

by
Thomas Waldmann
,
Rares-George Scurtu
*,
Daniel Brändle
and
Margret Wohlfahrt-Mehrens
ZSW—Zentrum für Sonnenenergie-und Wasserstoff-Forschung Baden-Württemberg, Helmholtzstrasse 8, D-89081 Ulm, Germany
*
Author to whom correspondence should be addressed.
Processes 2021, 9(11), 1908; https://doi.org/10.3390/pr9111908
Submission received: 28 September 2021 / Revised: 19 October 2021 / Accepted: 22 October 2021 / Published: 26 October 2021

Abstract

:
Li-ion cells of the industrially-relevant 21700 format were built on pilot-scale with tabs made from (a) the electrodes’ current collecting foils (Al and Cu, “foil tabs”) in comparison with (b) conventional tabs (Al and Ni) welded to the electrodes’ current collecting foils (“welded tabs”). Both cell types use the same anode (graphite), cathode (NMC622), separator, electrolyte, as well as the same tab positions. This allows a direct comparison of welded tabs and foil tabs regarding formation, C-rate capability, cell electrical resistance, and long-term cycling stability tests. Our data reproducibly shows 14.4% longer cycling stability and 11.2% increased total charge throughput in the case of the cells with foil tabs until 80% SOH, which is likely due to less inhomogeneities in the case of the foil tab design.

1. Introduction

Cylindrical Li-ion cells typically contain one coated anode and cathode for energy storage. The electrical current transfer from the electrodes is managed by connecting the current collecting foils by tabs to the positive and negative terminals of the cells [1]. These tabs are typically welded to the current collecting foils in areas which are not covered by anode and cathode material (Figure 1a). In large-scale battery cell production, these coating-free parts are often realized by an intermitted coating process.
Tabs are likely to cause inhomogeneities in the jellyroll [2,3], since they are usually thicker than the electrode coatings (single-sided coating thickness for anodes < 100 µm [4]). Such inhomogeneities can lead to deformations of the jellyroll after long-term cycling, especially at increased C-rates [2,3]. This should be different if the tabs were constructed from the current collecting foils themselves (Figure 1d), since they lead to less disturbed and therefore more homogeneous jellyrolls, which are closer to the mathematically ideal shape of an Archimedean spiral [5].
Scientific literature focuses so far on simulations [1,6,7,8] and experimental work on modified commercial cells, which is limited to the investigation of the tab number [9,10]. Different patents described cylindrical cell designs with continuous tabs made from the current collecting foils (“tabless design”) in cylindrical cells [11,12,13]. Additionally, flat wound jellyrolls in PHEV1 cells utilize also the uncoated border of electrodes for electronic connection to the terminals [14]. However, the effect of tabs made from foils in comparison with the conventionally welded tabs is to the best of our knowledge not described in the literature, although it could potentially lead to improved cycle life due to increased homogeneity of the jellyroll.
Therefore, in the present paper, we compare 21,700 cells built on pilot-scale where the only modification is made to the tabs—welded or made from the current collecting foils. The cells are tested regarding formation, C-rate capability, cell resistance, and long-term cycling stability.

2. Materials and Methods

Anode (graphite, active material loading 7.8 mg/cm2, total thickness: 133 µm, 2.70 mAh cm−2 at 0.1C) and cathode (NMC622, active material loading 13.1 mg/cm2, total thickness: 117 µm, 2.37 mAh cm−2 at 0.1C) were double-side coated at ZSW’s pilot-lines. The current collecting foils had thicknesses of 10 µm (Cu, anode) and 20 µm (Al, cathode). As separator, Celgard 2325 (thickness: 25 µm) was used. The electrolyte was 1M LiPF6 in EC: EMC = 3:7 (wt.-%) + 2%VC.
All electrochemical tests were carried out by BasyTec CTS and XCTS systems in climate chambers (Vötsch) at an ambient temperature of 25 ± 2 °C. In all tests, the full voltage window of 2.7–4.2 V was applied. The formation was carried out at room temperature (23 ± 3 °C) by three cycles at 0.1C. The direct current internal resistance of the cells (RiDC) was measured by applying 10 A discharge pulse for 1 s at 100% SOC.
The C-rates in the discharge rate capability tests were 0.5C, 1C, 2C, 3C, and 5C. The charging C-rate in discharge rate capability tests was 1C in all cases with a constant voltage (CV) charging step until I < 0.1C. The cells rested after charging and discharging for 1 h. The C-rates in the charge rate capability tests were 0.1C, 0.5C, 1C, 2C, and 3C in constant current (CC) mode. The discharging C-rate in charge rate capability tests was 1C in all cases (CC). The cells rested after charging and discharging for 3h and 1h, respectively.
The long-term cycling aging tests were conducted at rate of 1C (CC charging until U = 4.2C with CV step until I < 0.1C, CC discharging until 2.7 V).
We note that these cells are not optimized regarding either high specific energy, energy density, or high power or low cell resistance. However, they are well suited for a direct comparison of either tabs made from the current collecting foil or conventionally welded tabs, which was the main intention of the present paper.

3. Results and Discussion

The process chain described in this paper starts with the already coated electrodes. An overview of the process steps (1–12) is given in Figure 2. Since the electrodes were completely coated, the electrodes with welded tabs were laser cut (1a) and then subject to laser ablation (2a) in order to mimic intermitted coating which would be the corresponding process in a large-scale industrial electrode coating process. The tabs were subsequently welded (3a) and covered by Kapton tape (4a).
In contrast, the foil tabs were made by laser cutting (1b) and ablation of the tab area only (2b). There is no need for intermitted coating, and additionally, usage of uncoated areas at the border of the electrode could make this step redundant.
The jellyrolls consisted of the four layers, the anode, the first separator, the cathode, and the second separator, which were wound, resulting in a cylinder with an internal cross-sectional structure similar to an Archimedean spiral (step 5 in Figure 2). The subsequent steps—attaching insulators (6), insertion of the jellyroll into the cell housing (7), rolling (8), welding of anode (9) and cathode (10), as well as electrolyte filling (11) and crimping (12)—are the same in both cases of welded and foil tabs.
X-ray computed tomography (CT) measurements are shown in Figure 1b,e. It can be seen that the foil tabs lead to less deformation compared to the welded tabs. Figure 1c,f shows photographs of the jellyrolls before insertion into the cell housing.
The discharge voltage curves for different C-rates in the range of 0.1C to 5C are shown in Figure 3a. The voltage curves of welded and foil tabs coincide at a rate of 0.1C. As expected, higher C-rates lead to a lower voltage level and lower capacities reached at the end of discharge. This decrease of the voltage level and the discharge capacity is stronger for the cell with foil tabs.
Figure 3b shows the discharge areal capacities of formation, as well as discharge and charge C-rate tests with pilot-built 21,700 cells with foil tabs and conventionally welded tabs. The cells of both tab designs show reasonable reproducibility. In the formation (left hand side of Figure 3b), both tab designs show similar areal discharge capacities (except for one outlier). For higher C-rates differences become visible (compare Figure 3a), which is consistent with our previous direct comparisons with the same electrodes, electrolytes, and separators of pilot-line built 18,650 and 21,700 cells [5] as well as PHEV1, pouch, and 21,700 cells [14].
For increasing discharge rates (middle part of Figure 3b), the areal discharge capacity decreases for both welded and foil tabs. The decrease is stronger in the case of the foil tabs. Considering the discharge capacities at 0.5C as 100%, the capacity at 3C and 5C decreases to 94.0% and 92.9% in the case of the welded tabs and to 94.6% and 91.1% in the case of the foil tabs.
For increasing charge rates (right hand side of Figure 3b), both cell designs show a less stable rate capability compared to increasing discharge rates, as can be expected due to the limited kinetics for lithiation of the graphite anodes [15]. Considering the charge capacities at 0.1C as 100%, the capacity at 3C decreases to 64.6% in the case of the welded tabs and to 58.2% in the case of the foil tabs.
The reason for the deviation in the C-rate tests (Figure 3a,b) is the higher internal DC resistance RiDC of the cells with the foil tabs. Figure 4a shows the RiDC as a function of cycle number. For the fresh cells (cycle 1), the cells with foil tabs show a resistance of 48.2 ± 0.1 mΩ which is 22% higher compared to the cells with welded tabs (39.4 ± 0.4 mΩ). The reason is the larger cross-sectional area Atab of the welded tabs compared to the foil tabs (see Table 1 for details). The resistances of the tabs ranging from the border of the electrode foil to the end of the tab (length ltab, see step 4a in Figure 2) can be estimated by
R t a b = ρ l t a b A t a b
where ρ is the specific resistance of the respective tab material. We used Equation (1) to estimate the order of magnitude of the resistance originating from the tabs. This equation can be used at a given temperature to calculate the resistance of an electrical conductor with uniform cross-section. It should be noted that it is being presumed that the current is uniform across the cross-section of the tab and the surface overpotential can be neglected. Moulton [16] gave the first analytical solution to this problem [17]. In the following, those parts of the tabs which exceed the anode, i.e., ltab = 15 mm beyond the electrode coating are compared. As shown in Table 1, the calculated additional resistance of a cell with foil tabs compared to welded tabs ( R t a b f o i l R t a b w e l d e d ) is 6.5 mΩ. This calculated value compares well with the measured difference for fresh cells which is 8.8 ± 0.5 mΩ.
During long-term cycling aging, the difference between the cell internal resistances of the cells with foil tabs and welded tabs maintains mostly constant and shows a similar trend. For instance, the measured difference between the cell resistances of cells with welded and foil tabs is still ~8 mΩ after 1200 cycles.
The resistance increase is mostly linear until cycle ~400 (R2 ≥ 0.996) and shows a slow change in the range of ~400–600 cycles in both cases. After ~600 cycles the resistance continues to increase again in a linear way (R2 ≥ 0.996). The slopes are similar in both cases, suggesting a similar influence of cycling on resistance.
The RiDC resistance measured with a discharge pulse length of 1 s in this study corresponds mostly to ohmic resistance with a very small part of charge transfer resistance [20]. The increase of ohmic resistance indicates film growth on the surface of the particles and electrodes, as well as loss of particle–particle contact (due to binder aging), as well as loss of active material [21]. The charge transfer most likely also contributes to the measured increase; however, for further quantification impedance spectroscopy would be needed, which is out of the scope of the present study.
While the linear fits above are useful for a direct comparison of the slopes, a fit by a second order polynomial would be physically more meaningful [22]. In the model by Broussely et al., the conductance of the solid electrolyte interface (SEI) decreases with its thickness growth with a longer aging time, which decelerates aging [22]. A fit by a second order polynomial in Figure 4a yields R2-values ≥ 0.994, indicating a good agreement with that model for both foil and welded tabs. This suggests that the main aging mechanisms leading to resistance increase are rather on the electrode level and similar in both cases.
Figure 4b shows a comparison of the cycling stability of the cells with foil tabs and with conventionally welded tabs. The capacity retention is reproducible for two cells of each tab configuration. An often used criterion for the end of cycle life is a capacity retention of 80% [23]. The cells with foil tabs show a remarkable increase of cycle number until 80% capacity retention by 14.4%, i.e., the cells with foil tabs reach 1192 cycles compared to only 1042 cycles in the case of the conventionally welded tabs.
Figure 4c shows the capacity retention as a function of charge throughput. In this case the cells with foil tabs show an increase of the accumulated charge by 11.2%.
Figure 5 shows that the discharge voltage curves as a function of normalized capacity look very similar for both tab designs for both cycle 2 and cycle 1200, while the voltage level is marginally lower for the cell with foil tabs due to the higher resistance. Due to the absence of a plateau at the beginning of discharge [24], all discharge curves in Figure 5 do not indicate stripping of previously deposited Li metal on the anode during cycling.
Even if the improved cycling stability of the cell with foil tabs in Figure 4b,c would originate from an effectively lower depth of discharge due to reaching the cut-off voltages earlier due to their higher resistance, the long-term performance in terms of total charge throughput is significantly increased by the foil tabs (Figure 4c).
Another important factor that leads to the stronger capacity fading of the cells with welded tabs is most likely the inhomogeneities in the jellyrolls induced by these tabs.

4. Conclusions

We conducted a direct comparison between Li-ion cells in the 21700 cylindrical format with two different tab designs: (i) tabs made from the current collecting foils (“foil tabs”, Figure 1d) and (ii) tabs conventionally welded to blank parts of the current collecting foils (“welded tabs”, Figure 1a).
The cells were reproducibly built on pilot-scale using the same electrodes, separators, electrolyte, and tab positions allowing a direct comparison.
The cells with foil tabs show:
-
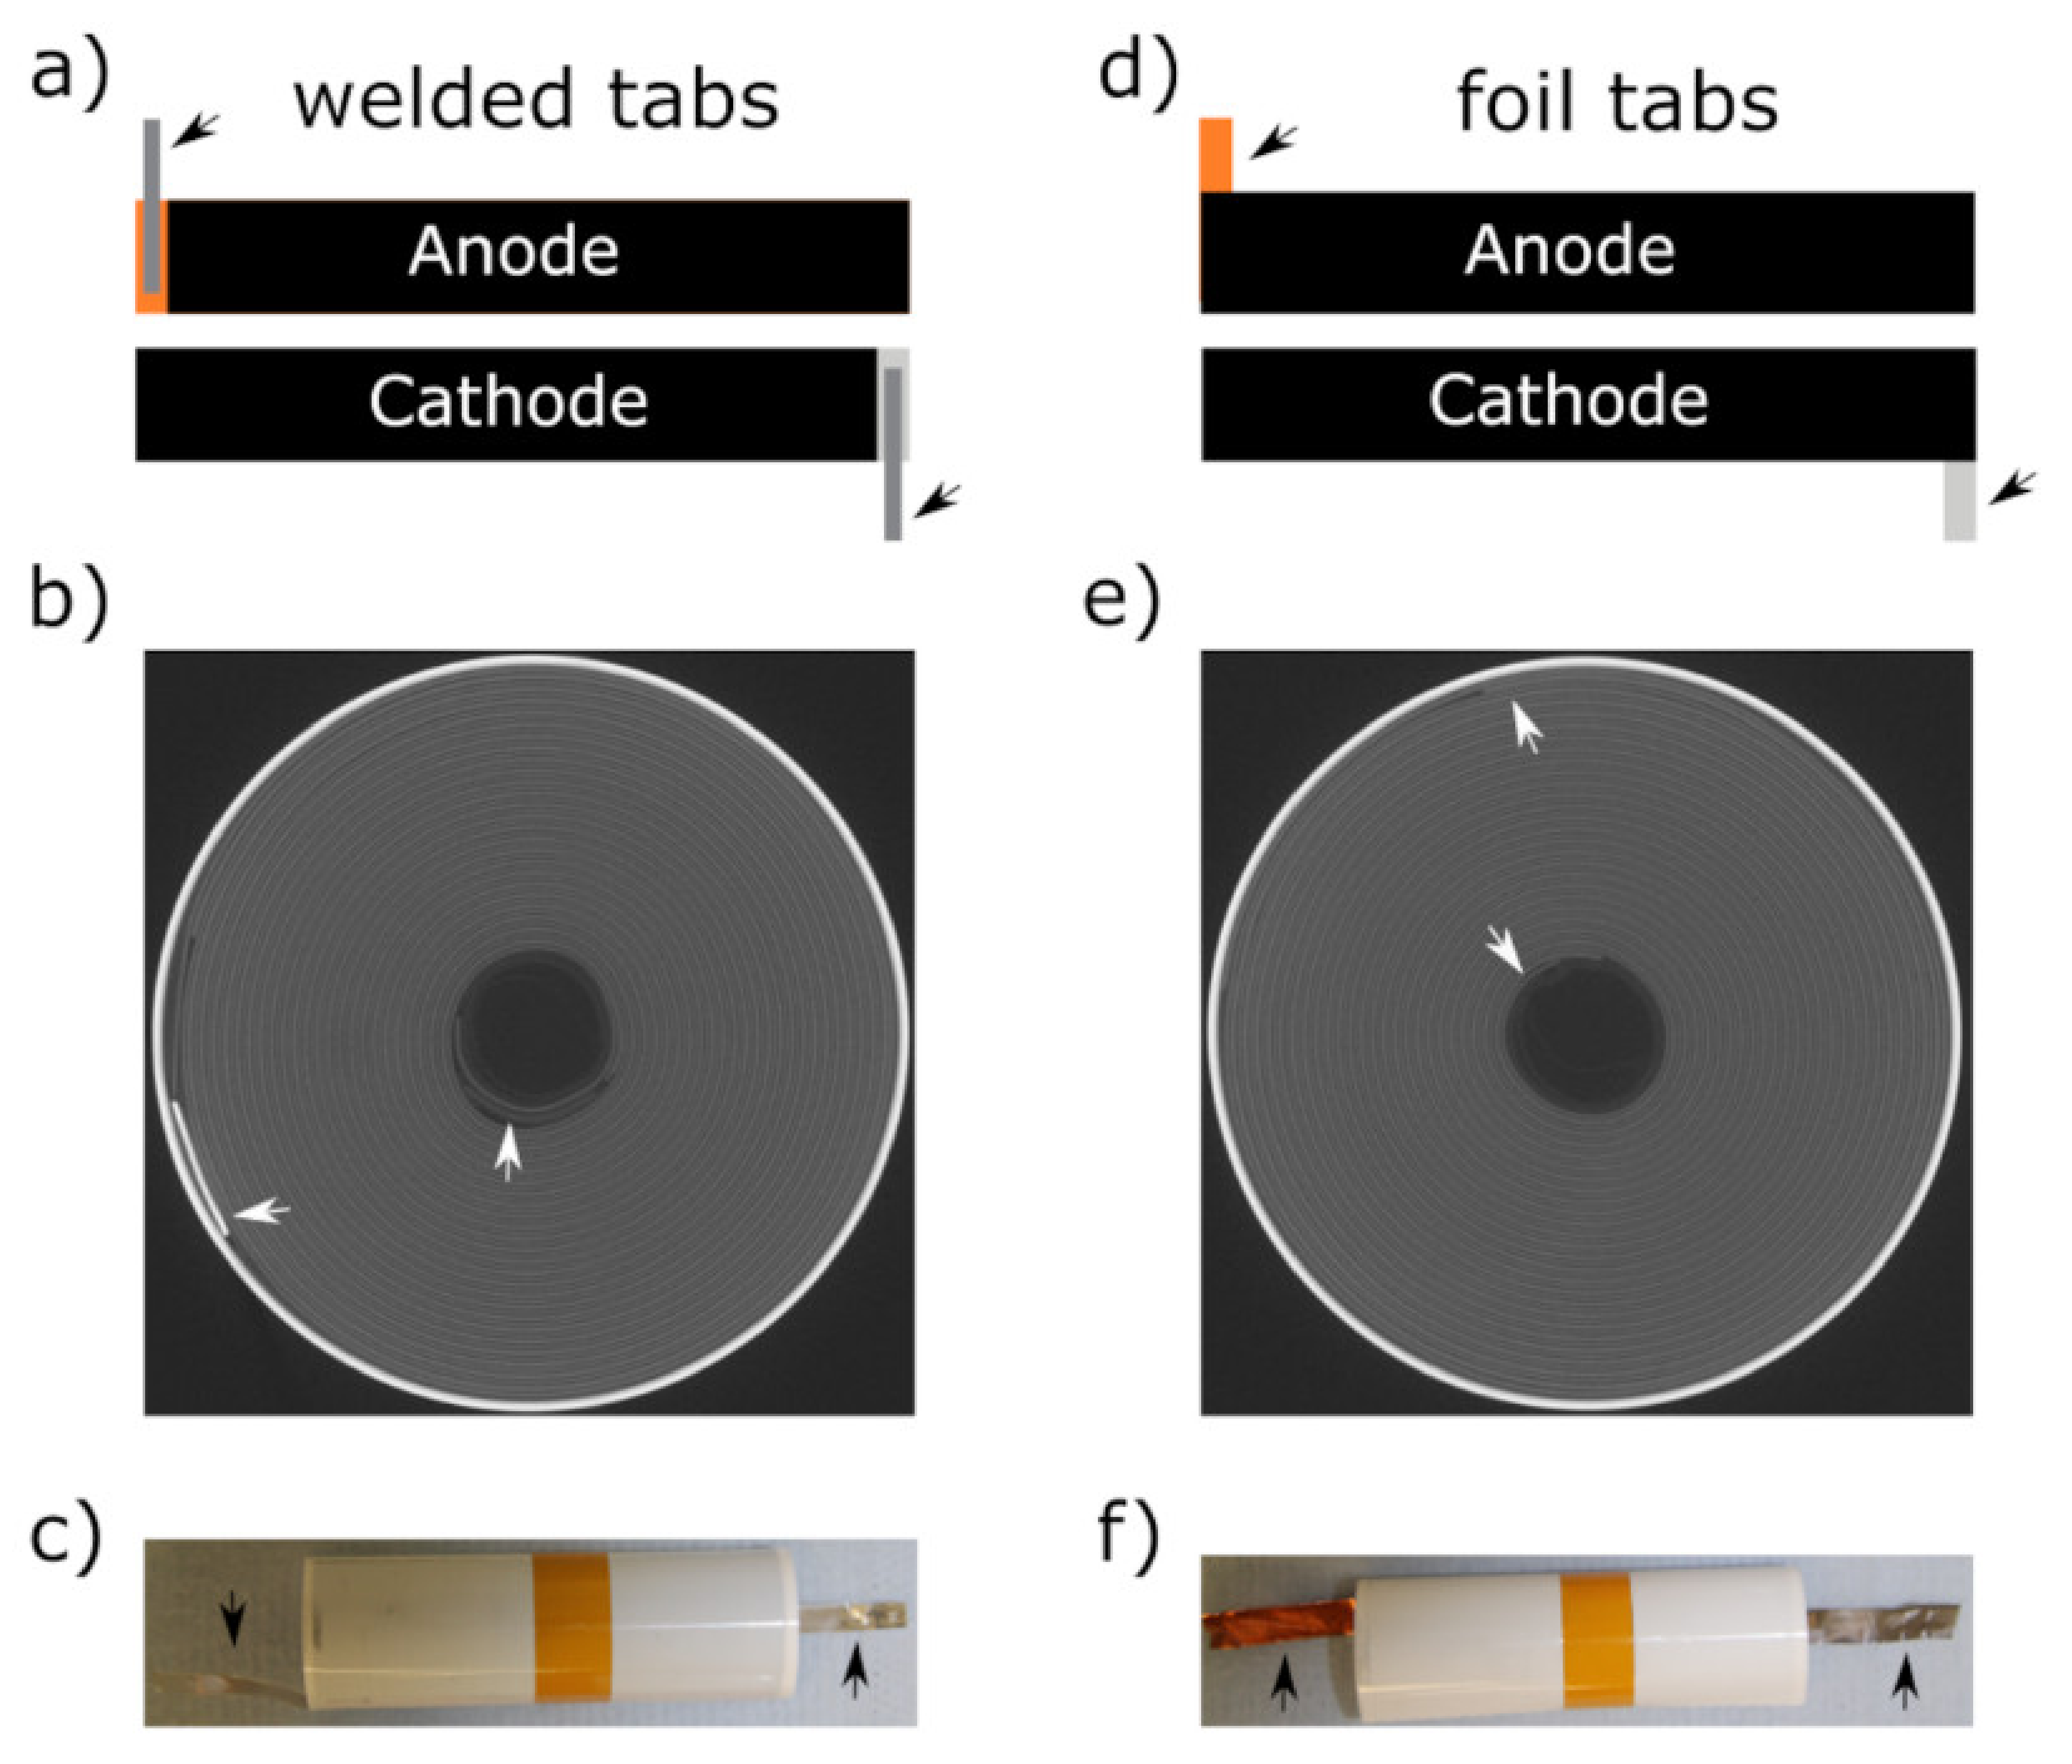
A 22% higher resistance, which can be explained by the lower cross-sections of the foil tabs (10–15 µm) compared to the welded tabs (130–150 µm).
-
A marginally lower C-rate capability for charging and discharging. The reason is most likely the increased resistance (see Equation (1)).
-
Most remarkably, an increase of cycle stability as shown by 14.4% more cycles and by 11.2% more total charge throughput until 80% capacity retention.
Impacts on the production processes are the laser-cutting process of the foil tabs compared to intermitted coating and tab welding in the case of welded tabs. The increased cycle stability of the cells with foil tabs furthermore reduces overall costs in applications since cells with longer cycle life have to be replaced less often. Further experimental investigations in this direction are underway in our labs.

Author Contributions

Conceptualization, R.-G.S., T.W., M.W.-M.; methodology, R.-G.S., D.B.; formal analysis, R.-G.S., T.W.; investigation, R.-G.S., D.B.; data curation, T.W., R.-G.S.; writing—original draft preparation, T.W.; writing—review and editing, R.-G.S., T.W.; visualization, T.W., D.B.; supervision, T.W., M.W.-M.; project administration, T.W., M.W.-M.; funding acquisition, T.W. All authors have read and agreed to the published version of the manuscript.

Funding

This research in the project RollBatt (03XP0245A) was funded by the German Federal Ministry of Education and Research (BMBF).

Institutional Review Board Statement

Not applicable.

Informed Consent Statement

Not applicable.

Conflicts of Interest

The authors declare no conflict of interest.

References

  1. Sturm, J.; Frank, A.; Rheinfeld, A.; Erhard, S.V.; Jossen, A. Impact of Electrode and Cell Design on Fast Charging Capabilities of Cylindrical Lithium-Ion Batteries. J. Electrochem. Soc. 2020, 167, 130505. [Google Scholar] [CrossRef]
  2. Waldmann, T.; Gorse, S.; Samtleben, T.; Schneider, G.; Knoblauch, V.; Wohlfahrt-Mehrens, M. A Mechanical Aging Mechanism in Lithium-Ion Batteries. J. Electrochem. Soc. 2014, 161, A1742–A1747. [Google Scholar] [CrossRef]
  3. Gorse, S.; Kugler, B.; Samtleben, T.; Waldmann, T.; Wohlfahrt-Mehrens, M.; Schneider, G.; Knoblauch, V. An Explanation of the Ageing Mechanism of Li-Ion Batteries by Metallographic and Material Analysis. Pract. Metallogr. 2014, 51, 829–848. [Google Scholar] [CrossRef]
  4. Quinn, J.B.; Waldmann, T.; Richter, K.; Kasper, M.; Wohlfahrt-Mehrens, M. Energy Density of Cylindrical Li-Ion Cells: A Comparison of Commercial 18650 to the 21700 Cells. J. Electrochem. Soc. 2018, 165, A3284–A3291. [Google Scholar] [CrossRef]
  5. Waldmann, T.; Scurtu, R.-G.; Richter, K.; Wohlfahrt-Mehrens, M. 18650 vs. 21700 Li-Ion Cells—A Direct Comparison of Electrochemical, Thermal, and Geometrical Properties. J. Power Sources 2020, 472, 228614. [Google Scholar] [CrossRef]
  6. McCleary, D.A.H.; Meyers, J.P.; Kim, B. Three-Dimensional Modeling of Electrochemical Performance and Heat Generation of Spirally and Prismatically Wound Lithium-Ion Batteries. J. Electrochem. Soc. 2013, 160, A1931–A1943. [Google Scholar] [CrossRef]
  7. Kosch, S.; Rheinfeld, A.; Erhard, S.V.; Jossen, A. An Extended Polarization Model to Study the Influence of Current Collector Geometry of Large-Format Lithium-Ion Pouch Cells. J. Power Sources 2017, 342, 666–676. [Google Scholar] [CrossRef]
  8. Samba, A.; Omar, N.; Gualous, H.; Capron, O.; Van den Bossche, P.; Van Mierlo, J. Impact of Tab Location on Large Format Lithium-Ion Pouch Cell Based on Fully Coupled Tree-Dimensional Electrochemical-Thermal Modeling. Electrochim. Acta 2014, 147, 319–329. [Google Scholar] [CrossRef]
  9. Waldmann, T.; Geramifard, G.; Wohlfahrt-Mehrens, M. Influence of Current Collecting Tab Design on Thermal and Electrochemical Performance of Cylindrical Lithium-Ion Cells during High Current Discharge. J. Energy Storage 2016, 5, 163–168. [Google Scholar] [CrossRef]
  10. Osswald, P.J.; Erhard, S.V.; Wilhelm, J.; Hoster, H.E.; Jossen, A. Simulation and Measurement of Local Potentials of Modified Commercial Cylindrical Cells: I. Cell Preparation and Measurements. J. Electrochem. Soc. 2015, 162, A2099–A2105. [Google Scholar] [CrossRef] [Green Version]
  11. Cheon, S.-E.; Kim, K.-H. Secondary Battery with Collector Plate and Electrode Package Thereof. U.S. Patent No. 20050277020A1, 15 June 2010. [Google Scholar]
  12. Tsuruta, K.; Dermer, M.E.; Dhiman, R. A Cell with a Tabless Electrode. U.S. Patent No. 20200144676A1, 7 May 2020. [Google Scholar]
  13. Sumihara, M.; Imai, T. Secondary Battery. International Patent No. 2009096188A1, 6 August 2009. [Google Scholar]
  14. Waldmann, T.; Rössler, S.; Blessing, M.; Schäfer, R.; Scurtu, R.-G.; Braunwarth, W.; Wohlfahrt-Mehrens, M. A Direct Comparison of Pilot-Scale Li-Ion Cells in the Formats PHEV1, Pouch, and 21700. J. Electrochem. Soc. 2021, 168, 090519. [Google Scholar] [CrossRef]
  15. Weiss, M.; Ruess, R.; Kasnatscheew, J.; Levartovsky, Y.; Levy, N.R.; Minnmann, P.; Stolz, L.; Waldmann, T.; Wohlfahrt-Mehrens, M.; Aurbach, D.; et al. Fast Charging of Lithium-Ion Batteries: A Review of Materials Aspects. Adv. Energy Mater. 2021, 11, 2101126. [Google Scholar] [CrossRef]
  16. Moulton, H.F. Current Flow in Rectangular Conductors. Proc. Lond. Math. Soc. 1905, 2, 104–110. [Google Scholar] [CrossRef] [Green Version]
  17. Newman, J.S.; Thomas-Alyea, K.E. Electrochemical Systems; Wiley-Interscience: Hoboken, NJ, USA, 2004; ISBN 0-471-47756-7. [Google Scholar]
  18. Meaden, G.T. Electrical Resistance of Metals; Springer: Berlin/Heidelberg, Germany, 1965; ISBN 978-1-4899-5717-7. [Google Scholar]
  19. Serway, R.A. Principles of Physics, 2nd ed.; Saunders Golden Sunburst Series; Saunders College Pub: Fort Worth, TX, USA, 1998; ISBN 978-0-03-020457-9. [Google Scholar]
  20. Piłatowicz, G.; Marongiu, A.; Drillkens, J.; Sinhuber, P.; Sauer, D.U. A Critical Overview of Definitions and Determination Techniques of the Internal Resistance Using Lithium-Ion, Lead-Acid, Nickel Metal-Hydride Batteries and Electrochemical Double-Layer Capacitors as Examples. J. Power Sources 2015, 296, 365–376. [Google Scholar] [CrossRef]
  21. Scipioni, R.; Jørgensen, P.S.; Graves, C.; Hjelm, J.; Jensen, S.H. A Physically-Based Equivalent Circuit Model for the Impedance of a LiFePO 4 /Graphite 26650 Cylindrical Cell. J. Electrochem. Soc. 2017, 164, A2017–A2030. [Google Scholar] [CrossRef] [Green Version]
  22. Broussely, M.; Herreyre, S.; Biensan, P.; Kasztejna, P.; Nechev, K.; Staniewicz, R. Aging Mechanism in Li Ion Cells and Calendar Life Predictions. J. Power Sources 2001, 97–98, 13–21. [Google Scholar] [CrossRef]
  23. Waldmann, T.; Iturrondobeitia, A.; Kasper, M.; Ghanbari, N.; Aguesse, F.; Bekaert, E.; Daniel, L.; Genies, S.; Gordon, I.J.; Löble, M.W.; et al. Review—Post-Mortem Analysis of Aged Lithium-Ion Batteries: Disassembly Methodology and Physico-Chemical Analysis Techniques. J. Electrochem. Soc. 2016, 163, A2149–A2164. [Google Scholar] [CrossRef]
  24. Smart, M.C.; Ratnakumar, B.V.; Whitcanack, L.; Chin, K.; Rodriguez, M.; Surampudi, S. Performance Characteristics of Lithium Ion Cells at Low Temperatures; IEEE: Piscataway Township, NJ, USA, 2002; pp. 41–46. [Google Scholar]
Figure 1. (a,d) Unwound anodes and cathodes jellyrolls of 21700 cells with (a) welded and (d) foil tabs. (b,e) X-ray CT images of 21700 cells with (b) welded and (e) foil tabs. (c,f) Photographs of jellyrolls (c) welded and (f) foil tabs. The arrows mark the positions of the tabs.
Processes 09 01908 g001
Figure 2. Processes in the production of 21700 cells on pilot-scale showing differences in the process steps leading to welded tabs (1a4a) and foil tabs (1b2b) and general steps (512).
Processes 09 01908 g002
Figure 3. Comparison of cell performance of pilot-scale 21700 Li-ion cells with foil tabs vs. conventionally welded tabs. (a) Discharge voltage curves of discharge rate capability test. (b) Discharge areal capacity for formation, discharge and charge C-rate capability tests.
Processes 09 01908 g003
Figure 4. (a) Resistance increase and (b) capacity retention during long-term cycling aging as a function of cycles and (c) as a function of charge throughput (discharge). The black solid lines in (a) are linear fits from cycle 1 to 400 and cycle 600 to 1300. The red dashed lines in (a) are fitted polynomial functions of second order.
Processes 09 01908 g004
Figure 5. Voltage curves of fresh (cycle 2) and aged (cycle 1200) cells with welded and foil tabs.
Processes 09 01908 g005
Table 1. Resistance calculation for different types of tabs for the tab volume from the border of the coated electrode area to the end of the tab (see step 4a in Figure 2).
Welded TabsFoil Tabs
AnodeCathodeAnodeCathode
materialNiAlCuAl
thickness/mm0.150.130.0100.015
Atab/mm24 × 0.15 = 0.64 × 0.13 = 0.526 × 0.01 = 0.066 × 0.15 = 0.09
ltab/mm15151515
ρ/µΩ cm7 [18]2.82 [19]1.7 [18,19]2.82 [19]
Rtab/mΩ1.750.814.254.70
Publisher’s Note: MDPI stays neutral with regard to jurisdictional claims in published maps and institutional affiliations.

