1. Introduction
The development of variable renewable energies (e.g., solar energy) relies on prospecting energy storage systems to meet energy needs and smooth peaks of consumption. Thermal energy storage (TES) is a key technology that satisfies such needs. There exist three types of TES: sensible [
1], latent [
2], and thermochemical heat.
The scope of our study is related to the domestic heat supply or hot water. For such applications, one must consider utilities that are freely available in buildings; water is generally best suitable. According to [
3], for water sorption systems, the volume required to store 1850 kWh is respectively 34, 20, and 1–10 m
3 for sensible, latent, and thermochemical adsorption storage systems, respectively. Thermochemical systems are therefore highly promising.
Thermochemical systems are based on adsorption phenomena and can be divided into two types: physical and chemical. Physical adsorption is a surface phenomenon that transfers molecules from a fluid bulk phase to a solid surface with Van der Waals forces, whereas during chemical adsorption, the adsorbate is subject to covalent forces and also to chemical reaction. Both phenomena are exothermic.
The exothermicity of these phenomena enables the release of heat that can be stored and further re-used to reduce demand during peak hours of energy consumption. During adsorption (discharging step), the column is fed with a humidified gas flow—air and water (adsorbate). The latter is adsorbed in a packed bed of pellets of adsorbent material. Through desorption, commonly called the charging step, dry gas at high temperature is fed to the column. High temperatures are required to this inlet stream due to the endothermicity of desorption. The air flow then flows out the adsorbed water from the column.
In the literature review, thermochemical systems have been experimentally and numerically tested to meet energy needs for short- and long-term storage applications. Different types of studies have been promoted to identify optimum adsorbent materials, sets of operating conditions, and process designs.
Table 1 gathers information on several experimental setups for thermochemical storage with water adsorption. Available data was retrieved from the literature regarding scaling, setup configuration (open or closed system), application (short or long term), adsorbent screening, and influence of operating conditions (gas flow, inlet charging, and discharging temperature, etc.).
From
Table 1, one can identify that the maturity level of thermochemical systems has risen over the last few decades. Systems at laboratory, pilot, and prototype scale have been tested. An example of a prototype system is given in [
4], where the authors tested heat storage during winter in a school in Munich and cooling of an adjacent Jazz club during summer. When supplying heat to the school building during times of peak power demand, the district heating system was disconnected, and stored heat was used instead. For that matter, 7000 kg of zeolite 13X were used.
One of the major issues in thermochemical systems concerns the selection of the adsorbate and the adsorbent. For residential heat storage applications, it is recommended to use an adsorbate molecule that is freely available. We have seen that the best choice is water that is supplied with air, which is also freely available.
The water/adsorbent pairs have long been investigated. A full characterization of adsorbents with nitrogen physisorption, thermogravimetry, and differential thermogravimetry techniques gives an estimation of the adsorbent textural properties, adsorption heat, and equilibrium conditions. A resume of the main adsorbent materials used in thermochemical heat storage is available in [
3], and from this we can list SG, Z (natural, 4A, 5A, 10X, 13X), aluminophosphate, silico-aluminophosphate (SAPO), and metal organic framework (MOF). Adsorbent screening is an important matter for the development of heat storage systems and has been documented in the literature [
5,
6,
7,
8,
9,
10].
Table 1 contains non-impregnated and impregnated adsorbents such as zeolites (Z), activated aluminas (AA), aluminosilicates (AS), and silica gel (SG), tested under real system conditions.
To compare different adsorbent materials, all system conditions must be fixed. This is why the following observations compare data from the same projects. For instance, in
Table 1, the U. Ottawa project [
5] uses a combination of Z13X with AA. The use of AA with Z13X allows an increase of the heat discharged,
Edis, from 154 to 197 kWh/m
3 because AA material has a greater heat of adsorption. In the work of [
8], a comparison of AA + Z13X adsorbents with differing amounts of AA also shows an increase of
Edis for higher amounts of AA.
The use of impregnated adsorbents increases the exothermicity of the system because both adsorption and chemical reactions (i.e., chemical adsorption) occur. This is also observed in the project of BMWi from
Table 1 [
7], where the energy discharged for a Z NaX allowed the attainment of 110 against 128 kWh/m
3 for a Z NaX(Mg). The performance of different impregnation compounds is studied on the U. Ottawa project. They impregnated an AA + Z13X adsorbent with MgSO
4, MgCl
2, and LiCl and compared the heat discharged, which was, respectively, 250, 235, and 272 kWh/m
3. A maximum
Edis was obtained by the LiCl impregnation. Another approach was that of Hongois [
6], which identified the optimum content of MgSO
4 impregnated in Z13X based on thermogravimetric and calorimetric analysis. They found an optimum content at 15% wt. among 0–20% wt. When using impregnated adsorbent materials, the appearance of salt clogging may decrease the adsorbent performance and is one main drawback of systems under chemical adsorption.
Two types of adsorption reactors have been studied: open or closed reactors (O/C). With open reactors, the inlet stream (humidified air) is heated by available energy, for instance, renewable energy (e.g., solar energy) and waste energy recovery from incinerators, whereas, with closed reactors, a condenser and an evaporator are added to the system and the fluid is carried in a closed loop. In the work of Kuznik [
11], power density was plotted as a function of charging temperature for different thermochemical systems. They concluded that open reactors exhibit higher energy and power densities compared to closed ones. Different reactor geometries are also discussed in the literature, from simple packed columns to more complex systems. For instance, the work of Zettl et al. [
12] highlights a study that promoted a rotating prototype.
Each system presented in
Table 1 has been studied at different operating conditions in order to reach a maximum energy density. A large range of air flows has been tested [
5,
13]. Different charging temperatures have also been studied. Adsorbent residual water content contained in the adsorbent particles is generally assessed, as well as the duration of the charging process. Cycling thermal stability has also been studied [
6,
13]. In
Table 1, the corresponding maximum heat discharged by each system is also available. Values between
and
can be observed (the symbol * from
Table 1 refers to calculated values using available data from these systems).
Numerical modelling of thermochemical devices can be helpful to test experimental to simulated dynamic data [
8,
14]. It can also be helpful to perform parametric studies in order to investigate suitable operating conditions and geometrical configurations [
15,
16], and to predict the amount of energy stored. Ideally, dynamic modelling can be coupled to an optimization tool. The latter can be used to identify the set of operating conditions and design parameters, resulting in a maximum vapor uptake and/or maximum energy density of actual systems [
16] or to fulfil energy needs during a period of time, given the application and the energy source for charging.
The studied storage system is based on physical adsorption occurring in a packed bed column with humid air and zeolite 13X. The setup configuration is that of an open system. This work aims to study the effect of operating conditions and design parameters (crystal and adsorbent particle size) on the energy performance features of the storage system. The energy features are as follows: the reached temperature peak and the amount and the duration of heat released. These features can be of great interest when applying and optimizing an open adsorption storage system to domestic heat supply or hot water. The adsorbent material selected is a zeolite 13X with no impregnation. The choice to test a system under physical adsorption instead of chemical adsorption has been made because it appears to be more reliable and reproducible. Additionally, we believe that a system based on physical adsorption can furnish the amount of energy required for domestic heat supply.
A modelling approach based on mass and energy conservation with local fluid properties and local mass and heat transfer properties has been developed. We fit the developed model to available data retrieved from the literature review undertaken by Tatsidjodoung et al. [
17]. We then discuss the sensitivity of our model parameters to concentration and temperature profiles, as well as the heat stored and the duration. Future work shall consist of developing an optimization tool to find the set of parameters that can fulfil energy needs in the domestic heat supply of an actual system.
This paper is divided in four sections.
Section 1 gives an overview of thermochemical systems and a resume of studied experimental and modelling systems. The
Section 2 is dedicated to the description of the dynamic model with mass and heat conservation balances and to the assessment of mass and heat transfer properties, as well as the selection of the equilibrium model. In
Section 3, model results are available concerning model fitting, mass transfer resistance, and a parametric study on operating conditions and design parameters.
Section 4 offers the major conclusions and perspectives.
Table 1.
Energy storage for thermochemical systems. Information on different experimental setups.
Table 1.
Energy storage for thermochemical systems. Information on different experimental setups.
| Project/Institution | Scale | O/C | S/L | Adsorbent | mads (kg) | Qair (m3/h) | Charge | Discharge | Reference |
|---|
| Tin (°C) | Tin (°C) | Tout (°C) | Edis (kWh/m3) |
|---|
| U. Ottawa | lab | O | L | Z13X | - | 0.48–1.44 | 130–250 | 25 | 50 | 154 | [5] |
| Z NaLSX | - | 0.48–1.44 | 130–250 | 25 | 50 | 147 | [5] |
| AA + Z13X | - | 0.48–1.44 | 130–250 | 25 | 50 | 160 | [5] |
| AA + Z13X | 0.0530 | 0.48–1.44 | 80–250 | 25 | 75 | 197 | [5,18] |
| AA + Z13X(MgSO4) | 0.1603 | 1.44 | 250 | 25 | - | 250 | [19] |
| AA + Z13X(MgCl2) | 0.1491 | 1.44 | 250 | 25 | - | 235 | [19] |
| AA + Z13X(LiCl) | 0.1505 | 1.44 | 250 | 25 | - | 272 | [19] |
| U. Ottawa | lab | O | L | Pure AA | 0.0700 | 1.44 | 250 | 25 | 75 | 226 | [8] |
| AA(alkaline) |
| AA + Z13X |
| AA + Z13X(alkaline) |
| SCUT | lab | O | L | SG(CaCl2) | 40.0 | - | 90 | 15 | 45 | 50 * | [10] |
| BMWi | lab | C | L | Z NaX | 1.0–1.5 | - | 180 | 27 | 50 | 110 | [7,20] |
| Z NaX(Mg) | 1.0–1.5 | - | 180 | 27 | - | 128 |
| Z NaA-60(Ca) | 20.0 | - | 180 | 27 | - | 116 |
| Z(LiX) | 1.0–1.5 | - | 180 | 27 | - | 160 |
| SG | 1.0–1.5 | - | 180 | 27 | - | 94 |
| AS(CaCl2) | 1.0–1.5 | - | 120 | 27 | - | 172 |
| INSA Lyon | lab | O | L | Z13X(MgSO4) | 0.2 | 0.48 | 150 | 25 | 55 | 166 | [6] |
| ZAE Bayern | prototype | O | L | Z13X | 7000.0 | - | 130–180 | 25 | 100 | 124 | [4] |
| Modestore | prototype | C | L | SG | 200.0 | - | 88 | 25 | 40 | 50 | [21] |
| 808.0 | - | - | - | - | 123 | [22] |
| RWTH Aachen U. | lab | C | L | Z13X | 13.2 | 0.12 | 150 | 10 | 110 | 178 * | [23] |
| ASIC/Flow-TCS | pilot | O | L | Z4A | 53.0 | 140 | 180 | 25 | 55 | 148 | [12] |
| ZMSX | 50.0 | 140 | 180 | 25 | 55 | 154 |
| E-hub | pilot | C | L | Z5A | 41.0 | - | 103 | 20 | 52 | 47 * | [24] |
| STAID | pilot | O | S | Z13X | 80.0 | 120–180 | 120–180 | 20 | 57 | 180 | [13,17] |
| RWTH Aachen U. | lab | C | S/L | Z13X | 10.0 | - | 175–250 | - | 70 | 194 * | [25] |
| SolSpaces | prototype | O | L | Z13X | 2924.0 | - | - | - | - | 163 | [9] |
2. Model Description
The considered system is locally defined by five state variables in the gaseous phase: pressure, temperature, velocity, mass concentration of water and dry air. The momentum balance is not considered and, instead, a plug flow model and a pressure drop empirical correlation are considered. The plug flow model accounts for axial dispersion so that the fluid is perfectly mixed in the radial direction of the column.
In order to obtain these five local variables within the gaseous phase (at a given z, z being the axial position in the adsorption column), the following equations have to be solved: two partial mass balances (for water and dry air), heat balance in the gas phase, a state equation in the gas phase, and a pressure drop empirical correlation.
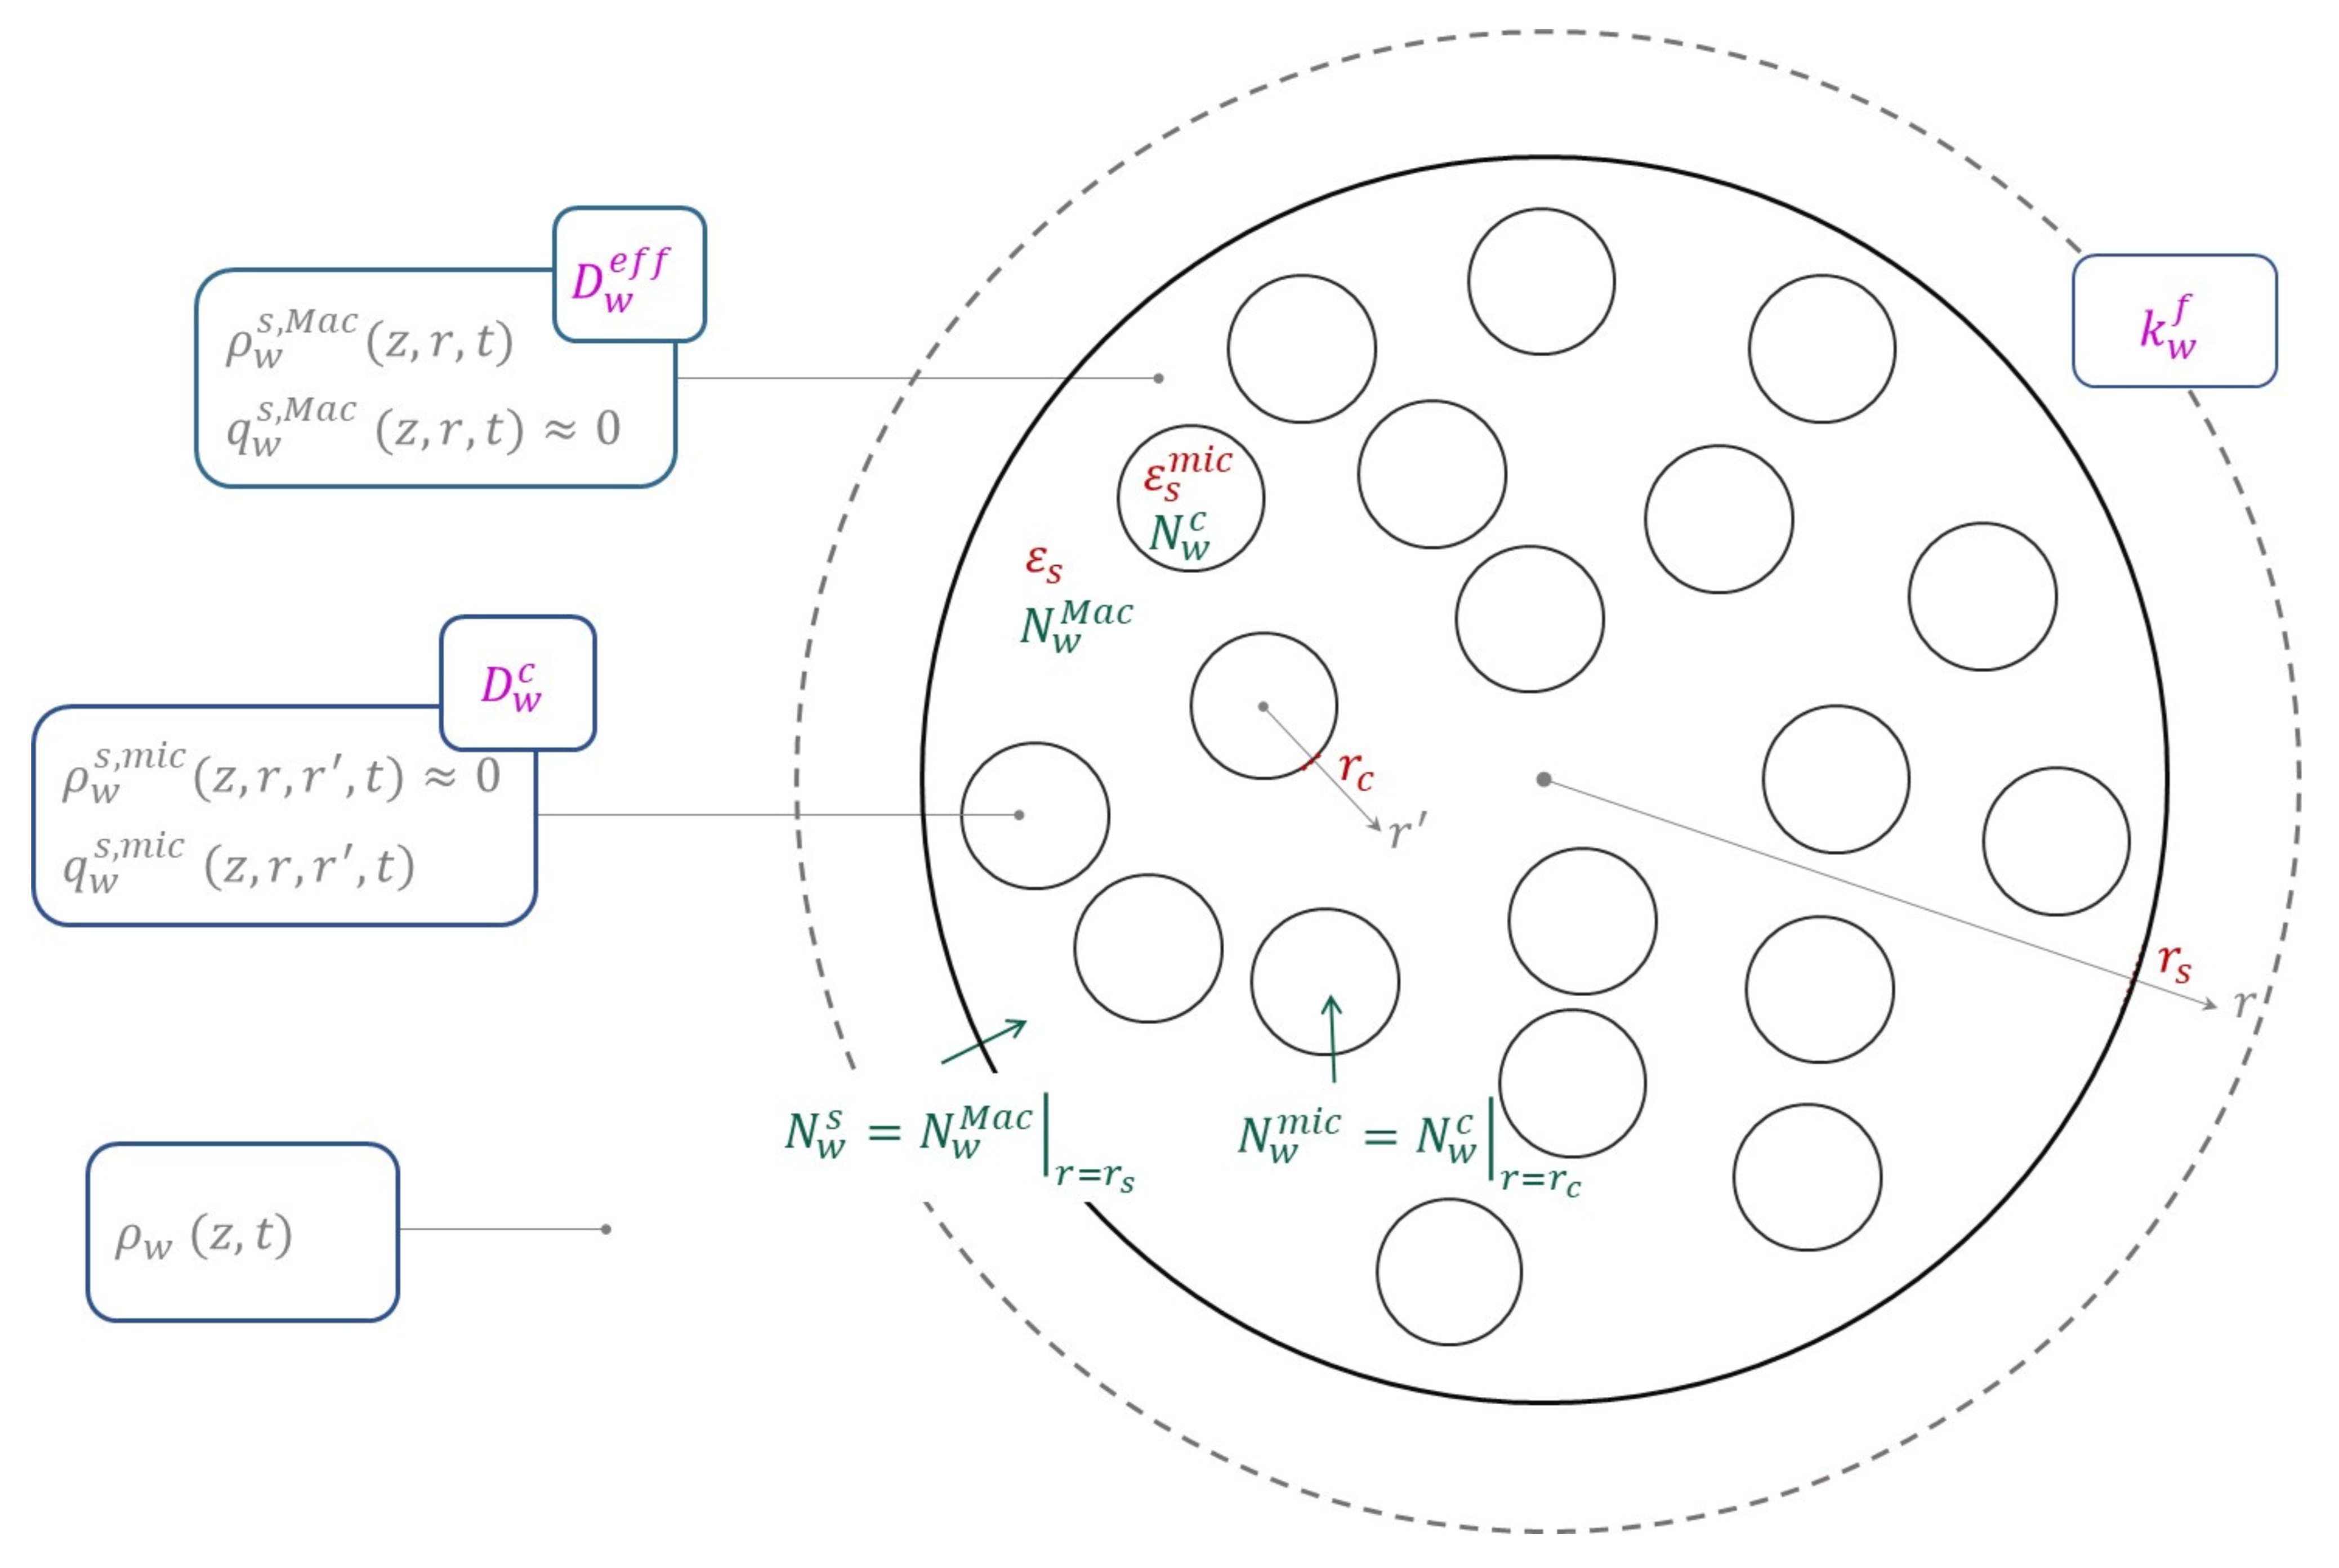
The mass and heat balances consider mass and heat source terms between the bulk gas phase and the adsorbent particle. A zeolite particle is constituted by a macroporous binder phase and microporous crystals, as can be seen in
Figure 1. This represents a spherical bi-disperse particle with spherical microporous crystals. Within the particle, there are gradients of temperature and mass concentration not only in the particle porosity and in the solid at the macroporous domain but also at the microporous domain. As mass transfer occurs due to concentration and temperature gradients between the gas phase within the particle voids (macroporous domain) and the adsorbed phase (microporous domain), the interface between macroporous and microporous domains is assumed at thermodynamic equilibrium. Hence, an equilibrium model must be considered.
A common assumption to overcome such time-consuming resolution of a complete model is to consider a pseudo-homogeneous model, where temperature and water concentrations are uniform within the particle. The model can then be simplified by using a pseudo-homogeneous model—the Linear Driving Force (LDF) model. The next section first gives an introduction where the complete model is described, followed by the simplification used with the LDF model.
In the developed model, the conservation of mass and heat in the adsorption column are considered. The chosen state equation is the ideal gas law. The pressure drop is neglected and assumed to be uniform in the column, which is a rather reasonable hypothesis because, according to [
26], at low Reynolds numbers, a low pressure drop is observed within packed beds. The system of equations resulted in a DAE system that is solved by ode15 s from Matlab
®. Local fluid, mass, and heat transfer properties have been used, which are formulated in the next sections. These mass and heat transfer properties depend on hydrodynamic variables (interstitial velocity), geometric parameters, and fluid properties. Fluid properties have been varied with species concentrations and fluid and solid temperatures in order to account for their variation with time and space. The estimation of mass, heat, and fluid properties is based on empirical correlations and theoretical models.
2.1. Mass Conservation
The partial mass balance for water species in the bulk gas phase is described in Equation (1). Matter accumulation within the bulk gas phase, convection, axial dispersion, and a source term are considered. The source term describes mass transfer exchange between the bulk fluid phase and the adsorbent particle due to water adsorption.
with
being the exchanged flux density between the bulk gas phase and the adsorbent particle at the particle surface.
At the boundary conditions, we have:
a fixed concentration at the column inlet;
at the column outlet, .
The partial mass balance of dry air in the gas phase should consider the same mass conservation as described for water—Equation (1)—except for the mass transfer term, because water is the only species that is assumed to be adsorbed. In this work, the partial mass balance of dry air is given by considering a constant flow for dry air, as described in Equation (2).
For intra-particles within a bi-disperse spherical particle, one must consider mass conservation on both macroporous and microporous domains (crystal particles), as described, respectively, in Equations (3) and (6) (cf.
Figure 1).
with
being the diffusive flux density in the macroporous domain and
being the exchanged flux density at the interface between the macroporous and the microporous domain.
and
are, respectively, the water mass concentration in the macroporous domain within the fluid phase and within the adsorbed phase.
The following boundary conditions represent the macroporous mass balance:
- 2.
Null mass transfer at the center of the macroporous domain —Equation (5).
The microporous mass balance is given as follows:
with
the diffusive flux density in the microporous domain.
The corresponding boundary conditions are:
- 2.
Null mass transfer at the center of the crystal particles—Equation (8).
One generally neglects adsorption occurring in the macroporous domain, resulting in
. Additionally, molecules within the microporous domain are considered to be in the adsorbed phase, and so,
. Equations (3) and (6) turn into Equations (9) and (10).
With these assumptions,
, the diffusive flux density in the macroporous domain, and
, the diffusive flux density in the microporous domain, are expressed as follows:
- 3.
A third boundary condition exists with respect to the thermodynamic equilibrium at the interface between the macroporous and microporous domains—Equation (13).
The numerical resolution of Equations (9) and (10) requires the discretization of two spatial dimensions within the particle adsorbent, which results in long computation times. As we intend, in future work, to apply our system to a real case scenario and optimize operating and design parameters, a simplified and commonly used model is applied for the adsorption kinetics—the global Linear Driving Force (LDF) model.
The LDF model was developed by [
27] and extended to bi-disperse particles. This model considers an average concentration,
, within the adsorbent particle instead of performing spatial discretization on both macropore and micropore dimensions. Thus, the partial mass balance for the gas phase from Equation (1) becomes:
In our system, we have considered the LDF model with respect to a time variation of the average concentration in the adsorbed phase. This is given by the difference between
, the concentration in the adsorbed phase in equilibrium with the fluid phase, and
, the average concentration in the adsorbed phase, as described in Equation (15). The global LDF coefficient,
, accounts for both external and internal mass transfer, as described in Equation (17). A detailed description of these resistances is given in the section below.
During adsorption, the initial conditions for bulk and adsorbed fluid concentrations are the residual concentrations reported in [
17]. At the column inlet, a step concentration is taken. A fixed interstitial velocity is considered at the column inlet.
2.1.1. Mass Transfer Properties
Axial dispersion is due to molecular diffusion within the bulk phase and to friction resistance between the extra-particle fluid phase and the adsorbent particles. Equation (16) expresses the axial dispersion coefficient,
, as a function of the molecular diffusion,
, interstitial velocity,
, and particle diameter,
[
28].
with
reported in Equation (23).
The global mass transfer resistance from the LDF model comprises three resistances in series (cf.
Figure 1). It couples external mass transfer, internal diffusion within macropores, and intracrystalline diffusion within micropores [
29]. Mass transfer can hence be controlled by external, macropore, or micropore diffusion, but contributions from each resistance occur. With Equation (17), it is possible to estimate the global mass transfer coefficient,
.
From Equation (17), one uses an equilibrium constant,
, which takes the form:
The external mass transfer resistance occurs within the film thickness covering the adsorbent particle. The film mass transfer coefficient,
, is estimated with the non-dimensional Sherwood number. The following correlation is applied to packed beds with gas or liquid phases [
30]:
with the non-dimensional numbers, Reynolds and Schmidt, defined as follows:
Internal diffusion within macropores, also called pore diffusion,
, couples Knudsen and molecular diffusion. Equation (22) expresses the macropore diffusion resistance that couples two resistances in series [
29].
The molecular diffusion coefficient for a binary gas mixture, A/B
, can be given by the Chapman–Enskog Equation (23), which is based on the Kinetic Theory of Gases [
31]:
with
,
,
,
taken from [
32,
33].
is taken in
.
Knudsen diffusivity is estimated taking correlation (27) from [
29].
Molecules diffusing within macropores are subject to the geometrical constraints of the adsorbent solid structure. These constraints are accounted for by the tortuosity factor. The correction of macropore diffusion,
, by the tortuosity and porosity leads to the effective diffusion coefficient,
, as defined in Equation (28).
Macroporous and external coefficients follow well-known empirical and theoretical laws that are generally accepted by the scientific community. When studying intracrystalline diffusion, greater disparities are observed and no reliable theory is available to predict
[
34]. The estimation of the intracrystalline diffusivity is usually obtained by Equation (29), which is temperature dependent.
Intracrystalline diffusion within micropores is analogous to hindered or surface diffusion where molecules jump between adjacent cavities. This phenomenon has been investigated by several authors, who have measured
using microscopic and macroscopic techniques.
Table 2 reports some of these techniques [
35,
36].
Macroscopic techniques measure the flux into or through the porous material, and a transport diffusivity is generally estimated based on a concentration gradient. Microscopic methods all measure self-diffusivities. Among microscopic techniques, one can find direct and indirect estimations of
that measure the average time between molecular jumps. It is commonly accepted that microporous techniques provide the most interesting information. In [
34], it is recommended to couple microscopic and macroscopic techniques, as well as to perform numerical assessment.
Intracrystalline diffusivity has been studied for several molecule/material pairs, yet little and consistent information on this diffusivity is available for the zeolite 13X/water pair. Diffusivities from the literature sometimes differ by orders of magnitude, especially when comparing results from macroscopic and microscopic techniques [
34,
37].
Water diffusion within zeolite 13X was studied in the work of Hossein [
37] by a gravimetric technique based on tracer exchange measurements (D
2O/H
2O) to estimate self-diffusivities. The studied system is controlled by intracrystalline diffusion regime, which enables the estimation of
. In [
37],
is estimated at different temperatures and compared to other systems (test I and IV).
Table 3 gathers part of the available parameters for which
is expressly recalculated at
, so that the diffusivities can be compared at different crystal sizes.
As can be seen from
Table 3, for the same material, tests I and IV give different values of
by an order of magnitude of
. For the same materials and looking at the ratio of
, one should observe a similar ratio, yet
greatly diverges, even for tests II and III that were obtained by the same technique. A similar order of magnitude is yet observed for tests III and IV.
The variation of diffusivity with the pore to molecule radius ratio described in [
29], pp. 86, indicates that the order of magnitude for intracrystalline diffusivity ranges from
to
m
2/s. Recent studies on the pairs water/Z4A and water/Z5A [
38] show
coefficients ranging from
to
at
. They observed that these values were sensitive to interactions between molecule/adsorbent, especially for Z5A, which has a decreased value of
.
Due to the lack of consistency regarding
experimental data,
is used as a fitting parameter in our model. An order of magnitude of
(test IV at
and
) is taken and seems to be consistent with values reported in [
16].
2.2. Heat Conservation
As mentioned above, gradients of temperature occur within both macroporous and microporous domains. In our model, we have assumed that the temperature was uniform in the particle. Equation (30) describes the heat balance in the gas phase. The left side of Equation (30) accounts for heat accumulated in the fluid phase within the bed voids. The right side considers advection and convection between the bulk fluid phase and the adsorbent particles taking
. Fluid density is expressed by Equations (31) and (32), with
being the molar fraction of water that is given in Equation (33).
Intra-particle heat transfer is described in Equation (34). The left side describes heat accumulation from the solid phase and from the adsorbed water phase. Heat accumulation from the fluid within the particle porosity is neglected. The right side of Equation (34) contains a source term for the heat released/consumed by means of water sorption and an additional source term that describes heat transfer between the fluid phase and the adsorbent particles, again taking
.
At the boundary conditions, we have;
fixed temperatures for both fluid and solid at the column inlet;
at the outlet, .
During adsorption, initial conditions for both fluid and solid temperature are constant over . During desorption, temperature values at the end of the adsorption step are taken as initial values for the desorption step, except at the inlet, where the temperature is equal to the drying temperature.
2.2.1. Heat Transfer Properties
The convective coefficient,
, accounting for the heat exchange between the bulk phase and the adsorbent particles, is commonly evaluated by Equation (35). However, this heuristic correlation obtained by [
39] is not valid under the operating conditions of our system due to the existence of very low Reynold number values. Equation (36) is rather used [
40]. It relates the Nusselt number (left term), with the Reynolds and Prandtl numbers for bed porosities between 0.2 and 0.9.
2.3. Fluid Properties
Information relative to the estimation of fluid properties in the vapor phase was retrieved from [
41]. In the work of [
41], a system of moist air (binary mixture) within a relative humidity range of 0 to 100% is investigated. Available information on the evaluation of thermophysical and transfer properties (temperature-dependent) is given. In our model, we have considered an ideal gas mixture and have locally defined viscosity,
, and thermal conductivity,
. The specific heat capacity,
and
, were averaged over the range of operating temperatures.
Liquid water specific isobaric heat capacity,
, was accounted for by the correlation given in [
42]. Isochoric specific heat capacities in the gas phase (
and
) were calculated given the Mayer relation and taking the previously calculated isobaric specific heat capacities (
and
).
2.4. Equilibrium Model and Isosteric Heat of Adsorption
We dispose very little information on the zeolite used in the work of Tatsidjodoung et al. [
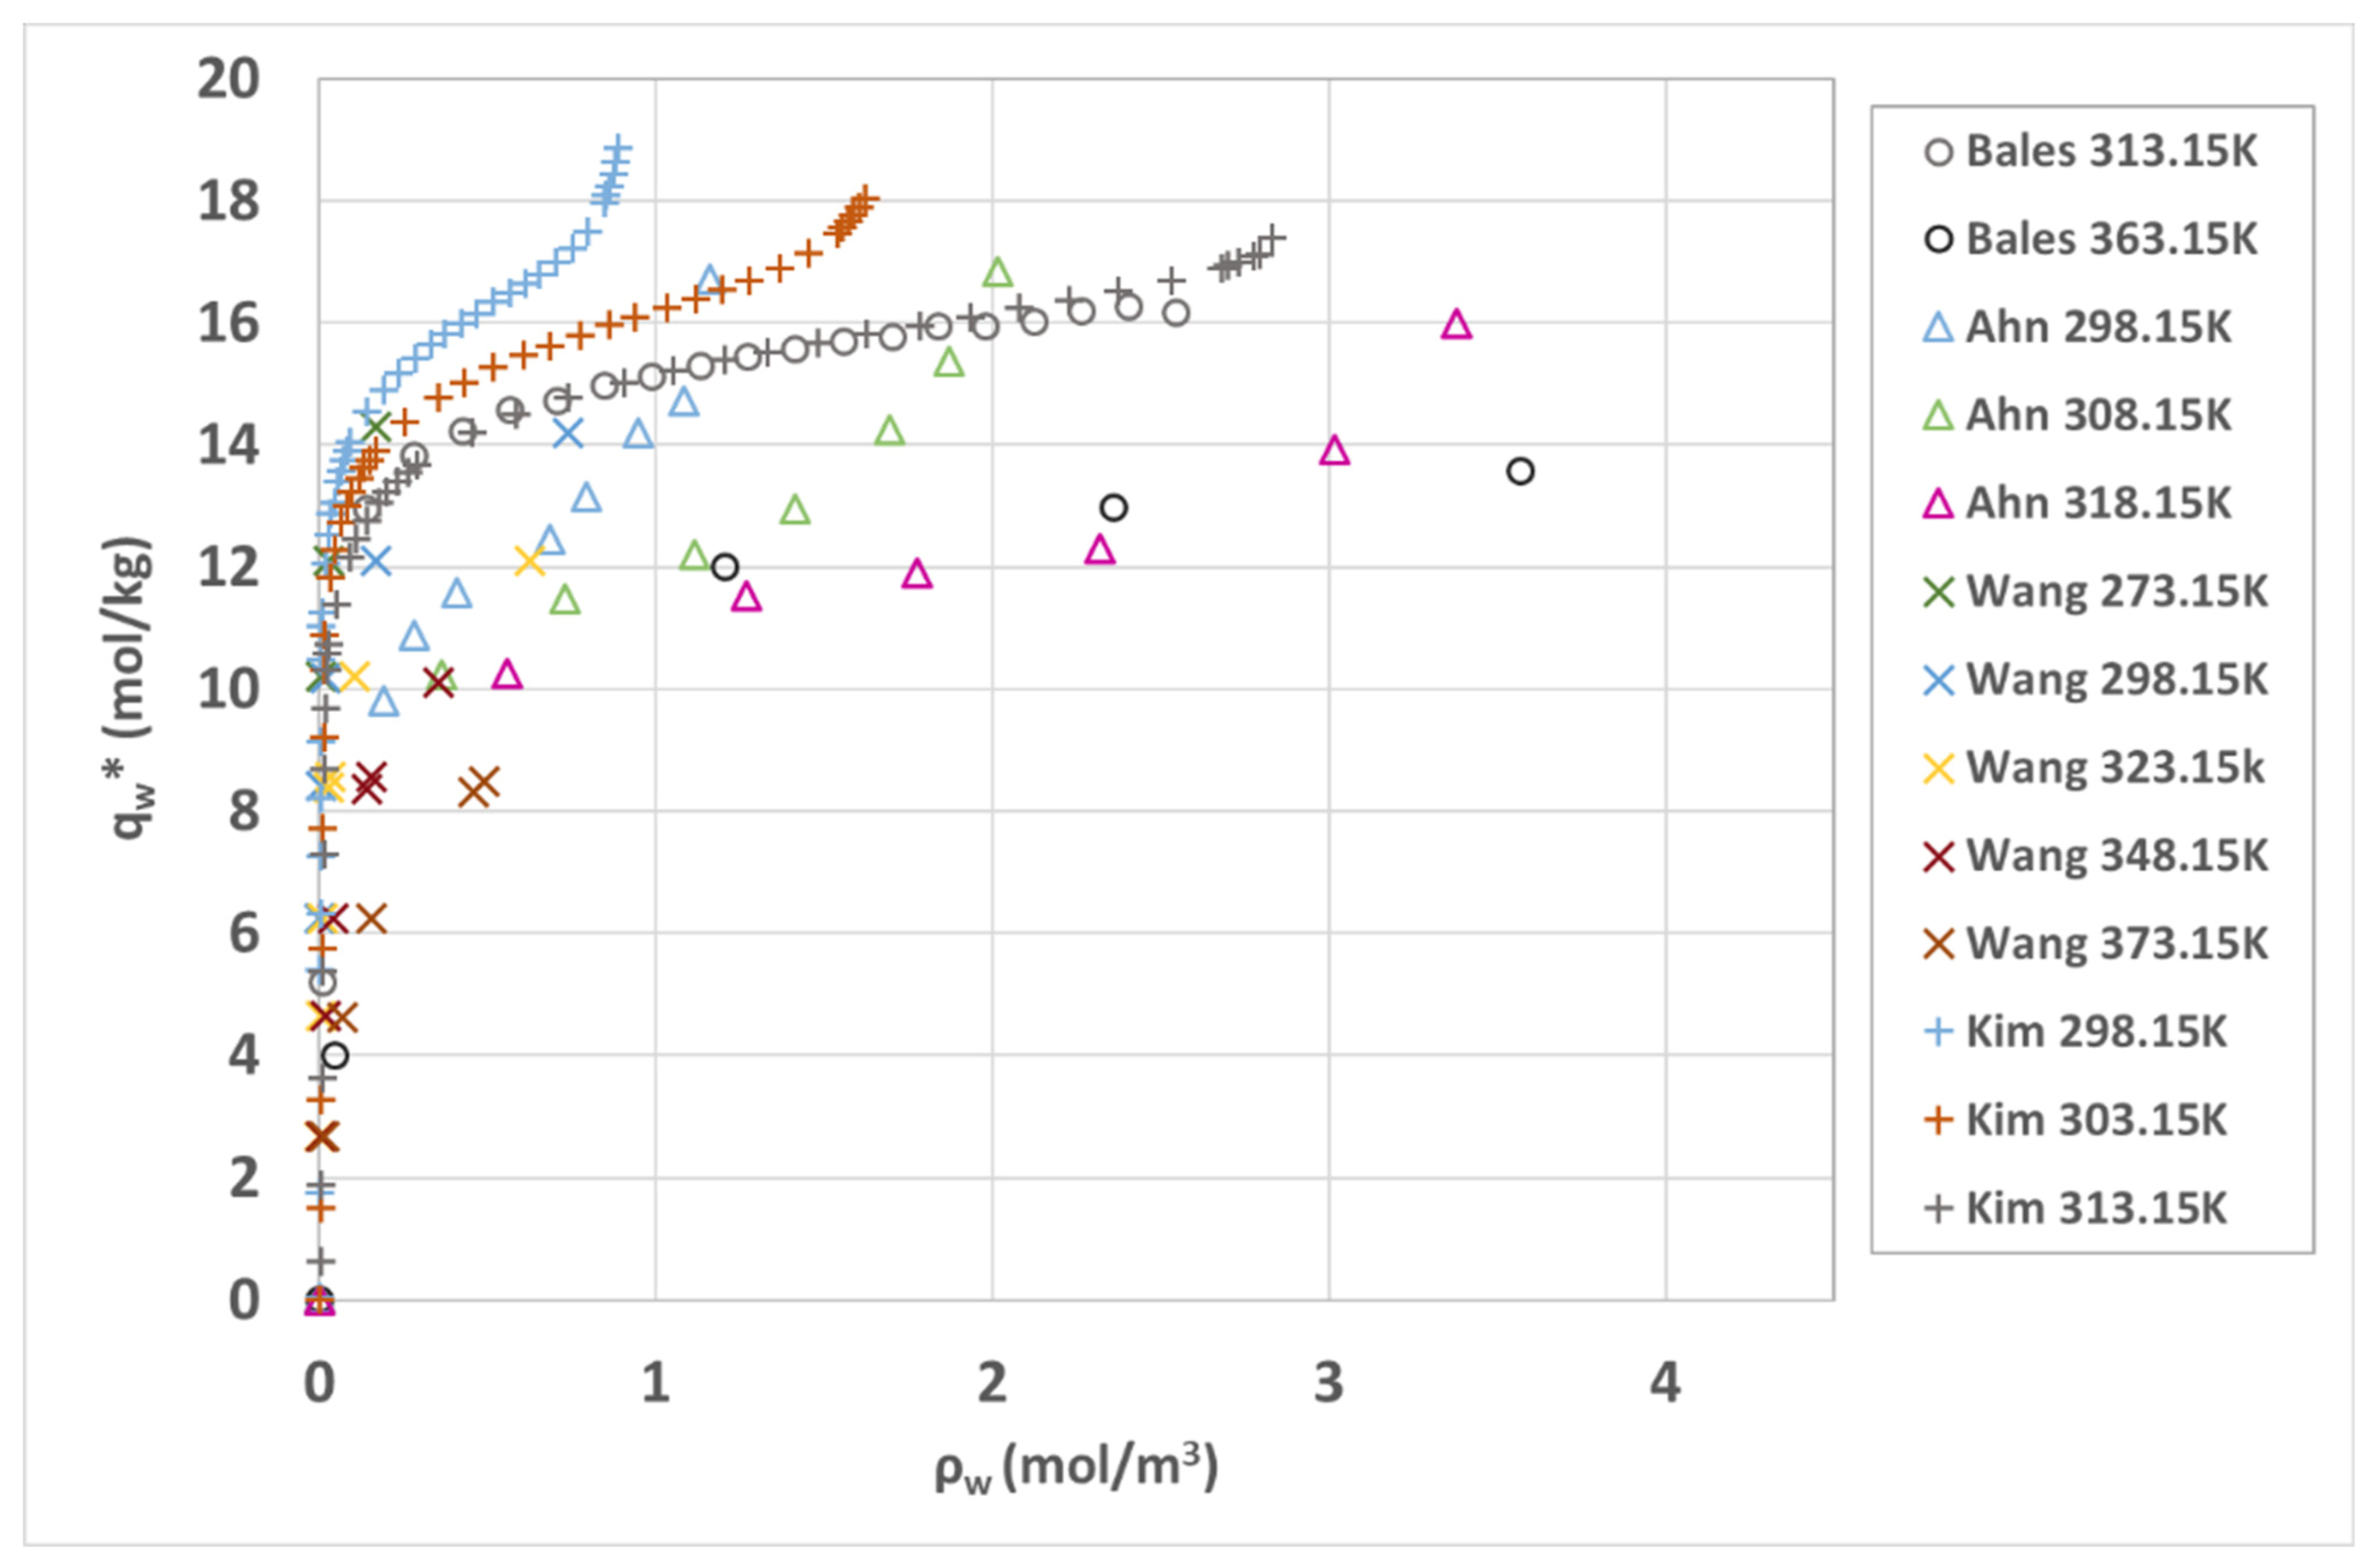
17]. In order to describe the equilibrium, we used available experimental isotherms for water/Z13X. All data has been compiled in
Figure 2. Isotherms are specific to a given porous material under given manufacture conditions (method, binder type), which is why we can expect to find disparities between data. The isotherms diverge on both the adsorbed amount and also possibly on their shape.
In
Figure 2, the experimental isotherms from Bales [
43] and Kim [
44] show a good agreement at a temperature of
. These isotherms have a greater monolayer capacity compared to the others. Taking the BDDT classification, a similar shape is observed for isotherms from Ahn [
45], Kim [
44], and Wang [
46] with type II isotherms, whereas Bales [
43] seems to correspond to a type I.
Several models have been reported in the literature to describe the equilibrium. One can mention, for instance, the Langmuir, Toth, Sips (i.e., the Langmuir—Freundlich model), UNILAN, Frenkel–Halsey–Hill (FHH), and Aranovich–Donohue models. Wang [
46] and Ahn [
45] fit their isotherms using the Toth and Sips model with temperature dependent parameters. Kim [
44] uses a combination of the FHH and AD models with isotherm parameters at each temperature. Kuznyk et al. [
47] took data from Bales [
43] and fit a model based on the Langmuir isotherm, a linear contribution in the transition zone and capillary condensation. Ahn [
48] uses experimental data from Wang [
46] and combines the FHH and Aranovich–Donohue (AD) models. In the works cited, a good agreement is found between experimental and simulated data.
To pursue our model, we have selected the simulated isotherms from Ahn [
48], which are also available in
Figure 3. Simulated data agrees with the fitted experimental data from Wang [
46]. The chosen model is the AD model defined in Equation (38). This model contains two terms. A first term,
, that follows a Toth isotherm. With parameters
and
being temperature dependent and given in Equations (41) and (42);
also depends on the isosteric heat of adsorption. The second term in Equation (38) describes the typical disparity of the adsorbed amount for pressures close to the saturated water vapor pressure,
. The equilibrium model parameters are given in
Table 4.
In summary, the system is locally defined by the nine following variables:
,
,
,
,
,
,
,
, and
.
is fixed, and the remaining variables are associated to the eight equations cited below. Our model solves partial mass conservation equations in the bulk gas phase for water,
, and dry air,
, that are described in Equations (14) and (2). The fluid density,
, is calculated in Equation (32) based on the concentrations
and
. The intra-particle mass conservation is considered by the LDF model using Equation (15) in order to obtain the water adsorbed concentration,
. The equilibrium adsorbed concentration,
, Is given by Equation (38), which uses Equations (39)–(42). For heat conservation in the bulk gas phase and within the particle, we have, respectively, used Equations (30) and (34) with the fluid and solid temperatures,
and
. The state equation is that of the ideal gas law available in Equation (31). Concerning the mass and heat transfer properties used in our model, they are, respectively, obtained from the methods in
Section 2.1.1 and
Section 2.2.1.
3. Modeling Results and Discussion
A fixed-bed sorption column is here simulated in order for it to be applied to thermal energy storage for residential applications. As an example, we have considered the system presented in [
17] produced by Tatsidjodoung et al., the adsorbent/molecule pair is zeolite 13X/water. Available information on the Z13X textural properties was taken from [
17], where a significant scale storage tank was experimentally and numerically assessed.
In [
17], the effect on the temperature lift with two system setups (in parallel or in series), varied air flow, inlet water concentration, and inlet dry air temperature was studied. The experimental results obtained in [
17] provide important information (concentration and temperature profiles) to fit our model. However, the used adsorbent was not characterized in terms of textural properties and isotherm. This is why, in the above section, we compiled experimental isotherms from Z13X and identified a suitable model.
Table 5 gives the adsorption column dimensions, adsorbent textural properties, and inlet operating conditions of the chosen breakthrough experiment.
The model was developed to easily adopt different sized systems, adsorbent materials, and different operating conditions. In this section, the validation of our model can be found, followed by a parametric study on both the operating conditions and design parameters. To understand the effect of these variables on the heat accumulated in the storage system, its calculation is presented below.
The heat accumulated over time within the adsorption bed is calculated by Equation (44). This equation considers the estimation of discharged (adsorption) and charged (desorption) heat by a global heat conservation,
, which integrates the difference of enthalpy flow rate between the inlet and outlet streams of the adsorption column (the column is assumed adiabatic), as follows:
Another method to calculate
is to perform a time integration of the heat released/used by adsorption/desorption over the entire column, as established in Equation (45):
These two methods of calculating the charged/discharged heat available in Equations (44) and (45) have been tested and give similar values at both transient and steady-states.
3.1. Model Validation
In order to fit the simulated to the experimental results from [
17], two model parameters were optimized. One concerns the intra-crystalline diffusivity,
, at
that is used in Equation (29), and the second is the isosteric heat of adsorption,
. The reasons for the selection of these two parameters to fit the model response to experimental data are as follows:
, the intra-crystalline diffusivity, as we have seen before from data available in [
37], has not been clearly and consistently identified by experimental studies. We believe, therefore, that this parameter can be identified by comparison of simulated to experimental data;
has been selected from the literature review performed on the equilibrium isotherm and accessed on [
48]. This value has not been experimentally evaluated and may therefore be a source of uncertainty.
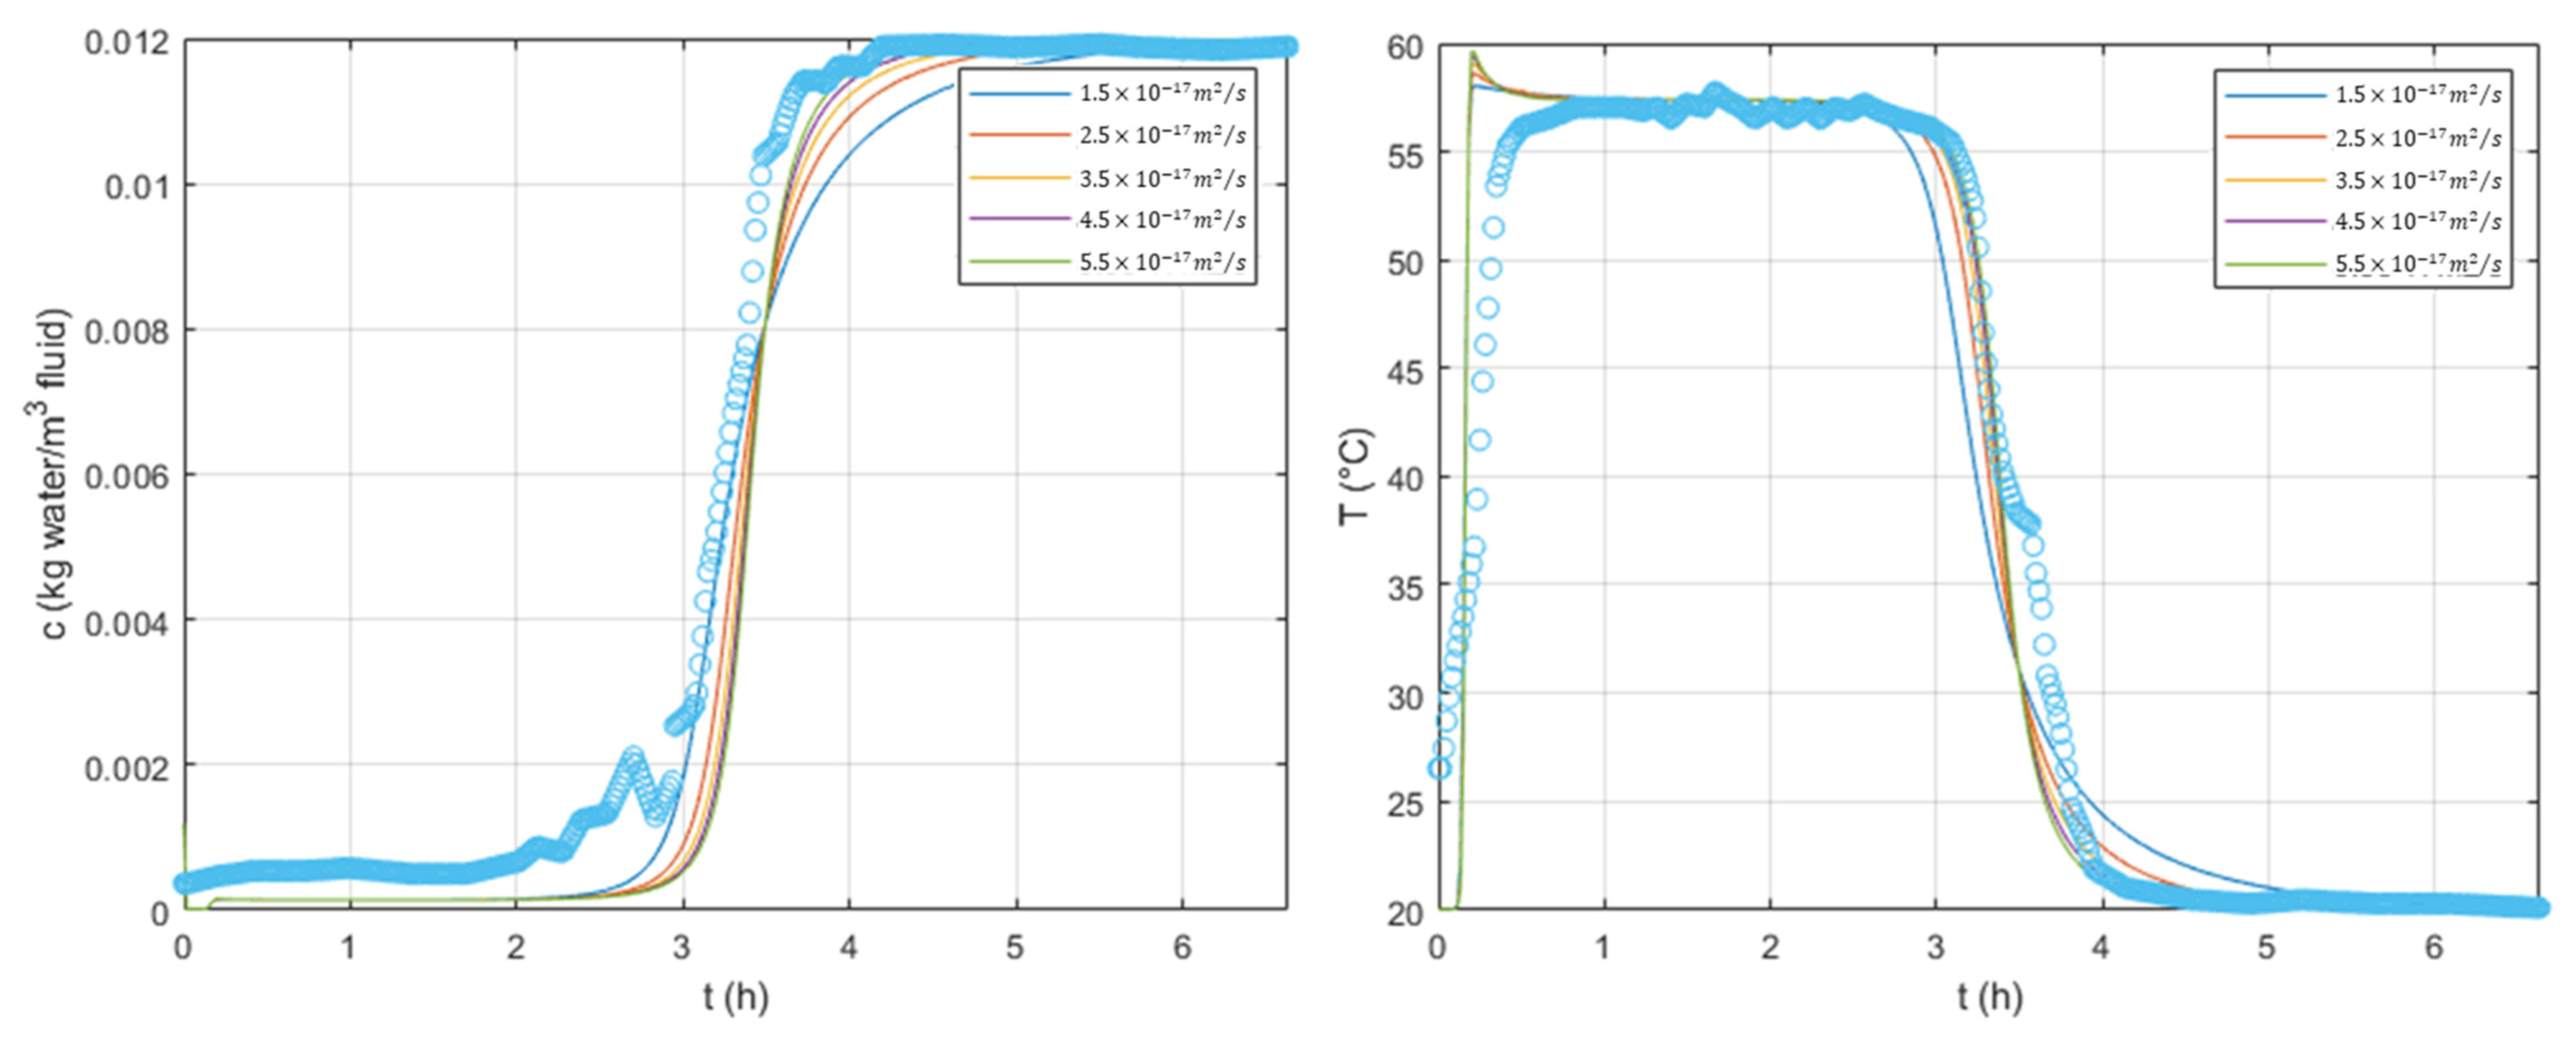
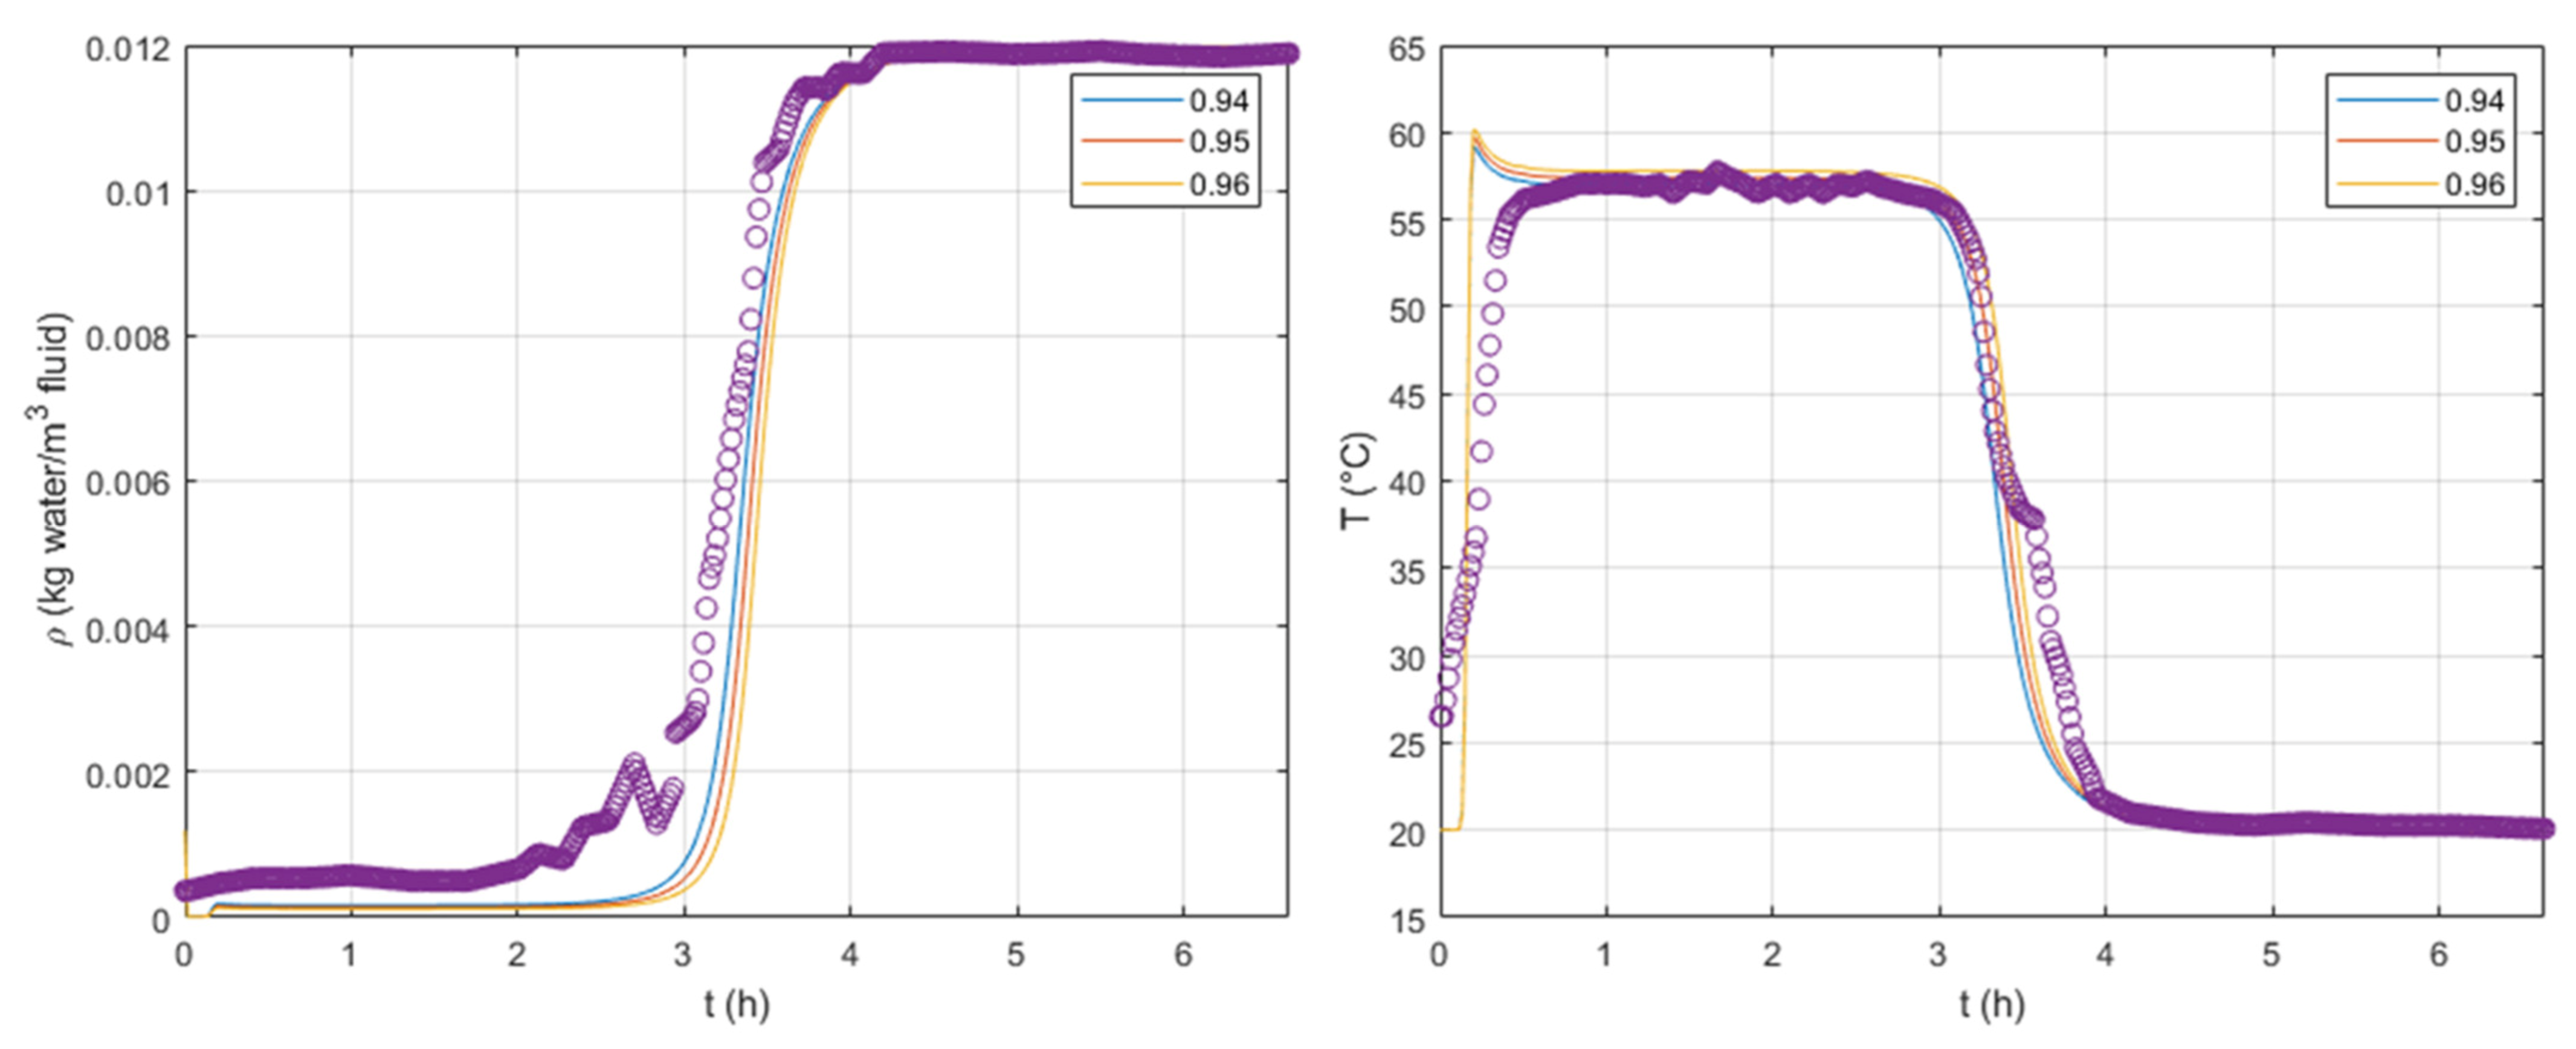
To fit these parameters, we first performed a sensitivity analysis, which is available in
Figure 4 and
Figure 5, respectively, on
and
. We varied these parameters to understand their effect on the breakthrough curves. The current tests were simulated using, at the column inlet,
,
, and
for the superficial velocity,
, temperature, and water concentration. A model fitting was performed using an optimization tool from Matlab
® based on the ordinary least-squares method; the values obtained were
and
.
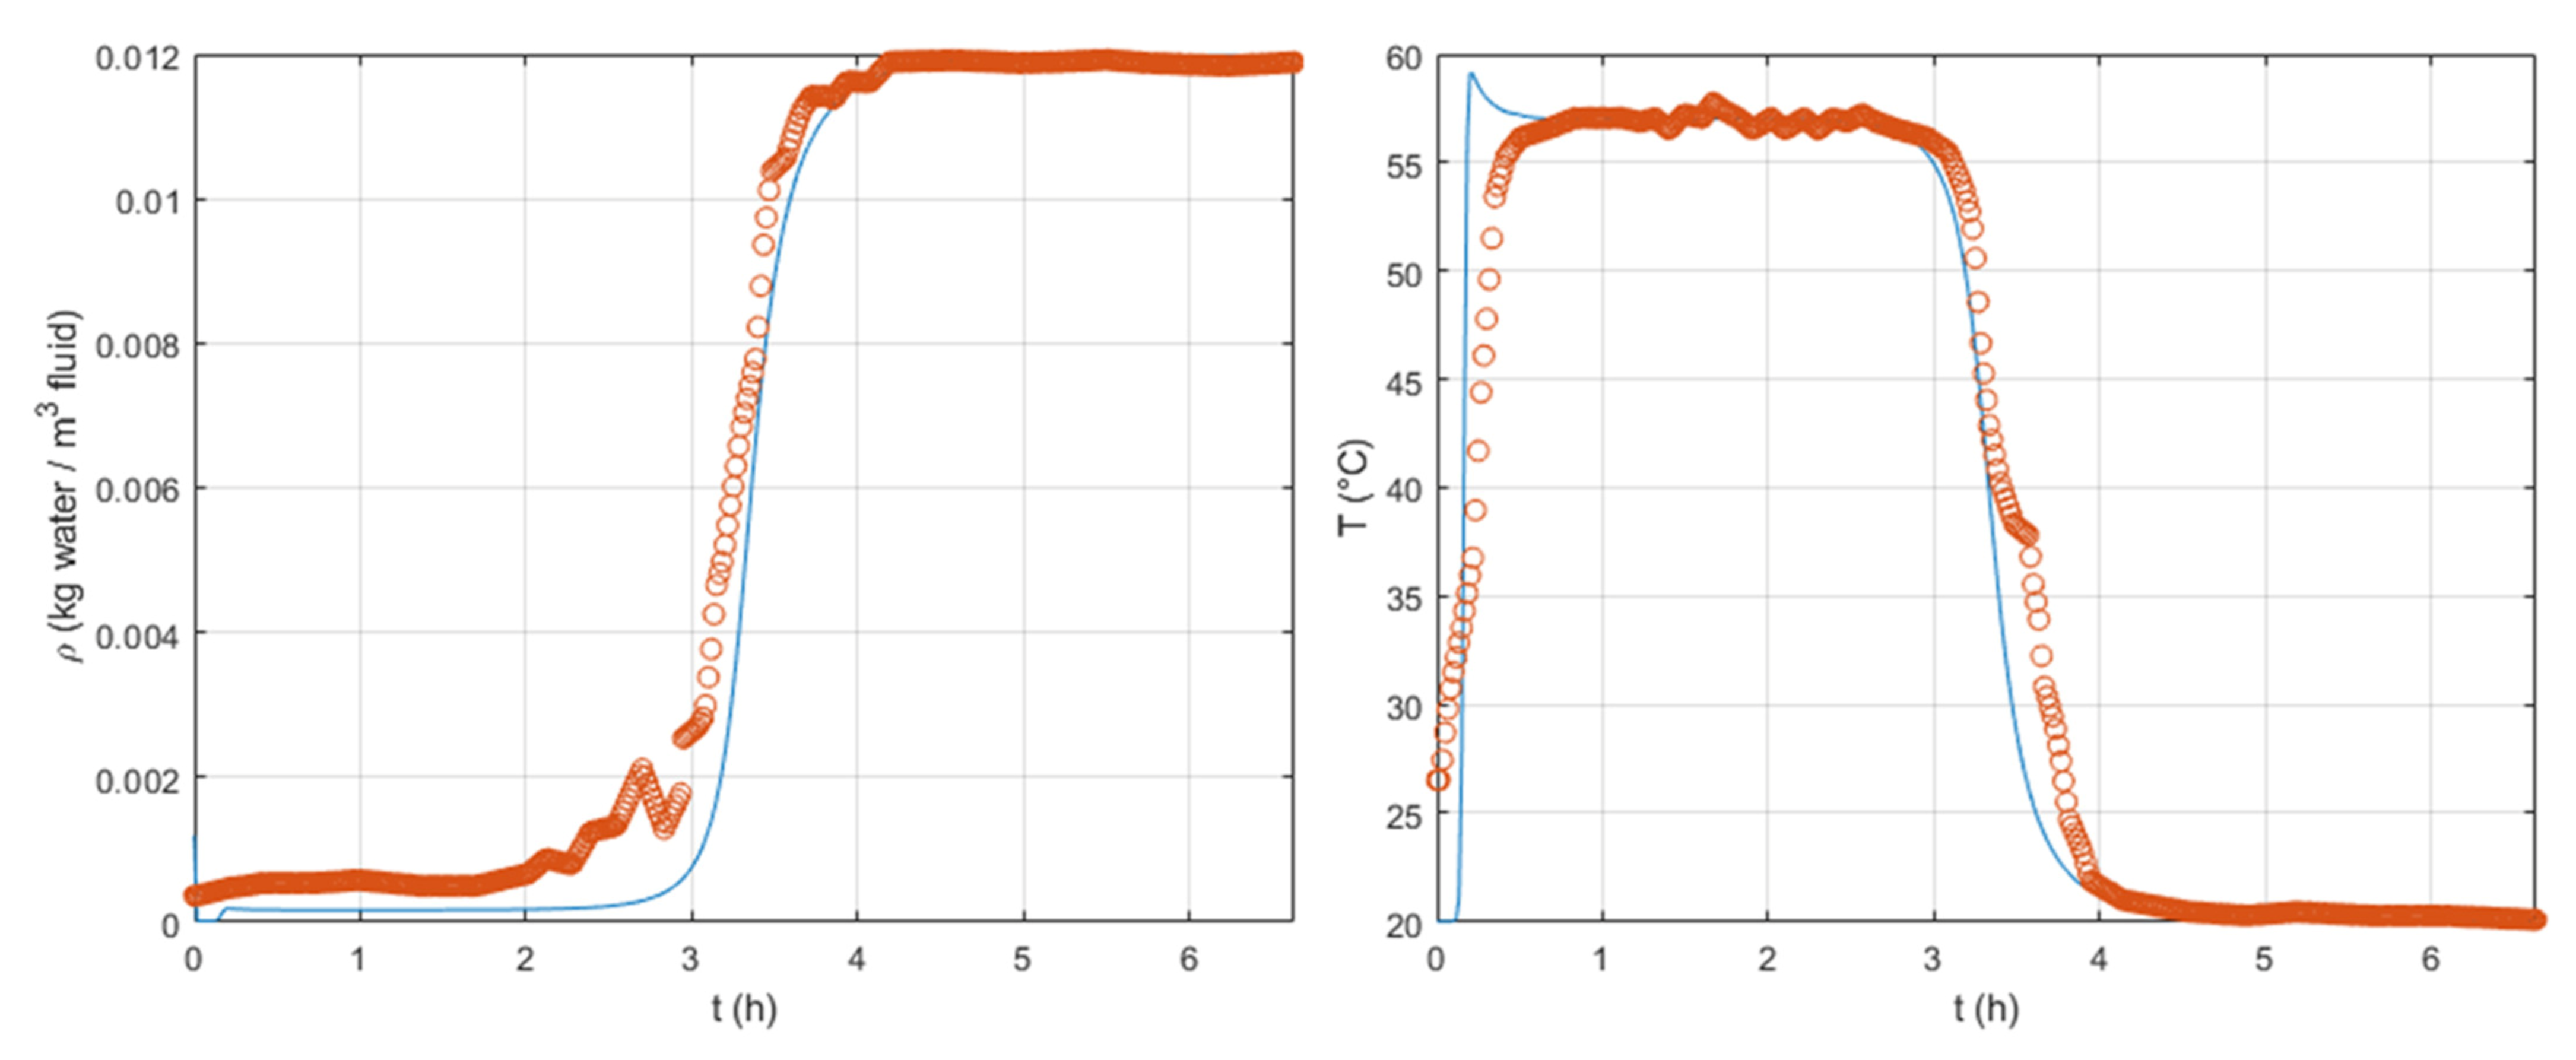
As an example, in
Figure 6 the experimental data set from [
17] and the simulated response using the set of optimized parameters can be found. Some disparities can be observed at the beginning of the breakthrough curve. The difference between simulated and experimental data can be explained by the use of an LDF model, which gives an approximation of the actual response. Another possible explanation is related to the absence of intrinsic adsorption kinetics at the interface between the macroporous and the microporous domains. Our model is globally capable of fitting the experimental results. We believe, therefore, that the hypotheses considered: no pressure drop, fixed air flow along the column axis, and the absence of an intrinsic kinetics of adsorption, are consistent.
3.2. Mass Transfer Resistance
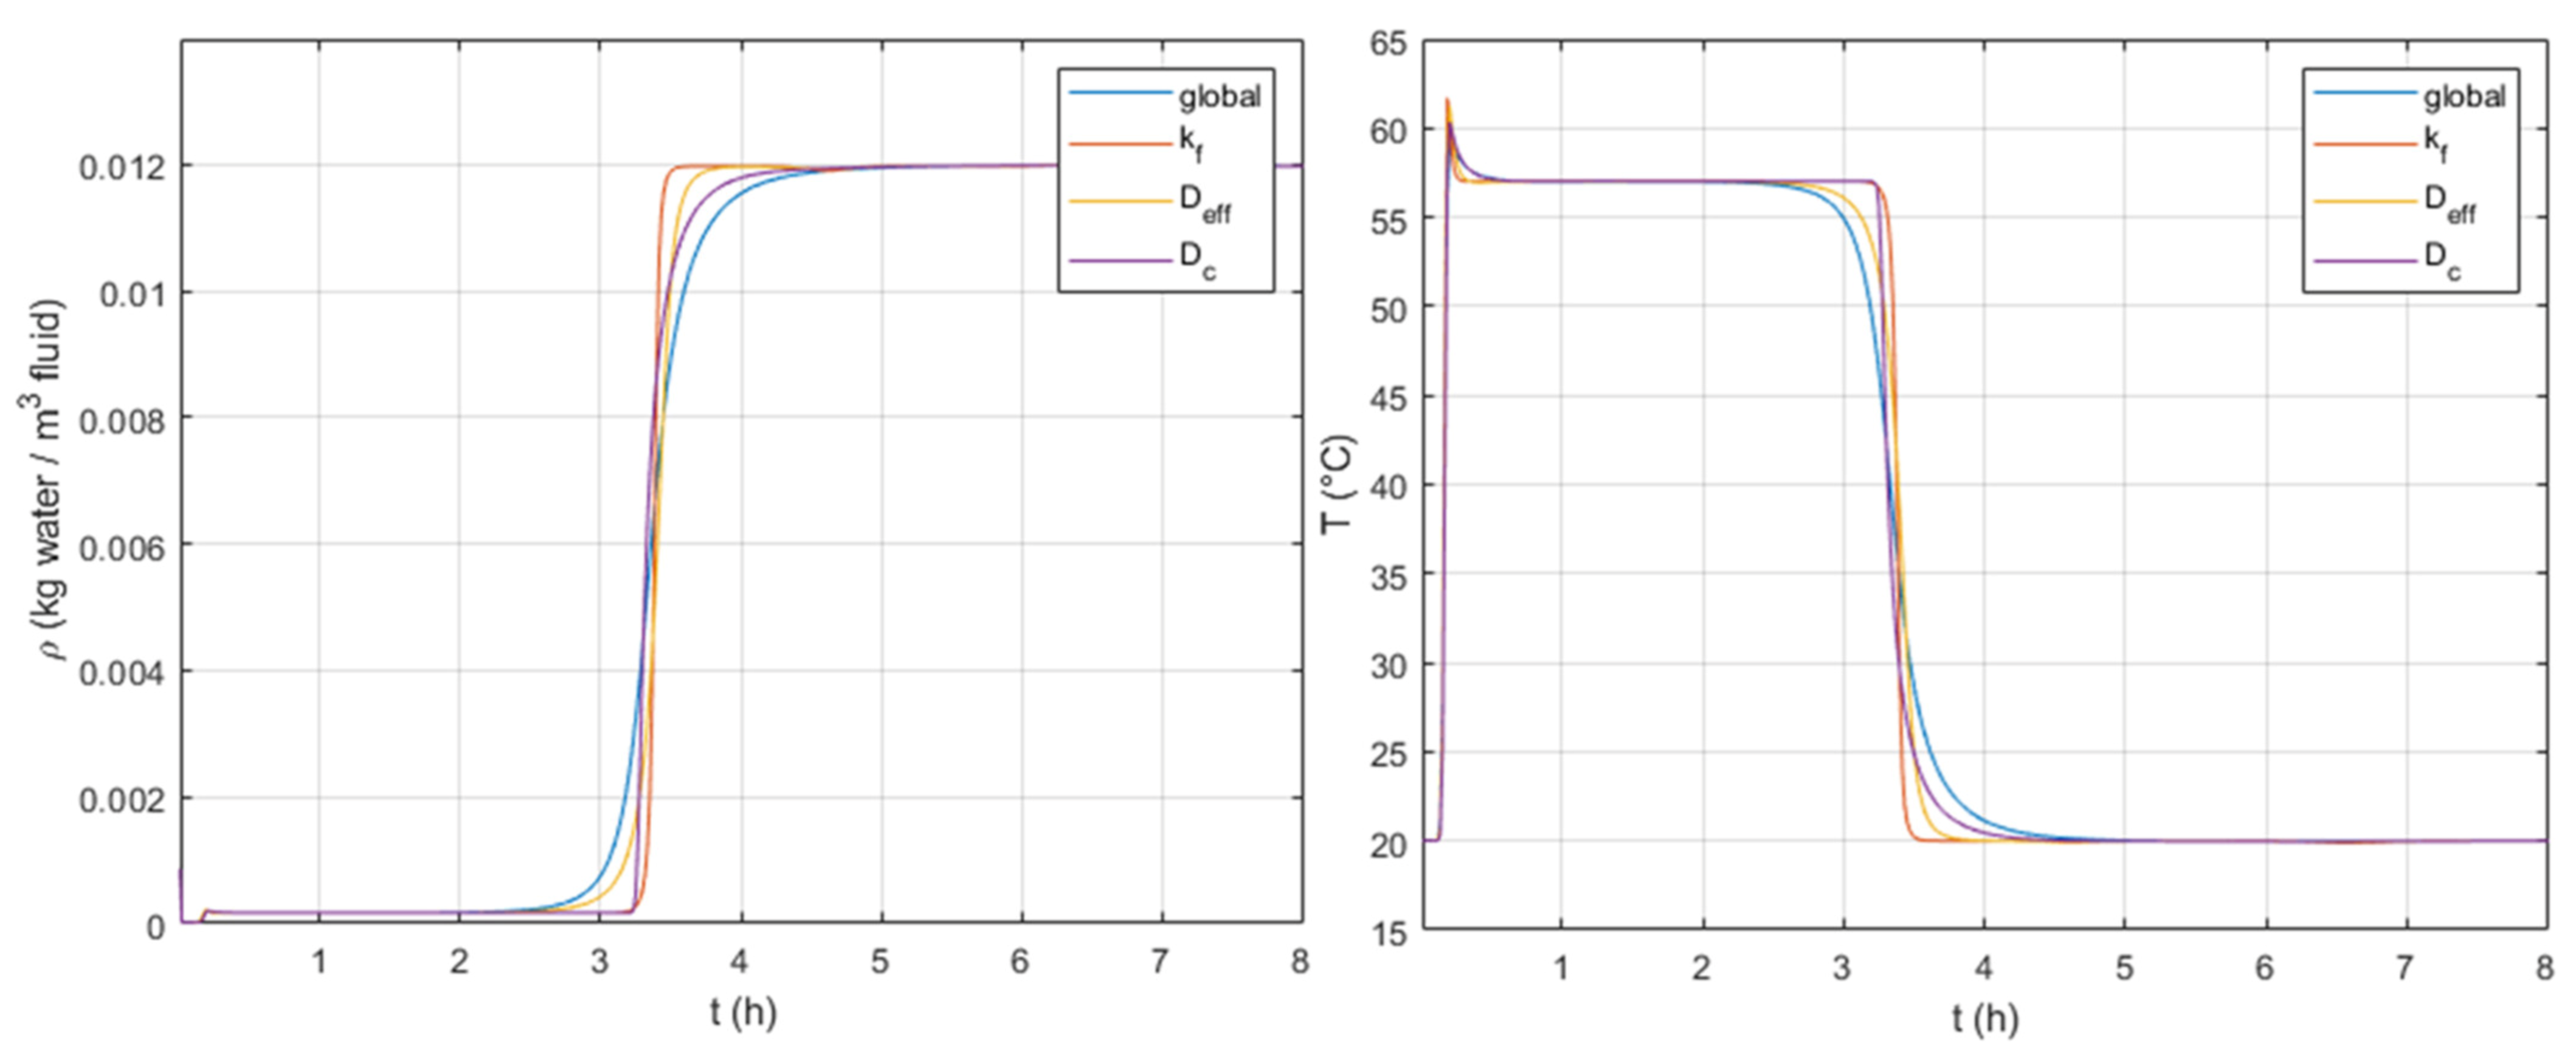
As mentioned previously, the selected LDF model considers three mass transfer resistances: external transfer, internal diffusion within macropores, and internal diffusion within micropores. In order to identify contributions from each resistance,
Figure 7 shows simulations obtained with different LDF coefficients. The simulation “global” considers all mass transfer resistances, “
” considers a single contribution from external transfer resistance, “
” refers to a single contribution from macropores internal diffusion, and “
” takes a single contribution from micropores internal diffusion.
From
Figure 7, if we take as reference the simulation “global”, which considers all three resistances, one can observe that contributions from all mass transfer resistances seem to affect both breakthrough curves (S-shaped curves) and outlet temperature profiles. Additionally, no other single resistance is capable of fully describing the “global” simulation.
The comparison of the simulation “global”, available in
Figure 7, to the shapes of the remaining breakthrough curves suggest that, at the beginning of the S-shape, the macropore internal diffusion seems dominant. However, at the end, the intracrystalline diffusion becomes dominant. This implies that it is important to consider at least the two internal resistances because both seem to affect the system response. For further simulations on the parametric study, we decided to keep a “global” LDF parameter that takes all three mass transfer resistances.
3.3. Parametric Study on Design and Operating Conditions
In future work, an optimization tool shall be implemented to optimize operating conditions and/or design parameters that fulfil the energy needs of a given system of application (residential heat or hot water). The variation of operating conditions concerns the water concentration step, fluid temperature, and interstitial fluid velocity at the column inlet. Regarding design parameters, we have selected crystal and adsorbent particle sizes. These parameters play an important role on, respectively, intracrystalline diffusion and external transfer and internal diffusion resistances.
Among data from the parametric study, a maximum cumulated heat was observed during the adsorption (discharging) step of around
. This value corresponds to
per bed volume,
per adsorbent particle volume, and
per solid volume. In order to compare the discharged heat in our system with that from the systems available in
Table 1, we must adopt the value of
, which refers to the heat accumulated per bed volume. This value agrees with the heat values from
Table 1 for systems using zeolite 13X.
3.3.1. Inlet Adsorbate Concentration
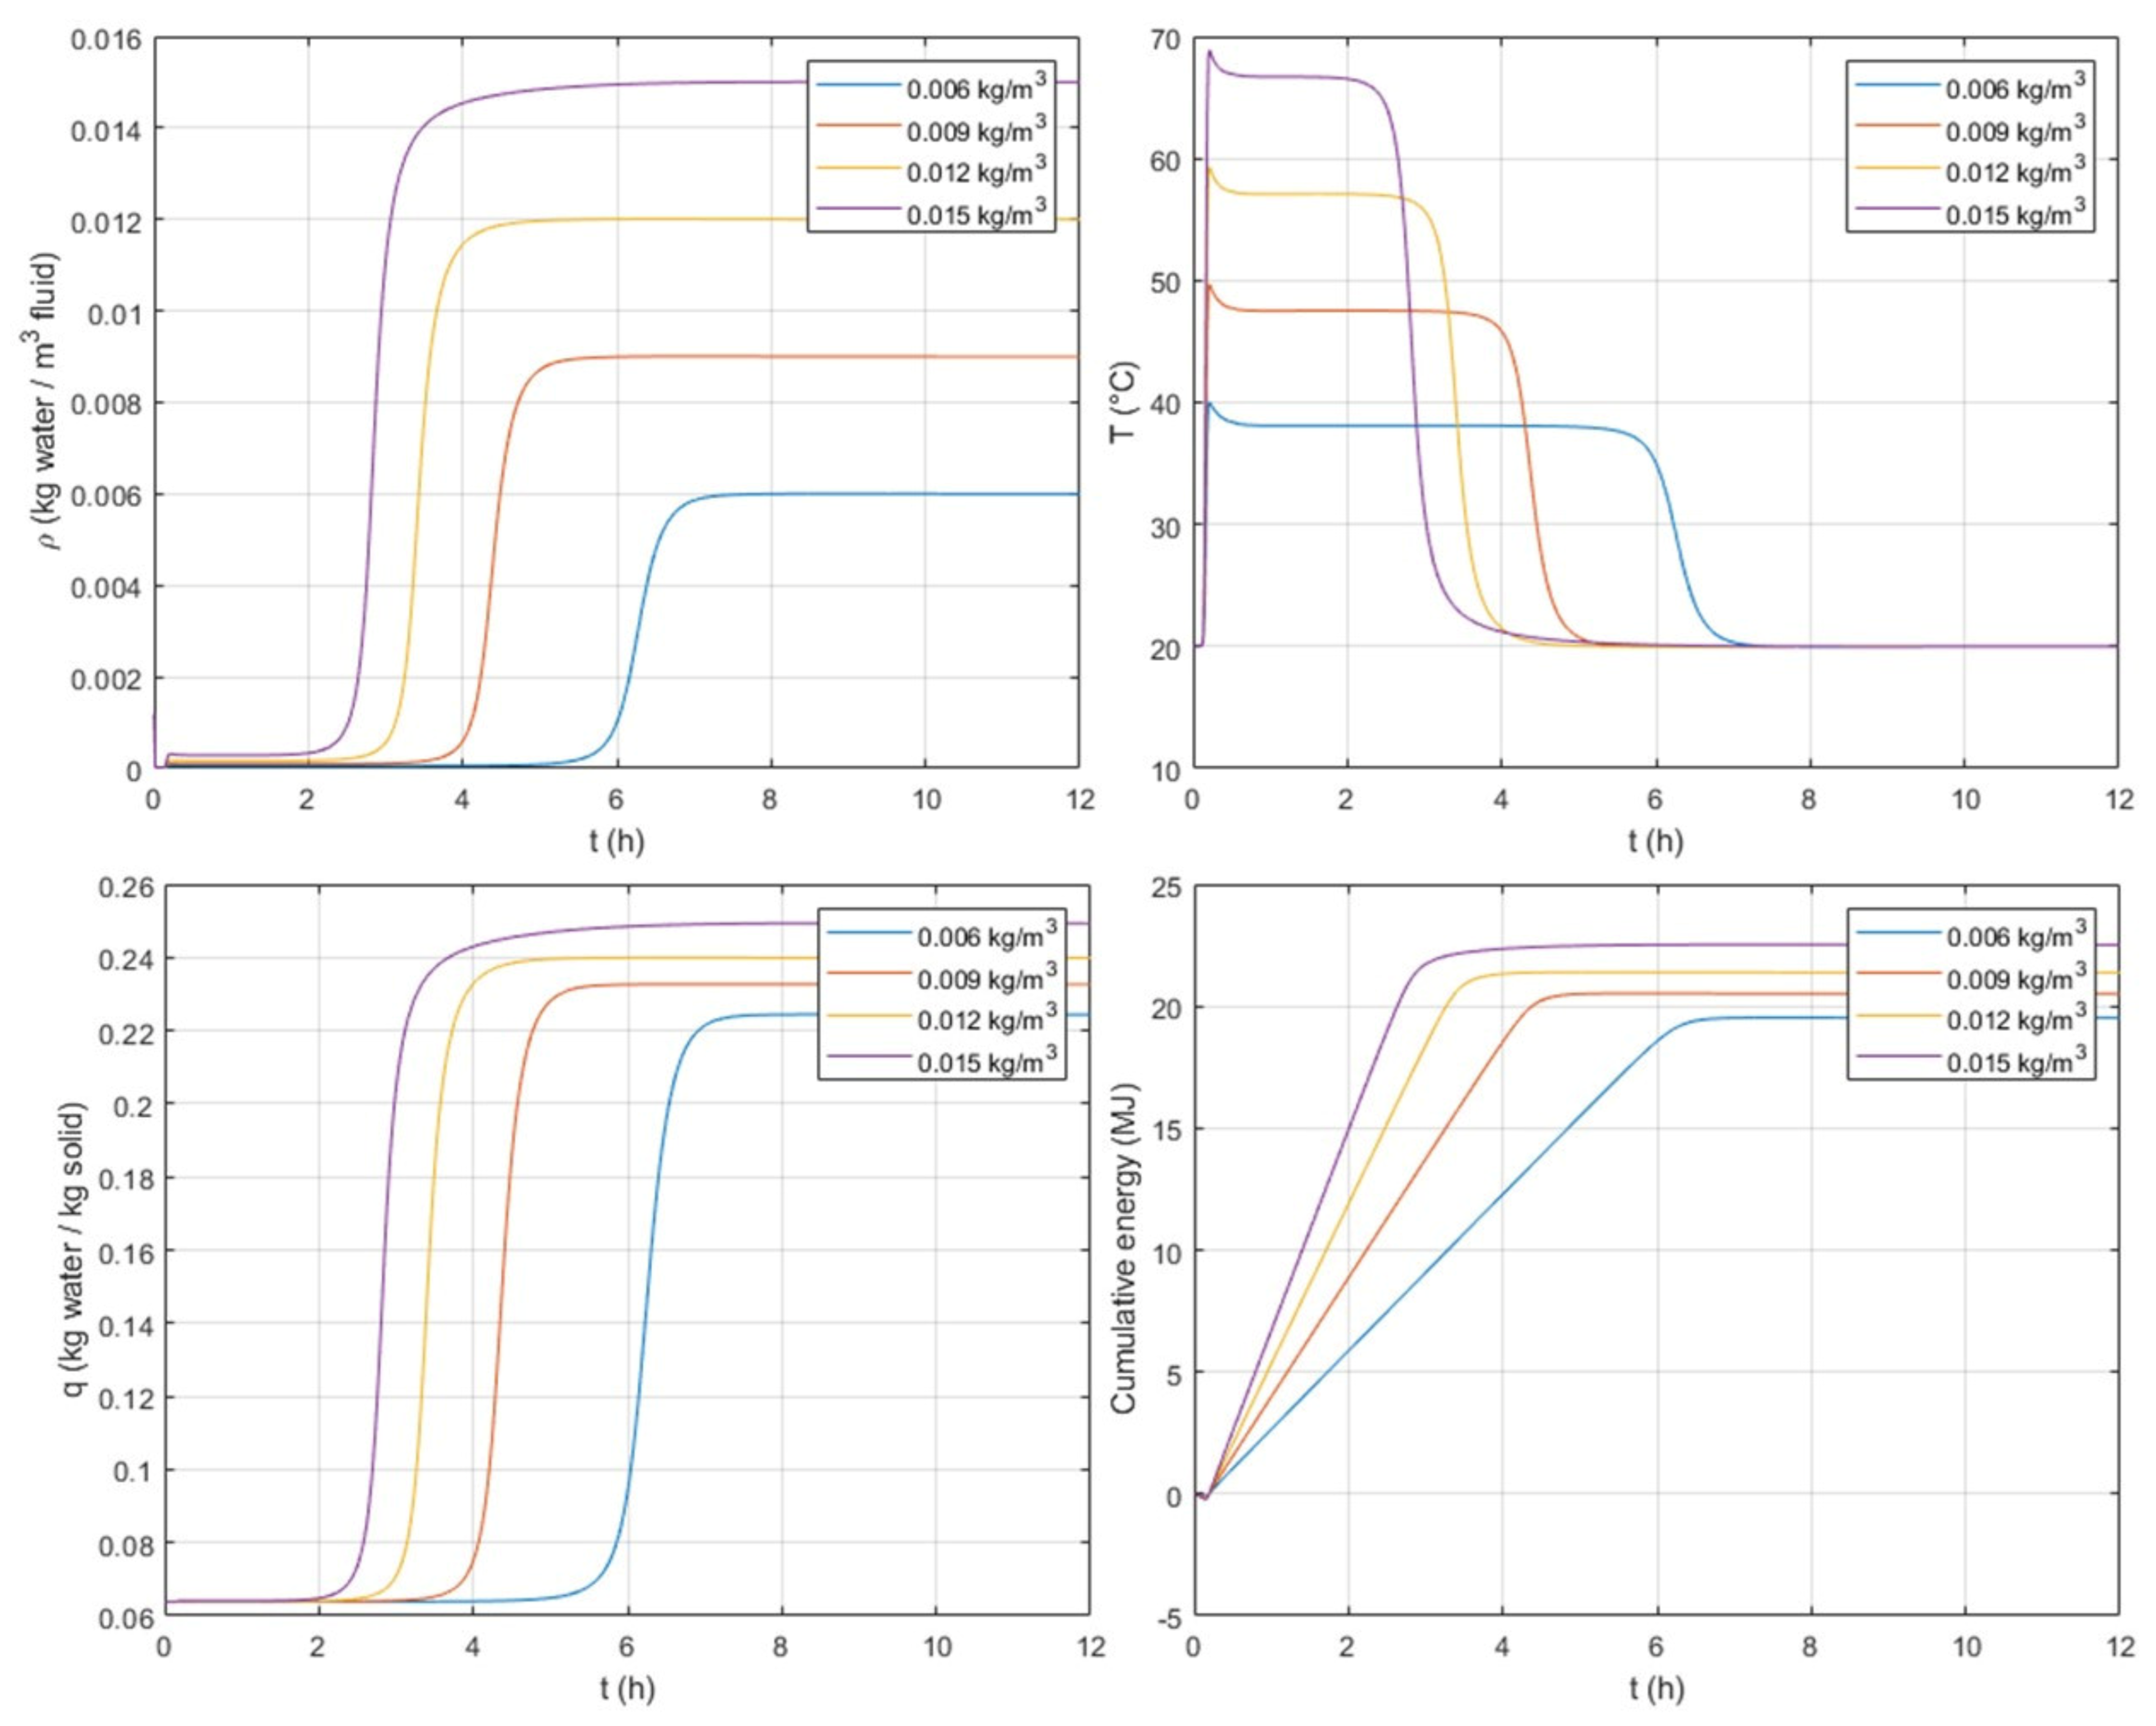
The effect of inlet concentration is studied and presented in
Figure 8. This figure shows, at the column outlet, a time evolution of water fluid concentration,
, adsorbed concentration,
, fluid temperature,
, and solid temperature,
.
The adsorption column is continuously fed in humid air. Water starts to be adsorbed at the column inlet, and once the zeolite is saturated in water the concentration front/mass transfer zone (MTZ) moves to the next layer of the column and keeps moving until it reaches the column outlet. At that moment, one can say that all the adsorbent particles in the bed are completely saturated in water. Within the MTZ, the exothermicity of the adsorption phenomena allows the release of heat. This heat is transferred to the gas flow, and this is why, in
Figure 8, from the very beginning (t > t
0), at the column outlet one observes an increase in the fluid temperature (
). No changes are observed in the water concentration profiles
and
because, at that moment, the MTZ has not yet reached the column outlet and water continues to be adsorbed in the MTZ within the column.
For instance, for an inlet concentration of 15 × 10−3 kg/m3, within the column the MTZ releases heat starting from the column inlet until the outlet. The heat is transferred to the fluid. When the fluid reaches the column outlet, we can therefore observe in the outlet temperature profile the response of the exothermicity after only 10.8 min (0.18 h). As the MTZ moves within the column, the fluid continues to be heated, and when the MTZ reaches the column outlet, i.e., at around 2.5 h, a decrease in the outlet temperature is observed. At 2.5 h, we also observe an increase in and because no more adsorption occurs due to the saturation of the zeolite in water.
As expected, at high inlet concentrations, a greater plateau for the adsorbed concentration, , is observed, as well as a faster adsorption. The plateau value of the adsorbed concentration corresponds to the equilibrium value, which depends on the inlet gas concentration. For the lowest inlet concentration of 6 × 10⁻³ kg/m3, the equilibrium adsorbed concentration and the outlet adsorbed concentration at the end of the adsorption take a value of 0.2244 kg/kg. For 9 × 10⁻³–15 × 10−3 kg/m3, the corresponding adsorbed concentrations are 0.2326, 0.2399, and 0.2494 kg/kg. These adsorbed concentrations are also in agreement with the equilibrium values.
High inlet concentrations lead to higher peaks of temperature, but with shorter periods compared with lower inlet concentrations. The cumulated energy reaches a plateau between 20 and 23 MJ for low to high inlet concentrations, respectively. The amount of energy accumulated differs for the varied inlet concentrations. For a given storage system, depending on the desired peak of temperature and duration, a compromise can be found by optimizing the inlet concentration.
3.3.2. Inlet Fluid Temperature
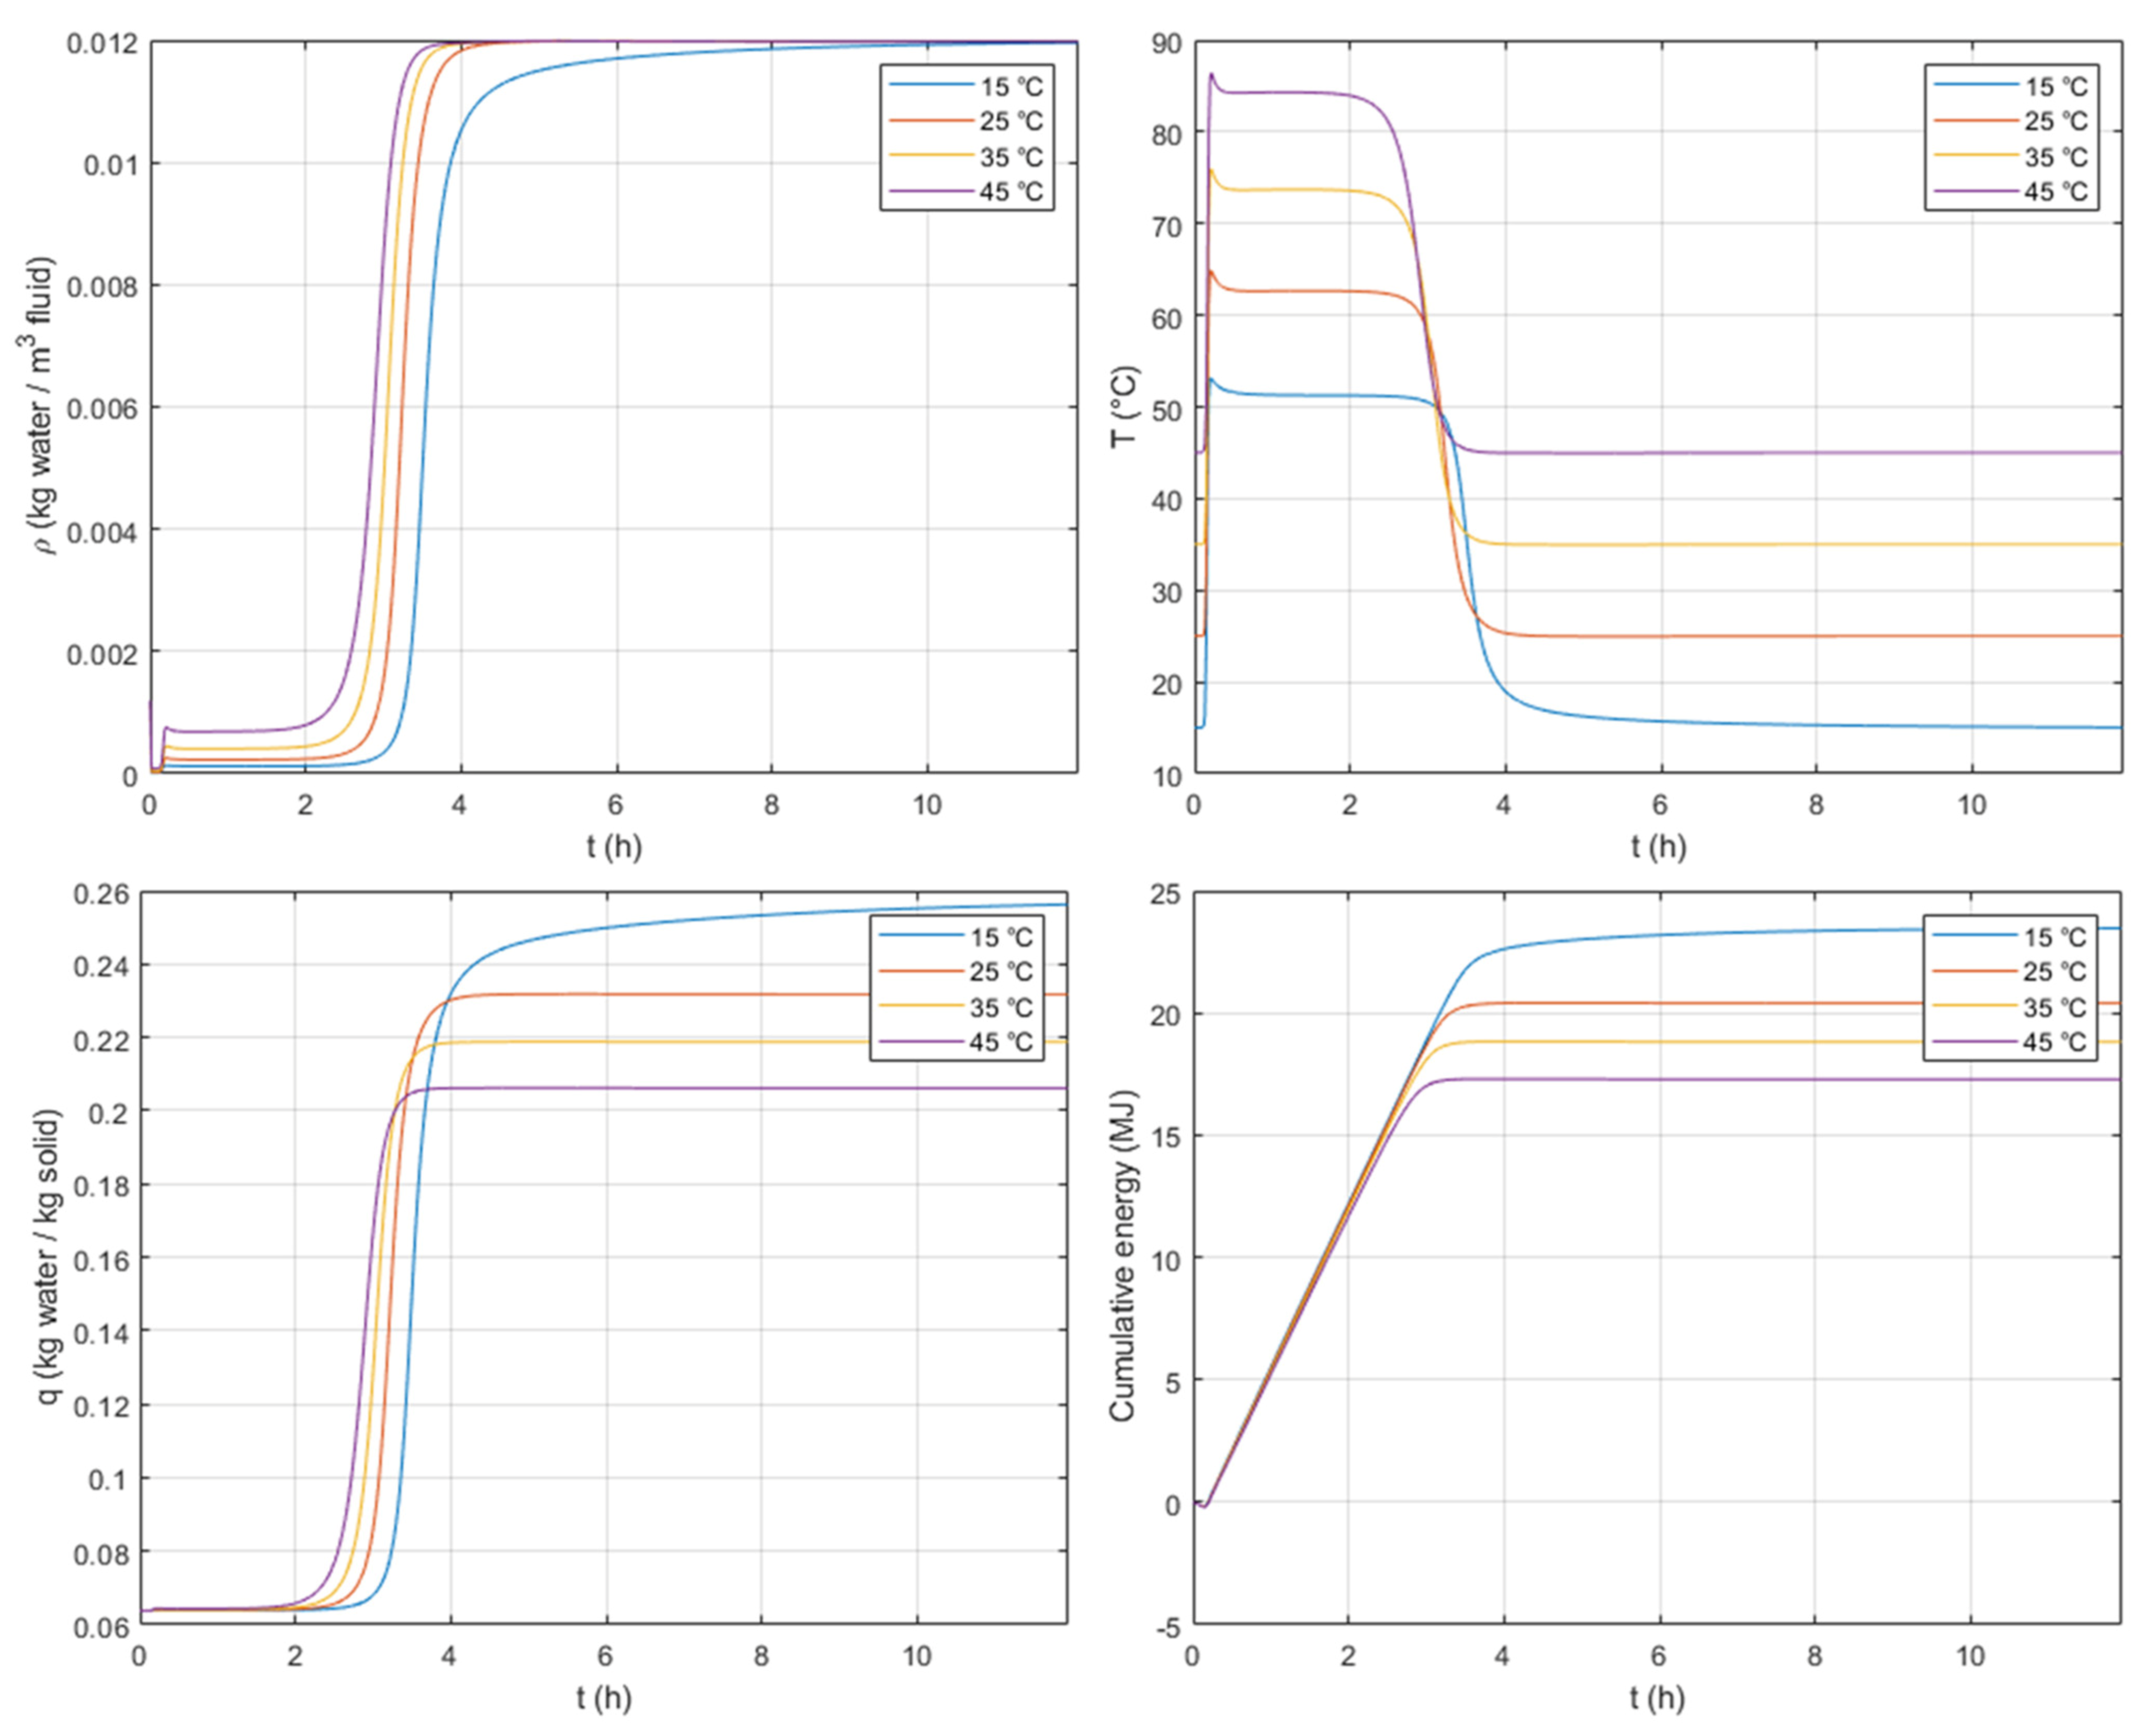
As the adsorption is an exothermic phenomenon, lower inlet fluid temperatures,
, allow greater adsorbed concentration plateaus,
, to be reached, as shown in
Figure 9. This figure also shows that the lowest temperature plateau corresponds to the lowest inlet fluid temperature and greater adsorbed concentration,
, which is due to the fact that the temperature lift is similar for the four inlet temperatures tested. A slight shortening of the duration of the temperature plateau as the initial temperatures increase can also be observed in
Figure 9.
Even though the temperature plateaus are lower for greater adsorbed concentrations, the cumulated energy reaches a maximum plateau at the lowest inlet temperature of 15 °C. We can therefore say that low inlet temperatures maximize the amount of heat discharged. For heating purposes, residential applications, where we can find inlet feeds at temperatures around 20 to 25 °C, can be very interesting.
3.3.3. Inlet Fluid Interstitial Velocity
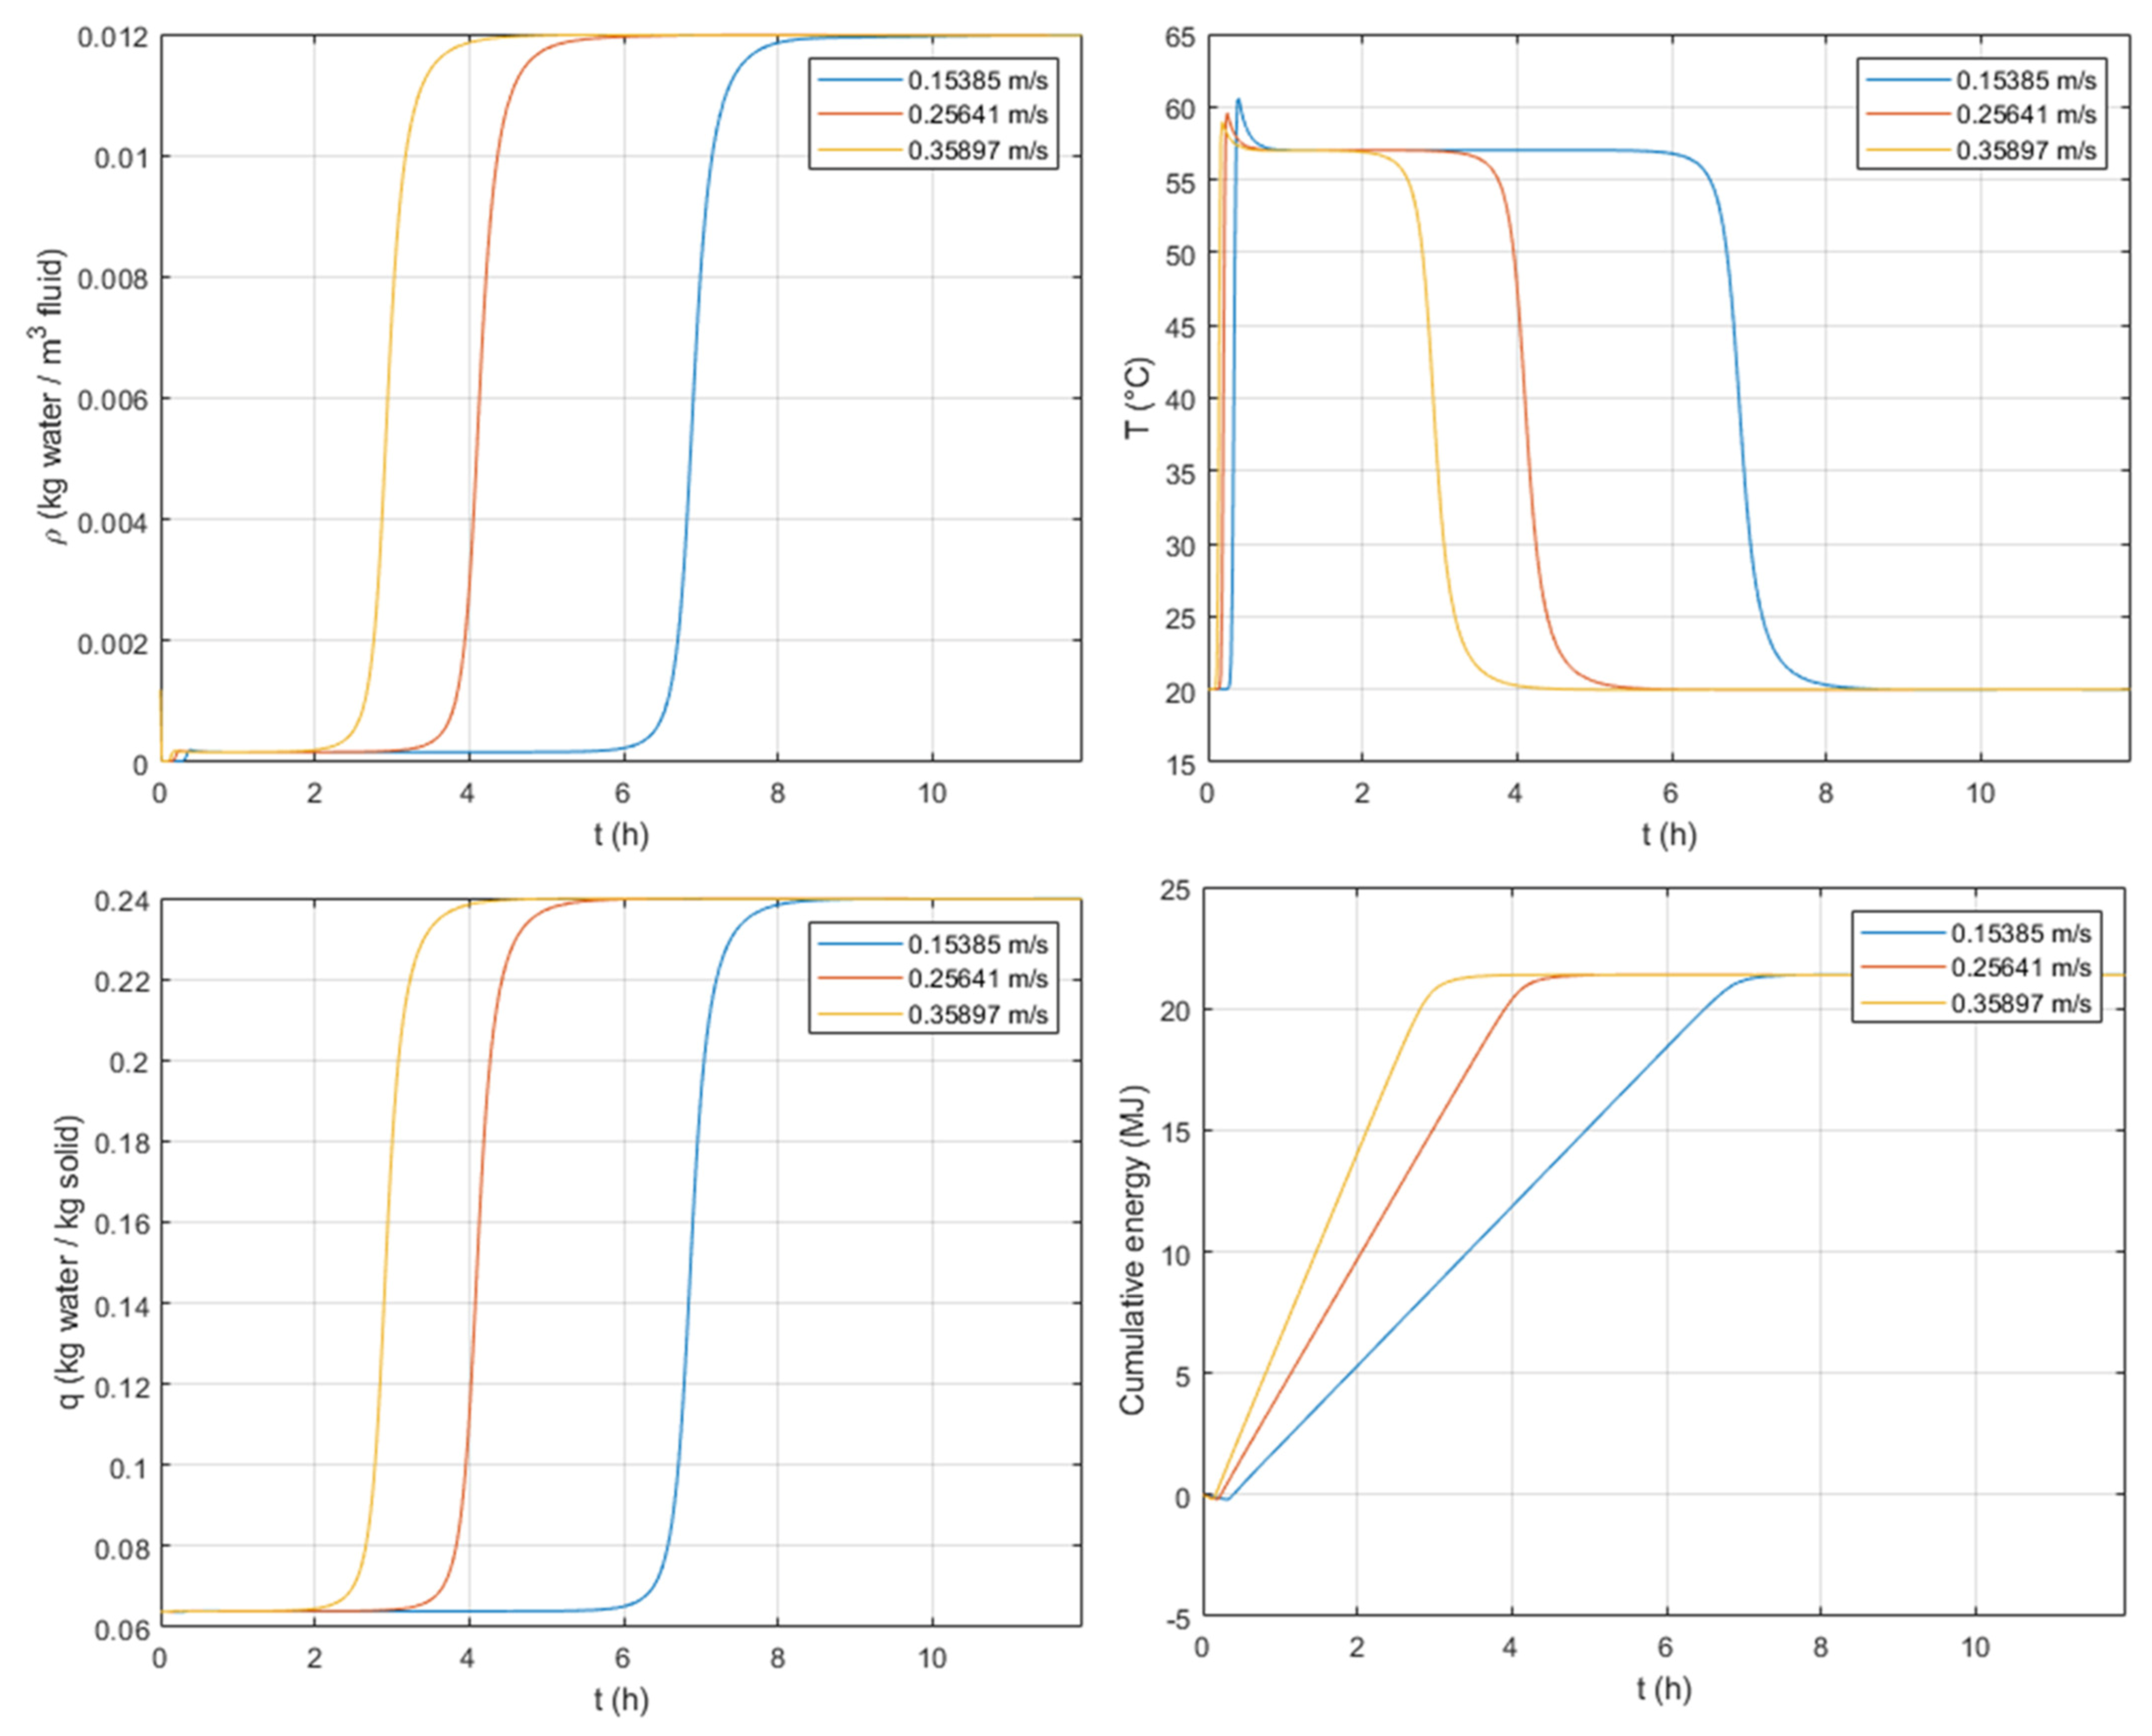
The external transfer and specifically, the external film coefficient, , depend on the fluid velocity, as described in Equation (19). The major contributions to mass transfer resistance seem to come from the internal diffusion, i.e., macropore diffusion and intra-crystalline diffusion.
The inlet interstitial velocity is expected to lead to faster/slower responses but does not greatly affect the shape of the breakthrough curves. This can be observed in
Figure 10, where the breakthrough response is delayed for lower values of inlet fluid velocity, and the S-shape does not change.
The variation of the inlet velocity gives identical peaks of temperature yet, due to fast/slow adsorption, the duration of the peak is, respectively, shorter/longer. Regarding the cumulated energy, this reaches the same amount at the steady state. However, the dynamic response gives, for higher velocities, a faster response in the heat discharged.
3.3.4. Particle Crystal Size
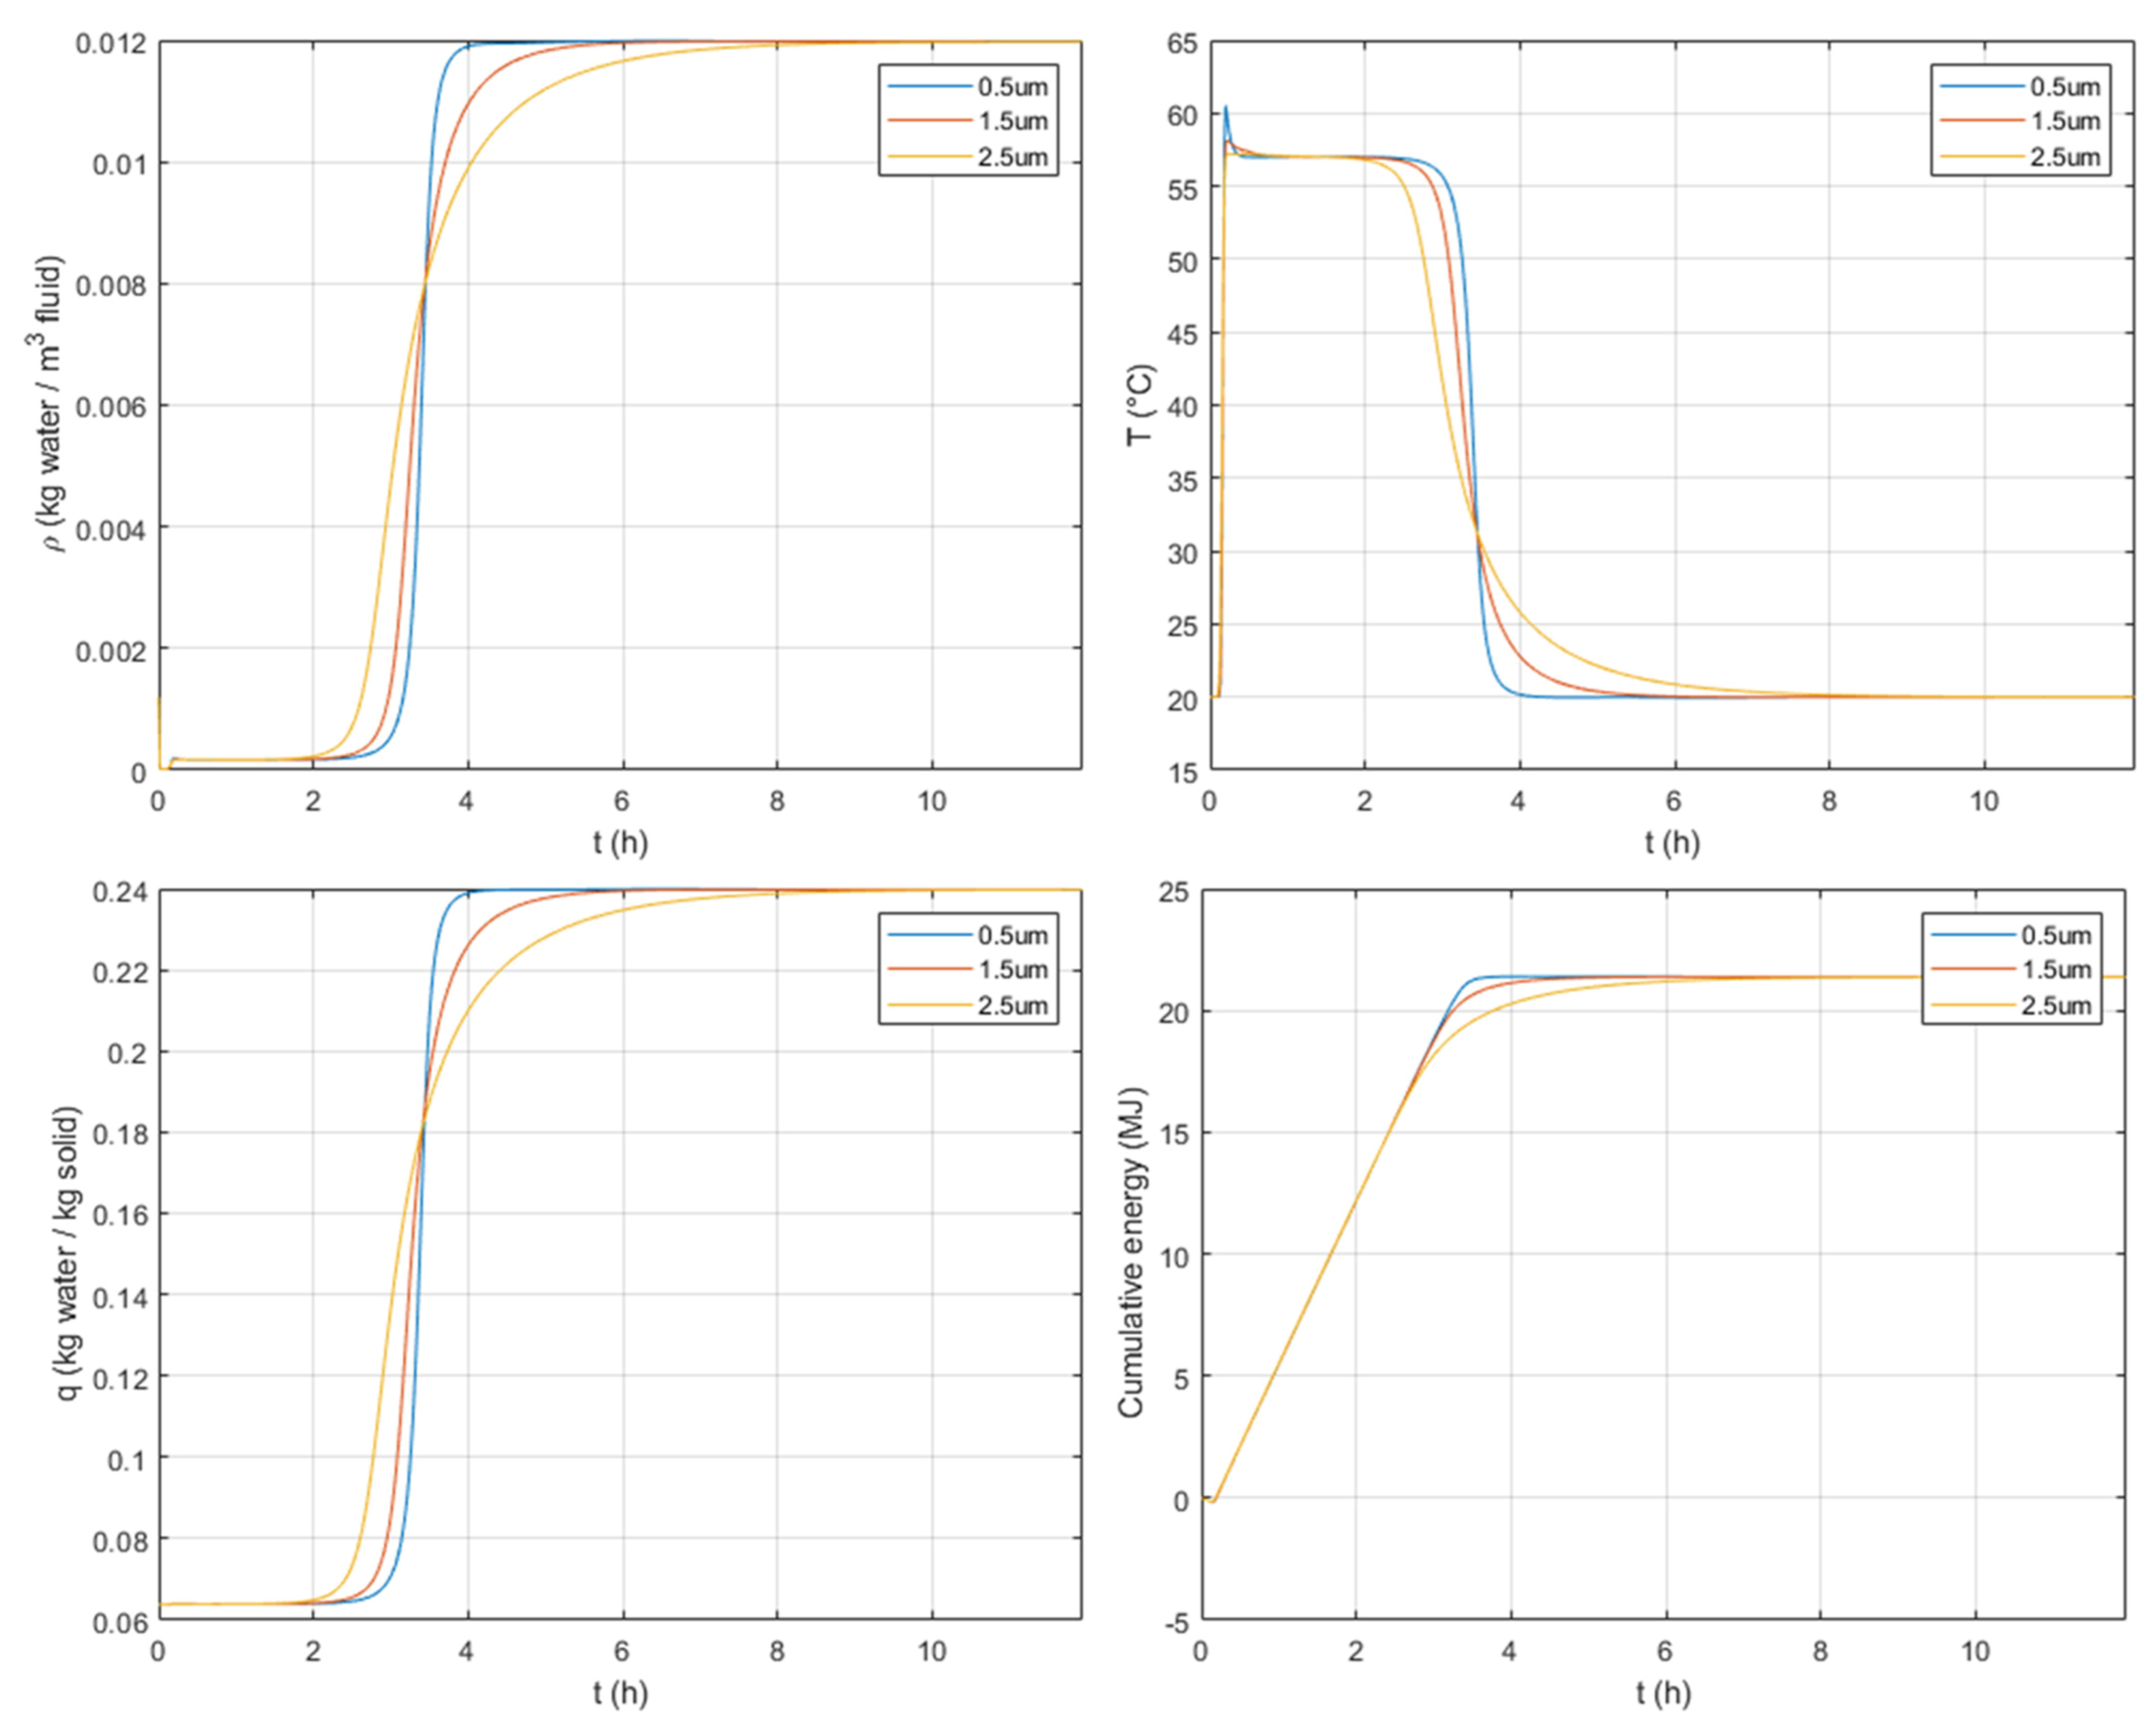
It is important to recall that the variation of the crystal size contributes to the variation of the mass transfer resistance within the crystal particles. This mass transfer resistance is given in Equation (17) and is proportional to the crystal size powered to 2 and divided by the intra-crystalline diffusivity. An increase in the crystal size therefore increases the mass transfer resistance.
As expected, in
Figure 11 one can observe that, for greater crystal sizes, the S-shape is dispersed, i.e., the increase in the crystal size generates a slower adsorption with longer breakthrough responses. This is followed by similar peaks of temperature but with a reduction of the duration of the temperature plateau. This leads to a slightly lower discharged energy in the transient response but with a similar amount of discharged heat at the end of the adsorption phase when the column is saturated.
3.3.5. Particle Size
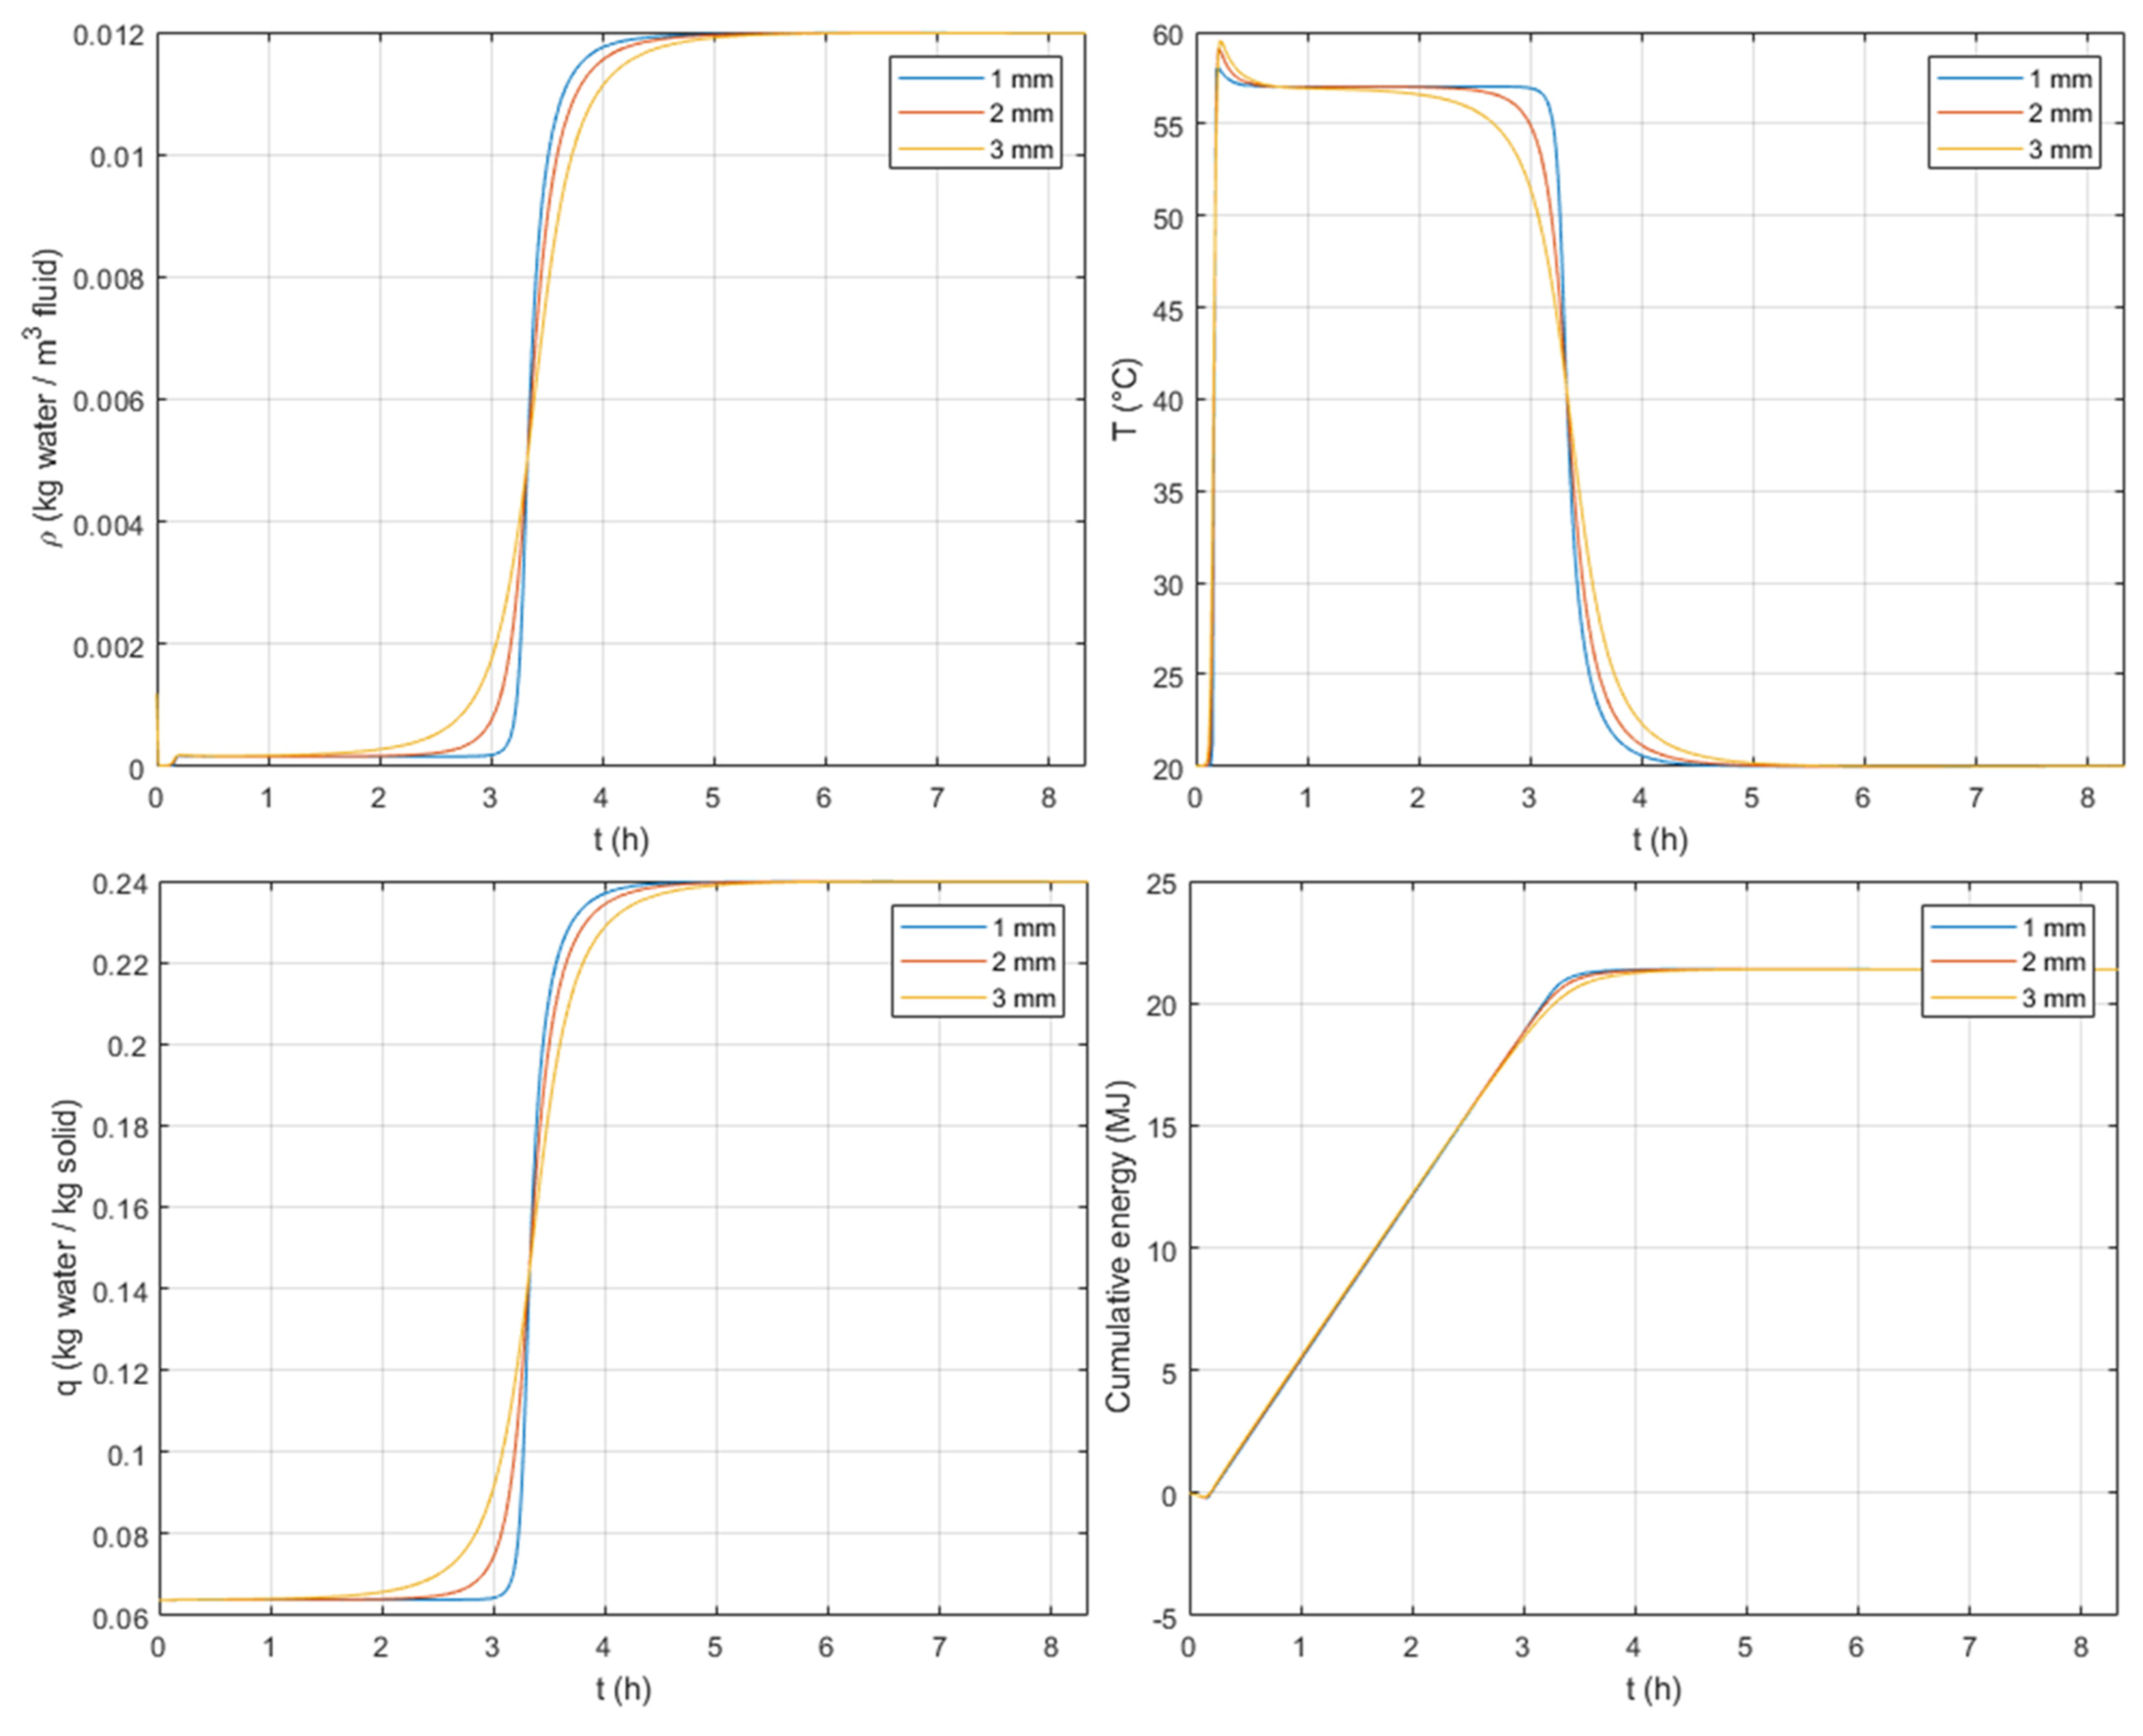
As mentioned previously, the internal macropore diffusion resistance is dominant at the beginning of the breakthrough curve. From
Figure 12, when looking at the S-shapes, one can observe, as expected, that the variation of the particle size has more impact at the beginning of the breakthrough curves.
When comparing the effect of crystal and particle sizes, one can observe from
Figure 11 and
Figure 12 that the crystal size has a greater impact on concentration and temperature profiles, especially on both duration and amount of heat stored, under the considered system design.
For larger particles, a similar behavior is observed as for crystal size, i.e., a slower adsorption and similar temperature peaks. Regarding the amount of heat discharged, every particle size tested gives similar values.
4. Conclusions
This work aimed to promote a sensitivity analysis on the operating conditions and design parameters of an open heat storage system in view of residential heat applications. This study helps in understanding the effect of each parameter on the concentration and temperature profiles, reached temperature peak, and the amount and duration of heat released. To do so, an open system with humid air and zeolite 13X was modelled, compared, and fitted to literature data.
From this thermal storage system, we have observed an amount of heat discharged of 24 MJ, which corresponds to 95 kWh/m
3 per bed volume. For a given characteristic day, 2000 W is the average power required for a Mozart type house with a 100 m
2 floor surface [
50]. The column herein simulated is able to reach a cumulated heat of 24 MJ in 2.5 h (for inlet conditions of 15 × 10
−3 kg/m
3, 20 °C, and superficial velocity of 0.12 m/s). This represents around 2667 W. Therefore, the volume occupied by the simulated column, which is of 0.07 m
3, would be sufficient to furnish the required 2000 W. We believe that, given the total unit size compared to the house volume, the use of adsorption storage systems seems feasible.
The parametric study suggests that the inlet temperature and concentration greatly affect the amount of heat discharged, the outlet temperature, and the discharge period. Hence, these two operating conditions should be optimized in order to reach the desired discharge temperature and duration during which heat is supplied.
For the studied adsorbent material—Z13X—if the consumer desires to have longer periods of discharge temperature, the system is able to do so by reducing the fluid velocity at the column inlet because fluid velocity does not clearly affect the mass transfer resistance (external resistance is not the limiting step). The decrease in velocity delays the breakthrough response without affecting the S-shape. This conclusion can differ for other adsorbent materials where the external mass transfer could be the limiting step.
Regarding the variation of the particle size and the crystal size, these both affect the mass transfer resistances. It can be observed that the increase in the crystal size leads to longer discharge periods but with a reduced temperature level. This is not advantageous to the system because it is probably better to have shorter discharge periods at the same level of temperature. The particle size does not seem to greatly affect the system response. This can be relevant if there is a requirement to increase the particle size and reduce the pressure drop, which is in agreement with the hypothesis made in this work.
Future work shall consist of the optimization of these operating and design parameters to fulfil the energy needs of a domestic heat system.
