1. Introduction
Technologically, a mini-refinery is a low-tonnage unit (with a capacity of up to 1 million tons/year) EDP-AVD (Electric Desalting Plant—Atmospheric-Vacuum Distillation) [
1], whose product streams are low-quality petroleum products: straight-run gasoline (naphtha) and diesel (gas oil) fractions, as well as fuel oil. Such installations are built as blocks for the preparation of raw materials for small petrochemical plants or for the industrial production of fuel in remote areas [
2].
As is known, the EDP-AVD units are the main units of the refinery; the efficient functioning of the split units determines the quality of the oil products obtained in the secondary processes [
3]. The costs of operating the process can reach up to 35% of the total energy consumption [
4]; therefore, the task of improving the hardware and technological design of the primary oil-refining process is urgent.
At the same time, as a result of stricter requirements for petroleum products and the transition to the production of higher quality motor fuels, some companies operating mini-refineries have supplemented their refineries’ technological schemes with various secondary processes [
1].
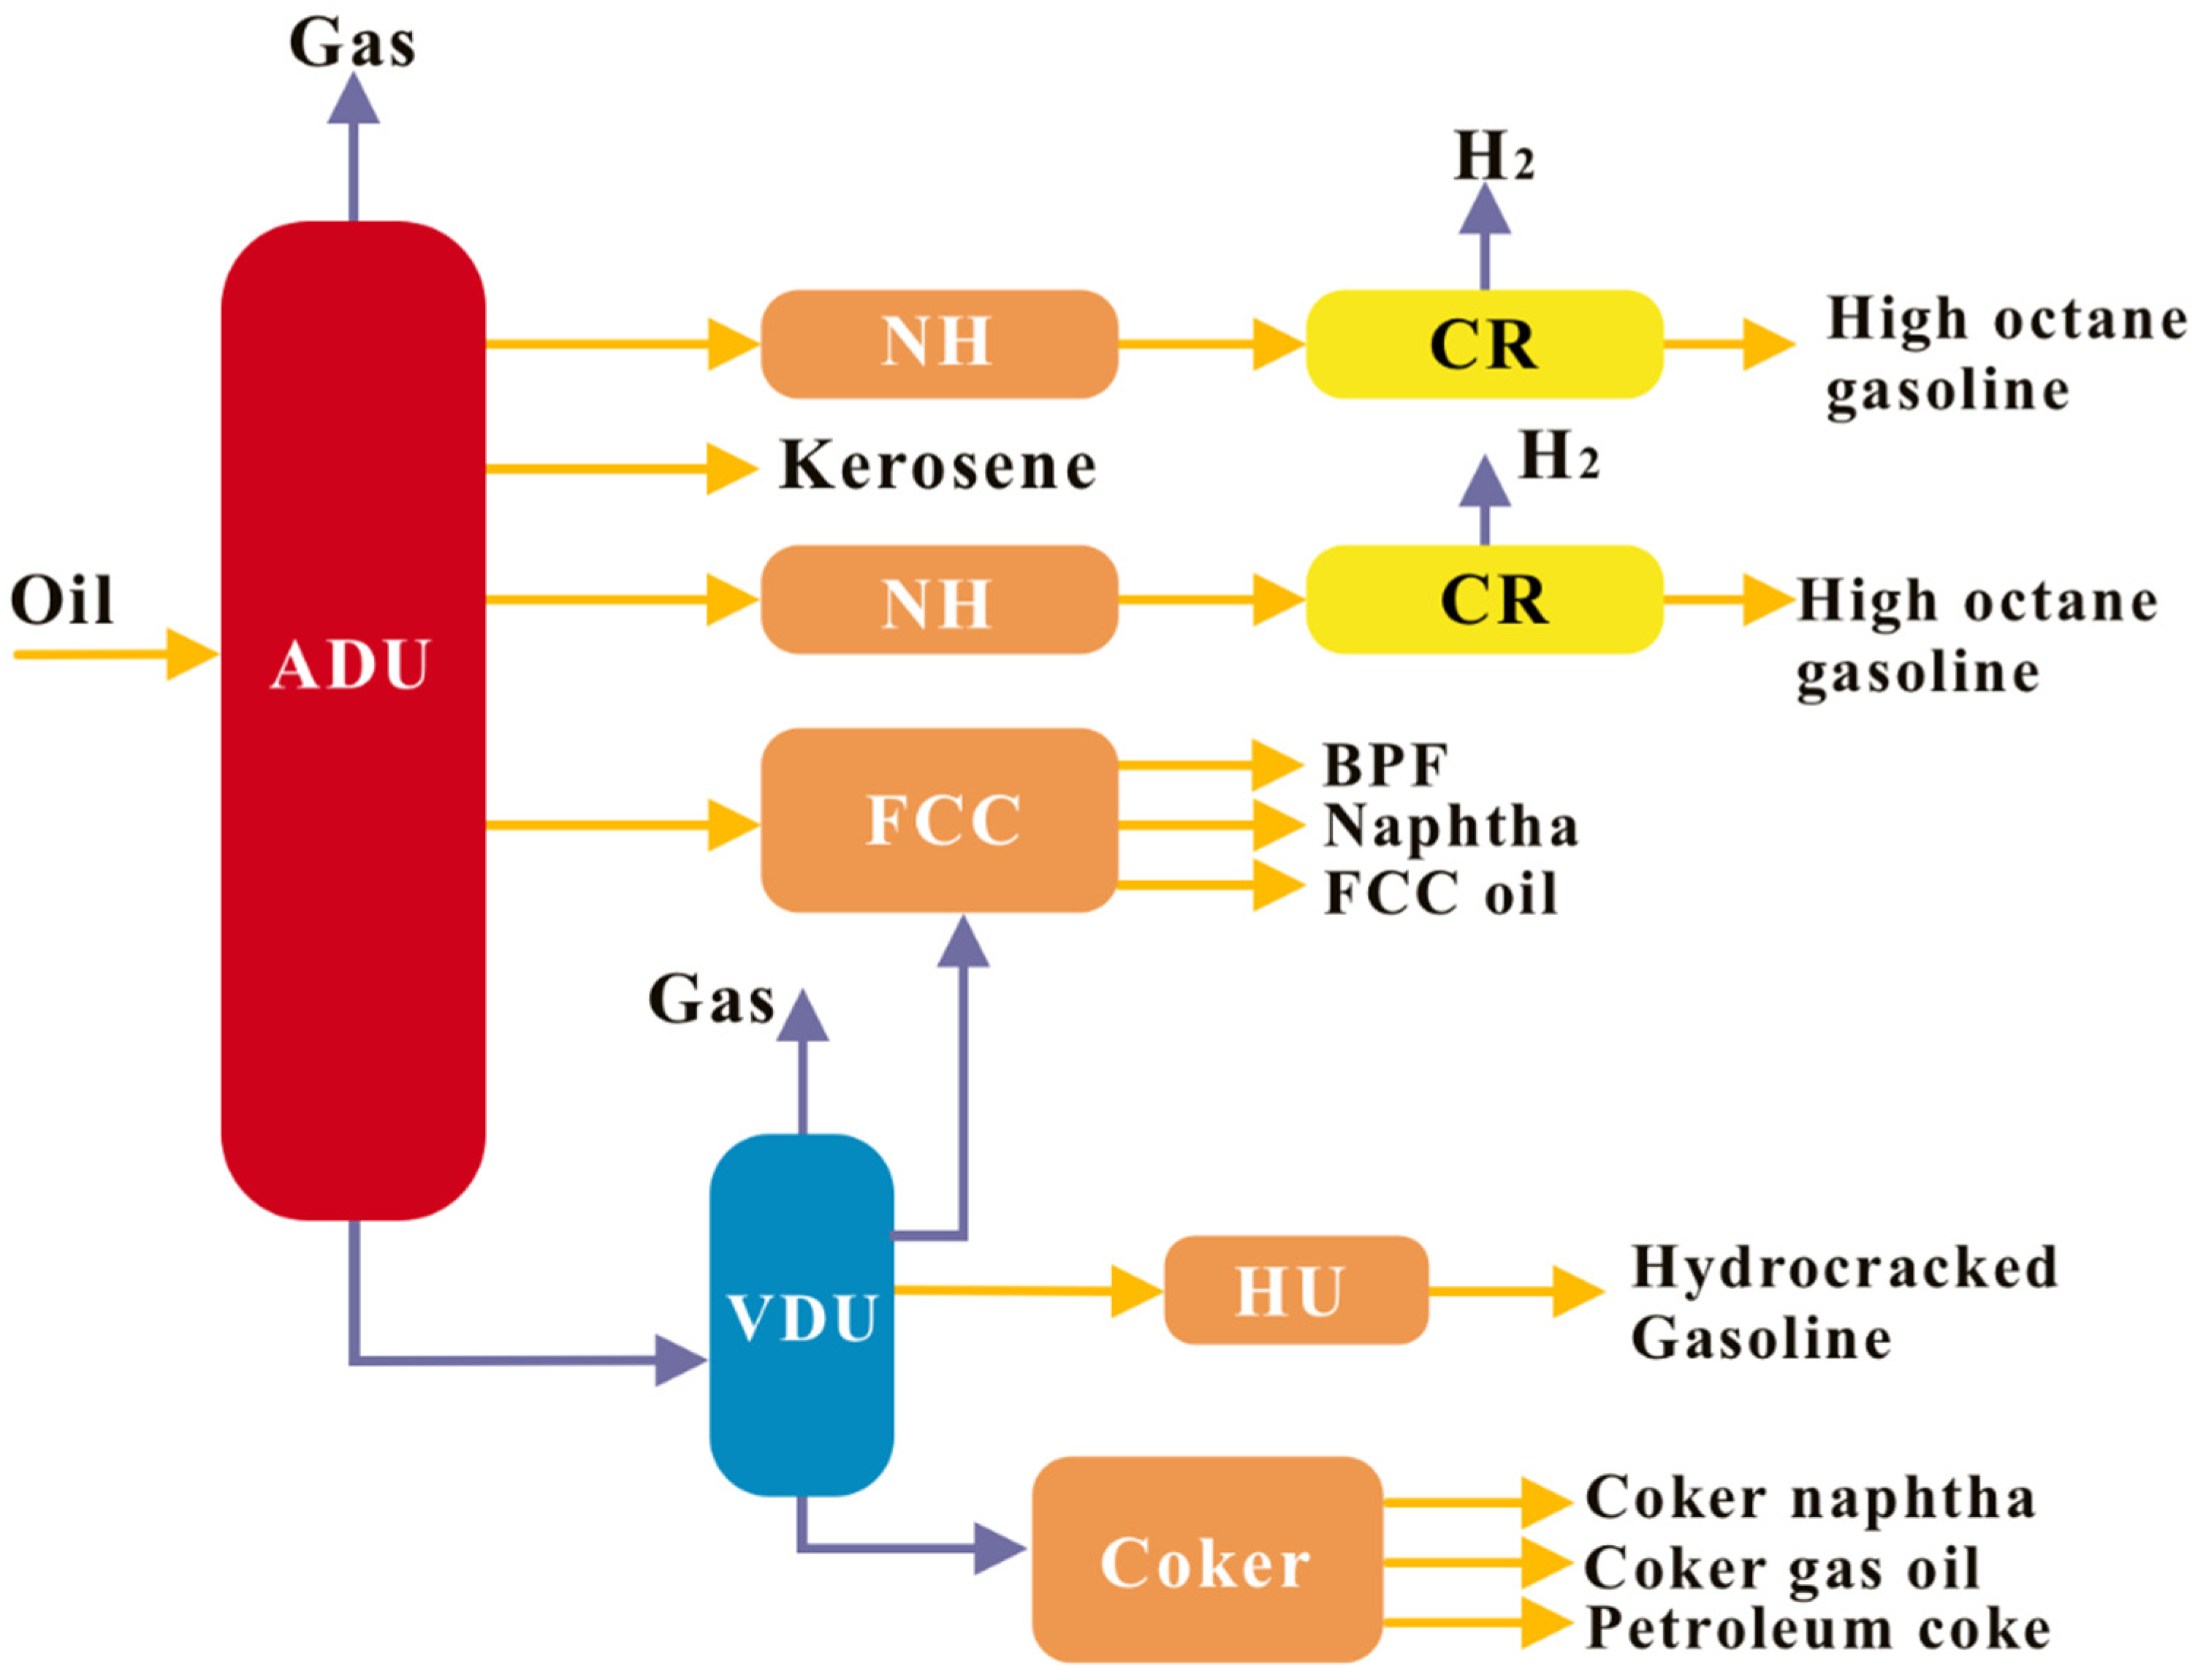
The possible configuration of a mini-refinery, according to [
1], is shown in
Figure 1.
A potential mini-refinery scheme makes it possible to not only obtain high-quality motor fuels but also feedstock for the petrochemical industry. However, based on the economic feasibility of producing certain products from crude oil, as well as climatic operating conditions (winter/summer), the schemes of real mini-refineries may differ significantly from those shown in
Figure 1.
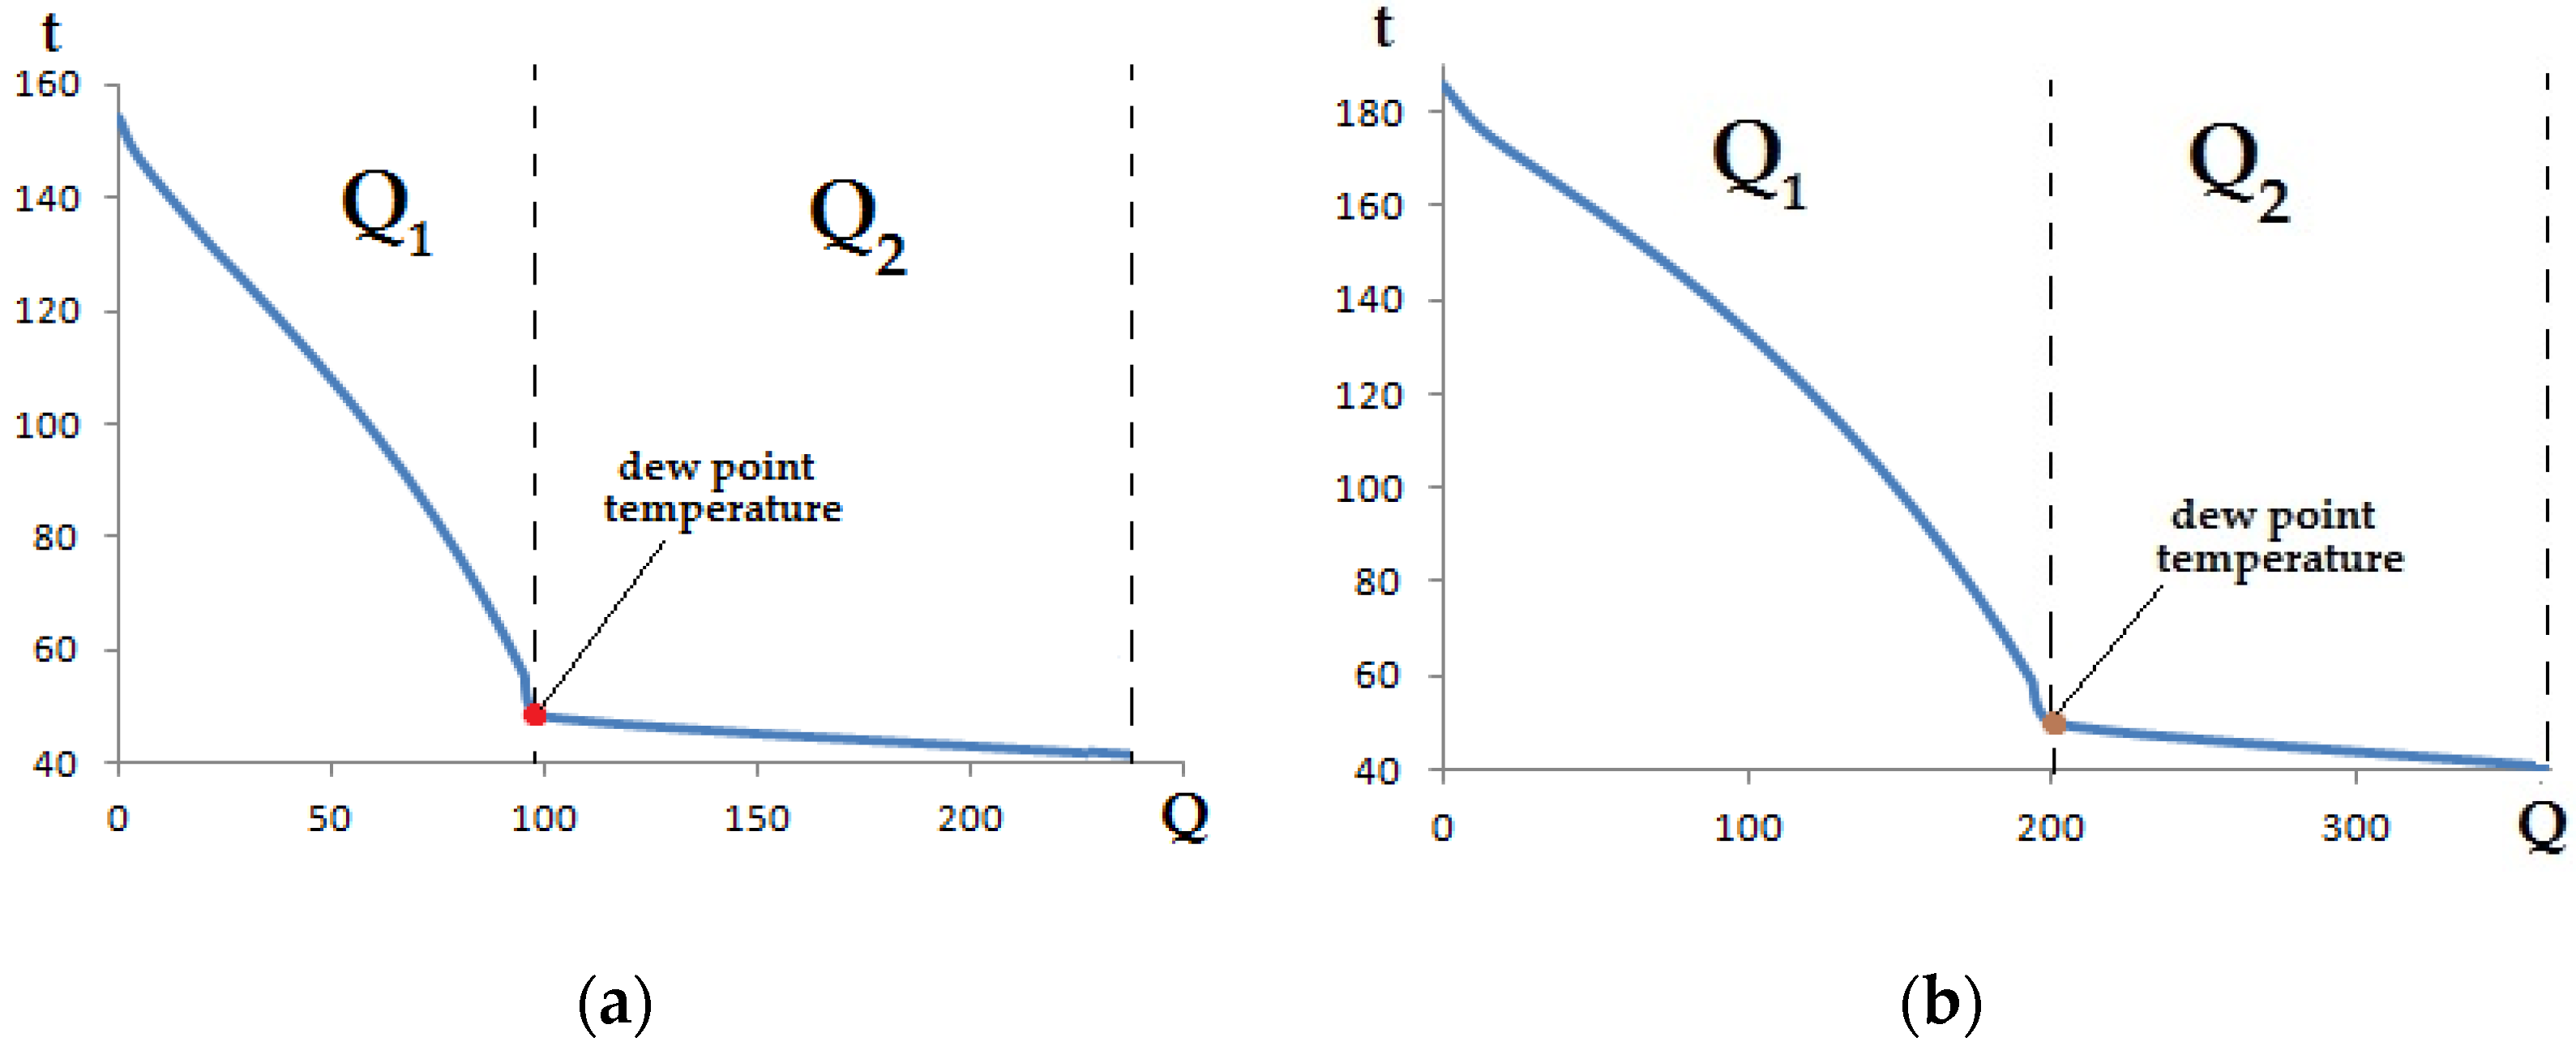
As an example, the diagrams (
Figure 2a,b) of factories located in Indonesia [
1] can be cited (as an example of a country with a warm climate).
For countries with a cold climate (for example, Russia), mini-refinery schemes differ in the design of both the vacuum unit and the secondary refining process. At the same time, fuel oil obtained by the atmospheric distillation of oil is not processed into vacuum distillates (as at large-scale refineries) but is used as a feedstock for obtaining tar or bitumen. In this case, tar can undergo an oxidation process (to obtain bitumen) or be discharged as a separate product to obtain boiler fuel oil or sealing mixtures based on it.
Typical schemes of two Russian mini-refineries in Urai and Kogalym are shown in
Figure 3a,b [
5].
Table 1 shows the main differences between the typical schemes of vacuum units of mini-refineries in countries with cold (Russia) and warm (Indonesia) climates. The comparison takes into account three of the most technically equipped mini-refineries of the Russian Federation with developed secondary processes and two mini-refineries of Indonesia. The schemes were compared according to the product streams produced on the vacuum column; the “+” sign signifies a greater preference for the production of the product, while the “−”indicates a small number of blocks involved in the development of this product.
The comparison shown in
Figure 3 is rather conjectural due to the small number of compared enterprises, but it clearly shows the main difference in the hardware and technological design of the blocks: in countries with a cold climate, vacuum blocks are mainly used for the production of bitumen and tar, and in countries with a hot climate, the main products are vacuum gas oils.
Such schemes of oil refining at mini-refineries are related to the fact that for road works, which are characterized by seasonality, bitumen is needed; it is more expedient to obtain and process bitumen on site than transport it from large refineries.
Consequently, the vacuum units of such refineries will be operated in different operating modes:
These modes are characterized by the different quality requirements (density and viscosity) of the bottom product. Therefore, when the device is operating in mode 1, deep extraction of diesel fraction [
4] is impractical because it will increase the conditional viscosity of the residue; it then becomes a problem to obtain high-quality road asphalt through direct oxidation. If the unit is operated in mode 2, the recovery rate of the diesel fraction will increase. In this case, the transition from one mode to another is accomplished by changing the pressure at the top of the distillation column.
When separating the fuel oil, the quality of the tar (and, consequently, bitumen) is greatly influenced by the distillation fraction of the vapor–gas mixture in the feed zone of the vacuum column, which in turn is determined by the temperature of the feedstock at the outlet of the furnace and the residual pressure at the inlet to the column [
6]. The pressure in the supply zone depends on the power of the VOS (vacuum overhead system) and the hydraulic resistance of the contact devices, which are determined by the design features of the internal devices of the apparatus [
7,
8].
Therefore, the task of designing a VOS for a fuel oil separation unit is inextricably linked with both the study of the characteristics of the column itself and the characteristics of the vacuum pump. While calculating these characteristics, the mutual influence of the system elements should be taken into account.
To date, there are enough articles in the open literature describing various types of VOS for vacuum columns of VDU units of large-scale refineries [
6,
7,
8,
9,
10]. At the same time, in works [
8,
11], the Vacuum Overhead System based on the steam ejector pump and liquid jet vacuum pump were compared, with a decrease in the residual pressure of the top of the vacuum column being taken into account as one of the criteria. However, the same pressure can also be obtained by upgrading (or replacing) the existing steam ejector pump, which makes the benefits of the liquid jet vacuum pump less obvious.
At the same time, it is quite problematic to scale up solutions applicable to vacuum blocks of large-scale refineries; this is associated with routine feedstock loads, which are several times smaller at mini-refineries.
For example, suppose a steam jet pump is chosen as the basis for the design of the vacuum overhead system, and then the problem of steam production arises. At large refineries, steam can be obtained by heat recovery at the plant itself [
12], and for mini-refineries, it is necessary to build a separate boiler house.
Therefore, based on all of the above, the authors of this work set the following goals:
to study the peculiarities of the functioning of the vacuum unit of the primary oil refining unit at the mini-refinery;
create a simulation model of the vacuum unit in the Universal Modeling Program environment and compare the calculation results with production data;
carry out computational studies at various operating modes of the installation on the developed model and identify the factors that have the greatest impact on the course of the technological process.
to conduct a technical and economic comparison of various types of Vacuum Overhead System (VOS) for the studied installation and develop recommendations for its improvement.
The study consists of 10 sections. In the introduction (
Section 1), the general technological design of the vacuum units of mini-refineries is given.
Section 2,
Section 3,
Section 4,
Section 5,
Section 6,
Section 7,
Section 8 and
Section 9 comprise the main parts of the article, which provide a literary review, goals, methods and results of the study. The final ninth section is devoted to the discussion of the results of the study; here, the authors express their take on the problem and compare the results obtained with other works devoted to the same topic.
2. Literature Review
The difference between mini-refineries and large oil refining enterprises lies in the output, which for mini-refineries does not exceed 1 million tons/year [
13]. This circumstance determines the significant difference in the hardware and technological design of the main blocks, the type of secondary processes and the product line. For example, many mini-refineries in Russia do not have vacuum units and are representative of the atmospheric part of the Electric Desalting Plant–Atmospheric-Vacuum Distillation (EDP-AVD) installation [
13,
14,
15]. If the vacuum block is present in the schema, then its purpose is production—the production of road bitumen or tar, which is often sent for mixing into the source oil. If vacuum gas oil is present in the product line, then by its properties it refers more to vacuum distillate (a component of diesel fuel) than to vacuum distillates produced at large oil refineries.
As a result, approaches to improving vacuum blocks differ. At large-capacity refineries, improvement consists in determining the optimal [
16,
17] technological parameters of the process, developing new highly efficient internal devices of the vacuum column [
17,
18,
19,
20] and selecting the optimal layout of vacuum-generating systems [
21,
22]. For vacuum units of mini-refineries, which are designed more for the production of road bitumen, the efficiency of the vacuum overhead system plays a big role since the quality of vacuum gas oils is of secondary importance (motor fuels are obtained by the secondary process of the atmospheric part).
Traditionally, the calculation of a vacuum system consists in determining and selecting a vacuum pump, determining the conductivity and recalculating the passport characteristics of the pump for new operating conditions [
23,
24]. The choice of the optimal type of vacuum overhead system is limited by recommendations on the scope of application of vacuum pumps of various types [
23], while the mutual influence of the properties of the vacuum column and the vacuum overhead system are not taken into account, which can lead to design errors. When calculating the vacuum pump using the existing methods according to the known parameters of the state of the streams entering the pumping station, the passport characteristics of the pump are recalculated by introducing various corrections [
24].
With regard to an industrial vacuum overhead system, classical methods of calculating the conductivity must be supplemented by estimates of associated processes (condensation of the water vapor, saturation fluid, lightweight components, etc.).
When the choice of the optimal type of vacuum overhead system is limited to the recommendations made for applications of vacuum pumps of various types, the mutual influence of the properties of the vacuum columns and the vacuum overhead system are not considered, which may lead to errors in the design.
Practically any vacuum overhead system [
23,
24,
25,
26] is a combination of a vacuum pump and various types of equipment, often heat exchangers, for which temperatures are assigned a priori. At the same time, the technological object itself is operated in various modes, which are characterized by completely different values of technological parameters. Designers are forced to select the pump for the most “harsh” operating conditions and introduce a margin factor, which may not be enough when switching from one mode to another.
To date, a unified methodology for the design and calculation of vacuum overhead systems for industrial installations for the processing of fuel oil has not been formed. There is also no consensus on the optimal type of secondary processes after the vacuum column [
13,
14,
15], which often depend on the economic feasibility and pricing for products and energy resources.
3. Methodology
The study and analysis of the functioning of the vacuum unit of a mini-refinery is a complex task that is difficult to implement without the use of computer technology. Since this problem lies at the intersection of two sciences (chemical engineering and vacuum engineering), the calculation employed a system analysis strategy, which is used in the study of such objects [
27].
Some critical parameters necessary for the design of the VOS cannot be measured directly at the installation, or it is very difficult to do. Therefore, for this purpose, a mathematical model of the installation under study was compiled while using the capabilities of the Unisim Design R451 software package.
The object under study was considered as a functional system characterized by the presence of vectors of input (affecting the state of the process) and output variables (determining the state of the process). Input variables were determined during the technological inspection of the unit and are indications of standard devices installed on the installation. Moreover, some parameters were measured directly on the installation with portable devices, the parameters of which are shown in
Table 2.
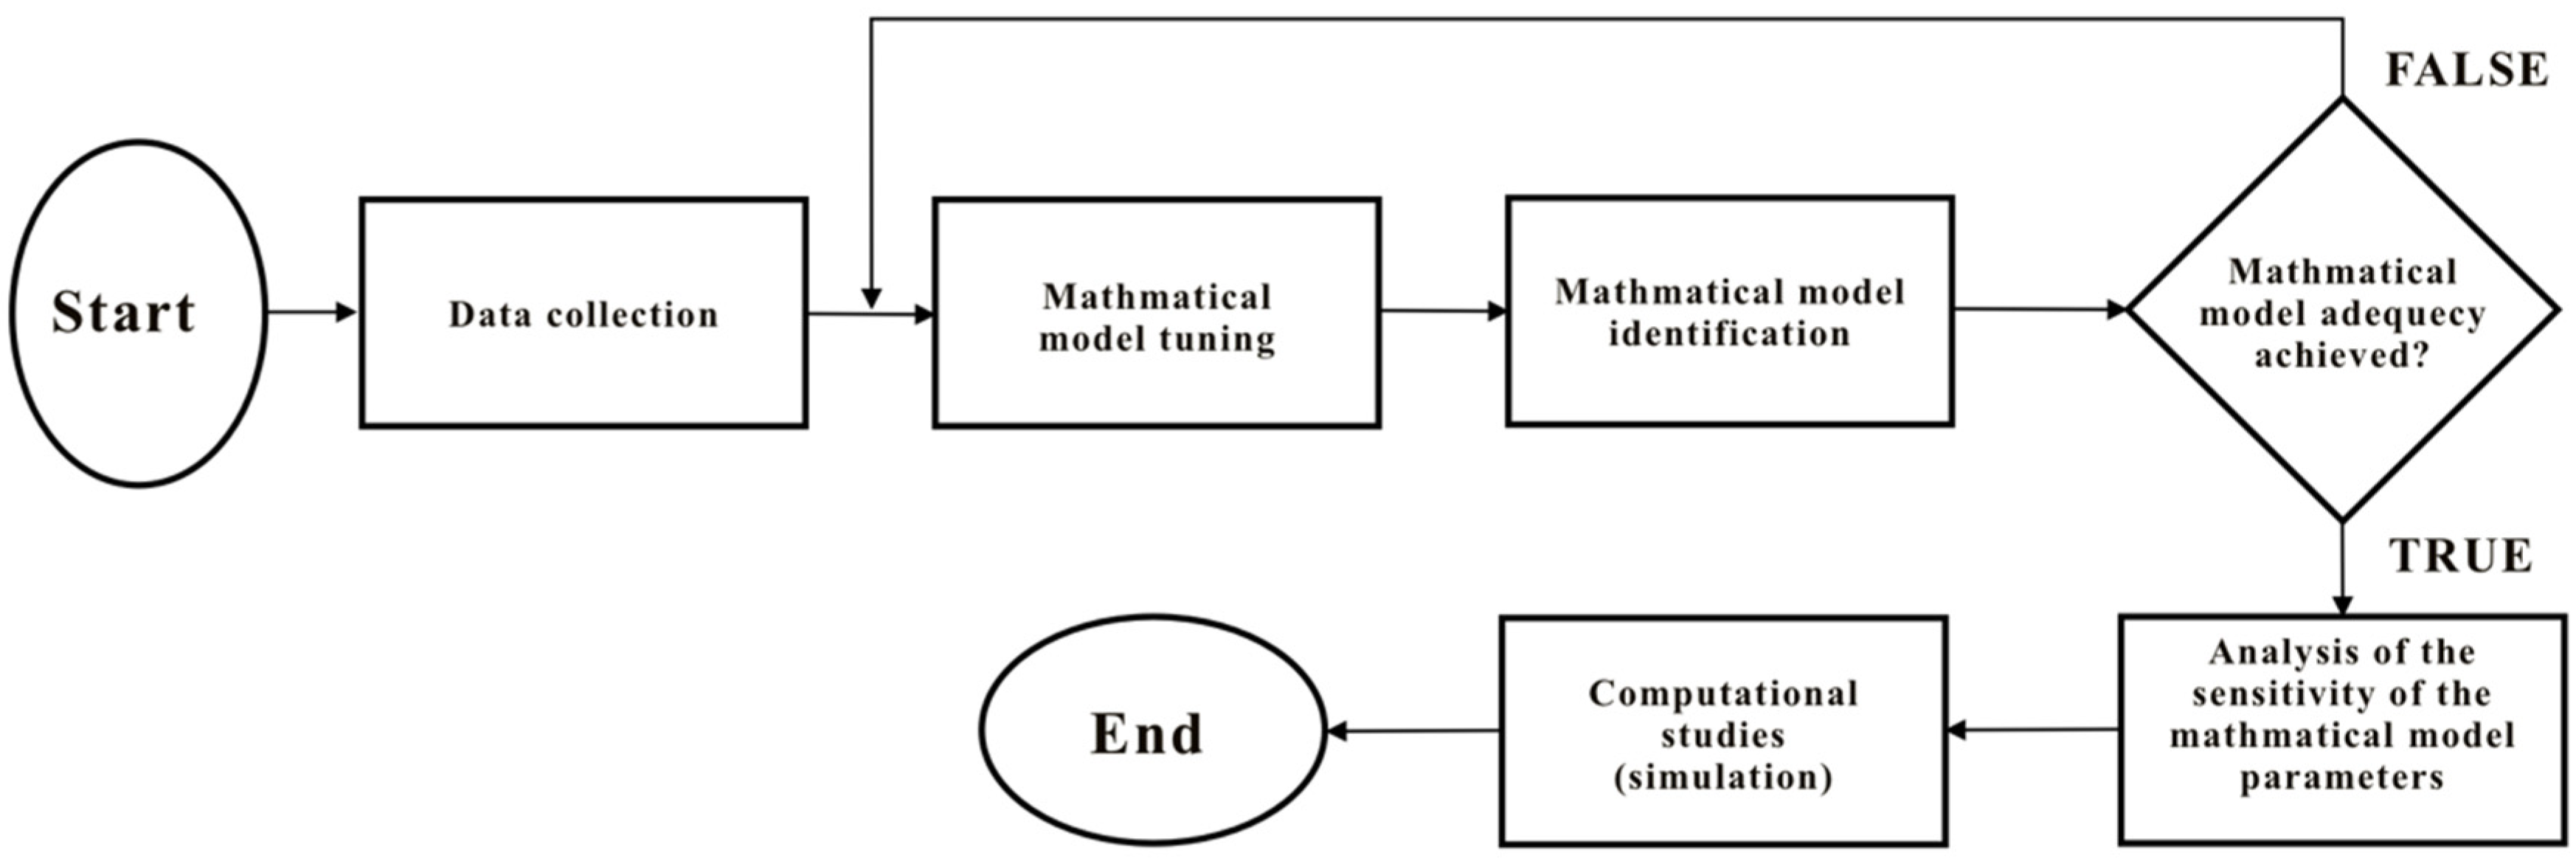
The methodology of the study is shown in the
Figure 4.
At the first stage, data was collected on the installation, and the following were recorded: the necessary data from the regime sheets, the readings of the instruments installed in place and the instruments’ readings that could be accessed remotely.
Portable devices measured those parameters that could not be measured by standard devices. The suction pressure of the VOS was measured with an optical micromanometer, and the Testo pyrometer was used to determine the temperature of the circulating water at the outlet of the intermediate condensers of the existing steam ejector pump. The course of the research is described in more detail in
Section 5.
All these values were used at the second stage, during which a mathematical model of the vacuum unit was developed in the Unisim Design R451 software package, the adequacy of which (the third stage) was checked by comparing the calculated values with the data collected at the first stage. The fourth stage involved simulation studies, the purpose of which was to study the effect of the characteristics of the Vacuum overhead system on the level of residual pressure at the top of the vacuum column. The final stage was the determination of the vacuum overhead system layout and the feasibility of studying various layout options.
4. Description of the Research Object
The object of this research is the K-1 vacuum column, which is designed for the processing of fuel oil to obtain a diesel fraction and a heavy residue. The schematic diagram of the installation and the general view of the rectification column are shown in
Figure 5a,b.
Fuel oil from the atmospheric column enters the coils of the H-1 furnace, where it is heated to a temperature of 360–390 °C and is thereafter fed into the feed stage of the K-1 vacuum column. To improve the volatility and stripping of light fractions from the fuel oil, superheated steam is fed into the column bottom.
From the top of the K-1 vacuum column, a steam–gas mixture is discharged, which, through the helmet line, enters the annular space of the condenser-cooler KP-1, from which non-condensed gases are pumped out by a steam jet pump.
The wide distillate fraction is withdrawn from the column by side withdrawal from the K-1 column, enters the shell side of the cooler X-1 and is then divided into 2 streams: the first is fed to the top of the K-1 column as cold reflux, and the second stream, the balance excess, is sent further through the oil return pipeline system.
At the bottom part of column K-1, the residue (tar) is pumped through the heat exchanger T-1, where it heats the demineralized oil, after which it is divided into two streams. The first stream is returned to the bottom of column K-1 in order to maintain the temperature at a given level to prevent tar decomposition, and the balance excess is removed.
The main element of the unit is the K-1 vacuum column, which is a vertical cylindrical device of constant diameter with valve plates installed inside. The initial steam–gas mixture after heating in the furnace enters the feed stage, where it is divided into streams of ascending steam and descending liquid. To create a steam flow and reduce the partial pressure of the mixture, superheated low-pressure water vapor is introduced into the cubic part, and to create a reflux flow, some of the vapors condensed in the preliminary condenser are returned to the column on the upper stage. The column parameters are given in
Table 3.
The following products are obtained: a fraction of vacuum distillate (vacuum gas oil) and the remainder—tar. Tar is used as a raw material of a bitumen plant (1st mode of operation) or as a substandard residue (2nd mode of operation), which is sent for mixing with commercial oil.
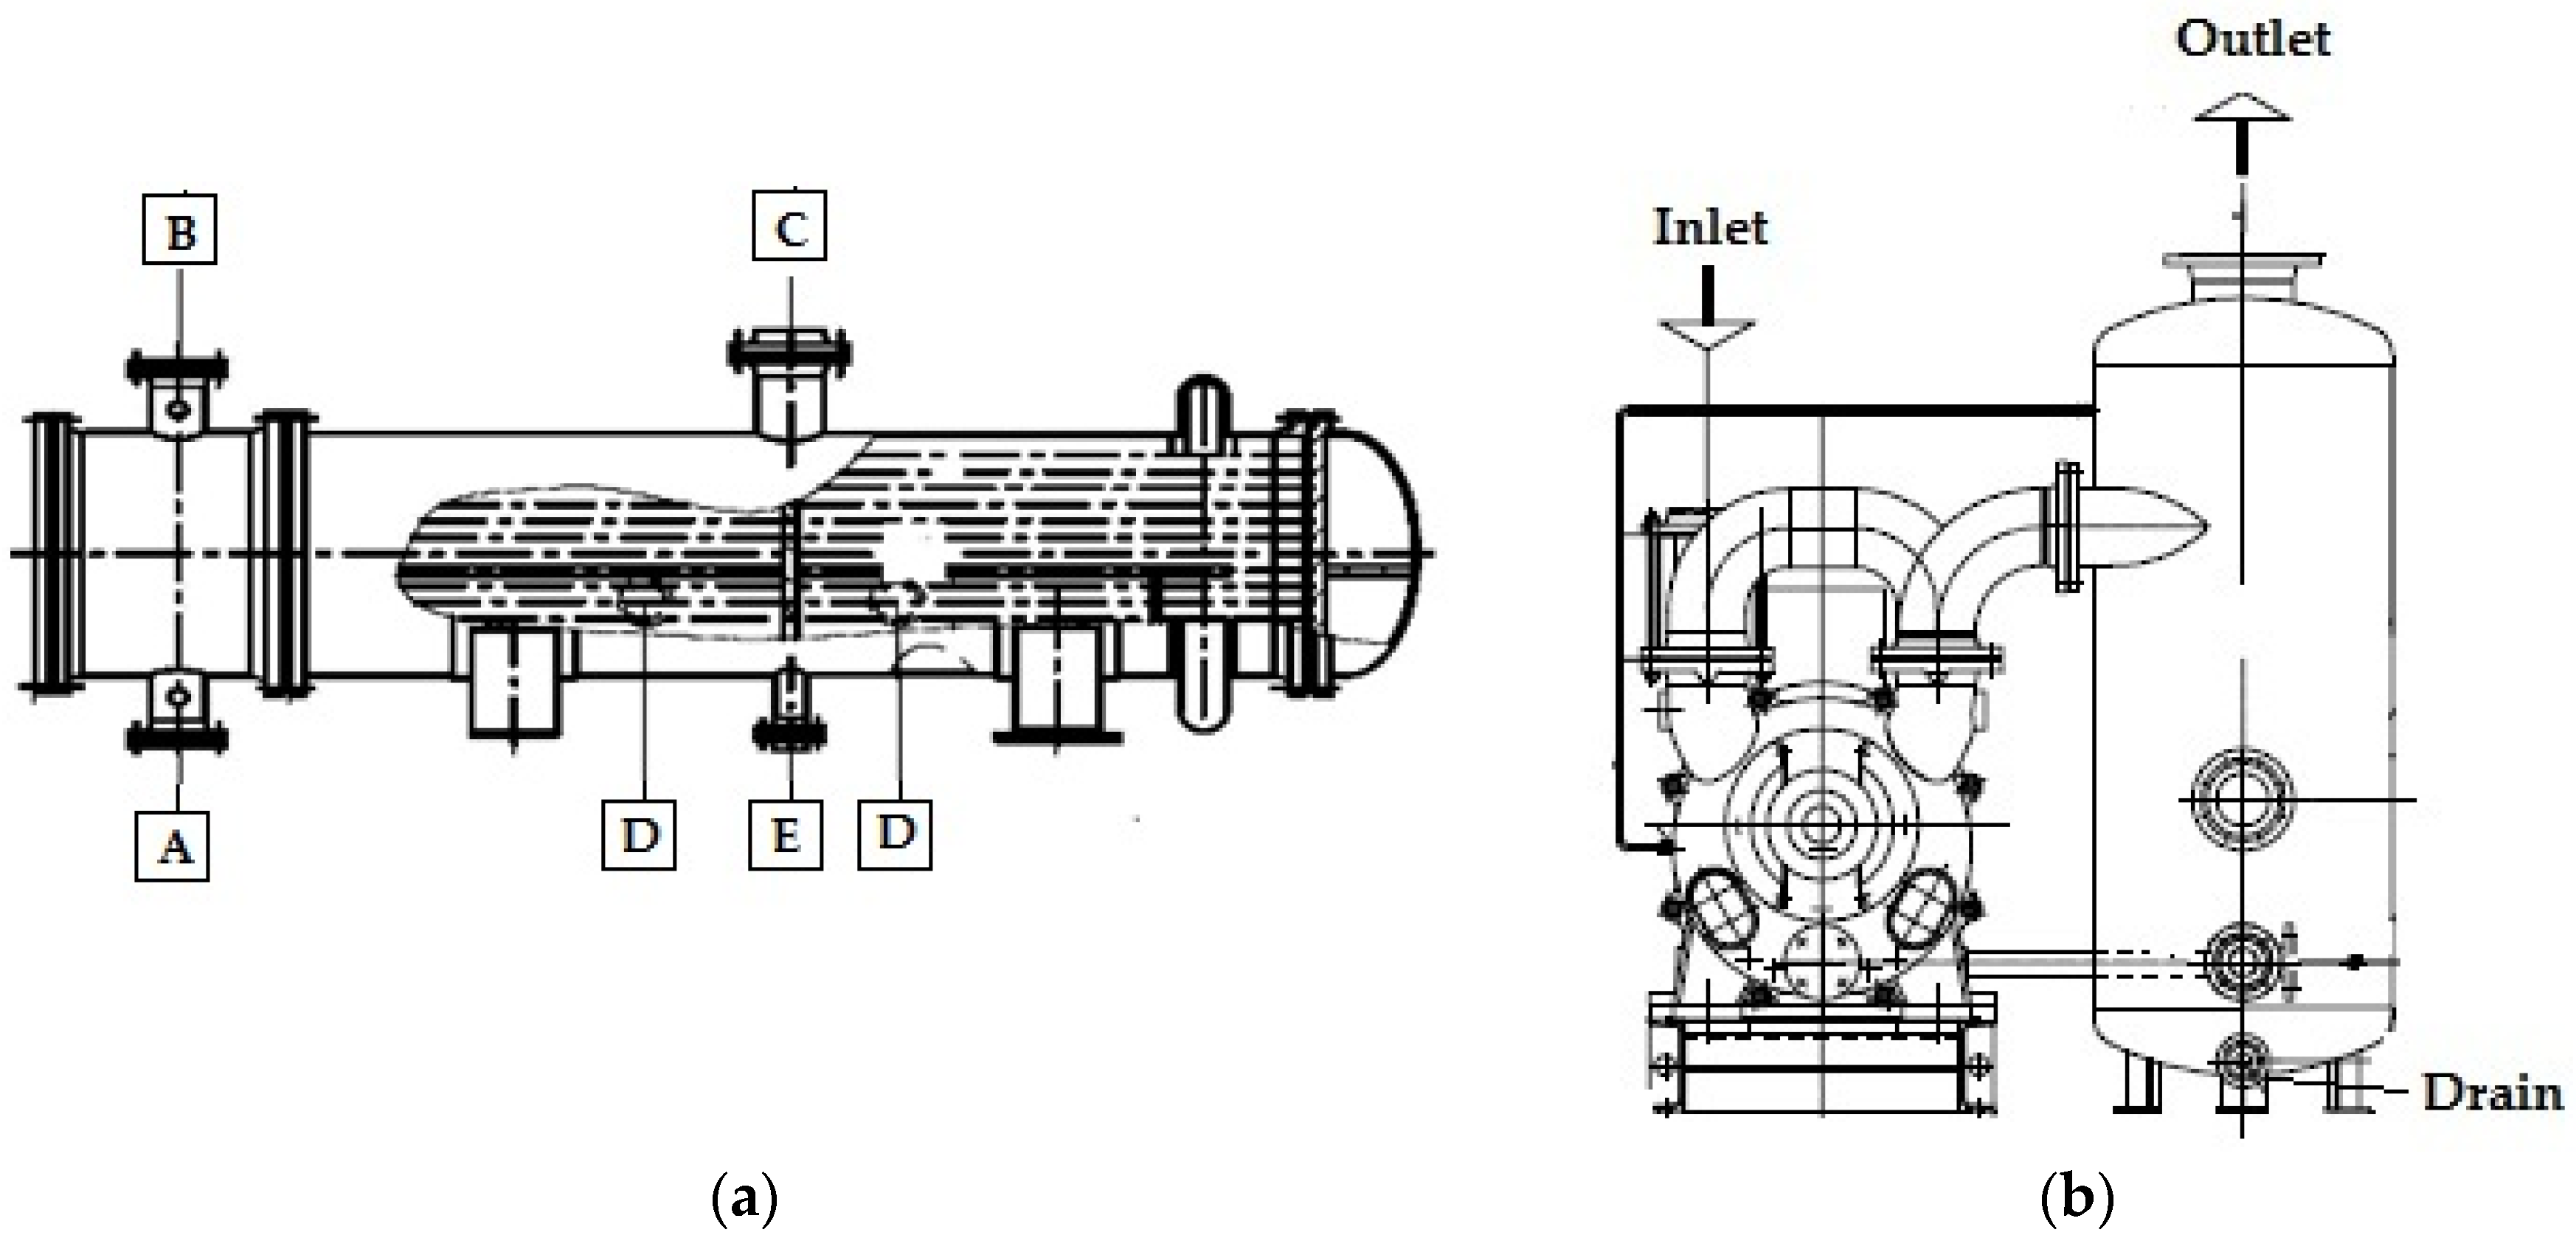
The vacuum condenser is installed in the upper part of the distillation unit at a height of 10.8 m. It is in this device that the stream entering the VOS for pumping is formed. The KP-1 vacuum condenser is a horizontal shell-and-tube heat exchanger with a floating head with a length of 3980 mm and a body diameter of 530 mm. The length of the pipes is 3000 mm, the pipes are 25 × 2 mm and the number of passes in the pipe space is 2.
The steam–gas mixture from the upper part of the vacuum column is fed into the annular space of the condenser; the condensate is discharged through the lower nozzle. A general view of the KP-1 condenser is shown in
Figure 6.
The condenser parameters are presented in
Table 4.
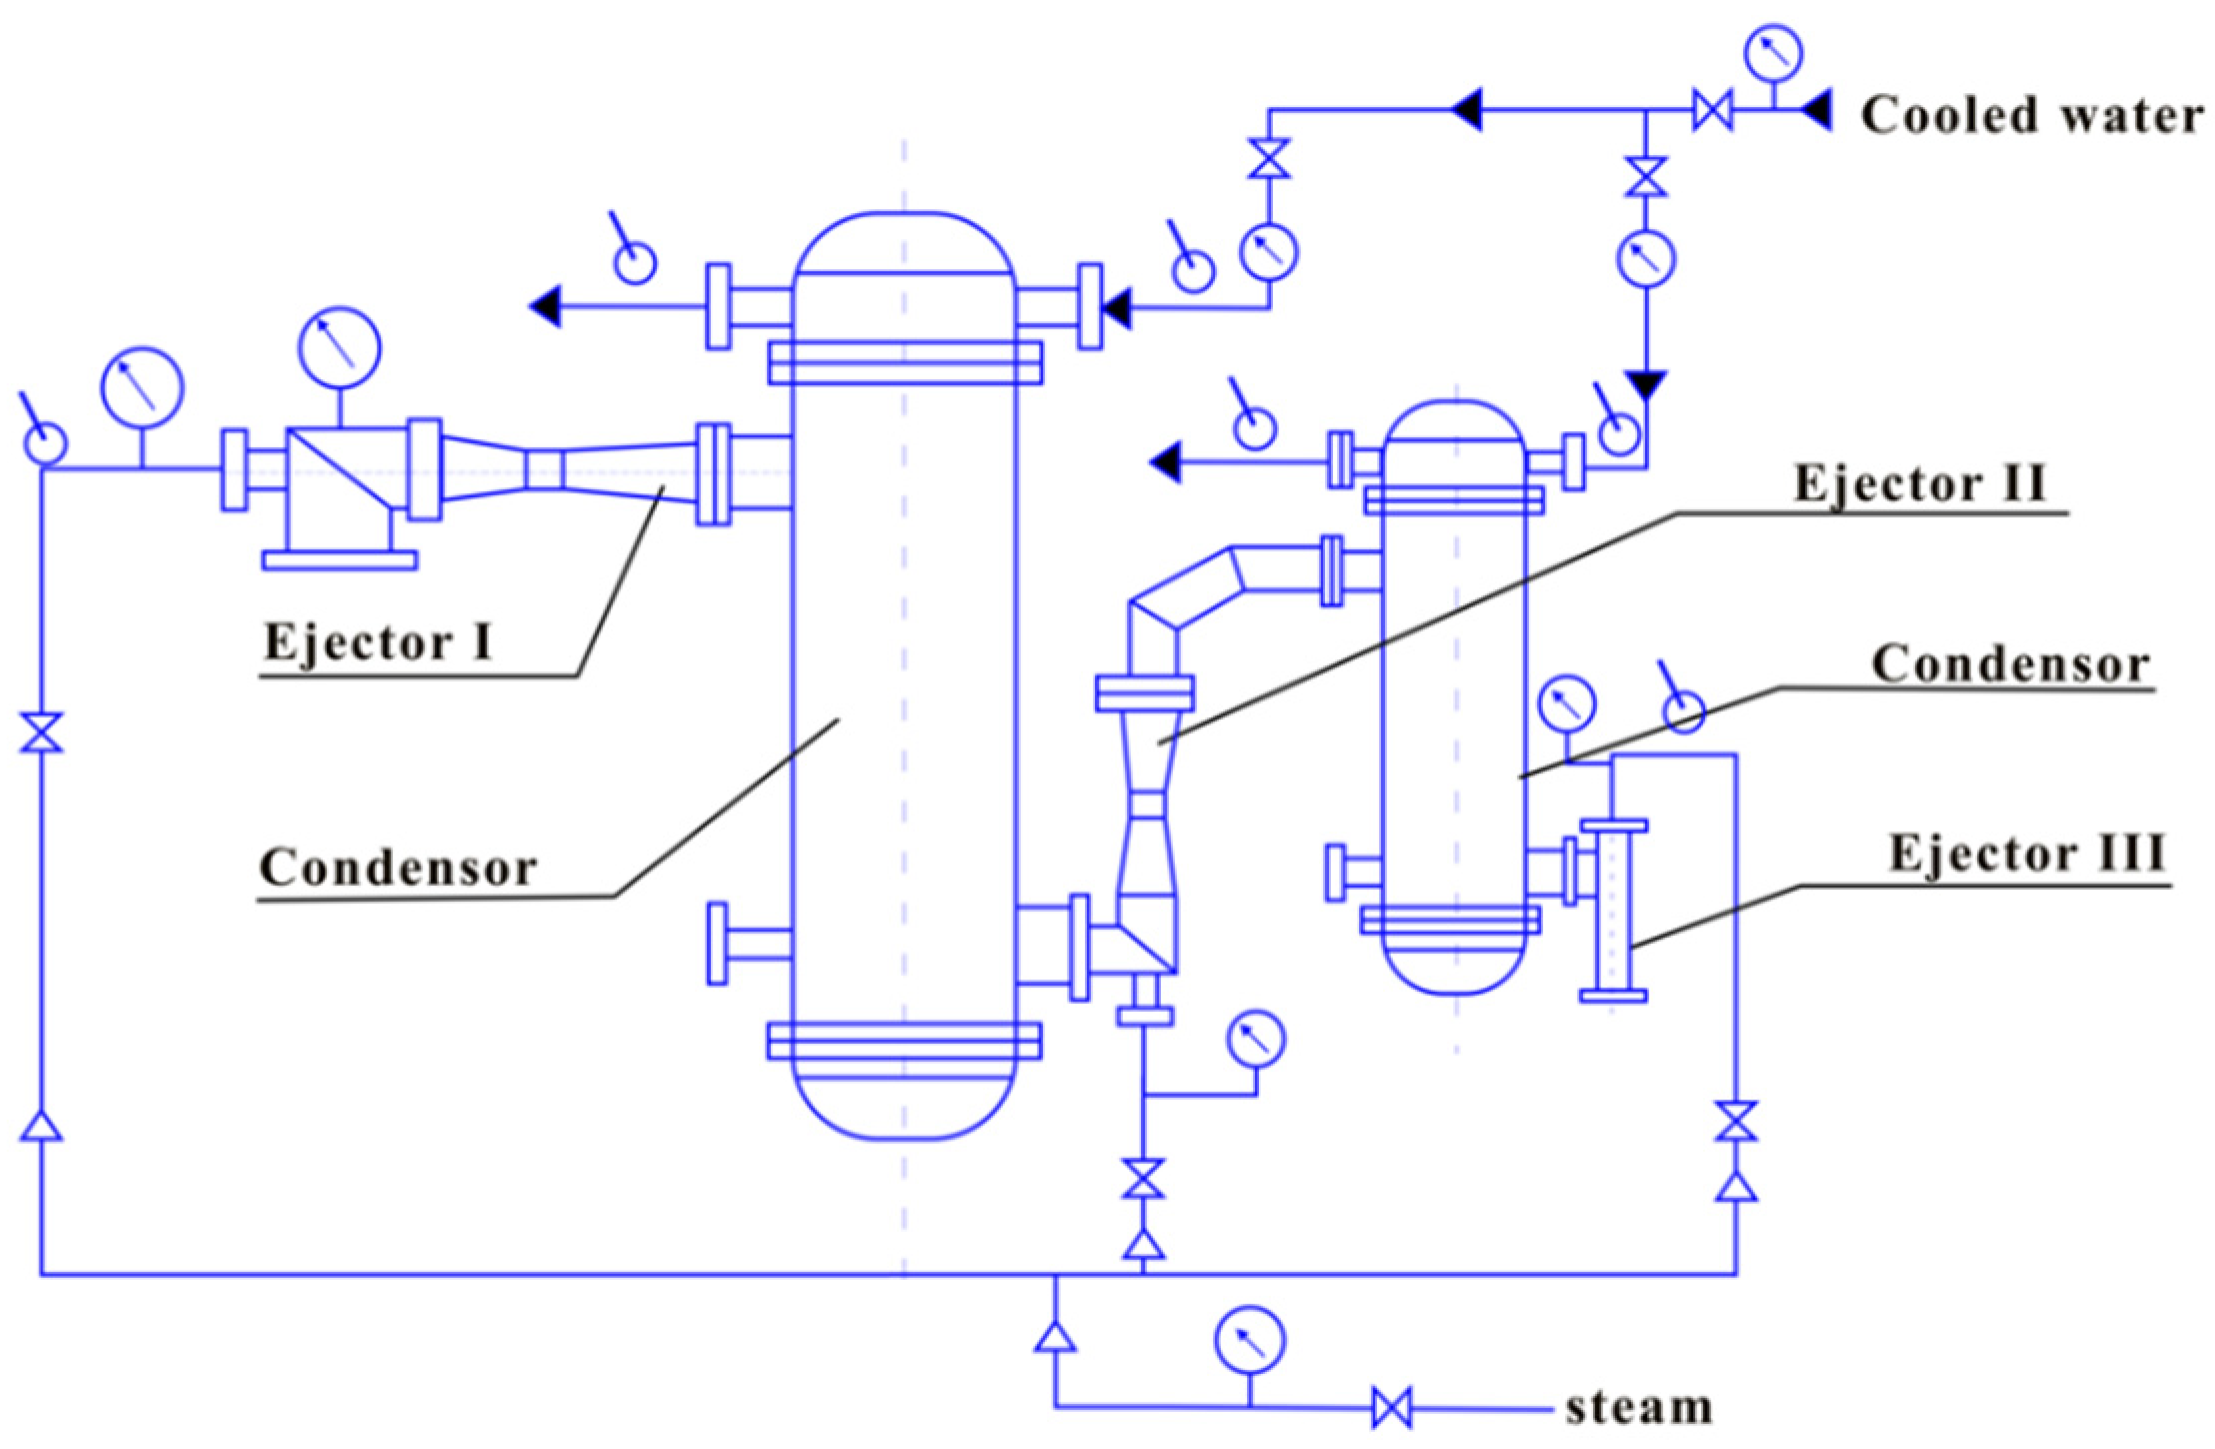
The vacuum in the column is created by a three-stage steam jet pump NVE 100 × 40/6N UHL. Schematic diagram of the pump in
Figure 7.
The first and second stages, as well as the second and third stages, of ejection are connected to each other through intermediate capacitors. The third stage of the steam ejector pump is directly connected to the exhaust line of the pump, which is connected to a special nozzle of the P-3 furnace designed to neutralize (burn) exhaust gases, and to the flare line (connected in case of violations of the technological regime).
The design capacity of the pump is 100 kg/h for the pumped gas, and the design suction pressure is 40 mmHg. Saturated water vapor with a pressure of 0.6 MPa (6 kg/cm2) is provided as a working fluid in the steam ejector pump.
5. Collecting Data on the Parameters of the Main Technological Streams
A fully fledged study of the behavior of an industrial plant is very difficult without mathematical modeling tools. This is due to the fact that some of the parameters cannot be measured directly, or it is very challenging to do so. However, in order to draw up a sufficiently accurate mathematical model of the investigated installation, it is necessary to collect initial data that will be used as data in the calculation.
To date, the study of industrial installations for oil refining is impossible without the use of mathematical modeling tools and universal modeling programs [
28,
29,
30].
To draw up a calculation scheme and its identification on the investigated vacuum unit, an industrial survey was carried out; under its framework, the readings of the devices operating at the installation were collected, and some process indicators were measured with portable devices that were not directly controlled by the plant’s operating personnel.
The survey plan consisted of the following stages:
Collecting data on the parameters of the main technological streams by measuring the temperature and pressure profiles along the path of the SGM.
Inspection of the condenser KP-1.
Collecting data on the existing VOS.
Data collection was carried out by taking readings from the devices installed on the installation (“on the board” and on site), as well as by measuring the required flows using special equipment (a pyrometer and vacuum gauge).
The feed of the process is the residue of ADU, having the following characteristics (
Table 5 and
Table 6):
As a product, the plant outputs tar, the parameters of which are presented in
Table 6.
The temperature of the processes was measured by recording the readings of stationary instruments on the operator’s panel. In those areas where stationary instruments are not installed, the readings were determined using a TESTO pyrometer. The areas where the readings were taken were pre-cleaned from paint to metal, and the readings of the device were entered into a table.
The main technological parameters that were measured during the survey are presented in
Table 7.
The parameters of the technological mode of the block in the production of bitumen are assigned by averaging the data of the regime sheets without instrumental measurement. Atmospheric pressure during the survey period was 742 mm Hg.
5.1. Inspection of the Condenser KP-1
The pressure drop between the KP-1 condenser and the top of the K-1 column was determined by measuring the pressure drop between the K-1 top and the vacuum overhead system inlet. The column top pressure was determined by the readings of a sensor installed on the column, and the pressure at the inlet to the vacuum overhead system was determined by an OM-6 optical micromanometer, which was installed at the inlet to the steam ejector pump. During the measurement, a significant pressure drop was noted (18 mm Hg in the tar discharge mode and 12 mm Hg in the bitumen discharge mode).
The temperature of the exhaust gases from KP-1 turned out to be quite high—44 °C. The difference between the temperatures of the exhaust gases and the return cooling water reached 22 °C, which seems to be excessively large, especially for condensers of fuel oil rectification units under vacuum. In the existing mode of operation of the condenser, a sufficiently deep condensation of not only water vapor but also the vapor of heavy hydrocarbons is not ensured. As a result, the concentration of water vapor in the gas phase entering the VOS exceeds 90%. Such a high concentration of water vapor during the subsequent reconstruction of the VOS will have a very negative effect on the operation of the VOS.
5.2. Analysis of Vacuum Overhead System Performance Indicators
The passport characteristics [
30,
31] of the existing vacuum overhead are presented in
Table 8 and in
Figure 8.
When examining the VOS, the following parameters were measured: pressure of the working steam at the inlet to the steam ejector; the temperature of the cooling water at the inlet to the intermediate condensers; the temperature of the cooling water leaving the intermediate condensers.
The values of the changed parameters are presented in
Table 9.
According to the passport of the steam ejector pump [
30], the nominal pressure of the working steam at the inlet to the ejectors must be at least 6 kg/cm
2. This value is key in the operation of the SEP, since it is this value that determines the value of the residual pressure reached by the pump. As can be seen in
Table 9, the actual value of the vapor pressure differs significantly from the passport value.
To assess the influence of the working steam pressure on the pressure of the top of the vacuum column, an industrial experiment was carried out: the pressure of the top of the column was recorded with a stepwise change in the pressure of the working steam supplied to the steam ejector pumps. The measurement results are shown in
Table 10 and
Figure 8.
It was also found that the pressure of the top in the K-1 column depends significantly on the conditions for removing exhaust gases from the SEP: when the gas is discharged to the flare, the pressure in the column decreases in comparison with the option of removing gases for combustion into the furnace. This indicates the presence of a noticeable hydraulic resistance in this line.
Under the operating modes of the vacuum unit at the refinery, based on the task of ensuring the quality of commercial bitumen, the pressure of the top of the column is deliberately overestimated due to throttling of the working steam supplied to the SEP ejectors, which leads to a decrease in the nominal capacity of the existing VOS and an increase in pressure in K-3
6. Calculation Diagram of the Process
6.1. Thermodynamic Model
The computational study of complex chemical-technological systems is arduous without the use of specialized computing software. When solving such problems (modeling a real technological process), various programs are used: for example, when modeling the process of primary separation of crude oil, ChemCad was used [
32], and when modeling the process of purifying natural gas from acidic components, the software package Aspen HYSYS was employed [
33]. In [
29] and [
34], the vacuum unit for separating a mixture of amines was simulated using both Aspen HYSYS and Unisim R451. In all cases, high agreement with production data was achieved, which indicates the correctness of the chosen approach. To solve the problem of creating a computational model of the installation under consideration, the Unisim Design R451 software package was chosen.
The model for calculating the vapor-liquid equilibrium, which is determined by the properties of the mixture under study, has a significant effect on the accuracy of modeling. Fuel oil consists of a mixture of hydrocarbons of various compositions (mainly those that boil off ≥360 °C), while the process itself is carried out at a pressure below 90 mm Hg. Therefore, based on the recommendations [
35,
36,
37,
38], the ESSO model [
35] and the Lee–Kesler enthalpy calculation model [
38] were chosen.
The ESSO model uses Maxwell–Bonnell vapor pressure formulas to calculate the phase equilibrium constants for heavy hydrocarbons at pressures below 7 kg/cm
2. The model can be effectively used to calculate vacuum columns [
36].
The system of equations is written as follows:
For all subatmospheric vapor pressures and for all substances having normal boiling points greater than 203.44 °C,
= 1. For substances having normal boiling points less than 200 F,
f = 0. For super atmospheric vapor pressures of substances having normal boiling points between 200 F and 400 F, f is given by:
6.2. Vacuum Column Model
The main problem when setting up the basis of the program was the characterization of the composition of the initial mixture, which is presented in
Table 1. As can be seen from the table, the distillation curve is given up to a temperature of 360 °C, while only 32% of the mixture is distilled off, which is insufficient for correct input and calculation of flow parameters. The missing data can be taken from
Table 2, but a problem arises when recalculating the fraction of distillate for the entire stream of oil. Therefore, the distillation curve was introduced by summarizing the data in
Table 1 and
Table 2 with an adjustment for the fraction of the distillate; the remainder (>515 °C) was taken according to generalizations [
39,
40,
41,
42].
The distillation curve (ASTM D1160) of the initial fuel oil stream is presented in
Table 11 and
Figure 9.
The calculated parameters of the mixture are presented in
Table 12.
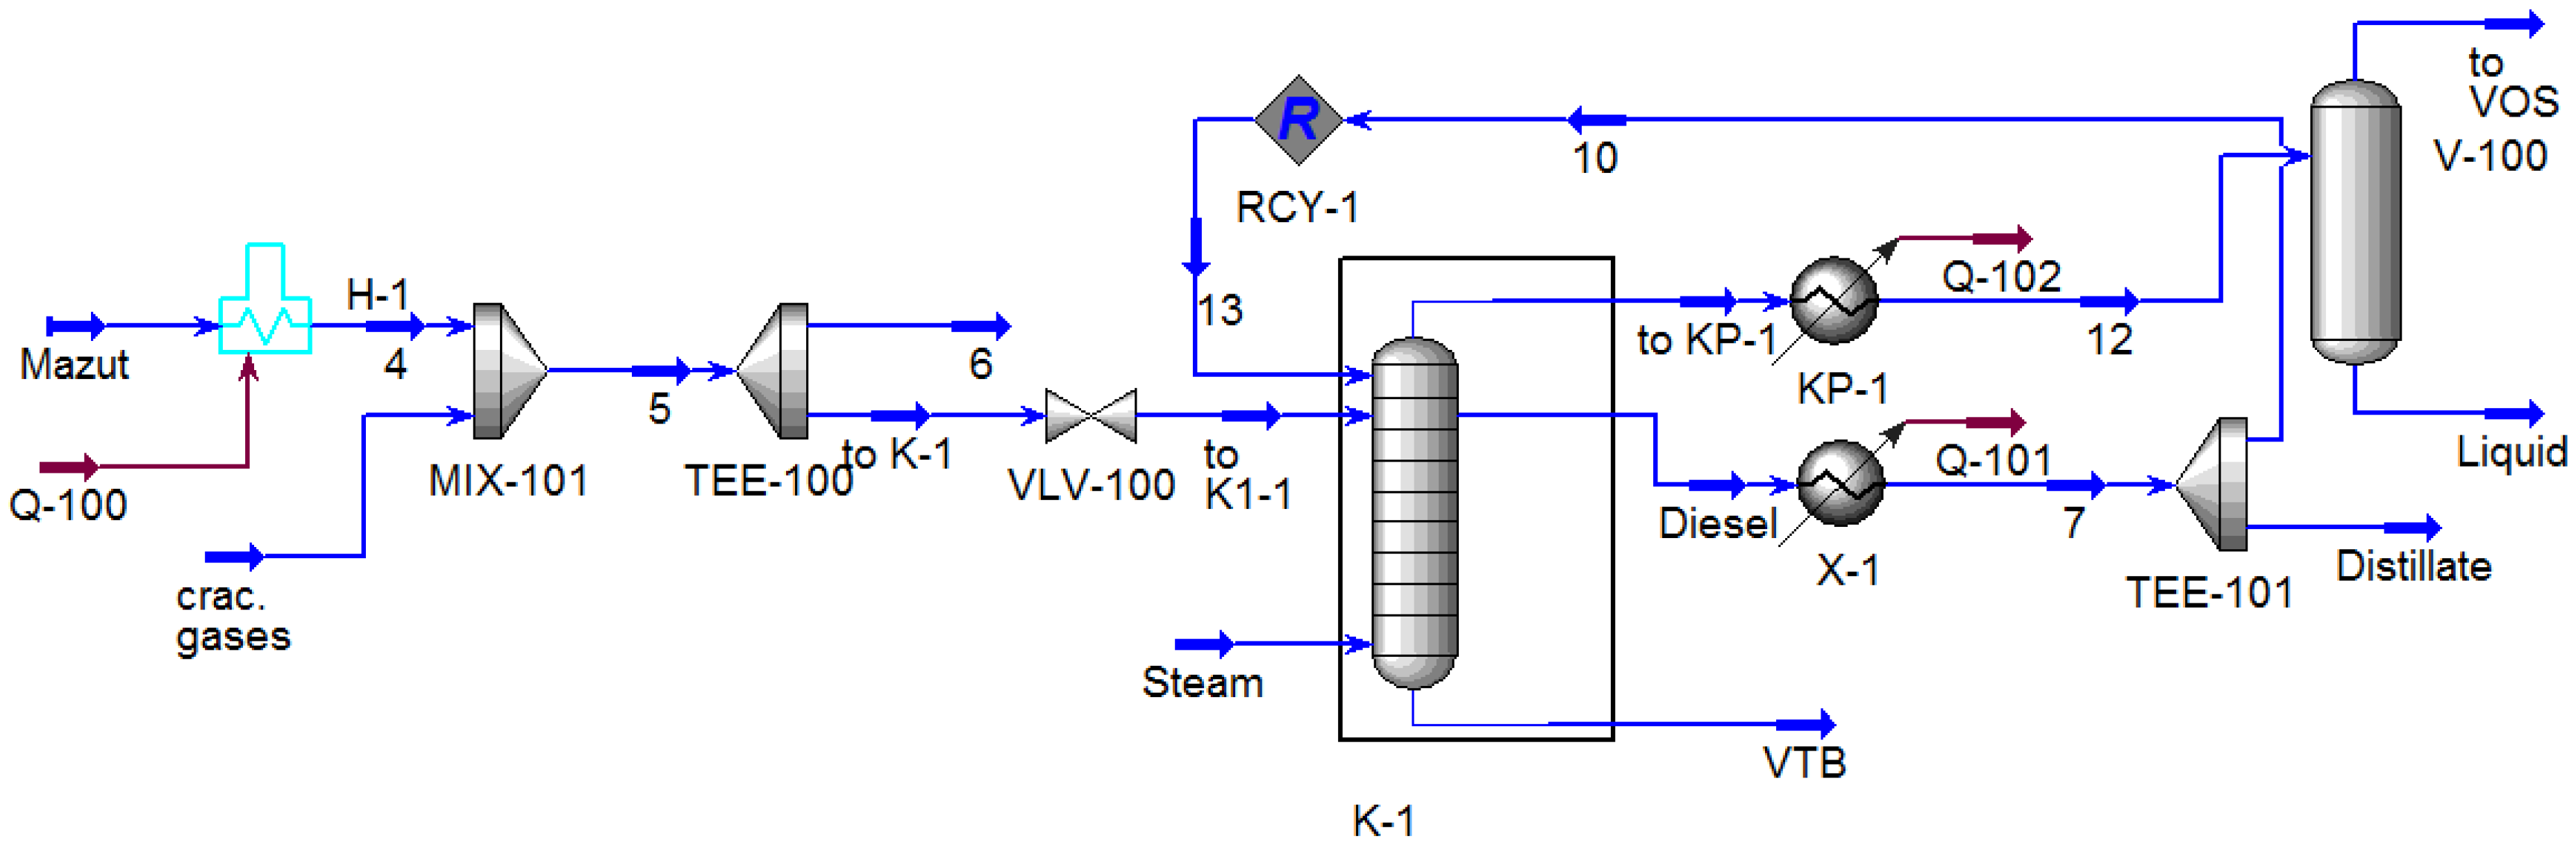
To simulate the process, the following modules were selected from the program database: heater (H-1), mixer (MIX-101), tee (TEE-100, TEE-101), absorber (K-1), recycle (RCY-1), cooler (KP-1, X-1) and separator (V-100). The design diagram of the process, implemented in the Unisim Design R451 program, is shown in
Figure 10.
Based on the description, the fuel oil flow is heated in the H-1 furnace, and due to thermal destruction, a certain number of light hydrocarbons (decomposition gases) are formed [
6,
39,
40,
41,
42]. The composition and yield of decomposition gases depend on both the temperature and the composition of the source oil. The description of the chemistry of the process of thermal destruction of oil residues is a challenging task; therefore, in order to take this phenomenon into account, it was decided that a separate stream should be introduced into the scheme, which would correspond in its properties to the decomposition gases formed in the real process. The effect of heating on the composition of decomposition gases was investigated in [
42,
43], and the gas flow rate was calculated using the empirical equation set forth in [
30].
These formulas were entered into the program using the Spreadsheet module (SPDSHT-1), in which the connection between the user block and the program was configured, while Formulas (1) and (2) were entered into the SPDSHT-1 module; the composition was adopted according to [
42,
43] and was introduced as a separate stream. It should be taken into account that light hydrocarbon gases are formed from fuel oil; therefore, to accurately record the material balance, it is necessary to reduce the initial consumption of fuel oil by the amount of the formed decomposition gases. Hence, in the model (
Figure 10), the process of heating fuel oil in the H-1 furnace was calculated according to the following scheme: the initial mixture was introduced into the H-1 module in which the outlet temperature was set. Then, the heated flow was mixed in the MIX-101 module, and the decomposition gases (cracking gases) were calculated based on the conditions of heating them. The resulting stream from the TEE-100 module was reduced by an amount equal to the decomposition gases’ stream. To enter the pressure drop and determine the fraction of the mixture distilled at the column inlet (which is an important condition for accurate calculation of vacuum columns for fuel oil rectification [
6]), a valve module (VLV-100) was installed at the outlet of the MIX-101, whose pressure was set to equal the pressure in the feed zone.
A feature of the rectification scheme in this process is that the upper reflux stream is formed from the withdrawal of the side product of the K-1 column. Therefore, to calculate the distillation of fuel oil, the Absorber module (K-1) was used, the mass flow rate of the side extraction (diesel stream) set, and this extraction cooled in the cooler module (X-1). In this case, the cooling temperature was set according to the data of the technological survey.
The stream entering the first stage of the column was formed in the TEE-101 module where the irrigation mass flow rate was set (taken according to the technological survey data), and the convergence of the recycle stream was ensured by the recycled RCY-1 module. Water vapor was introduced into the bottom of the column, which was set as a separate stream, and the number of theoretical trays and their efficiency were selected in such a way that the tar composition (VTB stream) corresponded to
Table 2.
The condensation process takes place in the KR-1 condenser, while part of the mixture does not condense under the considered production conditions. Therefore, the cooler (KP-1) and separator (V-100) modules were used to simulate the condensation process. At the same time, the temperature and pressure were set in the KR-1 module (according to the survey data), and the specifications of the V-100 module were accepted by default.
6.3. Vacuum Condenser Model
As mentioned earlier, the vacuum condenser was calculated using two modules, which makes it difficult to use the tools built into Unisim Design R451 [
36] for the verification calculation of heat exchangers. Therefore, according to the literature data [
44], a mathematical model of the condenser was developed, which, through SPDSHT-1, was built into the design model of the block, while all the thermophysical properties of the streams were determined by Unisim Design R451.
A feature of the operating mode of the vacuum condensers is that there are two heat transfer zones in the apparatus:
in the first zone, partial condensation of hydrocarbon vapors occurs in the presence of water vapor;
in the second zone, the condensation of water and hydrocarbon vapors is combined, but not complete (the atmospheric air sucked in barely condenses).
In addition, hydraulic resistances play a significant role in the condensation regime, exerting the greatest influence on the process at the end of the first and at the beginning of the second condensation zones, since, under vacuum, the conditions of condensation in the presence of inert impurities are much worse [
44,
45,
46,
47].
The general expression for the heat load of the first zone of the condenser-cooler is written as follows:
The heat load for the second zone is determined by the Equation (10):
The total thermal load on the condenser is the sum of the thermal loads on the first and second zones.
The heat balance equation for refrigerator-condenser is as follows:
The heat balance of the first zone is as follows:
For the first zone, the heat transfer coefficient from condensing hydrocarbon vapors to the horizontal tube of the apparatus is calculated by formula (13), taking into account the placement of tubes in the bundle [
44].
The heat transfer coefficient
is determined by formula (14).
The heat transfer coefficient in the first zone is as follows:
In the second zone, combined condensation (but incomplete) condensation of hydrocarbon and water vapor occurs (atmospheric air is not sucked in).
The heat transfer and heat transfer coefficients for the second zone are determined by Formulas (14)–(16).
The total heat exchange surface of the apparatus is calculated by formulas (16)–(18):
The hydraulic calculation of the apparatus was carried out according to the following formulas:
Pressure loss during the movement of the coolant in the pipe space, Pa:
Pressure loss during the movement of the coolant in the annular space, Pa:
Pressure loss on local resistances:
The verification calculation of the equipment involves checking the operability of the selected heat exchanger for the given production conditions, while the parameters of the state of the input and flow rates, as well as the temperature of the flows at the outlet, are set. The design of the heat exchanger is known, and, hence, so is the surface area of the heat transfer. In this case, the calculated surface margin is determined by formula (22):
Proceeding from the set problem, as well as the identity of the design model, the temperature at the outlet from the heat exchanger was set; the calculated heat transfer surface and hydraulic resistance were calculated using Formulas (9)–(22), while the temperature was selected so that the margin over the surface was within 0–5%.
7. Checking the Adequacy of the Design Scheme
The adequacy of a mathematical model is understood with respect to its correspondence to a real object, both qualitative (the character of changes in the variables in the model and in the object are the same) and quantitative (experimental data coincides with the calculated data).
The qualitative correspondence of the model to the real object was observed by comparing the change in the calculated values of the parameters during the transition from one mode to another.
The qualitative conformity of the model was considered using the norm for expression (23).
The comparison tables of calculated and experimental data for the two modes of operation of the unit are presented in
Table 15.
The calculated thermal curves for modes 1 and 2 are shown in
Figure 11. An analysis of these curves shows that mode 2 is characterized by the more “harsh” operating conditions of the condenser: both the total heat load on KP-1 and the amount of steam–gas mixture leaving the top of the vacuum column increase.
When switching from mode 1 to mode 2, the temperature of the top of the column increases, as well as the amount of the mixture leaving the condenser KP-1, which is associated with an increase in the intensity of the processes of heat and mass transfer of light components of the mixture in the strengthening section of the column. However, the flow rates of the output streams do not change much; therefore, the formed light components (≤360 °C) condense in KP-1. Since the total number of components condensing in the first zone increases, the heat transfer coefficient for this zone increases, which leads to an increase in the total heat transfer coefficient for the condenser. This circumstance explains the fact that with a decrease in pressure, despite the fact that the heat load increases, the condensation temperature decreases.
During calculation, special attention was paid to identifying the load on the VOS, since according to the results of the survey (
Figure 8 and
Table 10), it can be seen that the VOS is operated with a significant deviation from the design parameters. The design value for VOS at P = 40 mm Hg is G = 100 kg/h dry air. Analyzing the data in
Table 8 and
Table 10, it can be concluded that the mass flow of the mixture not condensed in KR-1 should be in the range of 120–160 kg/h. For mode 1, the calculated value of the flow rate in the VOS is 156 kg/h, and for mode, it is 2–124 kg/h; the indicated values fit into the assumed ranges of the load on the SEP.
Figure 12 and
Table 16 show a comparison of the calculated and experimental composition of the distillation curves (according to ASTM D1160) of tar leaving the bottom of K-1 (the study of the tar composition for mode 2 was not carried out).
As can be seen from
Figure 10 and
Table 8, the calculated data are in good agreement with the experimental values. This indicates that the presented model of the vacuum unit quite accurately describes the behavior of a real technological object.
The calculation results show that, both qualitatively and quantitatively, the design model synthesized in Unisim Design R451 corresponds to a real technological object, which indicates its adequacy.
8. Coupling the Characteristics of the Vacuum Unit and the Vacuum-Generating System
The existing Vacuum Overhead System, based on a steam ejector pump, is characterized by the following disadvantages:
In works [
29,
30,
48,
49,
50,
51], it was shown that for a technological VOS, a liquid-ring vacuum pump is a good alternative for a traditionally used steam jet VOS, reducing both operating costs and environmental load.
In accordance with the calculations carried out for the reconstructed VOS, a two-stage LRVP, SIHI LPH 85,340 is proposed [
51]. The rated capacity of the pump at a pressure of 40 mm Hg is 1950 m
3/h. However, for the correct choice of VOS, it is necessary not only to determine the characteristics for the design operating mode of the unit, but also to calculate how it will change under different operating conditions of the installation [
29]. Therefore, the problem arises of recalculating the passport characteristics of the pump for real production conditions, taking into account the peculiarities of the functioning of a particular technological object operating under vacuum.
One characteristic of the liquid ring vacuum pump is the dependence of the capacity on the suction pressure given for the “water–air” system (the pumped mixture is dry air with t = 20 °C, and the temperature of the service liquid supplied to the LRVP is 15 °C). Obviously, it will not be possible to create such conditions on the investigated installation; moreover, the temperature and amount of the mixture entering the suction in the VOS will be determined by the characteristics of the K-1 column and the condenser KR-1. Therefore, it is necessary to bring the characteristics of both the technological object and the WSS to a single form in order to search for the conditions in which they coincide. With regard to the task at hand, it is convenient to represent them in the form of dependences of the amount of non-condensed mixture from the capacitor (characteristic KP-1) and the characteristics of LRVP LPH 85,340 recalculated according to the model described in [
52]. The inlet flow entering the annular space of KP-1 is formed in the K-1. The points characterizing the capacitor and the LRVP are “coupling points” [
29], and it is these points that correspond to the operating parameters of the unit.
Analysis of the data in
Table 1,
Table 2 and
Table 3 shows that the bitumen release mode is more “stringent”; therefore, it was this mode that was taken as the basic one, in which the search for points of conjugation of the characteristics of the rectification column and VOS was carried out.
The conjugation of the characteristics of LRVP and a vacuum capacitor is shown in
Figure 13.
Curves 1–4 were obtained from the results of processing a numerical experiment carried out on a computational model (
Figure 8). The condensation temperature was fixed in the condenser, and the column and condenser were calculated at several pressures at which the output of non-condensed gases was recorded. Then, the next temperature was taken, and the calculation was repeated again. Thus, curves 1–4 were obtained, which represent the characteristics of the capacitor K-1. According to the calculation model of LRVP set out in [
52], curves 1’–4’ were obtained, which correspond to the recalculated characteristics of LRVP at different temperatures of the pumped-out mixture and service liquid.
The points of intersection of the condenser isotherm curve and the corresponding liquid ring vacuum pump (LRVP) performance curve characterize the interface points of the Rectification Column and LRVP: that is, they form the integrative characteristic of the system, which passes through points 1”–4”. The integral characteristic determines the dependence of the pressure in the column on the parameters of the technological mode of operation of the condenser and LRVP. For example, if the temperature of 28 °C is maintained in the condenser, and service liquid with a temperature of 15 °C is supplied to the LRVP, then the characteristics of the condenser and the LRVP will “match” at point 1, which will correspond to the pressure of the top of the column equal to p1.
According to this principle, the conjugate characteristics of the rectification column and VOS were compiled at various fractions of fuel oil distillation in the coils of the H-1 furnace (
Figure 12). As mentioned above, the geometry of the condenser was introduced into the design model of the unit shown in
Figure 10; therefore, at each point of the capacitor characteristic, the hydraulic resistance of this apparatus was calculated, and the correspondence of the capacitor characteristics to the operating mode was determined by selecting such a condensation isotherm at which the margin for the calculated heat transfer surface approached zero. The results of the computational study are shown in
Figure 14.
Analysis of these data shows that the pressure at the inlet to the VOS generally corresponded to the required values (40–50 mm Hg). However, the pressure of the top of the vacuum column (target parameter) exceeded this range throughout the study range. This effect can be explained by the fact that the existing condenser “locks” the system, which occurs because the cross-sectional area of the annular space of this condenser was not sufficient for the passage of the non-condensed steam–gas mixture. This circumstance is associated with the unsuccessful design of the heat exchanger itself, since transverse baffles with a small free cross-section are installed in the annular space. A small free area in the cutout of the baffles leads to an increased flow resistance and an increase in pressure at the top of the column.
Replacing the existing steam ejector pump with LRVP when using the existing cooling unit will not significantly reduce the pressure at the top of the rectification column, which is controlled by the hydraulic resistance of the condenser. For the studied installation, the use of a normalized condenser according to TU 3612-024-00220302-02 will not allow for any drastic reduction in its hydraulic resistance; therefore, the use of a special vacuum condenser 600 KVKG-1-M1/25G-4-2-U-I according to TU 3612-007-00220302-99 was proposed.
A sketch of a condenser and a general view of the proposed LRVP are shown in
Figure 15. The main difference of the proposed condenser is that the condensed mixture is introduced into the condenser through nozzle C, and the non-condensed part is discharged through two nozzles, D, located in the lower part. The formed condensate is discharged through connection E, and connections A and B are intended for the inlet and outlet of cooling water.
Due to this design, the flow area of the condenser increases; however, the heat transfer coefficient decreases. Therefore, the proposed condenser has a lengthy heat exchange tubes.
The use of this condenser will fundamentally reduce the hydraulic resistance between the top of the K-1 and the VOS; therefore, it becomes possible to improve the quality of the products. However, the rectification column itself is also characterized by a sufficiently large hydraulic resistance, which indicates the feasibility of replacing the column contact devices, for example, with modern packing devices. This will reduce the pressure drop across the column, deepen the fraction of fuel oil distillation in the furnace and significantly improve the technical and economic performance of the unit.
9. Comparison of the Effectiveness of Different Types of Vacuum Overhead Systems
A comparison of the effectiveness of various types of vacuum overhead systems (VOS) was carried out according to the methodology described in [
29]; it compared the existing VOS to the proposed LRVP, and to the VOS based on LJVP, it being of the most common options for installations of this kind.
Table 17 shows a comparison of the effectiveness of using different types of VOS in relation to this task.
Thus, the use of LRVP will reduce the cost of operating the system by 78%. In addition, in this case, with the correct selection of the service fluid, the formation of chemically contaminated water drains can be completely excluded.
Matching the characteristics of the rectification column and LRVP allows one not only to clarify the size of the selected pump, but also to identify the “bottlenecks” of the existing scheme and improve the design quality of industrial technological facilities operating under vacuum.
10. Conclusions
The functioning of the vacuum column of a mini-refinery depends significantly on the operation of the pre-condenser, in which the load on the Vacuum overhead system is formed. In addition, the installation can be operated in two modes, which differ in different technological modes and requirements for the final products.
The key difference between the vacuum units of mini-refineries in Russia from large-scale production is that the main product obtained is road bitumen and tar, and not vacuum distillates. At the same time, the vacuum gas oil produced at the plant is close in its properties to vacuum distillate, and in some enterprises, it may even be a substandard product. Considering that road works in countries with a cold climate differ seasonally, the demand for bitumen production decreases during the winter period. Therefore, the vacuum units of the mini-refinery operate in two modes: the production of tar and bitumen. The transition from one mode to another is carried out by changing the residual pressure of the vacuum column.
When designing a vacuum overhead system for a mini-refinery vacuum unit, it is necessary to take into account these features and calculate the vacuum overhead system layout for all operating modes while choosing the most “rigid” mode as the basis for the design. On the block under study, such a mode is the production of bitumen.
The existing VOS consumes a significant amount of energy resources, so replacing the VOS with an eco-friendly vacuum system is an urgent task. In this article, the replacement of the existing steam ejector pump with a liquid ring vacuum pump is proposed; this will facilitate a reduction in the operating costs of the process by 78% while eliminating the formation of chemically contaminated effluents.
For a comprehensive study of such installations, it is most advisable to use specialized software, for example, Unisim Design R451, in which the design scheme of the vacuum unit in question was built. At the same time, the design scheme was supplemented with a vacuum condenser model. By comparing the calculation data with industrial research data, it was shown that, in key parameters, the model both qualitatively and quantitatively coincides with the real object, which indicates the adequacy of the model.
This technique allowed the calculation to be carried out in such a way that the condensation temperature in the condenser became dependent on the performance of the vacuum overhead system. This made it possible to calculate the vacuum overhead system in different operating modes, and the results showed that an acceptable residual pressure in the column is achievable with a fuel oil distillation fraction of 0.4, which does not quite meet the requirements of the technological regime. This is due to the design features of the vacuum condenser (horizontal cutout of the transverse partition), and so it was decided that it should be replaced with a special heat exchanger designed for condensation of the streams under vacuum.
The results obtained generally coincide with the results in the works [
6,
7,
8,
10,
24]. However, in these works, vacuum blocks of large refineries were studied; conversely, a specific example of a vacuum block at a mini-refinery was considered in the article, and a technical and economic comparison of various types of vacuum overhead systems was carried out.
The results presented in the article on the implementation of the task of improving the existing vacuum overhead system can be used when carrying out work on the reconstruction of the vacuum overhead systems at installations of this kind.


