Article

Surface Roughness Prediction and Optimization in the Orthogonal Cutting of Graphite/Polymer Composites Based on Artificial Neural Network

1
School of Mechanical and Automotive Engineering, Guangxi University of Science and Technology, Liuzhou 545006, China
2
School of Electronic and Information Engineering, South China University of Technology, Guangzhou 510640, China
3
School of Mechanical and Automotive Engineering, South China University of Technology, Guangzhou 510640, China
*
Author to whom correspondence should be addressed.
Processes 2021, 9(10), 1858; https://doi.org/10.3390/pr9101858
Submission received: 23 September 2021 / Revised: 12 October 2021 / Accepted: 18 October 2021 / Published: 19 October 2021
(This article belongs to the Section Materials Processes)

Abstract

:
Graphite/polymer composites are brittle materials that are prone to producing cracks and concavities on machined surfaces, and their surface quality shows greater randomness. This work aims to overcome the large fluctuations in the machined surface quality of graphite/polymer composites, realize the prediction of machined surface roughness under different machining conditions and optimize the process parameters. A graphite/polymer composite material was cut orthogonally using different machining parameters, and the machined surface roughness of the cut samples was measured by a noncontact surface profiler to obtain training samples for Artificial Neural Network (ANN). In this study, a trained radial basis function neural network was used to predict the machined surface roughness, and the prediction accuracy was more than 93%. A Genetic Algorithm (GA) was used to optimize the established ANN, and then grey relational analysis was used to compare the accuracy of the GA optimization results. The ANN prediction after GA optimization showed that the lowest machined surface roughness of the graphite/polymer composites was 1.81 μm, and the corresponding optimal cutting speed, cutting depth, tool rake angle, and rounded edge radius were 11.2 m/min, 0.1 mm, 6.85°, and 11.16 μm, respectively. A verification experiment showed that the lowest machined surface roughness was obtained when the above process parameters were selected, which was only 1.95 μm, and the prediction error of the ANN was approximately 7%. The combination of a GA and an ANN can accurately predict the surface roughness of graphite/polymer composite materials and optimize the process parameters.

1. Introduction

Graphite and its composite materials have been widely used in industrial applications such as biomedical implants [1], fuel cell bipolar plates [2], EDM electrodes [3], semiconductor fixtures, diesel engine [4,5,6], and mechanical seals [7]. In most cases, graphite and its composite materials must be mechanically processed to meet actual application requirements. However, because graphite and its composite materials are brittle materials, the machined surface often exhibits many concavities and cracks, and it is difficult to obtain a good machined surface quality [8]. Therefore, research on the machined surface quality of graphite and its composite materials has attracted widespread attention in academic and engineering fields.
Wang et al. [9] conducted orthogonal cutting experiments on high-purity graphite. They found that obvious cracks occurred during the cutting process, and the surface material was removed in large pieces, thereby forming obvious concavities on the machined surface. Zhou et al. [10] found that the size of that concavity decreases with decreasing cutting depth. When Huo et al. [11] micro-milled fine-grained graphite, they found that the machined surface also exhibited a large number of concavities, and the surface roughness fluctuated greatly, exceeding 20%. Yang et al. [12] studied the machinability of graphite/polymer composites by orthogonal cutting, and their experimental results showed that the surface roughness of the machined surface also fluctuated greatly, with a fluctuation range of 25%. Obviously, such a large fluctuation range of roughness is highly unsuitable for the selection of process parameters during an actual machining process. Therefore, it is particularly important to achieve an accurate prediction of the machined surface roughness before machining. Thus, to accurately predict the machined surface roughness of high-purity graphite and obtain a better machined surface quality, Yang et al. [13] obtained the milling parameters that minimized the machined surface roughness when a Grey Relational Analysis (GRA) was used to optimize the milling process parameters, and then a prediction model for the machined surface roughness of high-purity graphite was established by a regression analysis method based on the experimental data [14]. Shie et al. [15] established an ANN prediction model for the machined surface roughness of high-purity graphite during the milling process. Compared with the traditional Taguchi method and experimental design method, the prediction results were much more accurate because of the superior robustness to noise.
To date, although there has been extensive research on the machined surfaces of graphite and its composite materials, there remains a lack of research on the prediction of machined surface roughness at specified process parameters. Graphite/polymer composites exhibit a unique low crack growth during the machining process [8], and the machined surface roughness can fluctuate greatly. It is necessary to establish a more accurate prediction model and obtain process parameters that minimize the machined surface roughness. In this study, an ANN prediction model for the machined surface roughness of graphite/polymer composites was established based on the results of orthogonal cutting experiments. Then, with the goal of minimizing the surface roughness of the machined surface, a Genetic Algorithm (GA) was used to optimize the established ANN model, and finally, a comparative analysis and experimental verification for optimal process parameters were conducted.

2. Experimental Methodologies

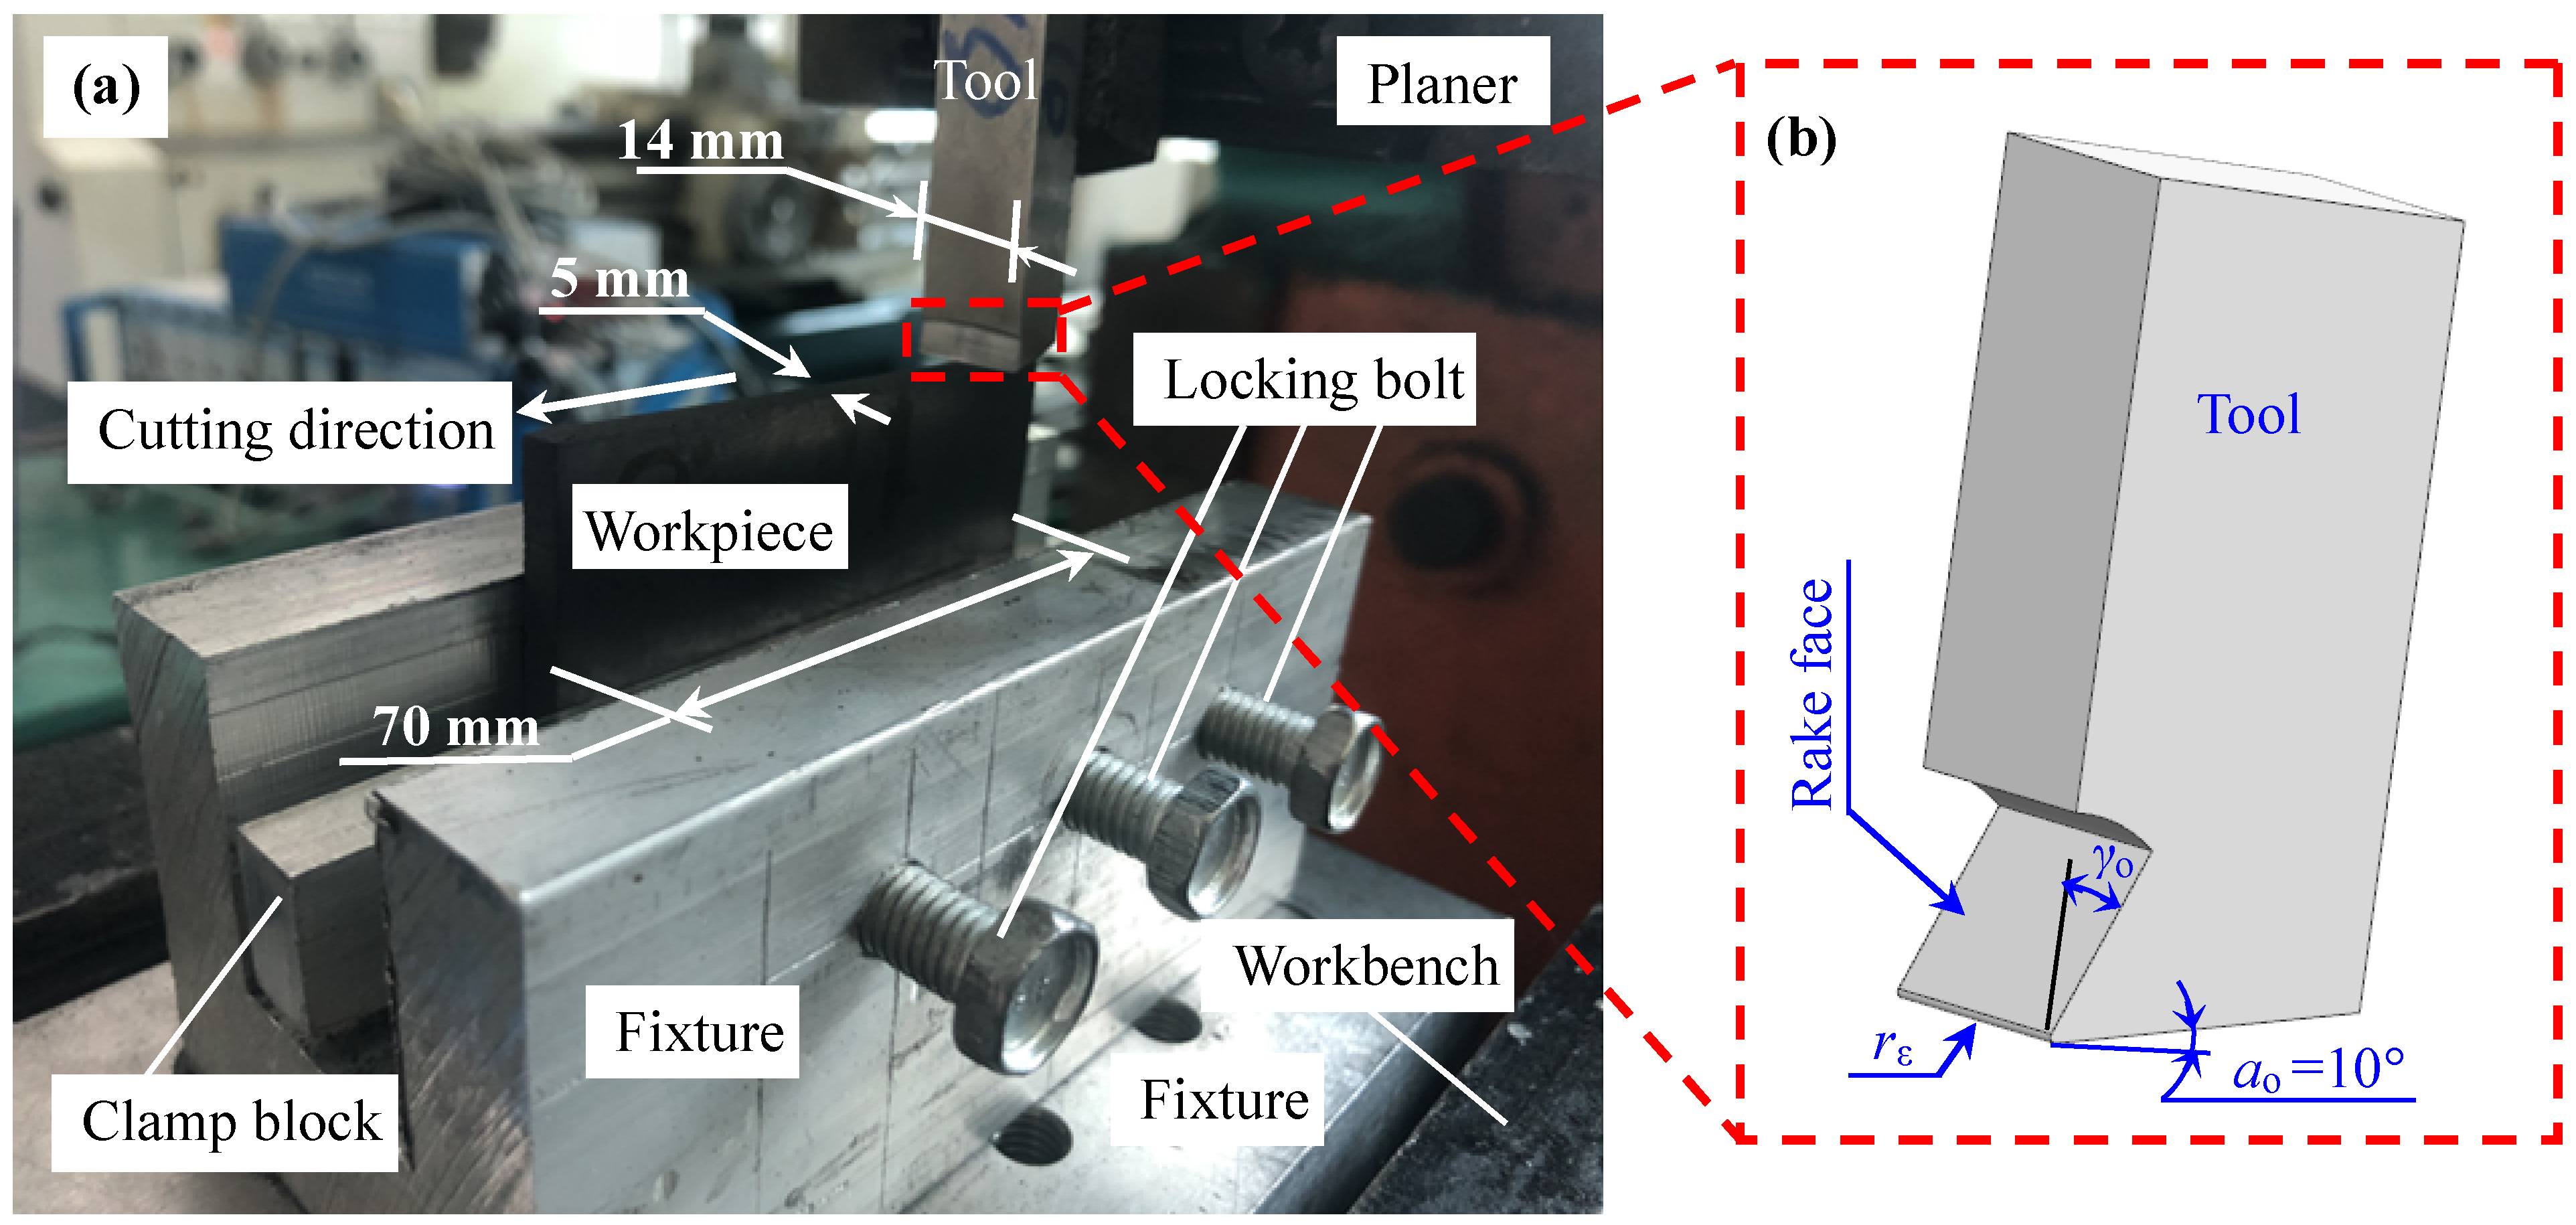
2.1. Experimental Method

The dry orthogonal cutting experiment was carried out on a BC6063B planer. During the cutting process, the machining parameters that affect the surface roughness of the machined mainly include cutting speed (vc), cutting depth (ac), tool rake angle (γo), and rounded edge radius (rε). To reduce the number of experiments while ensuring sufficient training samples for the ANN, the above four process parameters were first arranged in orthogonal experiments according to four factors and three levels during the cutting process, for a total of 9 groups, as shown in Table 1. In addition, 8 groups of experiments with other different cutting parameters were added, and the machined surface roughness obtained by the orthogonal experiment was used as the training sample for the ANN. The prediction samples for the ANN were set to 5 groups, so there were 22 groups of experiments.
The experimental setup is shown in Figure 1, and the dimensions of the workpiece are 70 × 45 × 5 mm. The experimental materials were purchased from the market, and the main mechanical properties are shown in Table 2. The tool material was high-speed steel, and the tool clearance angle ao was 10°, as shown in Figure 1b. The tool rake angle and clearance angle were obtained by grinding with an MQ6025A universal tool grinder, which can reduce the error of the tool angle within 1°.
A noncontact BMT Expert 3D surface profiler was used to measure the surface roughness of the workpieces. To ensure the accuracy of the measurement results, 5 workpieces were machined for each group, and each workpiece was randomly measured 15 times. Therefore, 75 roughness data points were measured for each group, and then the average of all measurement data was taken as the machined surface roughness for each group.

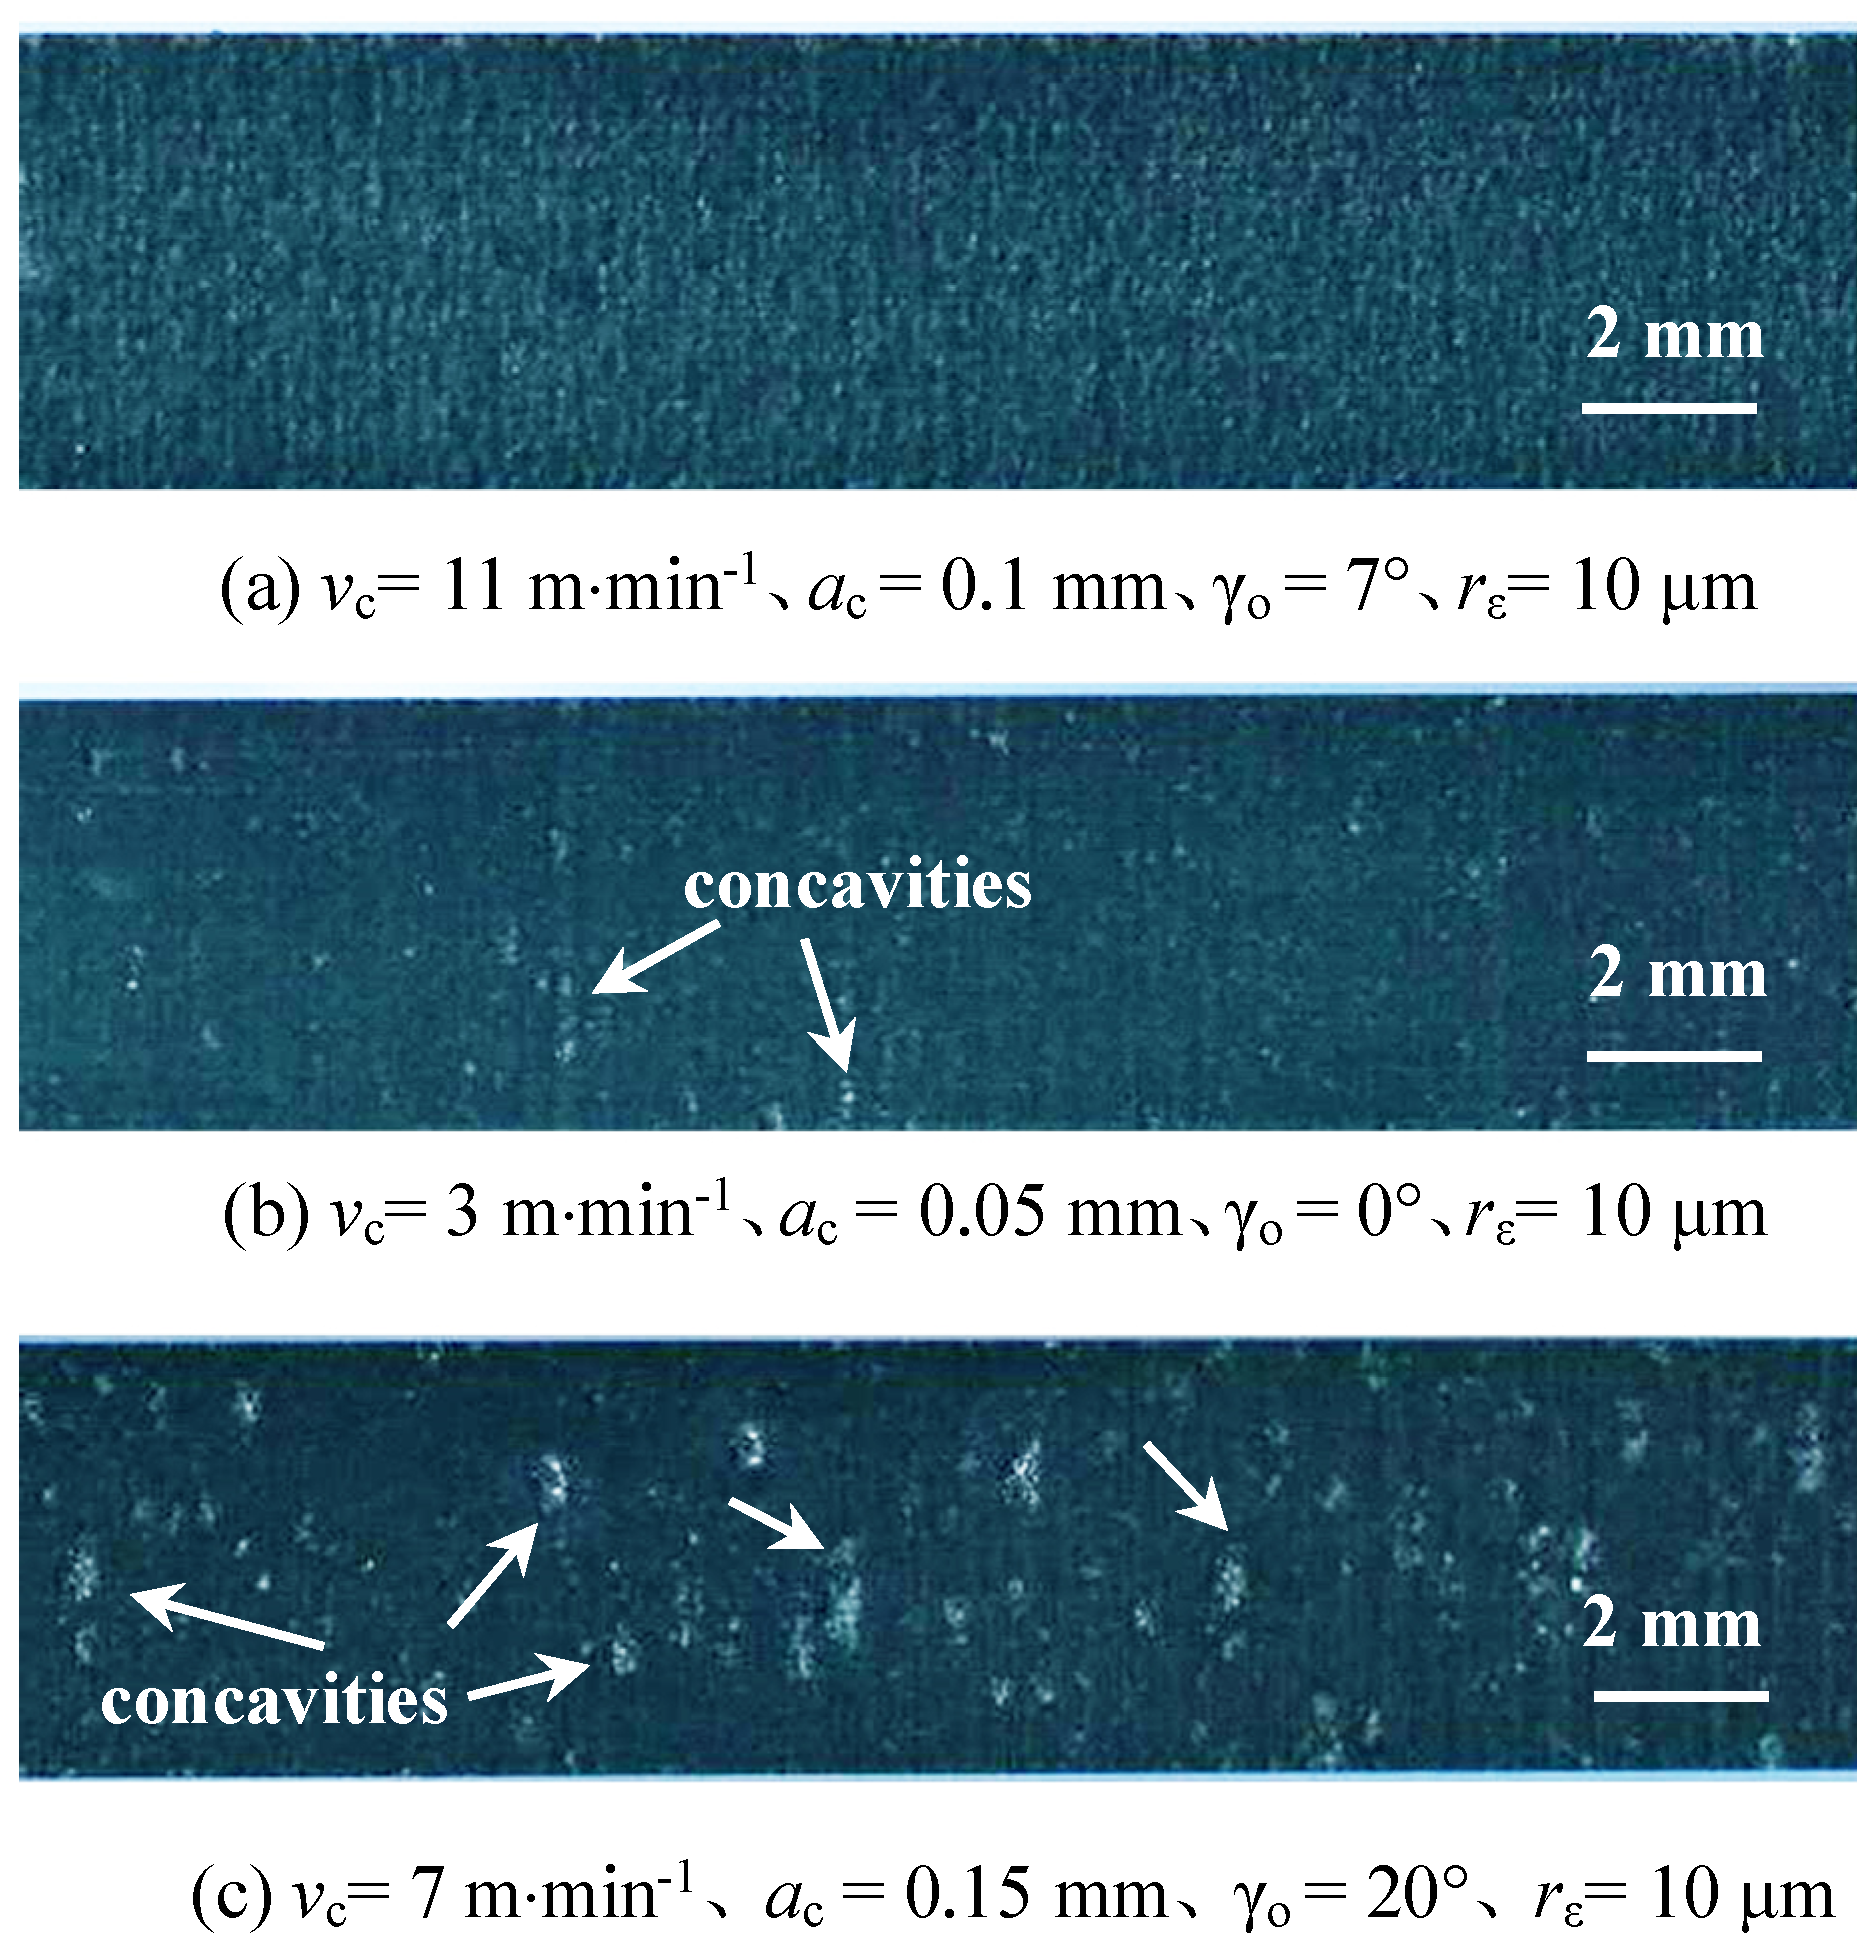
2.2. Machined Surface Roughness at Different Cutting Parameters

The machined surface roughness of graphite/polymer composites at different process parameters is shown in Table 3. The first 9 groups are the part of ANN training samples obtained by an orthogonal experiment design with 4 factors and 3 levels, the 10th to 17th groups are the added ANN training samples, and the 18th to 22nd groups are the ANN prediction samples.

3. Establishment of the Roughness Prediction Model

3.1. The Selection of the ANN

A Radial Basis Function (RBF) neural network often uses a Gaussian function as the excitation function. It is a three-layer static feedforward ANN that is characterized by simple structure and efficient learning and training and can approximate arbitrary nonlinear functions with arbitrary accuracy [16]. Therefore, an RBF neural network was used as the ANN in this study.

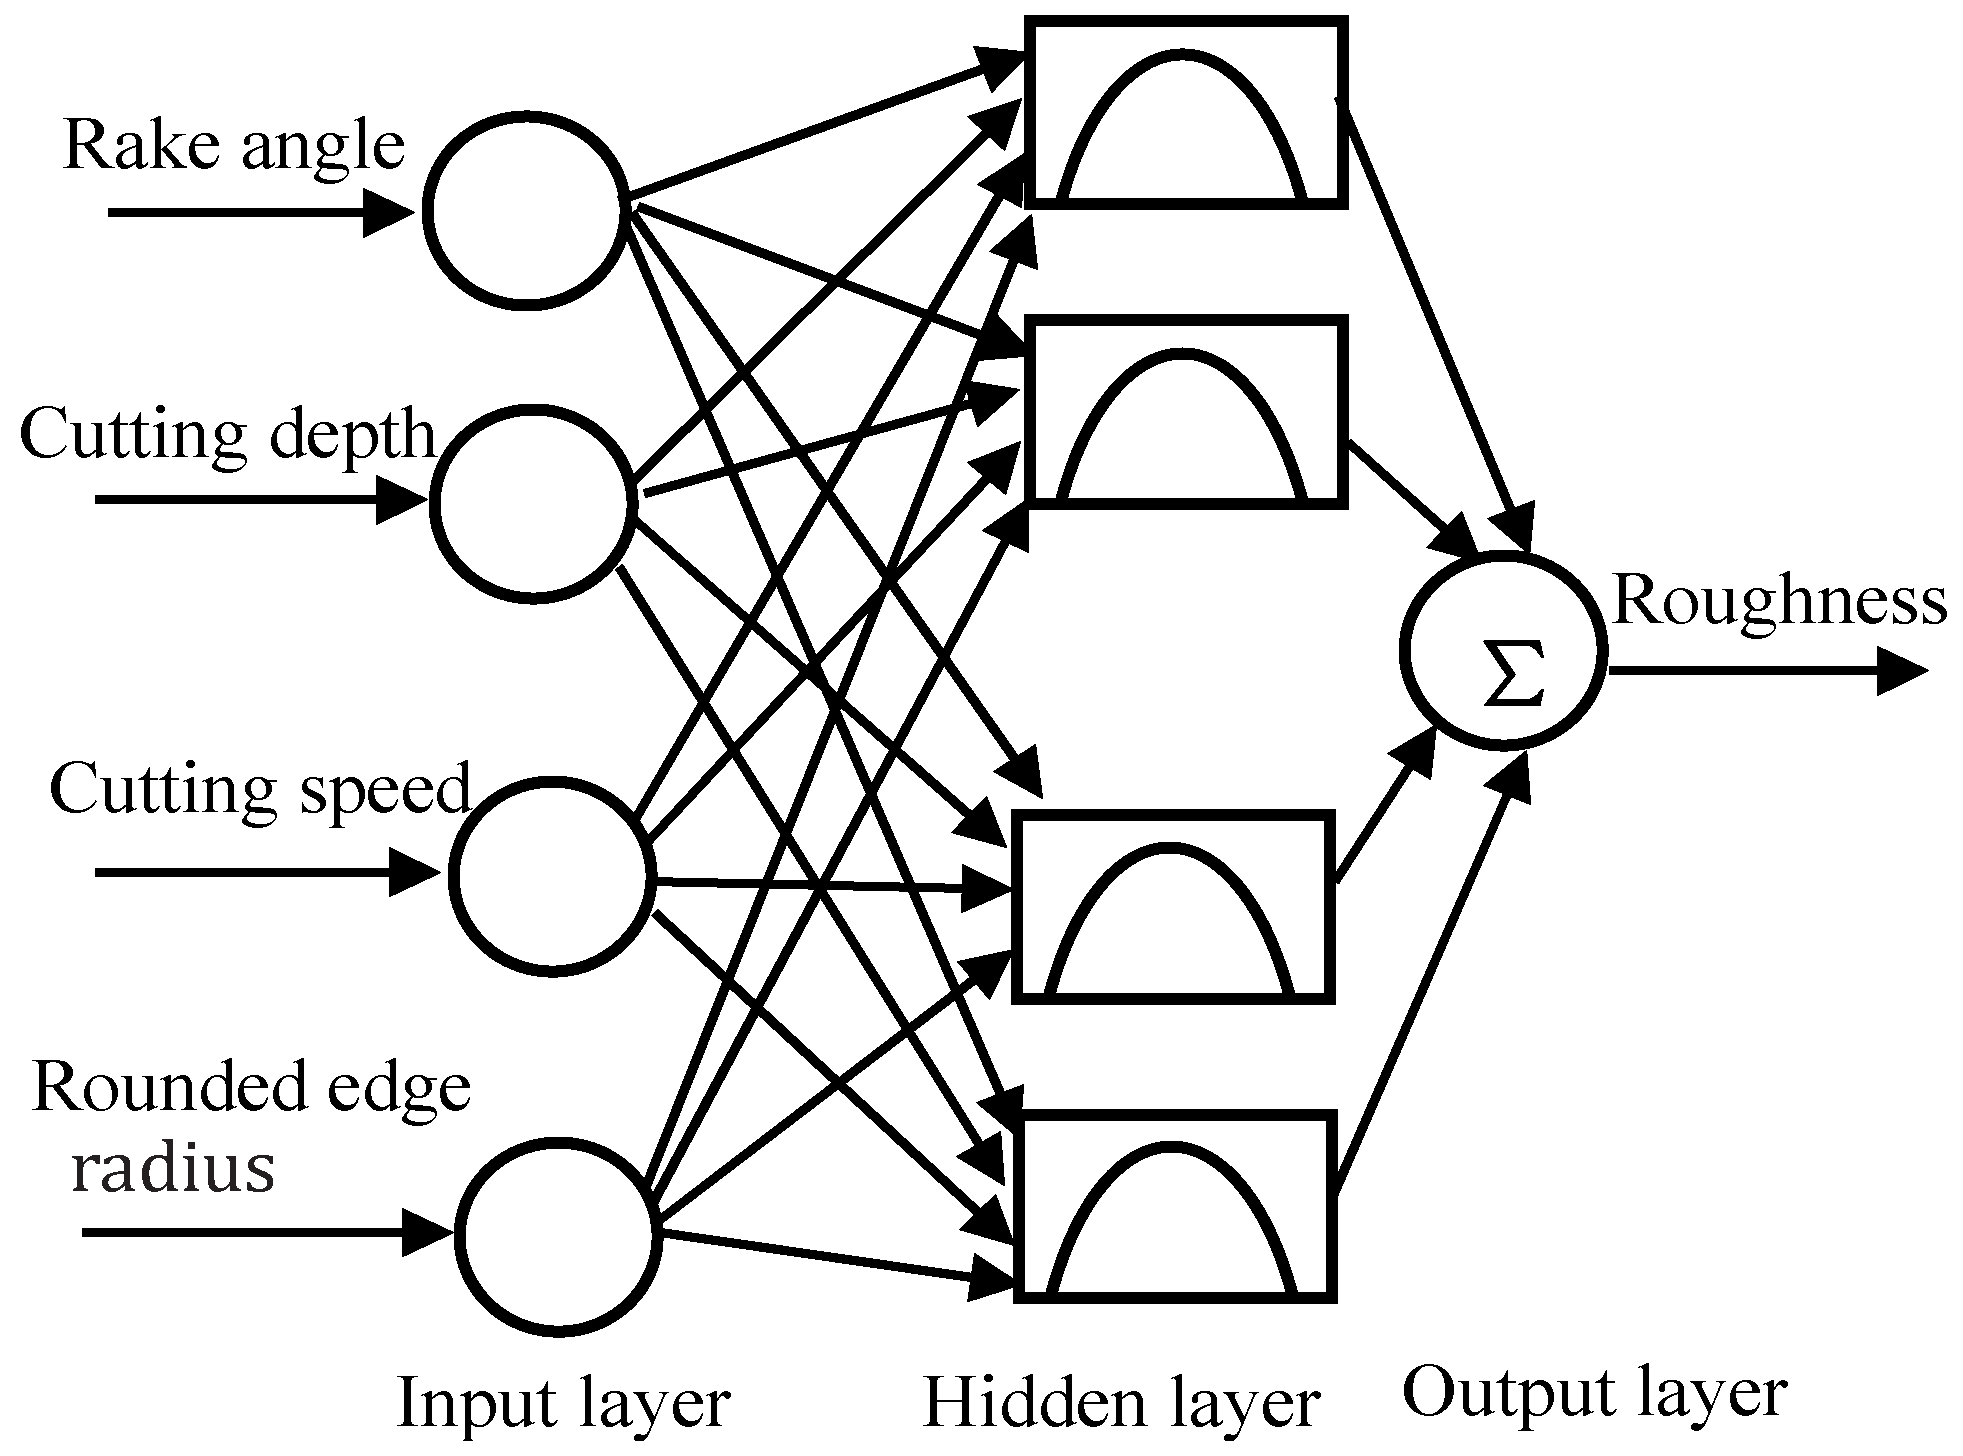
3.2. The Structure of the ANN
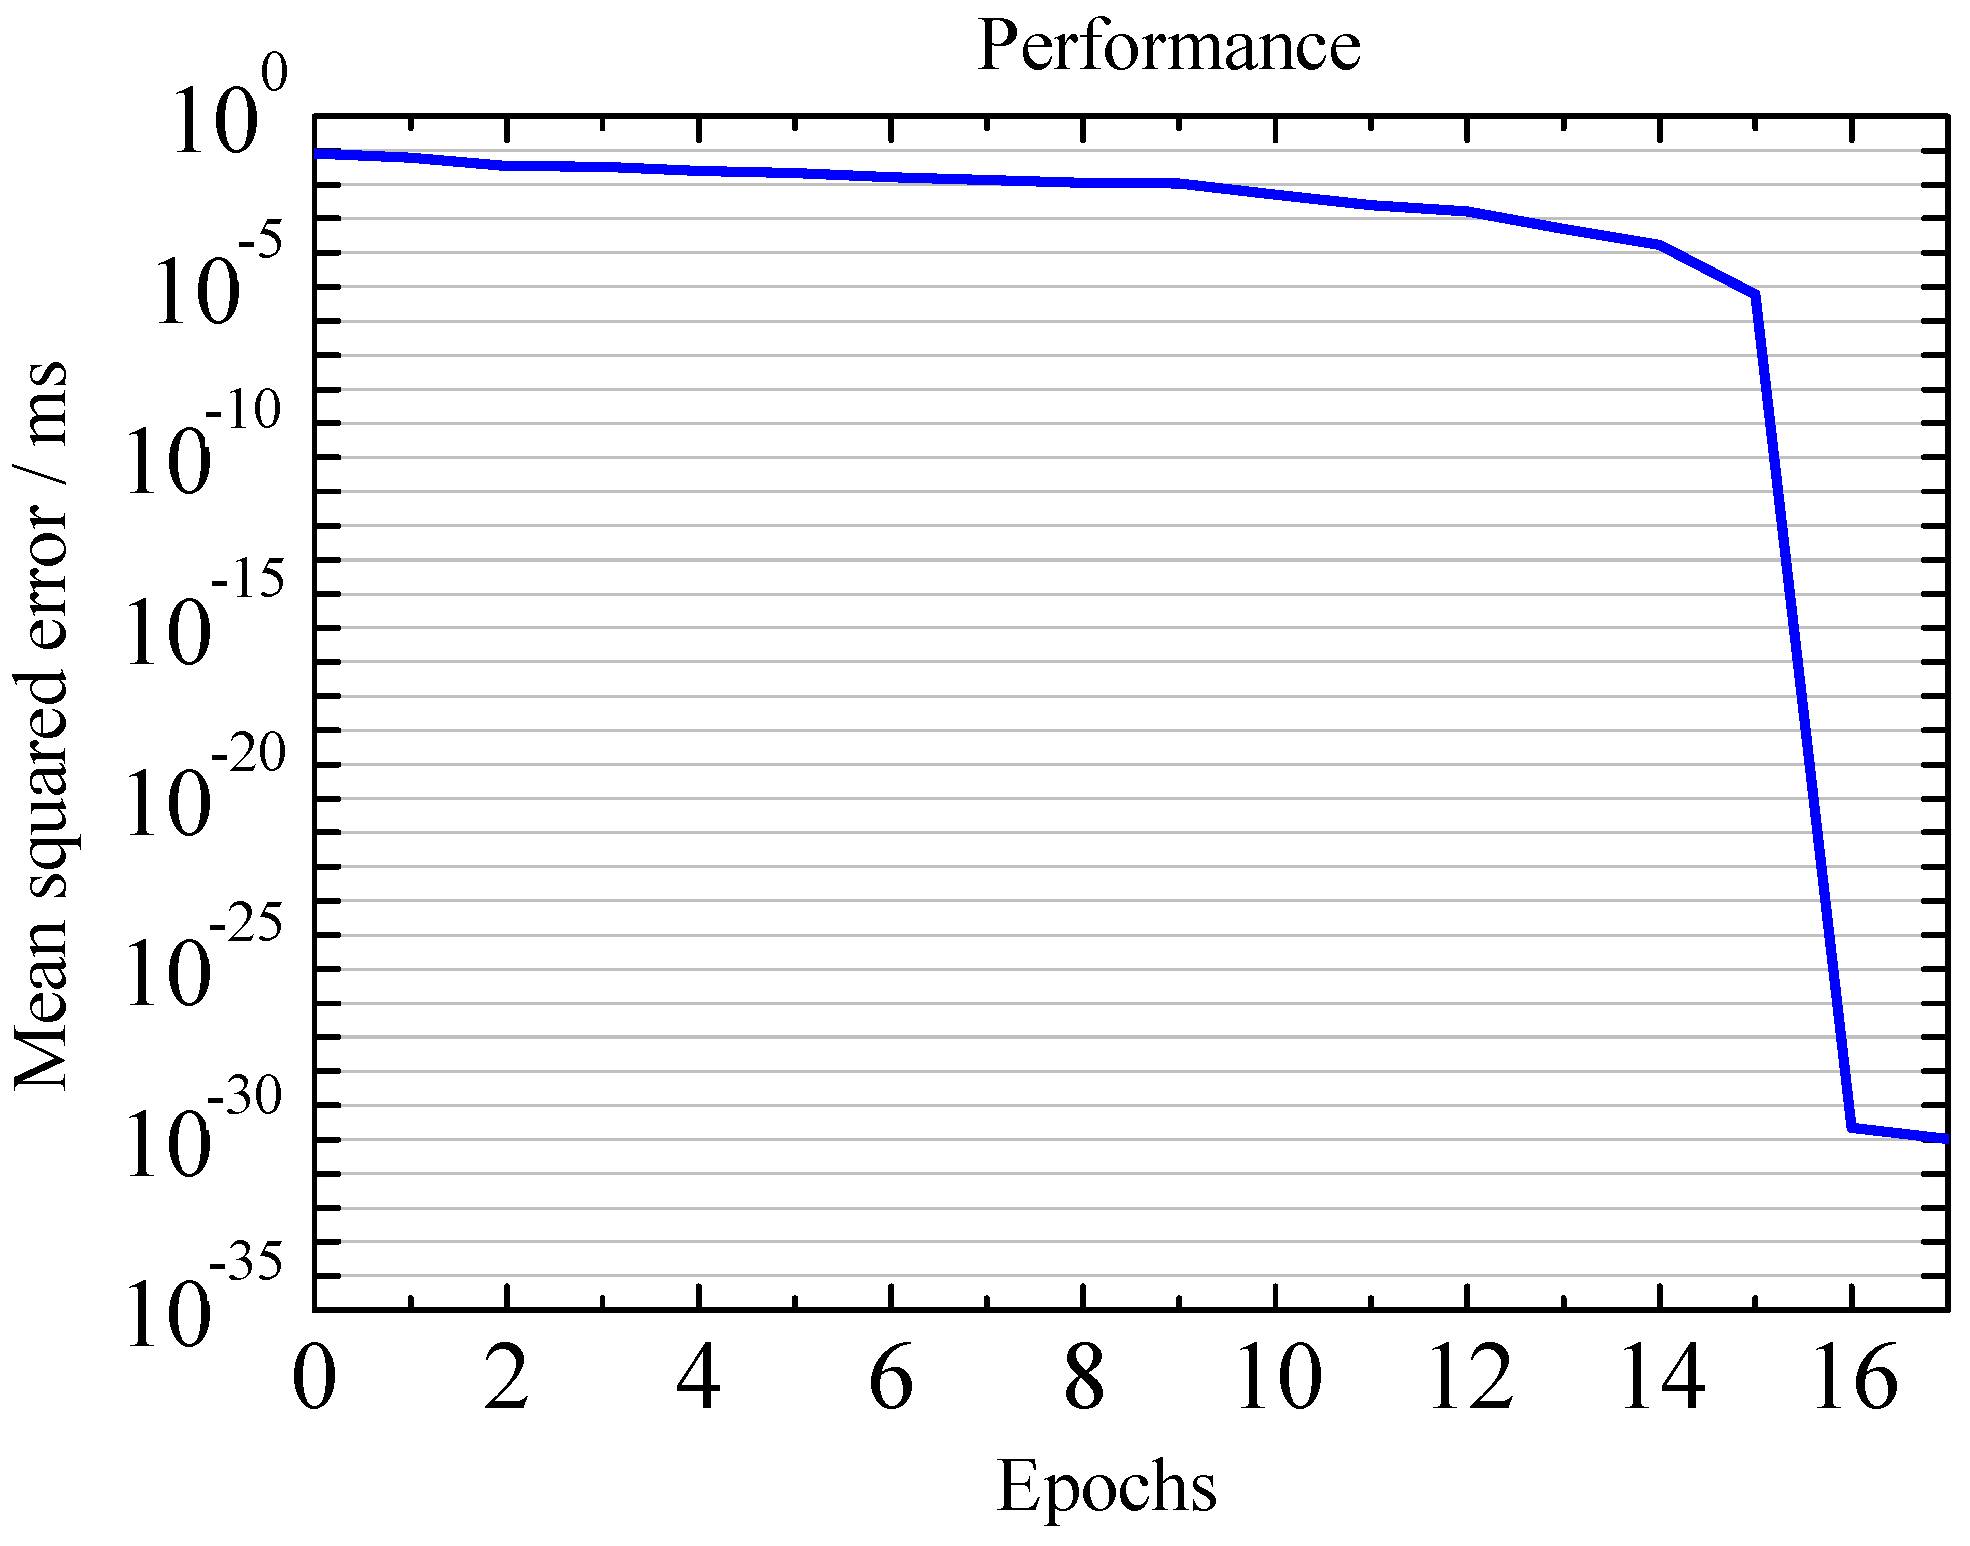
In this study, there were four main factors that affect the machined surface roughness of graphite/polymer composites, including cutting speed, tool rake angle, cutting depth, and rounded edge radius. The above four factors were used as independent variables, so there were 4 neurons in the input layer of the artificial nerve network. Since the dependent variable in this study was only roughness, there was only 1 neuron in the output layer. The number of neurons in the hidden layer was automatically determined by the RBF neural network during the training process. The topological structure of the ANN is shown in Figure 2.

3.3. ANN Training

Table 3 shows that the data between the input and output exhibit a large distribution range. To avoid output distortion and network paralysis due to the inhomogeneity of input parameters and to reduce the training time of the ANN, the sample data were normalized. The mapminmax function in MATLAB software was used to normalize the sample data. The normalization formula is as follows:
y   =   ( y m a x     y m i n ) ( x     x m i n ) x m a x     x m i n   +   y m i n
where y m i n and y m a x are the minimum and maximum values of the output, respectively, and x m i n and x m a x are the minimum and maximum values of the input, respectively.
The ANN toolbox in MATLAB software was used to simulate and train the ANN. The experimental data from the 1st to 17th groups in Table 3 were selected as the training samples for the ANN, and the experimental data from the 18th to 22nd groups were used as the prediction samples for the ANN. The ANN control error was set as 10−5, and the expansion speed of the RBF was set as 1. The training result of the ANN is shown in Figure 3. The model error after training reaches 10−30, and the training result fully meets the expected requirements.
The trained ANN was used to predict the machined surface roughness at the machining parameters according to the 18th to 22nd groups in Table 3. The differences between the predicted results and the experimental results are shown in Figure 4. It can be seen in the figure that the prediction accuracy of the ANN for the machined surface roughness exceeded 93%.
It should be noted that although the prediction error of No. 20 sample is the largest, which is 6.98%, and the prediction error of sample No. 22 is the smallest, which is 1.40%, it cannot be considered that the ANN has a certain law for the prediction of the machined surface roughness of samples with different groups. In fact, the predicted values of the five groups of samples in Figure 4 all use the same ANN model. Theoretically, the prediction errors of each group should be very close, and the predicted values should also be greater or less than the actual values. However, the prediction error range in this article is from 1.40% to 6.98%, and some predicted values are greater than the actual values, while others are less than the actual values. This is mainly caused by the significant fluctuation of the machined surface quality caused by the brittleness of the graphite/polymer composites. This is also the main reason why it is difficult to obtain a good surface quality during the machining of graphite/polymer composites.

4. Optimization of the ANN Prediction Model

Although the machined surface roughness of the workpiece can be controlled by optimizing the process parameters during the actual cutting process, the machined surface roughness and the cutting parameters are nonlinear, and it is difficult to establish a specific functional relationship between these features. A GA is a computational model that simulates biological evolution; it does not require a specific functional relationship between design variables and objective functions. A GA was used to optimize the ANN model in this section and then obtain the cutting parameters that minimize the machined surface roughness of the graphite/polymer composite material.

4.1. Optimization Model

The machined surface roughness y can be calculated for different cutting parameters x according to Formula (2) and the parameters x are subject to (s.t.) numerical range. Therefore, combined with the cutting parameters of the experiments in Table 1, the optimization model for the machined surface roughness of graphite/polymer composites during orthogonal cutting process can be defined as:
min y
s. t.
3 ≤ x1 ≤ 12
0.05 ≤ x2 ≤ 0.3
0° ≤ x3 ≤ 20°
10 ≤ x4 ≤ 90
where x1/m·min−1 is the cutting speed, x2/mm is the cutting depth, x3/° is the tool rake angle, and x4/μm is the rounded edge radius.

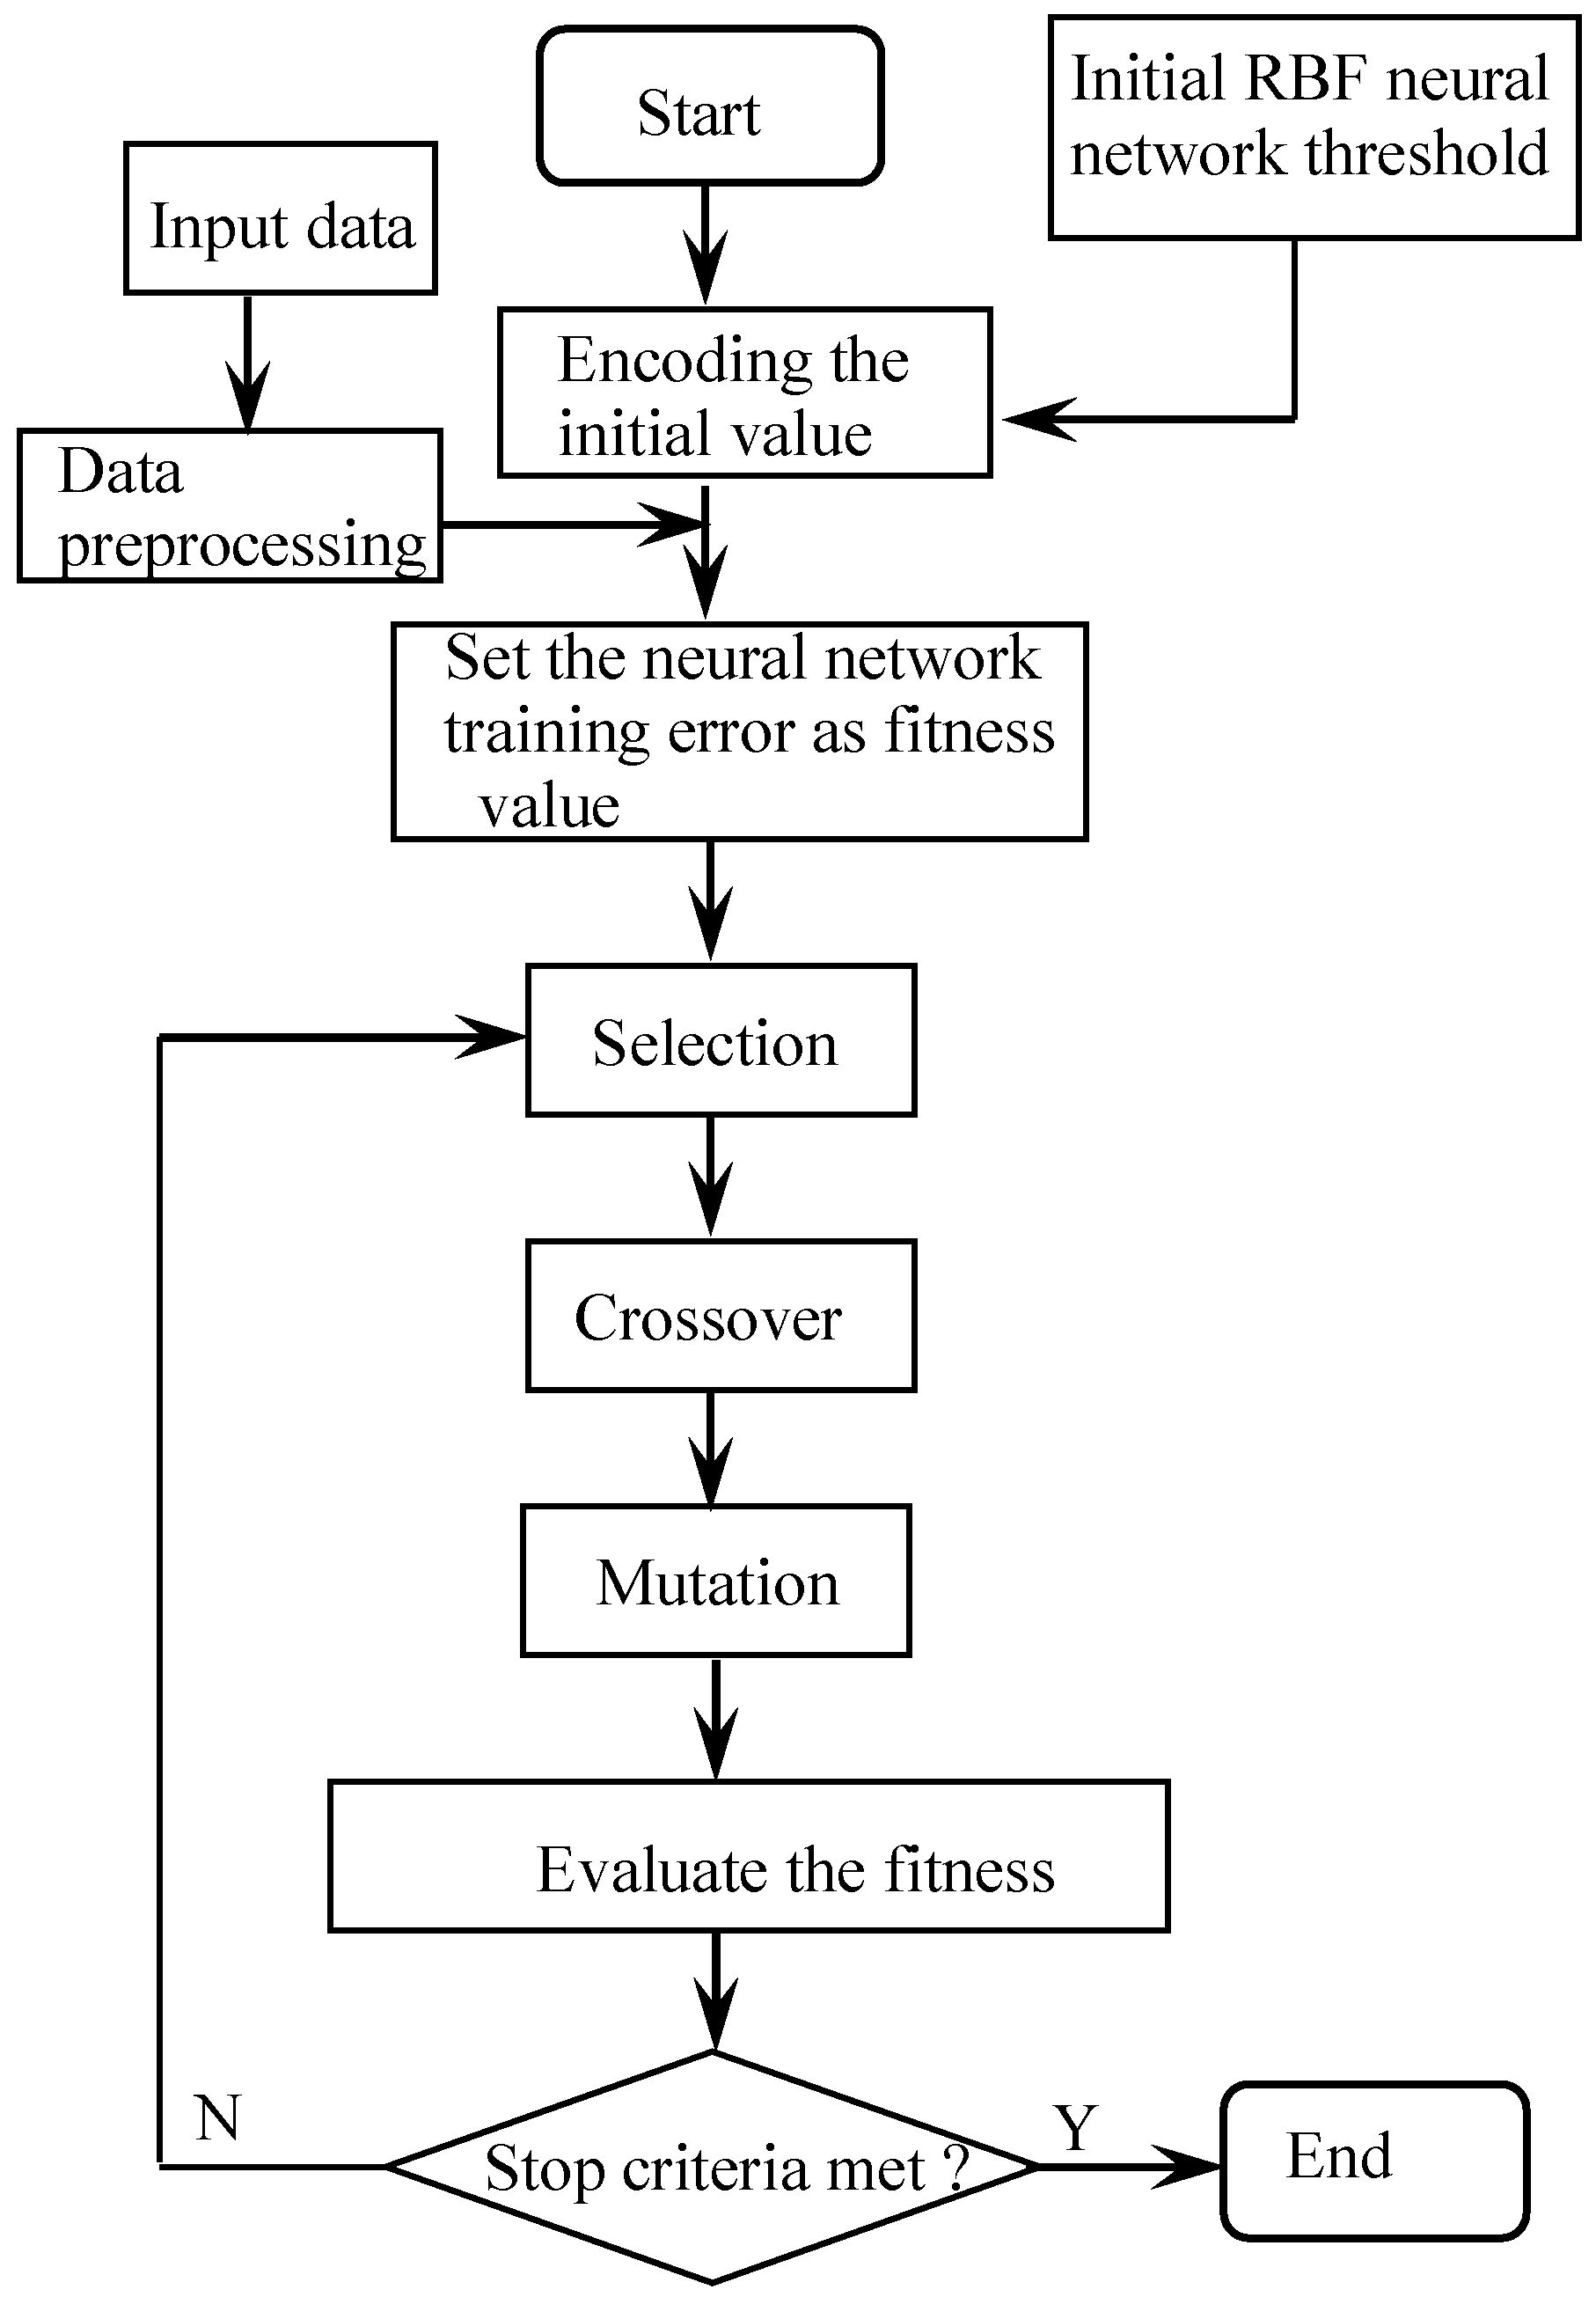
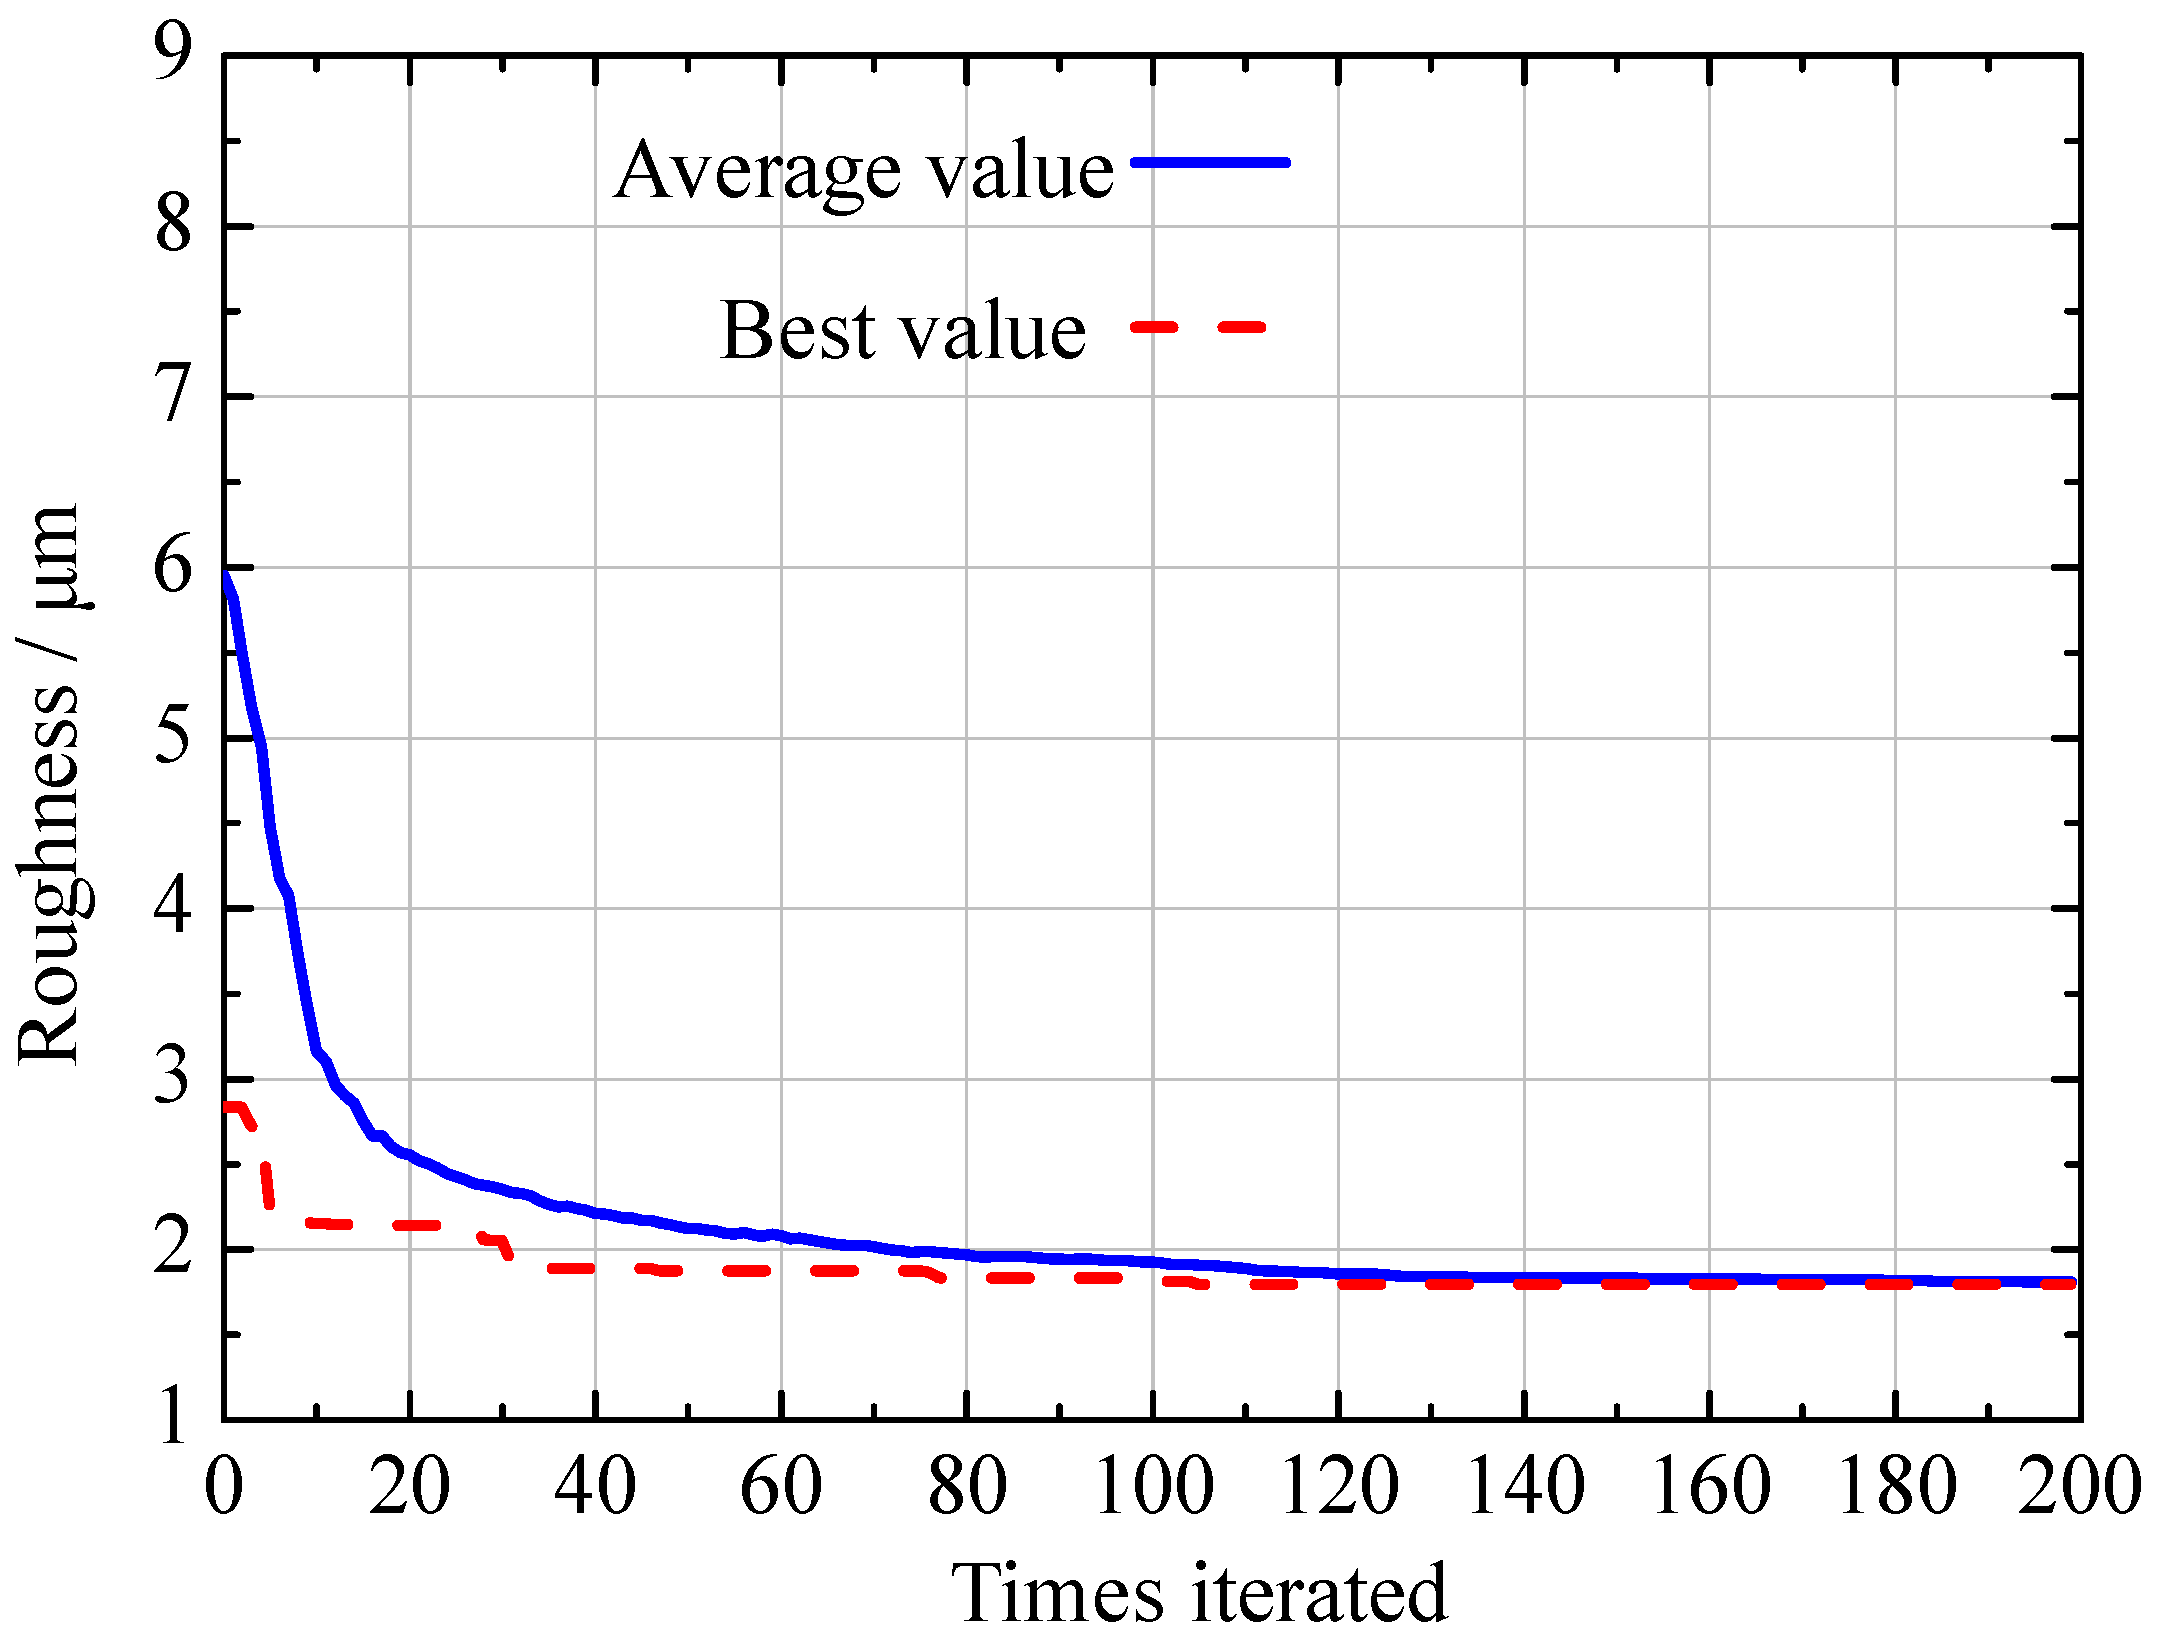
4.2. Solving Process

The solving steps of the GA are shown in Figure 5. The main solution parameters were set as follows: the initial population size p was 100, the maximum number of gene generation MAXGEN was 200, the crossover probability PC was 0.6, and the mutation probability PM was 0.01. The real number coding was selected during the solution process. Since the optimization function contained 4 input parameters, the individual length L was 4. The genetic algebra counter was set as gen = 0.
The predicted value of the machined surface roughness by the RBF neural network was taken as the individual fitness value. The larger the fitness value is, the stronger the chromosome and the better the individual. Therefore, the fitness can be defined as e = 10 y [17]. According to the degree of fitness, roulette was used to select individuals from the current population to the next step.
The adaptability variation curve during the process of optimizing the cutting speed, cutting depth, rake angle, and rounded edge radius is shown in Figure 6.
It can be seen from Figure 6 that convergence was reached after approximately 140 iterations. The obtained minimum roughness of the machined surface was 1.81 μm, and the corresponding cutting speed, cutting depth, rake angle, and rounded edge radius were 11.2 m/min, 0.1 mm, 6.85°, and 11.16 μm, respectively.

5. Comparative Analysis and Experimental Verification

To verify the prediction accuracy of the ANN for the machined surface roughness of graphite/polymer composites, it is necessary to perform further comparative analysis. GRA, which was originally proposed in the 1980s, has been widely used in the field of multiobjective optimization because of its high prediction accuracy [18,19,20]. This section will use GRA to compare and analyze the optimal process parameters obtained by the GA.

5.1. Grey Relational Analysis (GRA)

The existing literature shows that when using the results obtained by the orthogonal experimental design to perform the GRA, the optimal process parameters could be obtained by 9 groups of data [21,22,23]. The 1st to 9th groups of experimental data in Table 3 are selected for analysis. According to the GRA step, the experimental data need to be transformed to eliminate their dimensions and make the data comparable. During the machining process of graphite/polymer composites, a lower machined surface roughness is preferable, which can be characterized by miniaturization. Referring to [24], the experimental data are transformed according to Formula (3). The data transformation results are shown in Table 4.
x i * ( k ) = x i 0 ( k ) m i n x i 0 ( k ) m a x x i 0 ( k ) m i n x i 0 ( k )
where x i * ( k ) represents the transformed data sequence, x i 0 ( k ) represents the original data sequence, i represents the experimental times, k represents the optimization target, namely, the machined surface roughness, and m a x   x i 0 ( k ) and m i n   x i 0 ( k ) represent the maximum and minimum values of the original data sequence, respectively.
The grey relational coefficient needs to be solved when the data transformation is completed. Since the optimization goal in this study was only the machined surface roughness, the grey relational grade could be directly obtained after calculating the grey relational coefficient, as shown in Table 4. The grey relational coefficient was solved according to Formula (4).
ξ i = Δ m i n + ρ Δ m a x Δ o i ( k ) + ρ Δ m a x
where Δ o i ( k ) = | y o ( k ) y i ( k ) | represents the absolute difference, y o ( k ) represents the reference sequence, which is 1, Δ m i n i o i ( k ) m i n represents the minimum difference, Δ m a x i o i ( k ) m a x represents the maximum difference, and ρ is 0.5.
It is necessary to calculate the average grey relational degree of each process parameter at different levels to obtain the optimal cutting parameters. The calculation results are shown in Table 5. The cutting parameter with the maximum grey relational grade was selected as the optimal cutting parameter, see (*) in Table 5, so the optimal cutting parameter combination was A1B1C1D1, that is, the cutting speed was 3 m/min, the cutting depth was 0.05 mm, the rake angle was 0°, and the rounded edge radius was 10 μm. Obviously, this cutting parameter was the No. 1 experiment in Table 3.

5.2. Verification Experiment

The optimal cutting parameters obtained by the two methods of GRA and the GA optimizing ANN are shown in Table 6. The cutting parameters obtained by the GA optimizing the ANN take their close integer values according to actual working conditions. Although the optimal cutting parameters obtained by GRA were included in Table 3, to eliminate the potential impact of different experimental batches, orthogonal cutting experiments were performed together with the cutting parameters obtained by GA optimization. To minimize the error, 5 workpieces were machined for each group of cutting parameters, and the average roughness was taken as the machined surface roughness at the cutting parameters.
Figure 7 shows the typical machined surface morphology of graphite/polymer composites at different cutting parameters. The machined surface morphology at the optimal cutting parameters obtained by the GA optimizing the ANN is shown in Figure 7a. The workpiece surface was relatively intact, and there were no obvious concavities on the machined surface.
The surface morphology machined at the cutting parameters optimized by the grey relational method is shown in Figure 7b. It can be seen in the figure that there are a few tiny concavities on the machined surface. Obviously, the surface quality is not as good as that shown in Figure 7a. Figure 7c shows the machined surface morphology of experiment No. 5 in Table 3, which is also a typical machined surface morphology obtained by graphite/polymer composites without cutting parameter optimization. Figure 7c shows that there are many concavities with different sizes on the machined surface. Comparing Figure 7a,b, it can be seen that the surface quality of Figure 7c is very poor. It should be noted that although the machined surface quality of Figure 7b is not as good as that of Figure 7a, compared with Figure 7c, number of concavities of Figure 7b is significantly reduced, while the average size of concavities is also significantly shortened. Obviously, the machined surface quality of Figure 7b has been much improved compared with Figure 7c, which shows that the method of optimizing machining parameters of graphite/polymer composites by GRA is feasible.
A noncontact 3D surface profiler was used to measure the surface roughness of the machined workpieces and the measurement results are shown in Table 6. It can be seen from the Table that the machined surface roughness obtained by the ANN and GRA was 1.95 and 3.11 μm, respectively, and the prediction error of the ANN was approximately 7%, which verifies the accuracy of the optimal cutting parameters obtained by optimizing the ANN using the GA.

6. Conclusions

(1)
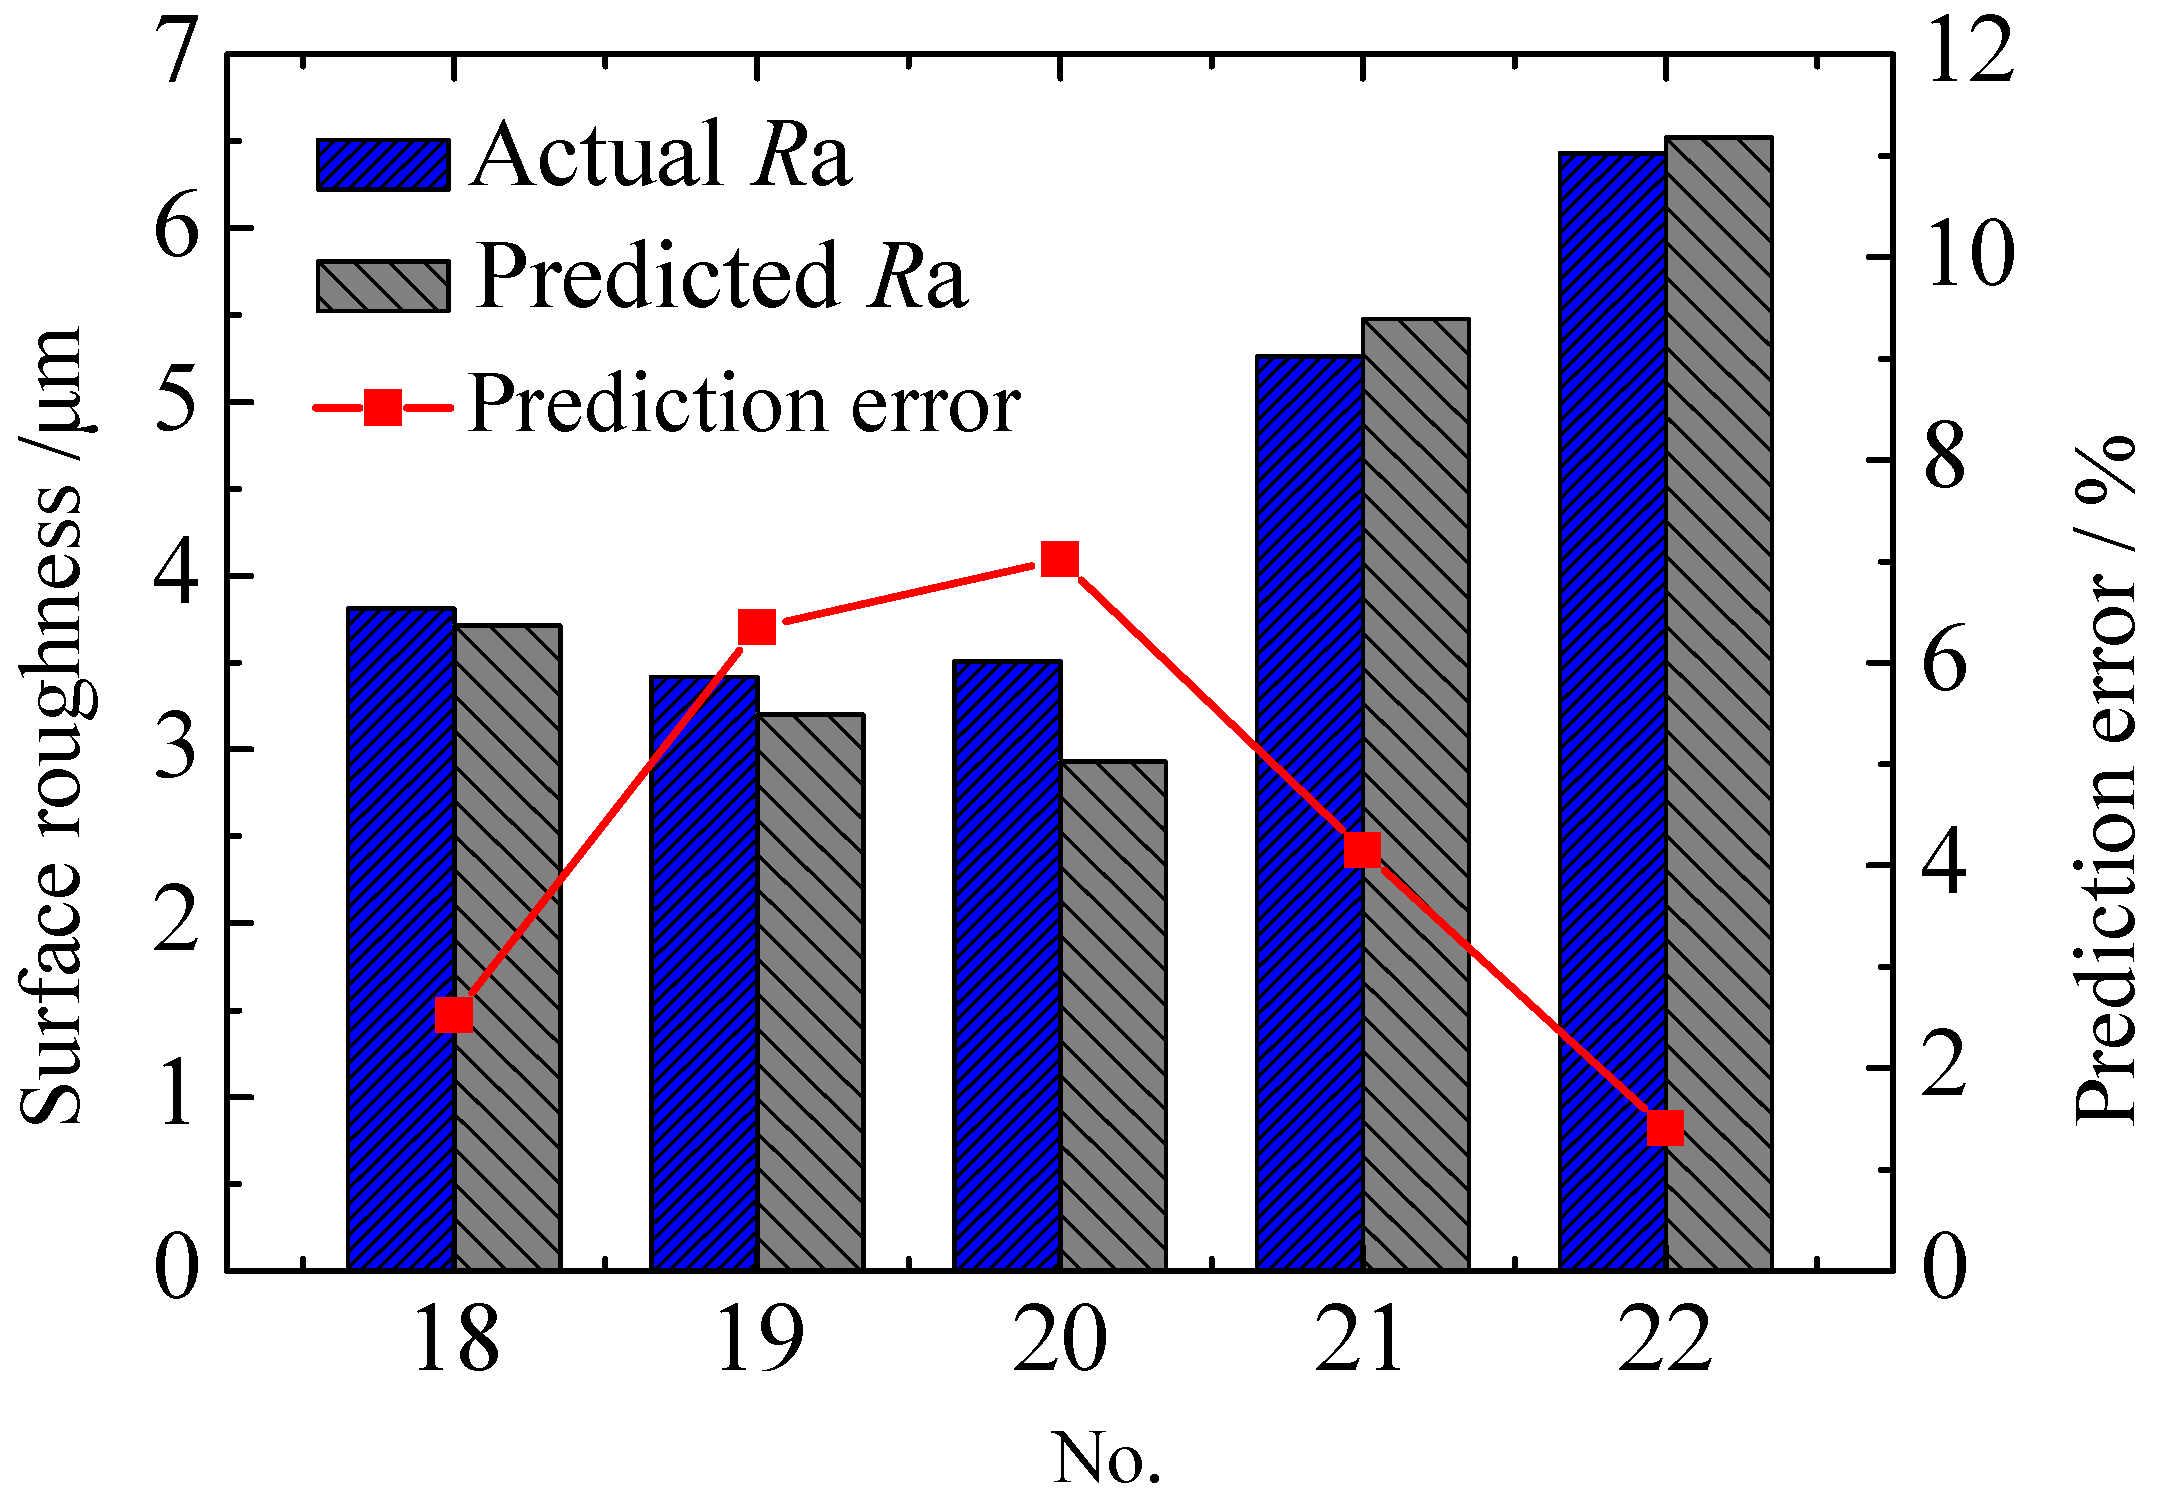
The machined surface roughness data of graphite/polymer composites in orthogonal cutting process were used as training samples of ANN, and then a machined surface roughness prediction model for graphite/polymer composites was established based on RBF ANN. The prediction accuracy of the trained ANN exceeds 93%.
(2)
The prediction results of the ANN optimized by the GA showed that the lowest machined surface roughness of graphite/polymer composites was 1.81 μm, and the corresponding cutting speed, cutting depth, tool rake angle, and rounded edge radius after decoding were 11.2 m/min, 0.1 mm, 6.85°, and 11.16 μm, respectively. It should be noted that some of the data in the above process parameters are difficult to apply in reality, such as rake angle and rounded edge radius. In actual applications, they can be taken as integers close to the computational process parameters. Therefore, the recommended optimal process parameters are cutting speed of 11 m/min, cutting depth of 0.1 mm, tool rake angle of 7°, and rounded edge radius of 10 μm.
(3)
The verification experiment showed that the machined surface roughness of graphite/polymer composites during the orthogonal cutting process was 3.11 μm, when the optimal parameters obtained by the GRA were used. The machined surface roughness was only 1.95 μm at the cutting parameters obtained by the optimized ANN, and the corresponding prediction error of the ANN was approximately 7%.

Author Contributions

D.Y.: Conceptualization, methodology, resources, project administration, writing—original draft preparation; Q.G.: software, formal analysis, writing and editing; Z.W.: software, investigation; Z.Z.: project administration, writing—review and editing; X.H.: writing—review and editing. All authors have read and agreed to the published version of the manuscript.

Funding

This work was supported by the National Natural Science Foundation of China (no. 52165055), Science and Technology Project of Guangxi, China (no. GK AD19245149), and Science and Technology Project of Liuzhou, China (no. 2019DH10601).

Institutional Review Board Statement

Not applicable.

Informed Consent Statement

Not applicable.

Data Availability Statement

All data used to support the findings of this study are included within the article.

Conflicts of Interest

The authors declare that they have no conflict of interest regarding the publication of this paper.

References

  1. Starý, V.; Bačáková, L.; Horník, J.; Chmelk, V. Bio-compatibility of the surface layer of pyrolytic graphite. Thin Solid Films 2003, 433, 191–198. [Google Scholar] [CrossRef]
  2. Kang, K.; Park, S.; Jo, A.; Lee, K.; Ju, H. Development of ultralight and thin bipolar plates using epoxy-carbon fiber prepregs and graphite composites. Int. J. Hydrog. Energ. 2017, 42, 1691–1697. [Google Scholar] [CrossRef]
  3. Zeis, M. Deformation of thin graphite electrodes with high aspect ratio during sinking electrical discharge machining. CIRP Ann. 2017, 66, 185–188. [Google Scholar] [CrossRef]
  4. Tan, D.; Chen, Z.; Li, J.; Luo, J.; Yang, D.; Cui, S.; Zhang, Z. Effects of swirl and boiling heat transfer on the performance enhancement and emission reduction for a medium diesel engine fueled with biodiesel. Processes 2021, 9, 568. [Google Scholar] [CrossRef]
  5. Zhang, Z.; Ye, J.; Tan, D.; Feng, Z.; Luo, J.; Tan, Y.; Huang, Y. The effects of Fe2O3 based DOC and SCR catalyst on the combustion and emission characteristics of a diesel engine fueled with biodiesel. Fuel 2021, 290, 120039. [Google Scholar] [CrossRef]
  6. Zhang, Z.; Jiaqiang, E.; Chen, J.; Zhao, X.; Zhang, B.; Deng, Y.; Peng, Q.; Yin, Z. Effects of boiling heat transfer on the per-formance enhancement of a medium speed diesel engine fueled with diesel and rapeseed methyl ester. Appl. Therm. Eng. 2020, 169, 114984. [Google Scholar] [CrossRef]
  7. Masuda, M.; Kuroshima, Y.; Chujo, Y. The machinability of sintered carbons based on the correlation between tool wear rate and physical and mechanical properties. Wear 1996, 195, 178–185. [Google Scholar] [CrossRef]
  8. Wan, Z.; Yang, D.; Lu, L.; Wu, J.; Tang, Y. Mechanism of material removal during orthogonal cutting of graphite/polymer composites. Int. J. Adv. Manuf. Tech. 2016, 82, 1815–1821. [Google Scholar] [CrossRef]
  9. Wang, C.; Zhou, L.; Fu, H.; Hu, Z. High speed milling of graphite electrode with endmill of small diameter. Chin. J. Mech. Eng. 2007, 20, 27–31. [Google Scholar] [CrossRef]
  10. Zhou, L.; Wang, C.; Qin, Z. Investigation of chip formation characteristics in orthogonal cutting of graphite. Mater. Manuf. Process. 2009, 24, 1365–1372. [Google Scholar] [CrossRef]
  11. Huo, D.; Lin, C.; Dalgarno, K. An experimental investigation on micro machining of fine-grained graphite. Int. J. Adv. Manuf. Tech. 2014, 72, 943–953. [Google Scholar] [CrossRef]
  12. Yang, D.; Wan, Z.; Xu, P.; Lu, L. Rake angle effect on a machined surface in orthogonal cutting of graphite/polymer composites. Adv. Mater. Sci. Eng. 2018, 2018, 1–8. [Google Scholar] [CrossRef] [Green Version]
  13. Yang, Y.; Shie, J.R.; Huang, C.H. Optimization of dry machining parameters for high-purity graphite in end-milling process. Mater. Manuf. Process. 2006, 21, 832–837. [Google Scholar] [CrossRef]
  14. Yang, Y.; Chuang, M.; Lin, S. Optimization of dry machining parameters for high-purity graphite in end milling process via design of experiments methods. J. Mater. Process. Tech. 2009, 209, 4395–4400. [Google Scholar] [CrossRef]
  15. Shie, J.R. Optimization of dry machining parameters for high-purity graphite in end-milling process by artificial neural networks: A case study. Mater. Manuf. Process. 2006, 21, 838–845. [Google Scholar] [CrossRef]
  16. Alzaeemi, S.A.; Sathasivam, S. Artificial immune system in doing 2-satisfiability based reverse analysis method via a radial basis function neural network. Processes 2020, 8, 1295. [Google Scholar] [CrossRef]
  17. Kant, G.; Sangwan, K.S. Predictive Modelling and Optimization of Machining Parameters to Minimize Surface Roughness using Artificial Neural Network Coupled with Genetic Algorithm. Procedia CIRP 2015, 31, 453–458. [Google Scholar] [CrossRef] [Green Version]
  18. Liu, G.; Liu, W.; He, Y.; Gong, J.; Li, Q. Research on influence of exhaust characteristics and control strategy to DOC-assisted active regeneration of DPF. Processes 2021, 9, 1403. [Google Scholar] [CrossRef]
  19. Wang, X.; Fang, H.; Fang, S. An integrated approach for exploitation block selection of shale gas—based on cloud model and grey relational analysis. Resour. Policy 2020, 68, 101797. [Google Scholar] [CrossRef]
  20. Martin, M.P.; Jozef, J. Machining of inserts with pcd cutting-edge technology and determination of optimum machining conditions based on roundness deviation and chip-cross section of aw 5083 al-alloy verified with grey relation analysis. Processes 2021, 9, 1485. [Google Scholar]
  21. Sindhu, D.; Thakur, L.; Chandna, P. Multi-objective optimization of rotary ultrasonic machining parameters for quartz glass using Taguchi-Grey Relational Analysis (GRA). Silicon 2019, 11, 2033–2044. [Google Scholar] [CrossRef]
  22. Yang, C.B.; Lin, C.G.; Chiang, H.L.; Chen, C.C. Single and multiobjective optimization of Inconel 718 nickel-based superalloy in the wire electrical discharge machining. Int. J. Adv. Manuf. Tech. 2017, 93, 3075–3084. [Google Scholar] [CrossRef]
  23. Rajmohan, T.; Palanikumar, K. Optimization of machining parameters for multi-performance characteristics in drilling hybrid metal matrix composites. J. Compos. Mater. 2012, 46, 869–878. [Google Scholar] [CrossRef]
  24. Venkatachalam, A.; Anurag, P.V.S.; Sadanand, T.D.; Nachimuthu, R. Optimization of the milling parameters for an Al/Si3N4 functionally graded composite using grey relational analysis. Mater. Test. 2018, 60, 215–221. [Google Scholar] [CrossRef]
Figure 1. Orthogonal cutting experiment device that (a) is clamping method and (b) is the schematic drawing of tool.
Processes 09 01858 g001
Figure 2. Schematic of artificial network topological structure.
Processes 09 01858 g002
Figure 3. Training results of the ANN.
Processes 09 01858 g003
Figure 4. Training results of the ANN.
Processes 09 01858 g004
Figure 5. The solving process of the GA.
Processes 09 01858 g005
Figure 6. The adaptability variation curve during the optimization process.
Processes 09 01858 g006
Figure 7. Machined surface profile at different cutting parameters.
Processes 09 01858 g007
Table 1. Factors and levels of orthogonal test.
A vc/m·min−1B ac/mmC γoD rε/μm
130.05010
270.151050
3120.302090
Table 2. Mechanical properties of graphite/polymer composites.
PerformanceDensityShore HardnessTensile StrengthCompressive StrengthElastic ModulusPorosity
Parameter1.9 g/cm37517.3 MPa107.2 MPa15.9 GPa0.5%
Table 3. Machined surface roughness at different cutting parameters.
No.vc/m·min−1ac/mmγorε/μmRa/μmSample Description
130.050103.09Orthogonal experimentsANN training samples
230.1510504.83
330.3020908.13
470.0510906.99
570.1520105.80
670.300507.75
7120.0520504.29
8120.150905.57
9120.3010108.53
1030.050504.38
1130.1520905.54
1270.3020507.34
1370.150905.92
14120.150105.00
15100.1010103.38
1650.2010104.56
1750.2510104.96
1870.1010103.81ANN prediction samples
1930.1010103.42
20120.1010103.15
2150.1010505.26
2250.1010906.43
Table 4. Data processing result and grey relational grade.
No.FactorData Processing ResultGrey Relational Grade
ABCD
111111.0001.000
212220.6800.610
313330.0740.351
421230.2830.411
522310.5020.501
623120.1430.368
731320.7790.693
832130.5440.523
933210.0000.333
Table 5. Average grey relational grade at different cutting parameters.
FactorAverage Grey Relational Grade
Level 1Level 2Level 3
A0.654 *0.4270.516
B0.701 *0.5450.351
C0.630 *0.4510.515
D0.611 *0.5570.428
Table 6. Optimal cutting parameters and machined surface roughness at different optimization methods.
vc/m·min1ac/mmγorε/μmSurface Roughness/μm
OptimalExperimental
GA optimization110.107101.811.95
GRA30.050103.093.11
Publisher’s Note: MDPI stays neutral with regard to jurisdictional claims in published maps and institutional affiliations.

