Article

Harnessing the Potential of Symbiotic Endophytic Fungi and Plant Growth-Promoting Rhizobacteria to Enhance Soil Quality in Saline Soils

by
Zahra Rouydel
1,
Mohsen Barin
1,*,
Mir Hassan Rasouli-Sadaghiani
1,
Maryam Khezri
2,
Ramesh Raju Vetukuri
3,* and
Sandeep Kushwaha
3,4
1
Department of Soil Science, Faculty of Agriculture, Urmia University, Urmia 5756151818, Iran
2
Iranian Research Institute of Plant Potection, Agricultural Research, Education and Extension Organization (AREEO), Tehran 1985713133, Iran
3
Department of Plant Breeding, Swedish University of Agricultural Sciences, SE-234 22 Lomma, Sweden
4
Department National Institute of Animal Biotechnology, Hyderabad 500032, India
*
Authors to whom correspondence should be addressed.
Processes 2021, 9(10), 1810; https://doi.org/10.3390/pr9101810
Submission received: 19 September 2021 / Revised: 4 October 2021 / Accepted: 8 October 2021 / Published: 12 October 2021
(This article belongs to the Special Issue Role of Microorganisms in Remediating Contaminated Soils)

Abstract

:
Soil salinity is one of the most important abiotic stresses limiting crop growth and production worldwide. Some microorganisms can improve the plants’ tolerance to salinity. For this purpose, a greenhouse experiment was performed to understand the influence of various microorganisms on soil biological indices and wheat growth under different saline conditions. The factors varied in the experiment were the microbial treatment (rhizobacteria, mycorrhizal fungi, endophytic fungus, and control) and salinity stress (0.5, 8, and 14 dS m−1). Rhizobacteria were isolated from saline soils, but the fungi were prepared from a microbial bank. Overall, ten isolates were purified, and three with promising growth-promoting properties were identified using phenotypic and molecular methods. The selected isolates belonged to the genera Pseudomonas (P. aeruginosa Ur83 and P. fluorescens Ur67) and Stenotrophomonas (S. maltophilia Ur52). Soil quality indices were found to decrease with increasing salinity, but inoculation with microorganisms alleviated this decline. Inoculation with plant growth-promoting rhizobacteria (PGPRs) increased basal respiration, substrate-induced respiration, microbial biomass carbon, acid and alkaline phosphatase activities, and carbon availability by factors of 1.37, 1.27, 1.83, 3.07, 1.29, and 1.11, respectively. These results show that inoculation with symbiotic microorganisms can improve agricultural soil quality under saline conditions and may thus be valuable in agriculture.

1. Introduction

Soil salinity is a major threat to agricultural sustainability, especially in arid and semi-arid regions [1], and is common environmental stress limiting agricultural production in Iran [2]. A major cause of soil and water salinity is the unplanned and excessive use of chemical fertilizers [3]. Soil salinity has several adverse effects on plant growth: it causes osmotic stress by reducing the osmotic potential of the soil solution, salinity stress by increasing the concentrations of specific ions, imbalances in the soil’s content of nutrient elements [4,5], and changes the soil’s physical and chemical properties [4,6,7]. Overcoming the challenges posed by soil salinity will require a deep understanding of the interactions between plant roots and soil microorganisms, as well as advances in plant biotechnology to maintain crop yields and soil health [8]. Various methods have been developed for improving soil quality indices using microorganisms, such as plant growth-promoting rhizobacteria (PGPRs), arbuscular mycorrhizal fungi (AMF), and endophytic fungi [9,10]. PGPRs isolated from saline regions are resistant to high salt concentrations and enhance plant resistance to salinity stress by increasing hydraulic and osmotic conductivity, promoting osmotic adjustment, reducing the toxic impacts of Na+, and protecting photosynthesis. Mycorrhizal fungi can thus be used as a biological amendment agent in saline soils to prevent uptake of sodium (Na) and chloride (Cl) or reduce their mobilization [1]. Pirimospora indica is a salt-tolerant fungus that can be used for this purpose; it can tolerate NaCl concentrations up to 0.4 mol L−1 [10].
Soil quality is closely linked to the soil’s biological, physical, and chemical properties [11]. The biological aspects of soil quality can be quantified using soil biological indices [12]. High quality soil is characterized by a good level of microbial diversity and appropriate distribution of active microbial communities. Accordingly, several soil health and quality indices measure the diversity and distribution of soil microorganisms; examples include basal respiration, substrate-induced respiration, microbial biomass carbon, phosphatase enzyme activity, carbon availability, metabolic quotient, and the root colonization degree [13]. The soil microbial respiration index measures the rates of several biochemical reactions [14]; as such, it is an indicator of soil microbial activity but also reflects trends in organic matter decomposition, enzymatic activity, and the cycles of some soil nutrients [15]. In addition, substrate-induced respiration is a key index for quantitatively estimating the fraction of soil microbial biomass within the soil organic matter [16]. Microbial biomass and phosphatase enzyme activity are also important biochemical indicators of soil quality [17].
Soil enzymatic activity is closely linked to microbial biomass because the enzymatic activity of soil microorganisms is responsible for the production of their biomass. Other soil quality indices commonly used to assess the status and activity of soil microbes are the metabolic quotient, and carbon availability index [18]; the carbon availability index, in particular, is a key indicator of substrate limitation. Rao and Pathak [19] showed that reduced microbial growth was associated with reduced substrate availability in sodic soils and with stress caused by high salt concentrations in saline soils. Their results also showed that salinity can reduce the substrate use efficiency of microbial biomass, causing a loss of microbial population, and a reduction in the soil respiration rate and microbial biomass [19]. A separate study showed that soil salinity reduces soil enzymatic activity and microbial biomass carbon [20]. Tripati et al. [21] reported that one of the reasons for poor crop growth in salt-affected coastal soils is the decrease in MBC, BR and enzymatic activity with increasing salinity. Wong et al. [22] study on the effects of salinity on soil respiration assessed over 12 weeks and reported that the soil respiration rate was highest (56–80 mg CO2-C kg−1 soil) in the low-salinity treatments. Another study showed that a large microbial biomass can better adapt to EC changes than a small microbial biomass [23]. The positive impact of mycorrhizal fungi on plant growth and soil quality is illustrated by the example of P. indica, which forms symbiotic relationships with various plant species, enhancing their growth and tolerance of various stresses [24]. As soil quality indices are indicators of soil fertility, it can be concluded that any decline in soil quality due to salinity will reduce soil fertility and thus reduce plant growth and production. However, some soil microorganisms can induce and increase soil microbial activity, leading to intensified phosphatase enzyme activity and increased soil microbial biomass [25]. Microorganisms can also improve plant growth, leading to increased root exudation which in turn stimulates the growth of microorganisms in the rhizosphere and thus improves the soil quality indices. The specific objectives of this study were thus to investigate the potential for improving soil quality in saline regions by (i) isolating and identifying native PGPRs from saline soils and (ii) assessing their impact, along with that of symbiotic and endophytic fungi, on biological soil quality indicators under saline conditions.

2. Materials and Methods

2.1. Soil Sampling and Isolation of Bacteria

To isolate PGPR bacteria, 30 soil samples were collected randomly from the rhizospheric soil of plants grown in saline soils in the Lake Urmia basin in West Azerbaijan province, Iran. The rhizospheric soils were manually separated from the roots and stored at 4 °C in a refrigerator until further processing. Soil samples were diluted using the ten-fold dilution series technique with sterile distilled water. The dilutions were then cultured on a nutrient agar (NA) medium, incubating the plates at 28 ± 2 °C for one to four days. Finally, ten bacterial colonies with different morphological characteristics were selected for use in the subsequent experiments.

2.2. Purification of Bacteria

To purify the selected isolates, colonies were streaked on NA and the plates were then kept at 28 ± 2 °C for two days. The resulting isolates were sub-cultured three times until pure colonies were obtained. After growing, a pure colony of each bacterial strain was selected [26]. Pure colonies were cultured on NA in tubes. After growing the isolates in this way, sterile glycerol was added and the isolates were stored at 4 °C [27].

2.3. Assessment of Some PGPR Properties of the Isolates

2.3.1. Qualitative Assessment of Insoluble Phosphate Solubilization Potential in NBRIP Medium

The qualitative potential of the isolates to solubilize insoluble phosphate was evaluated using the National Botanical Research Institute’s phosphate (NBRIP) medium [28]. Three plates containing this culture medium were prepared for each bacterial isolate, then 5 μL of an overnight culture of the appropriate bacteria grown in the nutrient broth (NB) culture medium was placed in the center of the plates. The inoculated plates were kept in an incubator at 28 ± 2 °C for seven days, after which their solubilization zones and bacterial colony diameters were measured. Finally, the solubility index (SI) was calculated for each isolate as the ratio of the solubilization zone diameter to the colony diameter [29].

2.3.2. Quantitative Assessment of Insoluble Phosphate Solubilization Potential in Broth NBRIP Medium

The selected isolates were cultured in a broth NBRIP culture medium. From the overnight culture of the bacteria grown in the NB medium, 2% was cultured in Erlenmeyer flasks containing 150 mL of the broth NBRIP culture medium with an insoluble phosphate source (5 g L−1 of tricalcium phosphate, Ca3(PO4)2). The Erlenmeyer flasks were then incubated on a shaker (120 rpm) at 28 ± 2 °C for ten days. Finally, the phosphorus concentration was measured using the molybdovanadate method [30].

2.3.3. Qualitative Assessment of Mica Solubilization Potential

To qualitatively assess the mica solubilization potential of the bacteria, a plate containing Aleksandrov medium [31] was prepared for each isolate. The bacteria were then cultured as described in Section 2.3.1 and the mica solubility index was calculated [29].

2.3.4. Auxin Production

To assay the auxin production potential of the isolates, the bacteria were first cultured on an NA culture medium for 48 h. Then, 50 μL of the bacterium suspension was transferred to 25 mL of NB medium containing 100 mg L−1 of L-tryptophan and incubated at 48 °C for 24 h. Next, some drops of Salkowski’s reagent (150 mL of H2SO4, 7.5 mL of 0.5 M FeCl3·7H2O, and 250 mL of distilled water) were added to the suspension. The formation of a red ring at the surface of the solution was considered a positive response; the lack of such a ring was considered a negative response [32].

2.3.5. Siderophore Production

Siderophore production was measured by inoculating an adjusted population of bacteria in the CAS-Agar medium. The medium was prepared by the modified method of Alexander and Zuberer [33] using Fe-CAS medium, nutrient buffer and casamino acids that were prepared separately, sterilized and then mixed. The bacteria were then cultured as described in Section 2.3.1, and the plates were incubated at 28 ± 2 °C. Bacterial siderophore production was indicated by a change in the color of the CAS medium from blue to orange.

2.3.6. Salinity Assay

To test the growth potential of the bacteria at different salinity levels, Tris-minimal salt culture broth media with NaCl contents of 0, 2, 5, 7, and 10% were prepared. Overnight bacterial cultures were grown in the NB medium (after inoculation with 2% v/v of the appropriate bacterial suspension) were inoculated into the broth salt-containing culture medium. The turbidity caused by the growth was determined 72 h later by measuring absorption at 600 nm with a spectrophotometer [34].

2.4. Selection of Superior Rhizobacteria for Phenotypic and Molecular Identification

Based on the results of the assays, including phosphorus and potassium solubilizing potential and auxin and siderophore production potential, three isolates with superior PGPR properties were selected for phenotypic and molecular identification, and for use in greenhouse experiments.

2.4.1. Phenotypic Identification of the Selected Isolates

The phenotypic properties of the selected isolates were characterized in accordance with standard and valid bacteriological references [26] by determining their Gram staining properties, aerobic/anaerobic growth, motility, oxidase activity, catalase activity, fluorescent pigment production on King’s-B medium, endospore production, levan production, gelatin hydrolysis, and citrate utilization were evaluated.

2.4.2. Molecular Identification and Phylogenetic Tree

Molecular identification of the superior phosphate solubilizing PGPRs was performed using universal primers targeting the 16S rRNA gene. Genomic DNA was extracted from the selected isolates according to Llop et al. [35]. The polymerase chain reaction was performed with primers fD1 (5′-AGAGTTTGATCCTGGCTCAG-3′) and rD1 (5′-AAGGAGGTGATCCAGCC-3′) [36]. The reaction mixture components and thermal cycle were as reported by Suzuki and Yamasato [37]. Formation of the PCR product was verified by performing electrophoresis at 75 V cm−1 for one hour in a 1% agarose gel stained with FluoroDye DNA Fluorescent Loading Dye 1 μL mL−1 (SMOBiO Technology Inc., Hsinchu, Taiwan). Sanger sequencing of PCR products was performed by Macrogen Corporation (Seoul, South Korea). Nucleotide sequences were edited using the Chromase software package. The resulting sequences were aligned and compared to GenBank sequences using the ClustalX program (version 2.0). The NCBI BLAST database was used to analyze the homology of the studied 16S rRNA sequences. The phylogenetic tree of the chosen PGPRs was determined using the neighbor-joining (NJ) method [38] and the Kimura 2-parameter model [39] with 1000 bootstrap replicates [40] in MEGA6 software (version 6.0) [41].

2.5. Pot Experiment

A completely randomized factorial experimental design with three replicates and two factors was used. The factors were salinity (0.5, 8, and 14 dS m−1) and microbial inoculation (PGPR, AMF, the endophytic fungus Piriformospora indica, and control). The used soil was collected at a depth of 0–30 cm from a farm of Urmia University in West Azerbaijan province, Iran. The used soil was collected at a depth of 0–30 cm. After being air-dried, it was passed through a 5-mesh sieve and its physical and chemical properties were characterized using standard methods (Table 1; [42]). It was then transferred into 5-kg plastic pots. Microbial inoculation of wheat seeds (Triticum aestivum L cv. Ofogh prepared by seed and plant improvement institute, Karaj, Iran) was performed using the bacteria isolated from the rhizosphere soil (three isolates), a mixture of known PGPRs (Pseudomonas aeruginosa, Pseudomonas fluorescens, and Stenotrophomonas maltophilia), endophytic fungi (P. indica), and mycorrhizal fungi (a mixture of Rhizophagus irregularis, Rhizophagus fasciculatus, and Diversispora versiformis). All microbial strains other than the isolates were provided by the microbial bank of the Department of Soil Science at Urmia University, Urmia, Iran. The seeds were inoculated with the bacteria and endophytic fungi by immersing and shaking germinated seeds for 2 h in inoculant suspensions with microbial populations of 108 CFU and 10−5 sporesmL−1, respectively. After shaking, the seeds were spread and dried under a sterile airflow in a laminar hood and then sown the same day. In the AMF treatments, 60 g of inoculant (including all the three fungi) was poured under the seeds. In the control treatments, the seeds were shaken in sterile distilled water rather than microbial suspensions. Ten seeds were sown in each pot after surface disinfection with 0.5% sodium hypochlorite. To establish different levels of soil salinity, the soil was saturated with NaCl solutions of varying concentrations. In the initial trials, NaCl solutions prepared by dissolving 0.2, 0.4, 0.6, 0.8, or 1 g NaCl in 150 mL of water were added to pots containing 500 g dry soil to establish saturation. The electrical conductivities (EC) of the soils were then measured 24 h later. A linear regression analysis was then performed to relate the measured EC to the amount of NaCl added to the soil and the resulting regression equation was used to determine the concentrations of the NaCl solutions that would be needed to achieve the salinity levels required for the planned experimental treatments. The salinity treatments were gradually applied to the pots over a two-week period after sowing [43]. During the growth period, the moisture requirement of each pot was determined by measuring its weight daily and all other parameters were kept constant for all pots during the entire growth period.

2.5.1. Plant Harvest and Chemical Analyses

After 60 days, a fraction of the rhizosphere soil was removed from the pots and stored at 4 °C in aerated plastic bags in a refrigerator for evaluation of its qualitative characteristics in a laboratory. The samples were warmed to 25 °C and held at that temperature for 24 h before being used in assays. The method of Anderson [44] was used to measure microbial basal respiration. For this purpose, 25 g of rhizosphere soil was transferred to a special glass jar for measuring respiration. A test tube containing 10 mL of a 0.5 M NaOH solution was placed in each jar alongside the soil sample and the lid was tightly closed. The glass jar containing the sample and a soil-free control jar were incubated at 25 °C for 5 days in the dark, after which the contents of the test tubes were titrated with 0.5 M HCl. Finally, the amount of released CO2 was calculated in mg CO2-C kg−1 day−1.
Substrate-induced respiration was measured as described by Nakamoto and Wakahara [45]. Briefly, 20 mg of glucose was added to 10 g of soil and the soil was placed in a glass jar together with a test tube containing 10 mL of a 0.5 M NaOH solution. The jar was then incubated for 6 h at 25 °C. As in the measurement of basal respiration, the amount of released CO2 was calculated in mg CO2-C kg−1 day−1. Phosphatase activity in the soil samples was measured according to Tabatabai and Bremner [46]. Briefly, 1 g of a soil sample (<2 mm) was placed in a 50 mL container and 1 mL of the substrate p-nitrophenyl phosphate was added along with 4 mL MUB (modified universal buffer). The sample was then incubated at 37 °C for 1 h. Control samples were prepared in the same way but without adding soil. The staining caused by the release of p-nitrophenol was then measured spectrophotometrically at 420 nm.
Finally, microbial biomass carbon (MBC) was determined using the chloroform fumigation method of Jenkinson and Ladd [47]. In this method, two portions of moist soil (20 g oven-dry soil) were weighed. One portion was then fumigated for 24 h at 25 °C in a desiccator before being extracted with a 0.5 M K2SO4 solution. The second portion was extracted in the same way without prior fumigation. The amount of C in each extract was then measured [48].
The metabolic quotient was calculated by dividing the basal respiration by the MBC [49] and the carbon availability index was determined by dividing the basal respiration by the substrate-induced respiration [50]. AMF colonization of root samples was determined after rinsing with water, clearing with 10% (w/v) KOH, acidification with 1% HCl, and staining with 0.05% (w/v) Trypan blue [51].

2.5.2. Statistical Analysis

All statistical analyses were performed using SPSS software version 19.0. Means were compared using Duncan’s multiple range test with a significance threshold of p < 0.05.

3. Results and Discussion

3.1. In-Vitro Trials

3.1.1. PGPR-Specific Tests

Thirty soil samples were collected from the saline lands around Lake Urmia, from which ten bacterial isolates were isolated and purified. Three of these isolates were then selected for molecular identification on the basis of PGPR-specific tests (potassium and phosphorus solubilizing potential, siderophore production, and auxin production; see Table 2). The selected isolates were found to be capable of solubilizing phosphate in solid and broth NBRIP media (Table 2), with the Ur67 isolate exhibiting the greatest phosphorus solubilizing potential. Only two of the studied isolates, Ur67 and Ur52, exhibited appreciable auxin production. Additionally, only Ur83 and Ur67 yielded positive results in the siderophore production assay (Table 2). Finally, three of the isolates grew well at NaCl concentrations of 2, 5, 7, and 10%, indicating high salt tolerance. Three superior isolates, Ur83, Ur67, and Ur52, were identified based on these results and the outcome of the PGPR tests and were thus selected for further study, including molecular identification and use in greenhouse experiments. All isolates were capable of solubilizing potassium; that with the greatest potassium-solubilizing potential was Ur83. Solubilization of insoluble phosphorus and potassium compounds is probably achieved via the production and secretion of organic and inorganic acids, chelates, and enzymes [52,53,54].

3.1.2. Phenotype Identification

The morphological, biochemical, and physiological assays showed that all three selected isolates were Gram-negative (Table 3).

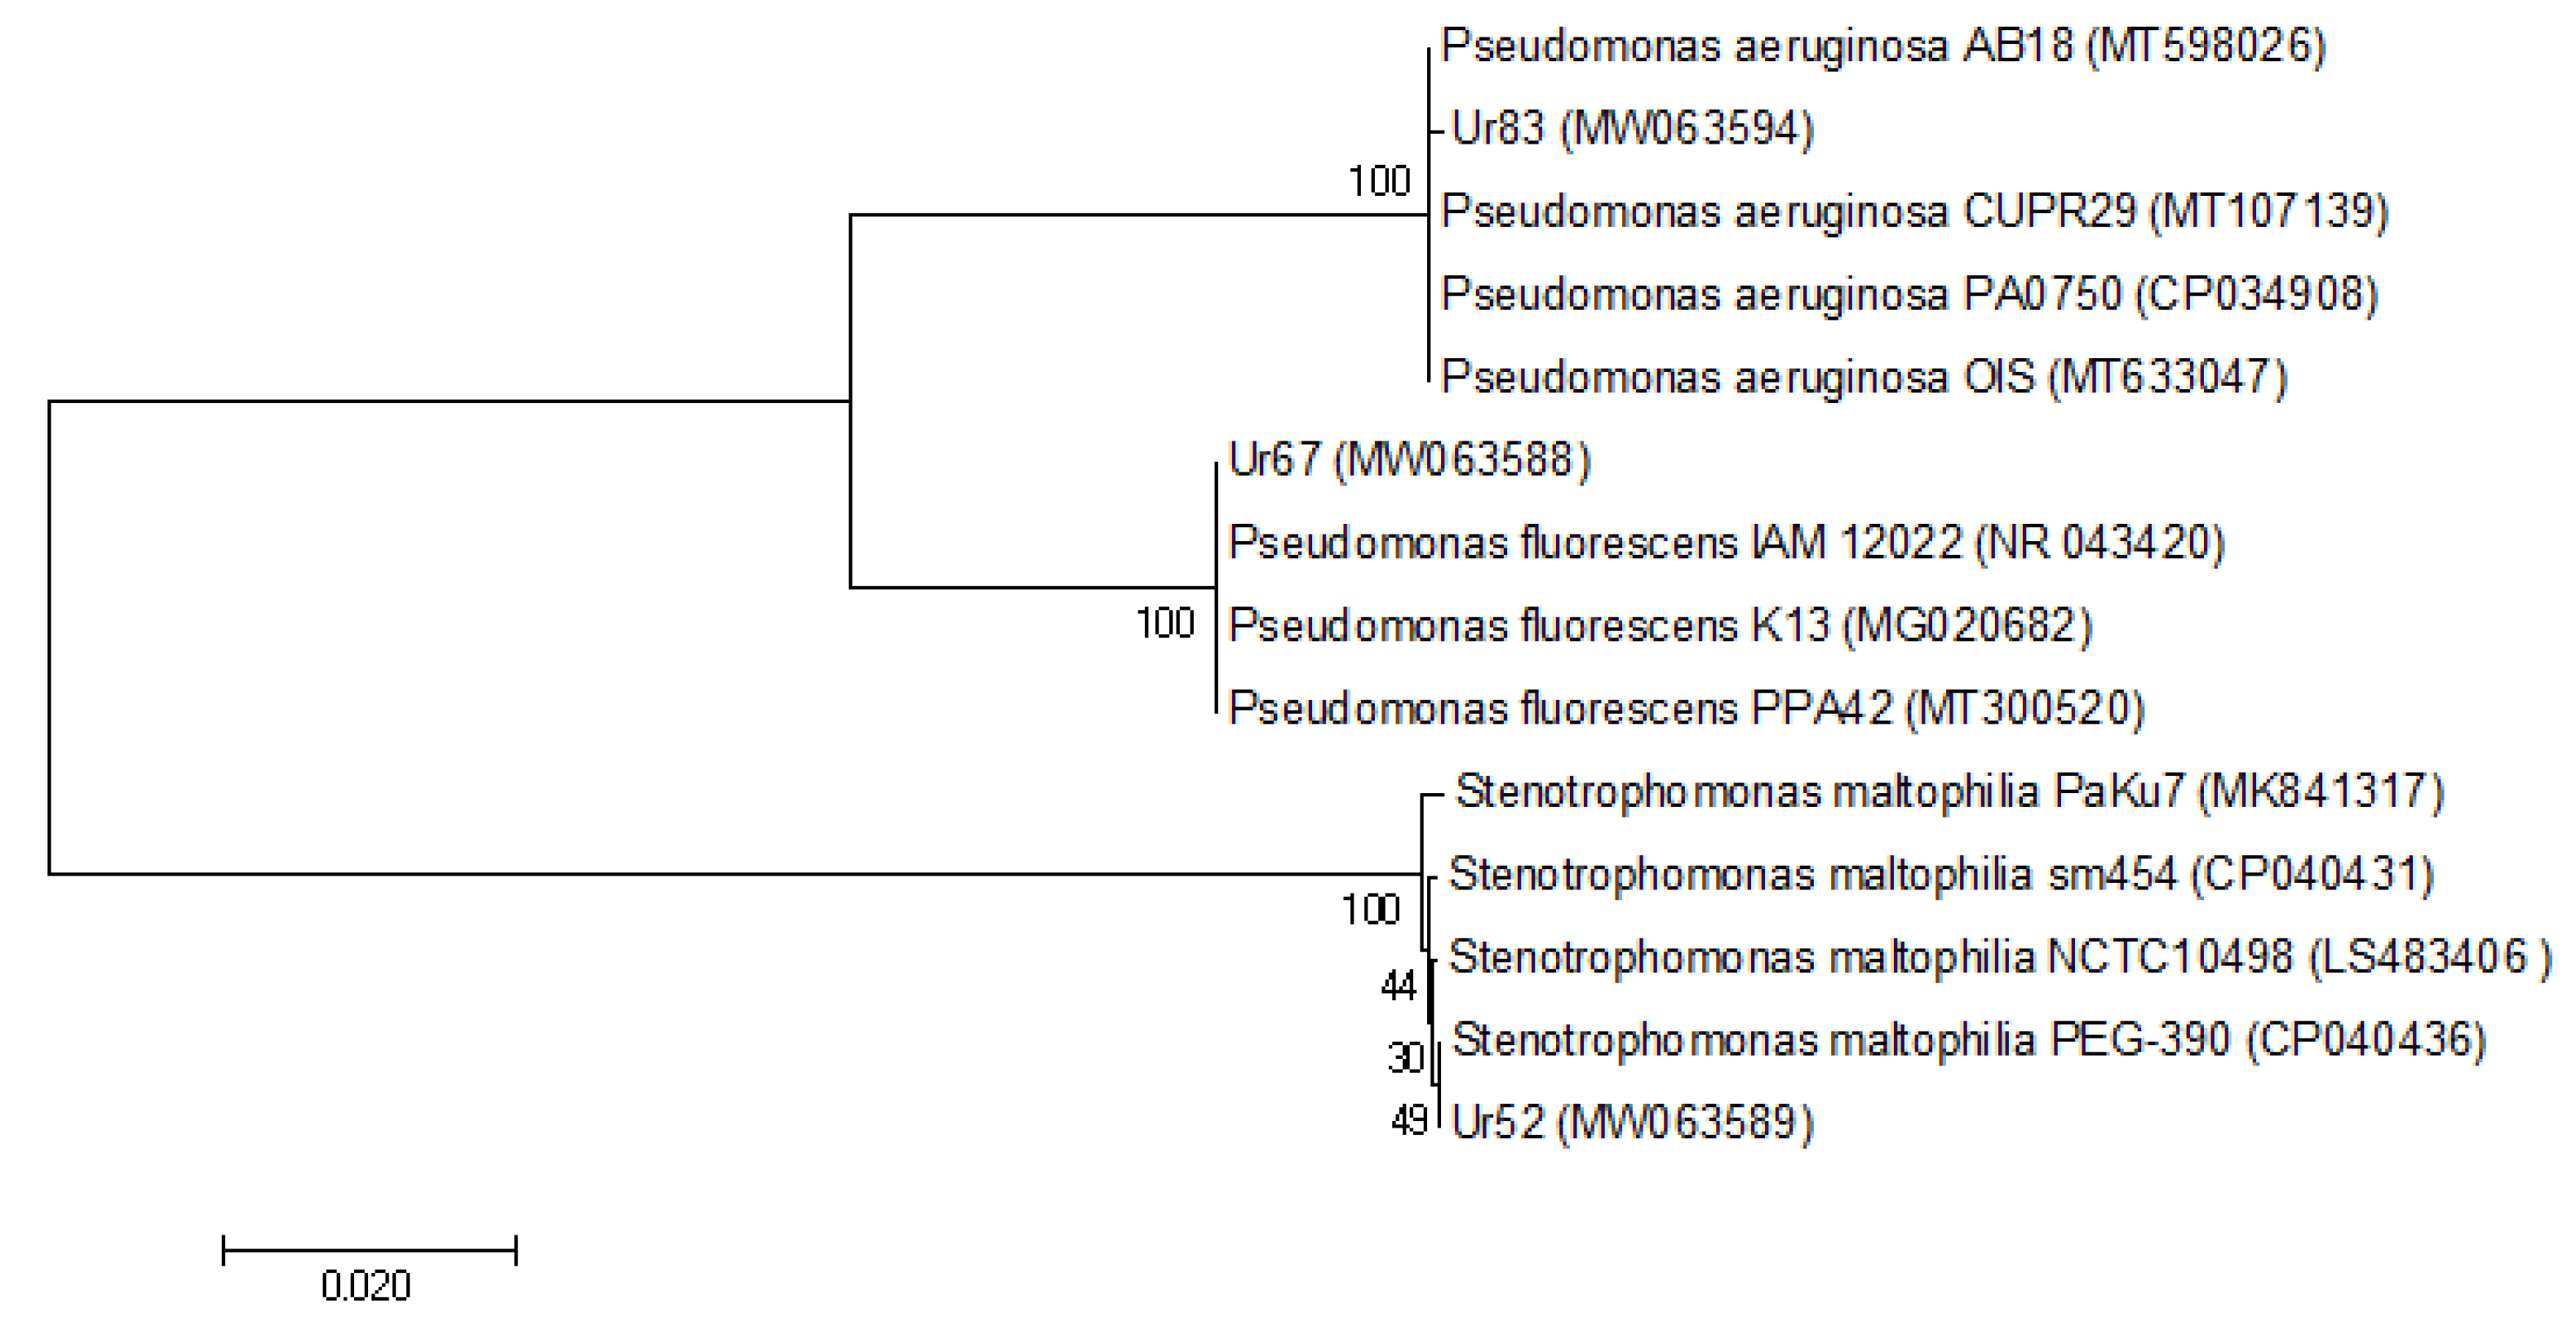
3.1.3. Molecular and Genotypic Identification of the Superior Isolates

Sequence analysis of the 16S rRNA gene showed that Ur52 was related to Stenotrophomonas maltophilia; the sequence homology between Ur52 and S. maltophilia strains based on GenBank data was 99.92%. The sequences obtained from Ur83 were assigned to Pseudomonas aeruginosa with 99.42% homology and Ur67 showed 100% similarity to the 16S rRNA sequences of Pseudomonas fluorescens registered in GenBank. The 16S rRNA sequences of Ur52, Ur83, and Ur67 were deposited in GenBank under the accession numbers MW063589, MW063594, and MW063588, respectively (Figure 1).
The apparent close relationship between Ur52 and S. maltophilia is interesting because S. maltophilia is a nosocomial pathogen that causes high mortality among immunocompromised children [55]. However, its presence in cultured agricultural soils has been reported previously [56], and it was successfully used as a biocontrol agent against potato brown rot disease [57]. Sequence analysis of Ur67 and Ur83 revealed that these isolates were related to P. aeruginosa and P. fluorescens species, which have been reported to exhibit plant growth-promoting (PGP) effects [58]. In contrast, Taurian et al. [59] found that over 70% of a collection of 110 phosphate stabilizing strains possessed siderophore-synthesizing capability. It should be noted that Pseudomonas is the most strongly represented genus among all bacteria in the rhizosphere.

3.2. Greenhouse Trials

Analysis of variance (ANOVA) revealed statistically significant impacts of salinity on most of the measured soil microbial indices, including basal and substrate-induced respiration (p < 0.001), carbon availability (p < 0.05), microbial biomass carbon (p < 0.001), acid and alkaline phosphatase enzyme activity (p < 0.001), and root colonization symbiosis percentage (p < 0.001), but not on the metabolic quotient. ANOVA also revealed that microbial inoculation had significant effects on basal and substrate-induced respiration (p < 0.001), microbial biomass carbon (p < 0.001), the metabolic quotient (p < 0.05), acid and alkaline phosphatase enzyme activity (p < 0.001 and p < 0.05, respectively) and the root colonization symbiosis percentage (p < 0.001), but not on carbon availability. However, there was no significant interactive effect of these treatments.

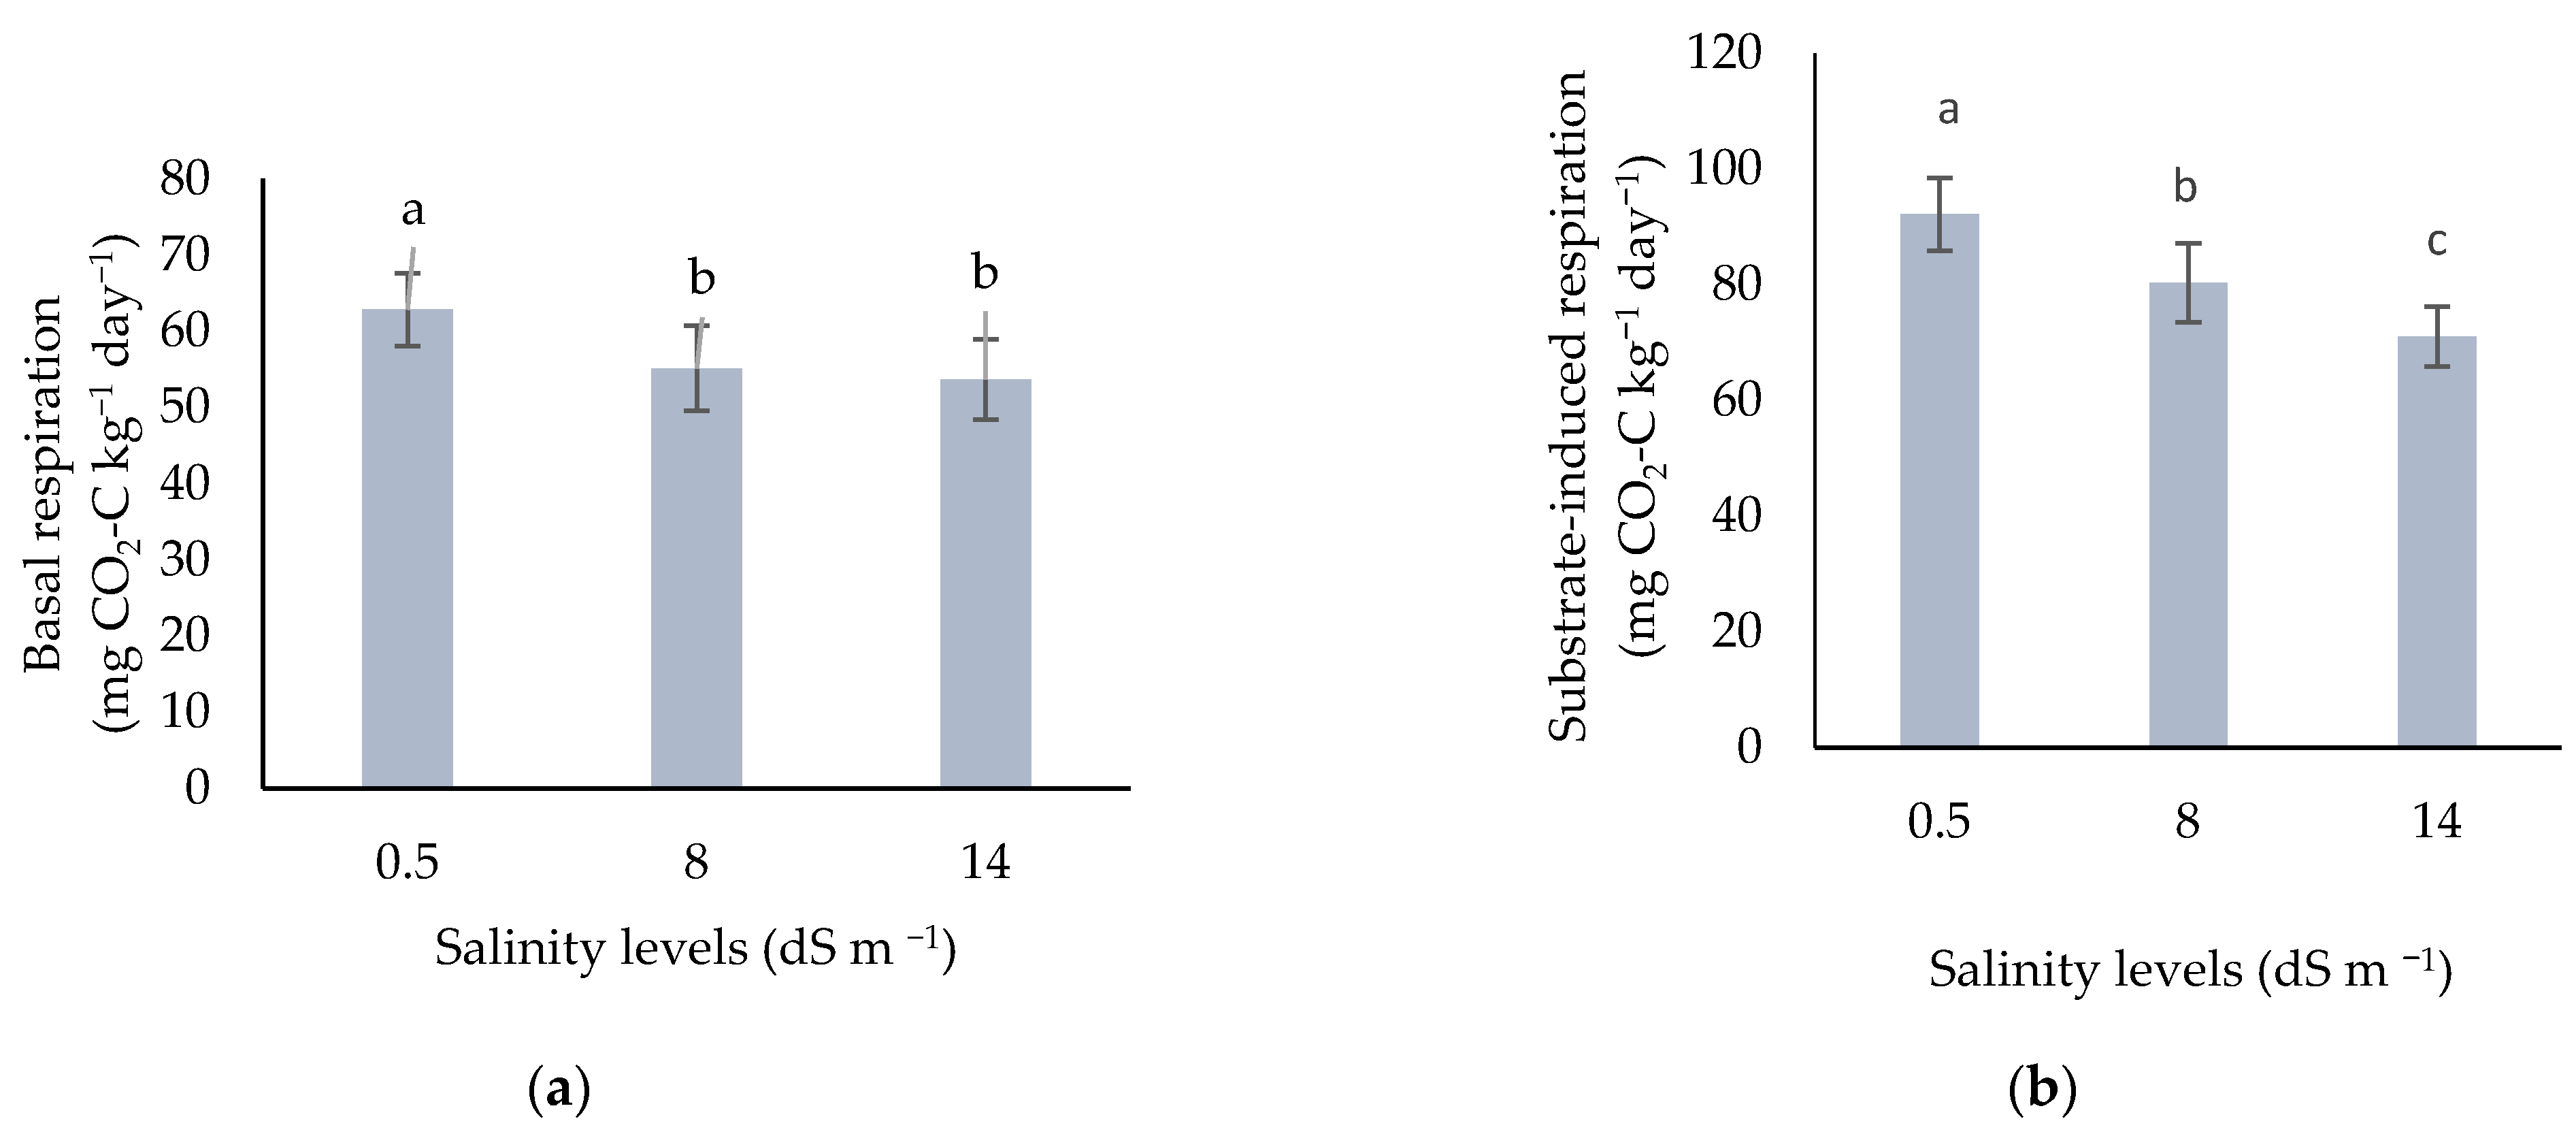
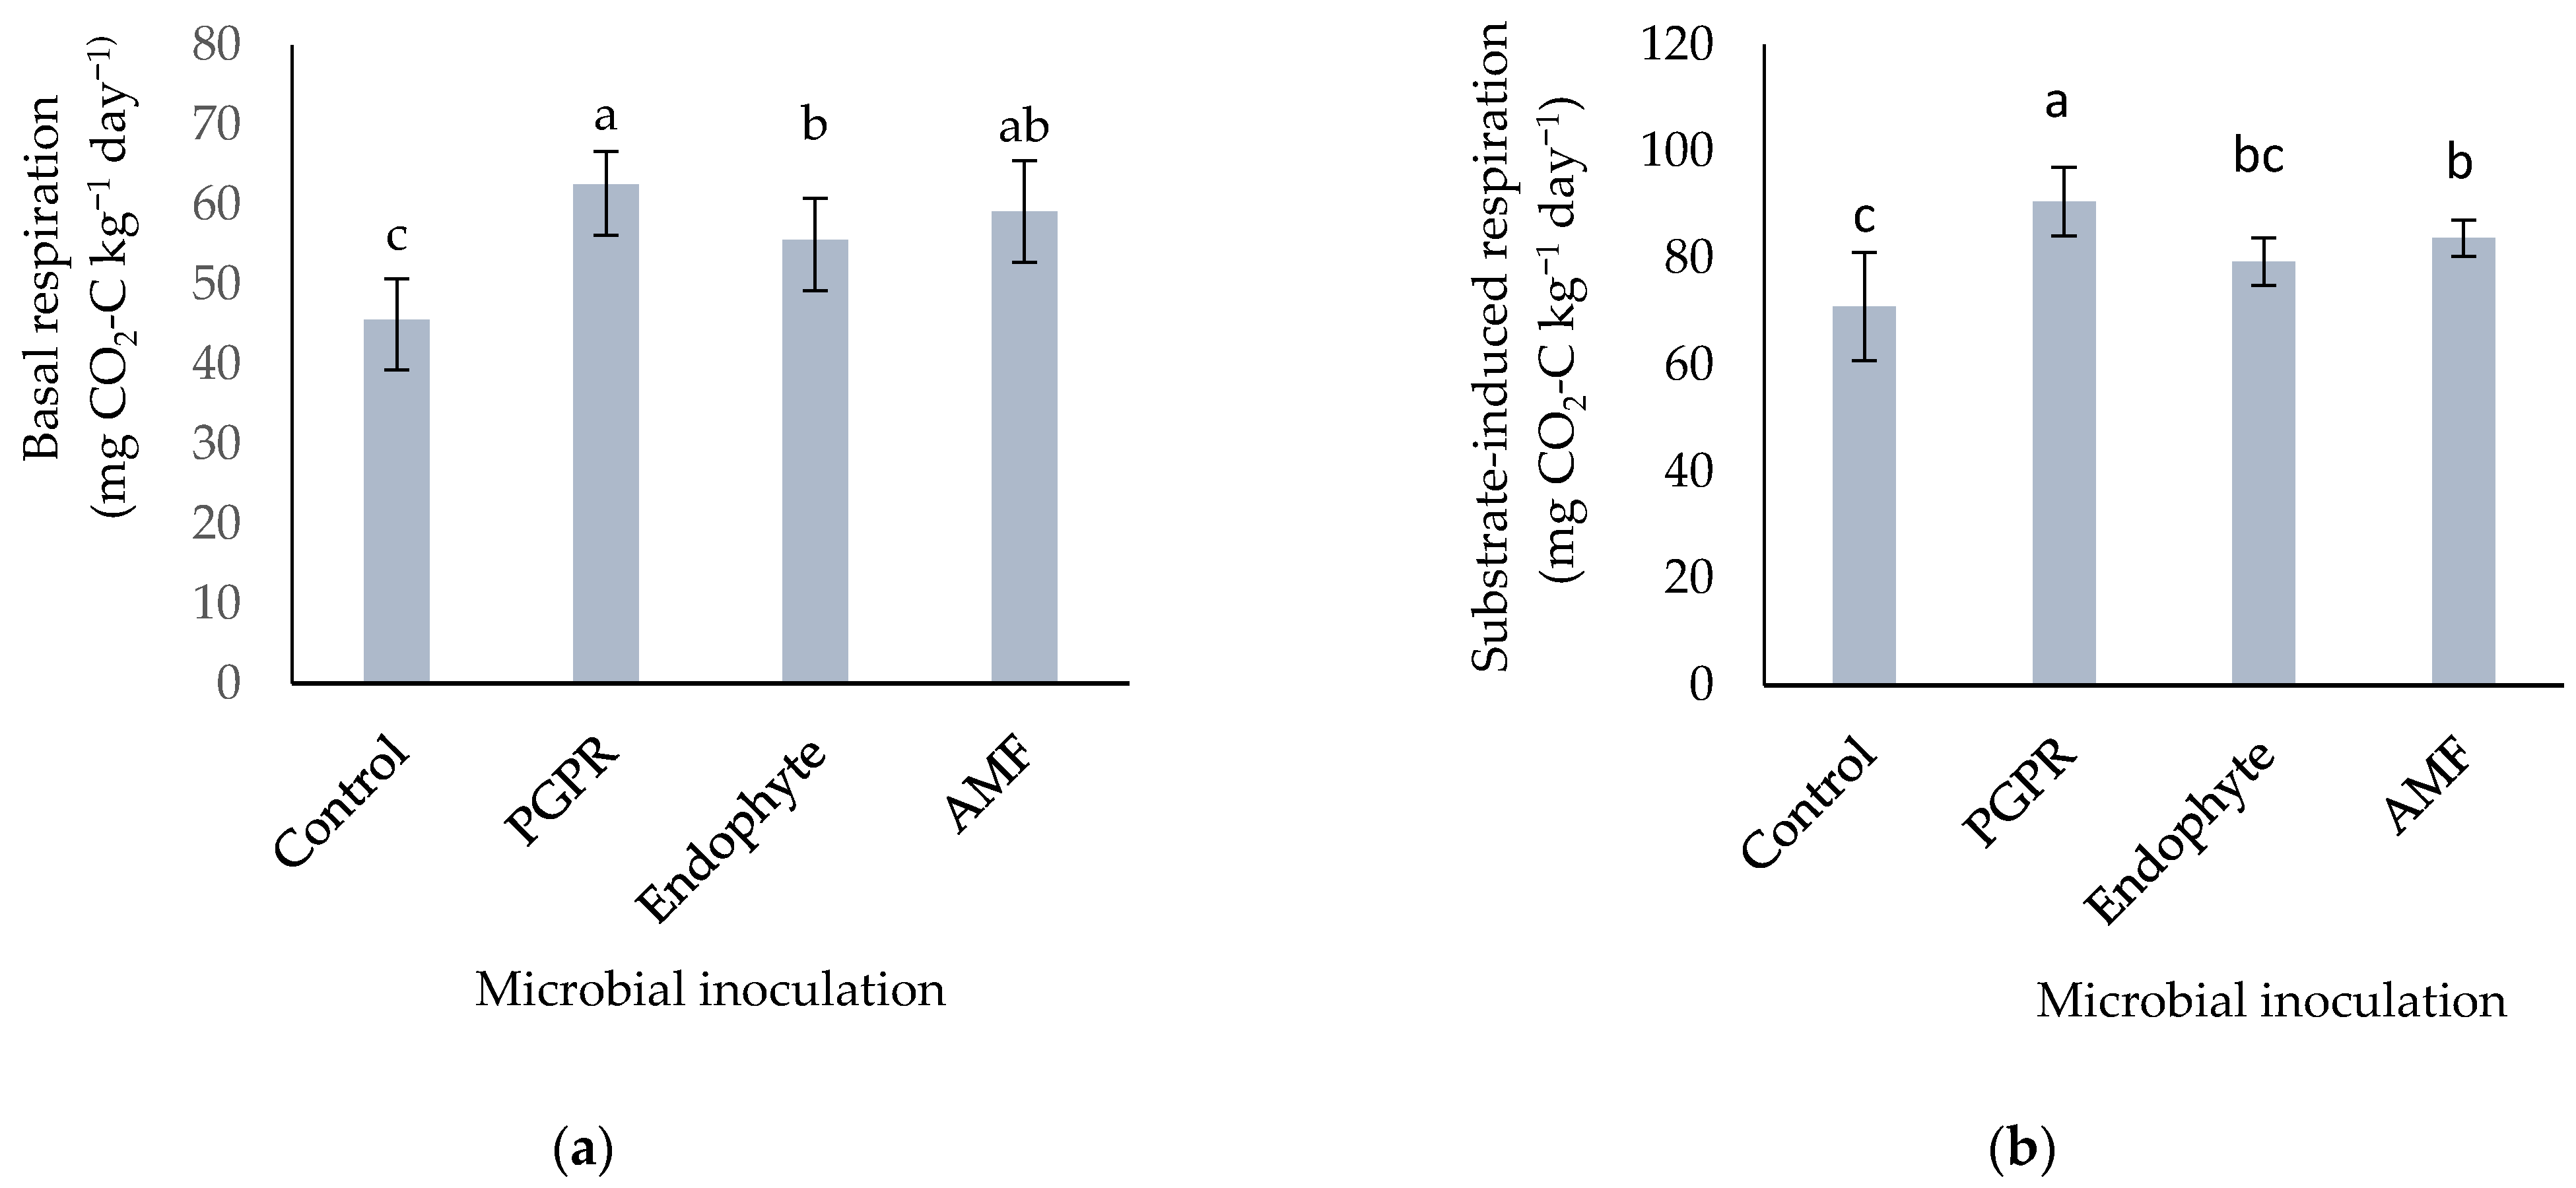
3.2.1. Basal and Substrate-Induced Respiration

Comparisons of means revealed that basal respiration was highest under the non-saline treatment (66.85 mg CO2-C kg−1 day−1) and lowest under the 14 dS m−1 treatment (46.93 mg CO2-C kg−1 day−1; see Figure 2a).
When comparing the microbial inoculation treatments, the basal respiration was highest after bacterial inoculation (62.57 mg CO2-C kg−1 day−1) and lowest under the control conditions using rhizosphere soil (45.62 mg CO2-C kg−1 day−1; Figure 3a).
As with basal respiration, the highest level of substrate-induced respiration without microbial inoculation was observed under non-saline control conditions (92.15 mg CO2-C kg−1 day−1), while the lowest level was observed under the most saline conditions (14 dS m−1; 71.01 mg CO2-C kg−1 day−1) (Figure 2b). When comparing microbial inoculation treatments under non-saline conditions (see Figure 3b), the highest and lowest levels of substrate-induced respiration were obtained after inoculation with PGPRs (90.60 mg CO2-C kg−1 day−1) and under control conditions without inoculation (70.88 mg CO2-C kg−1 day−1), respectively. The respiration reflects the activity of the soil microbial population; higher levels of respiration indicate a more optimal soil microbial population status. Increasing salinity stress reduced the number of soil microbes and their activity. Under these conditions, inoculation with the chosen bacterial isolates alleviated the impacts of salinity stress on the soil and also increased the respiration rate and CO2 production by increasing the soil’s microbial population and activity of microorganisms and improving soil conditions [60]. Sardinha et al. [61] reported a similar decline in soil respiration from 41.7 to 16.3 C (μg g−1) soil upon increasing soil salinity from 2.2 to 13.2 NaCl (mg g−1) soil.

3.2.2. Microbial Biomass Carbon

Increased salinity reduced the microbial biomass carbon, which was 1.68-fold lower under the 14 dS m−1 salinity treatment than under control conditions (Table 4). Comparison of means showed that inoculating the soil with PGPRs increased MBC 1.83-fold relative to the control. However, the increase induced by AMF did not differ significantly from that induced by PGPRs (Table 5). Microbial biomass carbon is a quantity that reflects the number of microorganisms (especially bacteria) in a sample; it represents the amount of carbon stabilized in microbial cells [61]. Overall, as salinity and alkalinity increase, the soil’s microbial population declines, which impairs metabolic efficiency. The adverse impact of salinity is also partly due to the inability of some microorganisms to assimilate carbon under saline conditions and the loss of root exudates. Hence, a conclusion then it can be stated that the dead cell bodies added to the rhizosphere soil can be a reason for the increase in microbial biomass following the bacterial inoculation of the rhizosphere [62]. Tripathi et al. [21] reported that the most plausible reason for the loss of plant growth in saline soils was a loss of microbial activity and microbial biomass carbon, and also reported that MBC was significantly reduced in soils with salinity levels of up to 16 dS m−1. Rietz and Haynes [6] also demonstrated a negative relationship between microbial biomass and soil salinity.

3.2.3. Metabolic Quotient and Carbon Availability

The statistical relationships presented in Table 5 show that the metabolic quotient was highest under the control, although the result obtained after endophytic inoculation did not differ significantly from the control value. The lowest quotient was observed after the PGPR and AMF inoculations. The different levels of salinity created significant differences in the availability of carbon (Table 4) and the presence of microorganisms increased carbon availability relative to that under control conditions. However, there were no significant differences in carbon availability between the bacterial, endophytic, and AMF treatments (Table 5). The metabolic quotient (qCO2) is a good measure of the effects of environmental stress, including salinity, on the population and activity of soil microbes. In practice, the basal respiration of soil per unit of microbial biomass is expressed as the metabolic quotient or qCO2 and is known to increase with increasing salinity. This is because salinity stress causes soil microorganisms to produce more CO2 per unit of microbial biomass per unit time. Rasul et al. [63] similarly reported higher metabolic quotients in saline soils. Salinity-resistant growth-promoting bacteria alleviate this effect by promoting the accumulation of adaptive organic compounds such as low-molecular weight polar organic molecules that help maintain a favorable osmotic balance and alleviate osmotic stress without restricting cellular metabolism. When the soil microbial population is exposed to salinity stress, the amount of carbon that is converted to humus exceeds that lost by respiration. In the unusual case where soil basal respiration exceeds microbial biomass carbon, the system’s energy demand increases, leading to an increase in the soil metabolic quotient. Growth in the population of soil bacteria increases the microbial biomass carbon and thus prevents an increase in the metabolic quotient [64], which is consistent with our findings. Carbon availability is a good measure of substrate limitation, especially in cultivated soils, and is reduced by salinity. This outcome is related to the reduction in plant root biomass under saline conditions: roots are the main source of carbon for heterotrophic soil micro-organisms, so reductions in root biomass and exudation limit the supply of carbon available to the soil microorganisms. Treating soil with AMF and PGP bacteria was previously reported to increase carbon availability [65].

3.2.4. Acid and Alkaline Phosphatase Enzyme

Acid and alkaline phosphatase enzyme activity was lowest under the most severe salinity treatment (14 dS m−1) and highest under the non-saline control conditions; acid and alkaline phosphatase activity under control conditions were 2.47 and 1.50 times higher, respectively, than in the 14 dS m−1 salinity treatment. Among the microbial inoculation treatments, inoculation with PGPR increased the activity of these enzymes 1.41- and 1.29-fold relative to the control, respectively. Although there were no statistically significant differences in acid phosphatase activity between endophytic and AMF inoculations, these two treatments differed significantly with respect to alkaline phosphatase enzyme activity. However, the effects of AMD and PGPR on this enzyme did not differ significantly (Table 5). In all treatments, alkaline phosphatase activity exceeded that of acid phosphatases. The rate of synthesis and release of phosphatase enzymes also depends on the soil pH; the stability and activity of alkaline phosphatase both increase with increasing pH. As the salinity increased, the activity of both enzymes decreased; this may be related to structural and compositional changes in the plant rhizosphere microorganism populations. Similar results were reported by Sardinha et al. [61] and Rietz and Haynes [21], who found that the activity of most soil enzymes is reduced by salinity stress. The increased activity of soil phosphatase enzymes in the bacterial inoculation treatments can be ascribed to the increase in microbial biomass, root exudation, and soil nutrients, and the resulting improvement in the soil’s physical, chemical, and biological properties. In this work, a positive and direct relationship was detected between the activity of the phosphatase enzyme and microbial biomass carbon. As was also observed when investigating the combined effects of salinity and microbial inoculation, the highest microbial biomass and alkaline phosphatase activity were associated with the PGPR inoculation treatment.

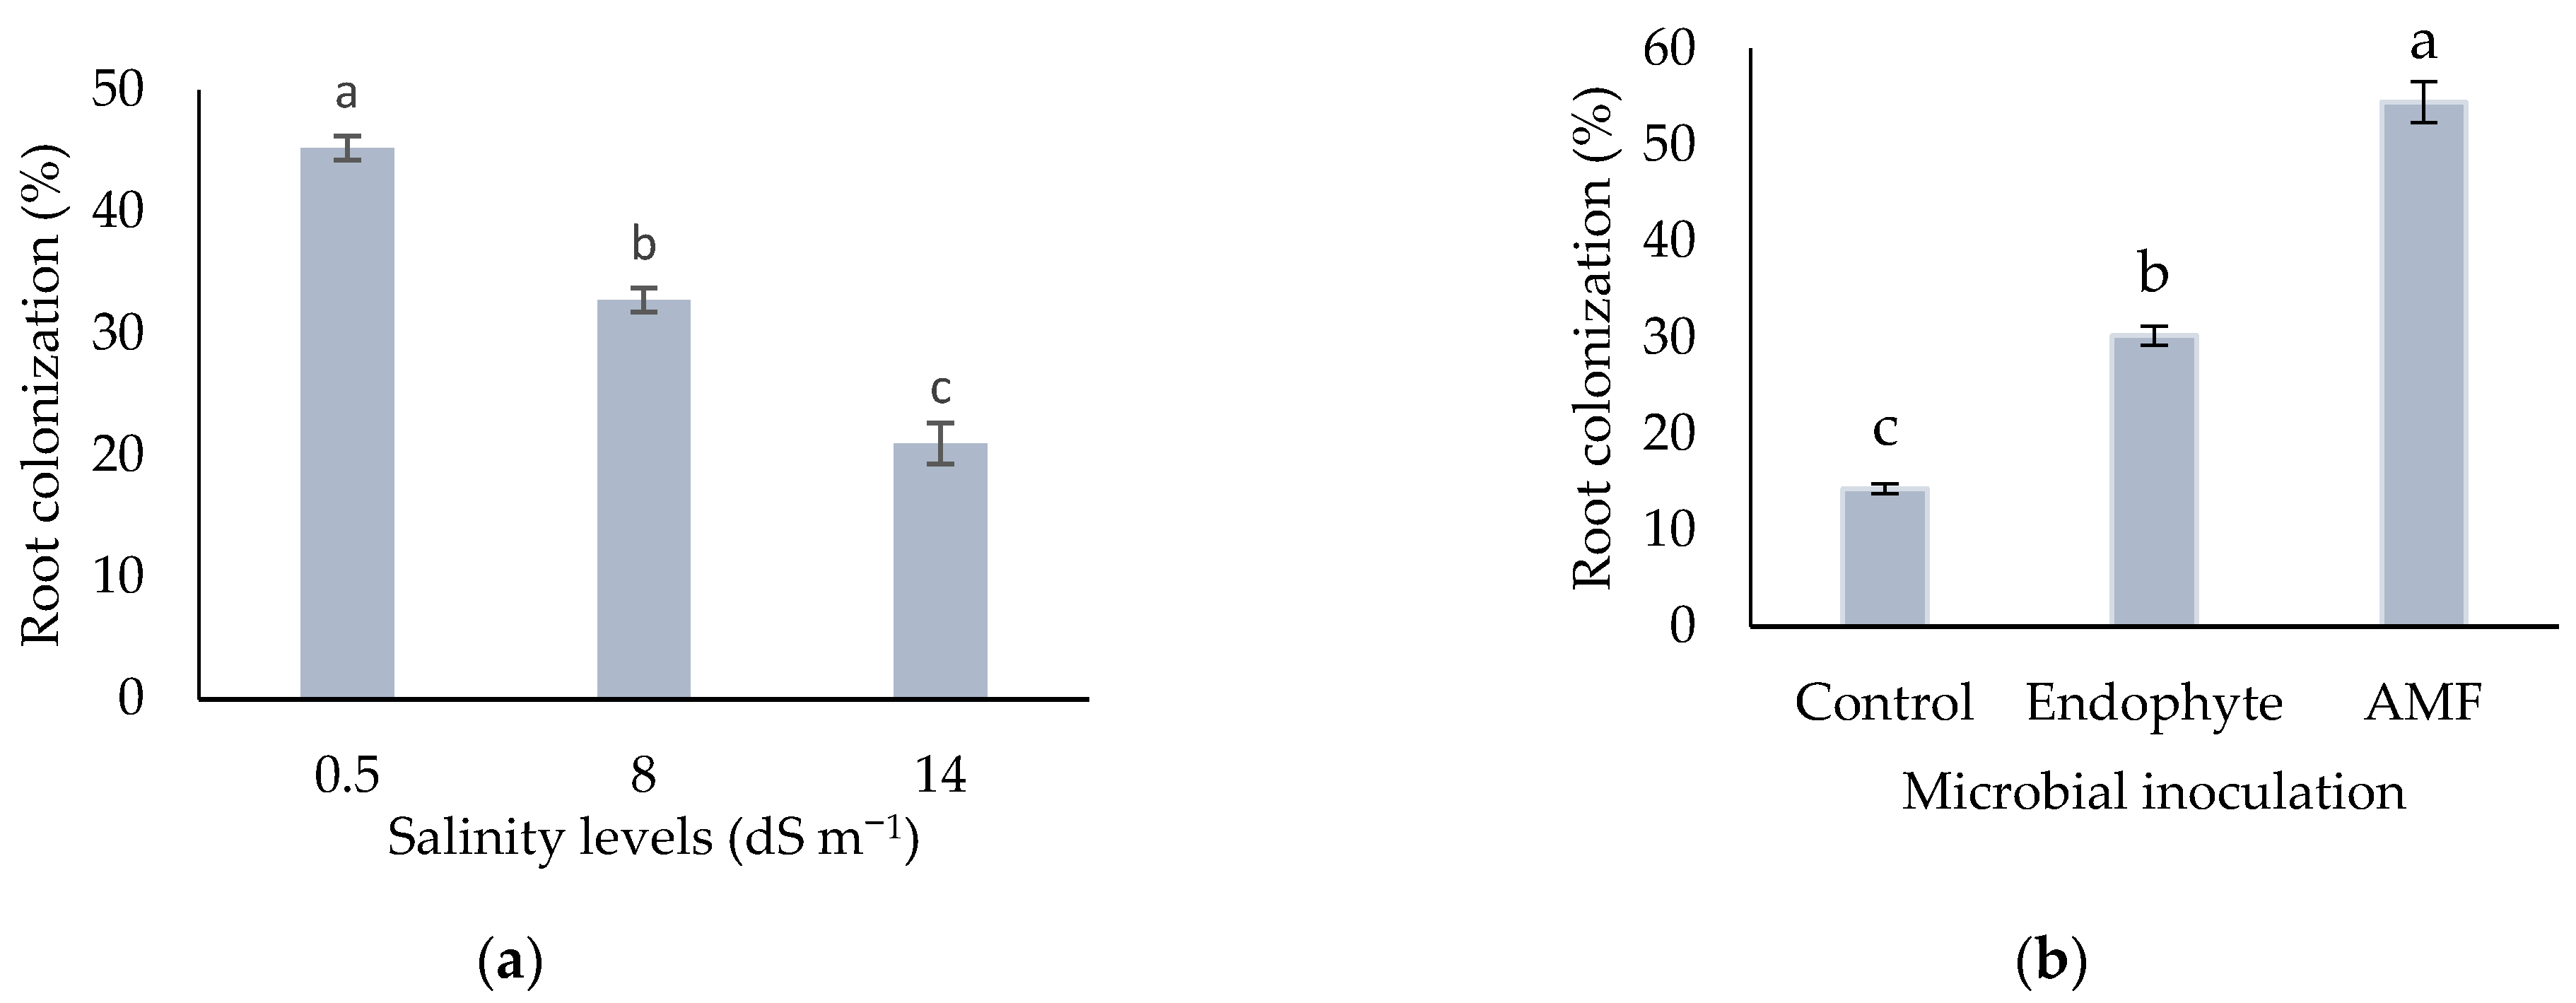
3.2.5. Root Colonization Percentage

The highest and lowest root colonization percentages (45% and 12%) were observed at salinity levels of 0 and 14 dS m−1, respectively (Figure 4a). Among the microbial treatments, AMF yielded the highest root colonization percentage (54.44%), while root colonization was lowest under control conditions (14.33%; Figure 4b). Salinity disrupts root colonization by causing spore stress and suppressing hyphal growth. This decline may be related to the negative effect of salinity on photosynthesis, which would reduce the carbon supply to the fungus, as well as to the inhibitory effect of Na and Cl on the growth of fungal hyphae. Salinity may also impair the fungus plant symbiosis. Marulanda et al. [66] studied the effects of treating lavender with mycorrhiza and found that Glomus intraradices established 35% symbiosis with this plant. These reports show that the decline in mycorrhizal symbiosis in salinity-stressed roots is probably related to the decline in spore germination, hyphal growth, and arbuscular formation [67].

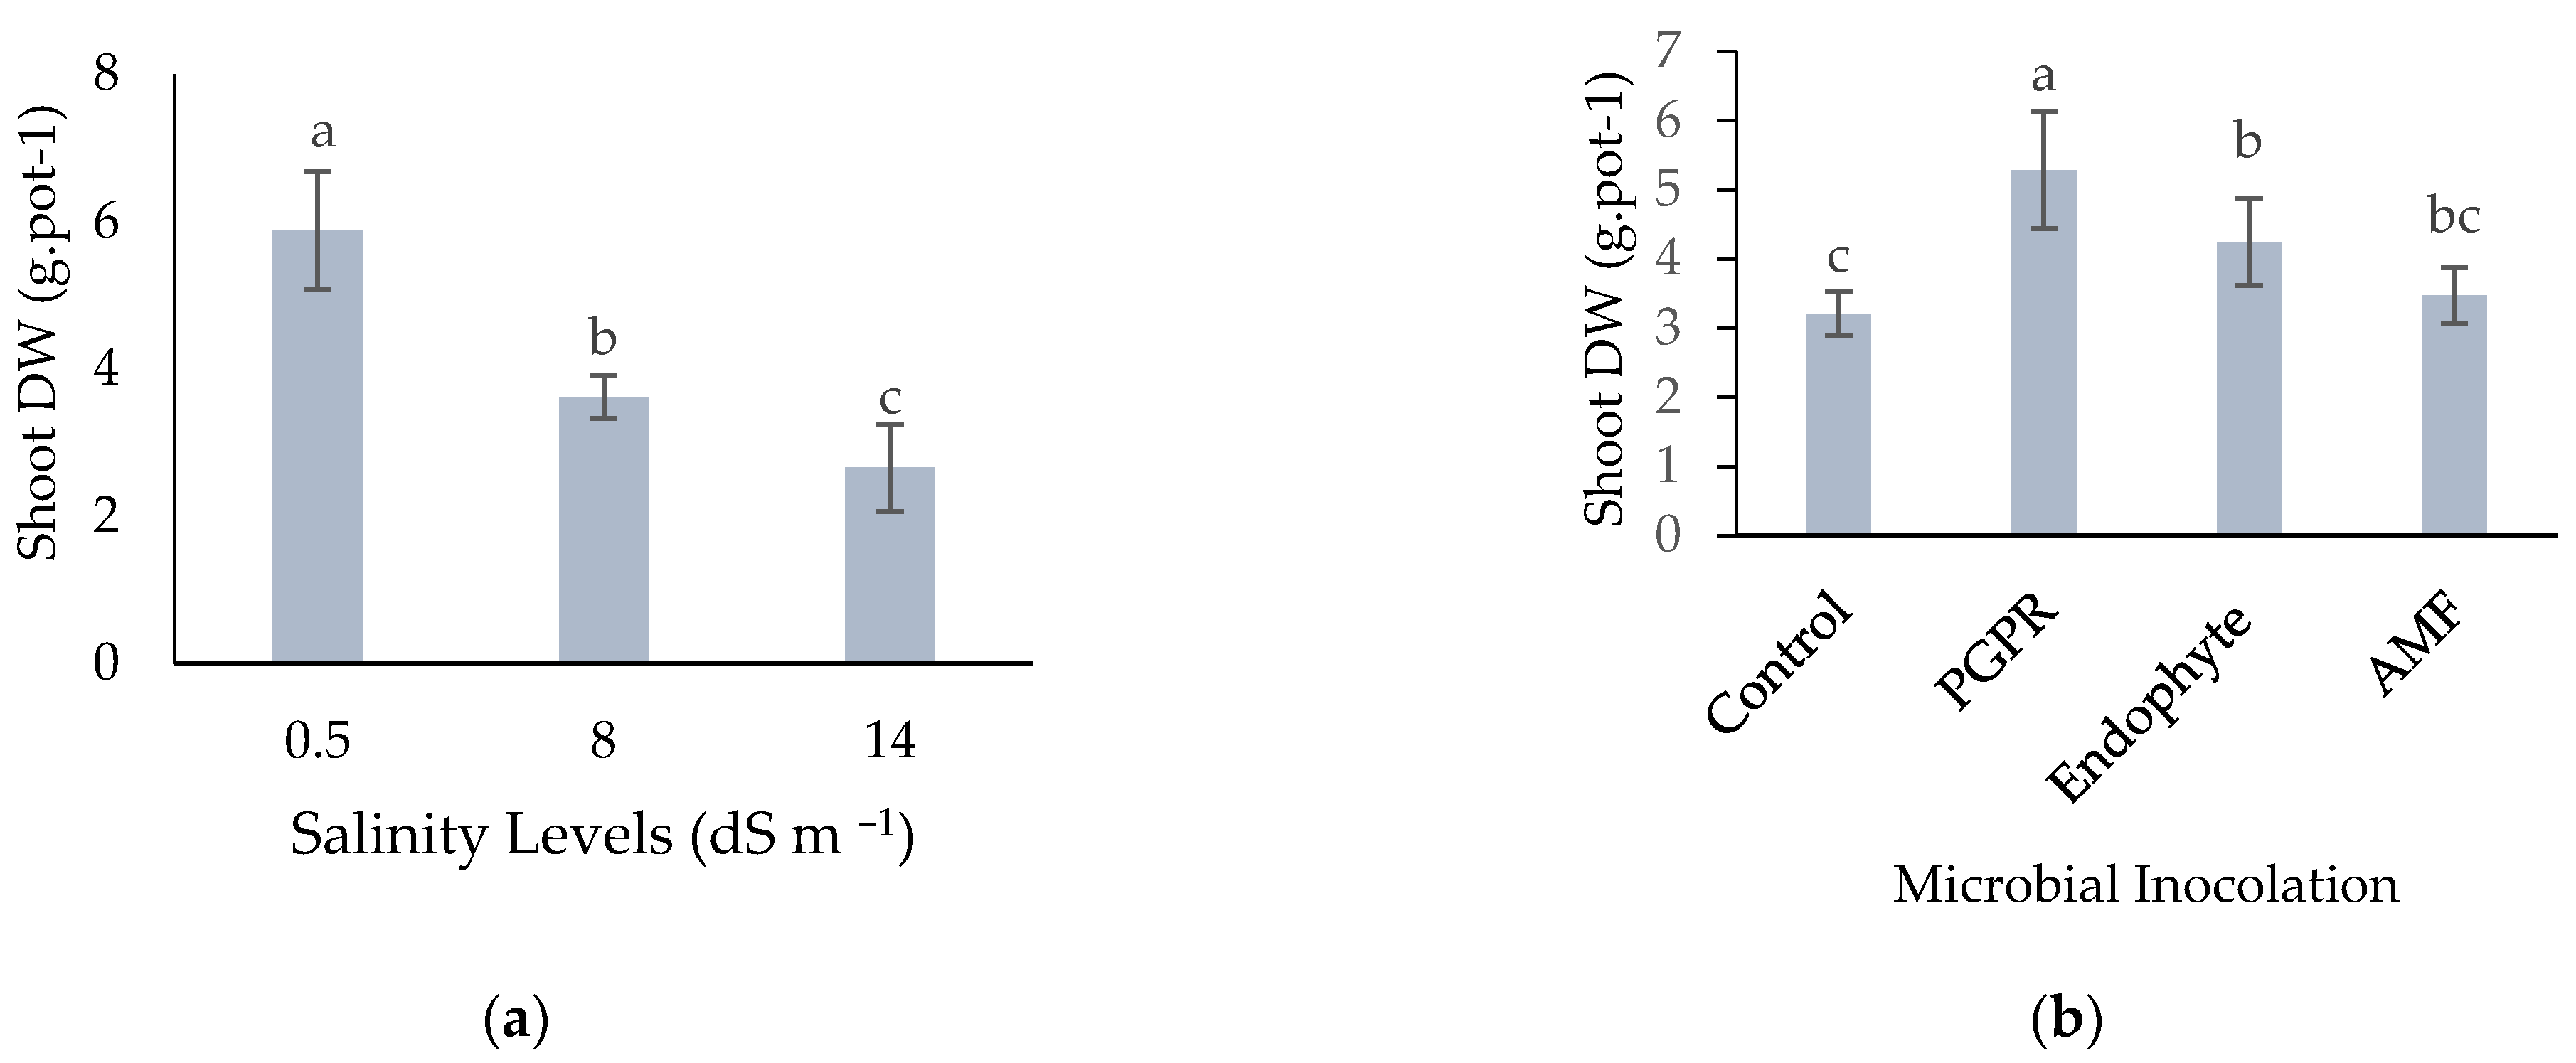
3.2.6. Shoot Dry Weight

The highest (5.87 g) and the lowest (2.66 g) shoot dry weights were obtained in the first and third salinity treatments, respectively (Figure 5a). Among the microbial inoculation treatments, the highest (5.28 g) and the lowest (3.20 g) shoot weights were observed under the bacterial and control inoculation treatments, respectively (Figure 5b). In general, dry weight decreased with increasing salinity under all treatments, which can be attributed to changes in the transfer of photosynthetic products to the roots, reductions in the relative water content of leaves, partial or total closure of stomata, and ionic imbalances leading to sodium ion accumulation [68]. The positive effects of PGPR are driven by several mechanisms, including the production of growth-promoting metabolites such as siderophore production, increasing the production of growth-promoting metabolites such as gibberellins, cytokinins, and auxin; increase available phosphorus; and perhaps the ability expression of ACC-deaminases, all of which help to significantly increase shoot dry weight under saline conditions [69,70]. Piriformospora indica probably also increased plant biomass by increasing the relative water content of the leaves by supporting the accumulation of organic osmolytes, leading to an increase in the leaves’ chlorophyll content [71]. The increased shoot dry mass in the presence of mycorrhizal fungi has also been attributed to increased absorption of elements and improved water uptake [72].

4. Conclusions

Salinity stress reduced plant growth and various soil microbial indices, including basal respiration, substrate-induced respiration, microbial biomass carbon, carbon availability, and acid and alkaline phosphatase activity. However, our results show that inoculation with PGPRs, AMFs, and endophytic fungi can induce significant improvements in all of these indices under saline conditions, reducing the severity of salinity stress in plants when compared to non-inoculated controls. The strongest beneficial effects in this respect were induced by inoculation with PGPRs, suggesting that such inoculation may be an effective and inexpensive way of alleviating the detrimental impacts of salinity stress. Inoculation with microorganisms may also increase plants’ root secretions, which would stimulate the growth of rhizosphere microorganisms, leading to further improvements in soil microbial indices and ultimately in plant nutrition. Treatment with microorganisms, and especially native PGPR, thus has positive effects on soil microbial indices that can strengthen plant growth under challenging saline conditions.

Author Contributions

Conceptualization, M.B., R.R.V. and M.H.R.-S.; formal analysis, Z.R. and M.B.; software, Z.R., M.K. and M.B.; methodology, Z.R., M.B., M.H.R.-S. and M.K.; investigation, Z.R.; validation, M.H.R.-S., M.B. and M.K.; data curation, M.H.R.-S., M.K. and M.B.; writing—original draft preparation, Z.R., M.B. and M.K.; writing—review and editing, R.R.V. and S.K. All authors have read and agreed to the published version of the manuscript.

Funding

We gratefully acknowledge support from the Department of Soil Science, Urmia University and NKJ-SNS—Dialogue Biocontrol network (NKJ-SNS 06). RV was supported by the Swedish Research Council for Environment, Agricultural Sciences and Spatial Planning (FORMAS) (grant number 2019-01316) and the Swedish Research Council (grant number 2019-04270).

Institutional Review Board Statement

Not applicable.

Informed Consent Statement

Not applicable.

Data Availability Statement

The data presented in this study are available on request from the corresponding author.

Acknowledgments

We gratefully thank Macrogen Corporation, South Korea, where the sequencing of PCR products was performed. We also acknowledge the support from the Department of Soil Science, Urmia University. RV was supported by FORMAS and The Swedish Research Council (grants 2019-01316, 2019-04270).

Conflicts of Interest

The authors declare that they have no conflict of interest.

References

  1. Al-Karaki, G.N. Nursery inoculation of tomato with arbuscular mycorrhizal fungi and subsequent performance under irrigation with saline water. Sci. Hortic. 2006, 109, 1–7. [Google Scholar] [CrossRef]
  2. Barin, M.; Aliasgharzad, N.; Olsson, P.A.; Sadeghiani, M.H.R.; Moghddam, M. The abundance of arbuscular mycorrhizal fungi in relation to soil salinity around Lake Urmia in northern Iran. Pedobiologia 2013, 56, 225–232. [Google Scholar] [CrossRef]
  3. Esmaili, E.; Kapourchal, S.A.; Malakouti, M.J.; Homaee, M. Interactive effect of salinity and two nitrogen fertilizers on growth and composition of sorghum. Plant Soil Environ. 2008, 54, 537–546. [Google Scholar] [CrossRef] [Green Version]
  4. Barin, M.; Aliasgharzad, N.; Olsson, P.A.; Rasouli-Sadaghiani, M.H. Salinity-induced differences in soil microbial communities around the hypersaline Lake Urmia. Soil Res. 2015, 53, 494–504. [Google Scholar] [CrossRef]
  5. Hammer, E.C.; Nasr, H.; Pallon, J.; Olsson, P.A.; Wallander, H. Elemental composition of arbuscular mycorrhizal fungi at high salinity. Mycorrhiza 2011, 21, 117–129. [Google Scholar] [CrossRef] [PubMed]
  6. Rietz, D.N.; Haynes, R.J. Effects of irrigation-induced salinity and sodicity on soil microbial activity. Soil Biol. Biochem. 2003, 35, 845–854. [Google Scholar] [CrossRef]
  7. Yang, R.; Qin, Z.; Wang, J.; Xu, S.; Zhao, W.; Zhang, X.; Huang, Z. Salinity changes root occupancy by arbuscular mycorrhizal fungal species. Pedobiologia 2020, 81, 150665. [Google Scholar] [CrossRef]
  8. Wyszkowska, J.; Borowik, A.; Kucharski, M.; Kucharski, J. Applicability of biochemical indices to quality assessmnet of soil pulluted with heavy metals. J. Elem. 2013, 18, 723–732. [Google Scholar]
  9. Brendecke, J.W.; Axelson, R.D.; Ian, L.; Pepper, I.L. Soil microbial activity as an indicator of soil fertility—Long term effects of municipal sewage-sludge on an arid soil. Soil Biol. Biochem. 1993, 25, 751–758. [Google Scholar] [CrossRef]
  10. Zarei, M.J.; Hajinia, S.; Karimi, N.; Goltapeh, E.M.; Rejali, F.; Varma, A. Effect of Piriformospora indica and Azospirillum strains from saline or non-saline soil on mitigation of the effects of NaCl. Soil Biol. Biochem. 2012, 45, 139–146. [Google Scholar] [CrossRef]
  11. Stefanoski, D.C.; Figueiredo, C.C.D.; Santos, G.G.; Marchão, R.L. Selecting soil quality indicators for different soil management systems in the Brazilian Cerrado. Pesqui. Agropecu. Bras. 2016, 51, 1643–1651. [Google Scholar] [CrossRef] [Green Version]
  12. Paz-Ferreiro, J.; Fu, S. Biological Indices for Soil Quality Evaluation: Perspectives and Limitations. Land Degrad. Dev. 2013, 27, 14–25. [Google Scholar] [CrossRef]
  13. MomoWobeng, N.B.; Banfield, C.C.; Megueni, C.; MarieMapongmetsem, P.; Dippold, M.A. Impact of legumes on soil microbial activity and C cycle functions in two contrasting Cameroonian agroecological zones. Pedobiologia 2020, 81, 150662. [Google Scholar]
  14. Bradford, M.A.; McCulley, R.L.; Crowther, T.W.; Oldfield, E.E.; Wood, S.A.; Fierer, N. Cross-biome patterns in soil microbial respiration predictable from evolutionary theory on thermal adaptation. Nat. Ecol. Evol. 2019, 3, 223–231. [Google Scholar] [CrossRef]
  15. Luo, Y.; Zhou, X. Soil Respiration and the Environment; Academic Press: San Diego, CA, USA, 2006; p. 328. [Google Scholar]
  16. Lin, Y.J.; Gao, F.; Zhang, J.L.; Zhou, L.Y.; Zhang, X.M.; Li, B.L.; Zhao, H.J.; Li, X.D. Soil microbial biomass and respiration rate under effects of different planting patterns of peanut. Ying Yong Sheng Tai Xue Bao 2010, 21, 2323–2328. [Google Scholar]
  17. Gil-Sotres, F.; Trasar-Cepeda, C.; Leiros, M.C.; Seoane, S. Different approaches to evaluating soil quality using biochemical properties. Soil Biol. Biochem. 2005, 37, 877–887. [Google Scholar] [CrossRef]
  18. Bertini, S.C.B.; Azevedo, L.C.B.; de Carvalho Mendes, I.; Cardoso, E.J.B.N. Hierarchical partitioning for selection of microbial and chemical indicators of soil quality. Pedobiologia 2014, 57, 293–301. [Google Scholar] [CrossRef]
  19. Rao, D.L.N.; Pathak, H. Ameliorative influence of organic matter on biological activity of salt-affected soils. Arid. Land Res. Manag. 1996, 10, 311–319. [Google Scholar] [CrossRef]
  20. Batra, L.; Manna, M.C. Dehydrogenase activity and microbial biomass carbon in salt-affected soils of semiarid and arid regions. Arid. Land Res. Manag. 1997, 11, 295–303. [Google Scholar] [CrossRef]
  21. Tripathi, S.; Kumari, S.; Chakraborty, A.; Gupta, A.; Chakrabarti, K.; Bandyapadhyay, B.K. Microbial biomass and its activities in salt-affected coastal soils. Biol. Fertil. Soils 2006, 42, 273–277. [Google Scholar] [CrossRef]
  22. Wong, V.N.; Dalal, R.C.; Greene, R.S. Salinity and sodicity effects on respiration and microbial biomass of soil. Biol. Fertil. Soils 2008, 44, 943–953. [Google Scholar] [CrossRef]
  23. Yan, N.; Marschner, P. Response of soil respiration and microbial biomass to changing EC in saline soils. Soil Biol. Biochem. 2013, 65, 322–328. [Google Scholar] [CrossRef]
  24. Sieber, T.N. Endophytic fungi in forest trees: Are they mutualists? Fungal Biol. Rev. 2007, 21, 75–89. [Google Scholar] [CrossRef]
  25. Kaur, G.; Reddy, M.S. Role of phosphate-solubilizing bacteria in improving the soil fertility and crop productivity in organic farming. Arch. Agron. Soil Sci. 2014, 60, 549–564. [Google Scholar] [CrossRef]
  26. Schaad, N.W.; Jones, J.B.; Chun, W. Laboratory Guide for the Identification of Plant Pathogenic Bacteria, 3rd ed.; American Phytopathological Society, APS Press: Saint Paul, MN, USA, 2001. [Google Scholar]
  27. Diep, C.N.; Hieu, T.N. Phosphate and potassium solubilizing bacteria from weathered materials of denatured rock mountain, Ha Tien, Kiên Giang province, Vietnam. Am. J. Life Sci. 2013, 1, 88–89. [Google Scholar] [CrossRef]
  28. Nautiyal, C.S. An efficient microbiological growth medium for screening phosphate solubilizing microorganisms. FEMS Microbiol. Lett. 1999, 170, 265–270. [Google Scholar] [CrossRef] [PubMed]
  29. Tallapragada, P.; Seshachala, U. Phosphate-solubilizing microbes and their occurrence in the rhizospheres of Piper betel in Karnataka, India. Turk. J. Biol. 2012, 36, 25–35. [Google Scholar]
  30. Cotteni, A. Soil and Plant Testing as a Basis of Fertilizer Recommendations; Food and Agriculture Organization of the United Nations: Rome, Italy, 1980; pp. 64–100. [Google Scholar]
  31. Hu, X.F.; Chen, J.; Guo, J.F. Two phosphate and potassium solubilizing bacteria isolated from Tiannu Mountain, Zhejiang, China. World J. Microbiol. Biotechnol. 2006, 22, 983–990. [Google Scholar] [CrossRef]
  32. Bent, E.; Tuzan, S.; Chanway, C.P.; Enebak, S. Alteration in plant growth and in root hormone levels of lodgepole pines inoculated with rhizobacteria. Can. J. Microbiol. 2001, 47, 793–800. [Google Scholar] [CrossRef] [PubMed]
  33. Alexander, D.B.; Zuberer, D.A. Use of chrome azurol S reagents to evaluate siderophore production by rhizosphere bacteria. Biol. Fertil. Soils 1991, 12, 39–45. [Google Scholar] [CrossRef]
  34. Nakbanpote, W.; Panitlurtumpai, N.; Sangdee, A.; Sakulpone, N.; Sirisom, P.; Pimthong, A. Salt-tolerant and plant growth-promoting bacteria isolated from Zn/Cd contaminated soil: Identification and effect on rice under saline conditions. J. Plant Interact. 2014, 9, 379–387. [Google Scholar] [CrossRef] [Green Version]
  35. Llop, P.; Caruso, P.; Cubero, J.; Morente, C.; López, M.M. A simple extraction procedure for efficient routine detection of pathogenic bacteria in plant material by polymerase chain reaction. J Microbiol. Methods 1999, 37, 23–31. [Google Scholar] [CrossRef]
  36. Weisburg, W.G.; Barns, S.M.; Pelletier, D.A.; Lane, D.J. 16S ribosomal DNA amplification for phylogenetic study. J. Bacteriol. 1991, 173, 697–703. [Google Scholar] [CrossRef] [Green Version]
  37. Suzuki, T.; Yamasato, K. Phylogeny of spore-forming lactic acid bacteria based on 16S rRNA gene sequences. FEMS Microbiol. Lett. 1994, 115, 13–17. [Google Scholar] [CrossRef] [PubMed]
  38. Saitou, N.; Nei, M. The neighbor-joining method: A new method for reconstructing phylogenetic trees. Mol. Biol. Evol. 1987, 4, 406–425. [Google Scholar] [PubMed]
  39. Kimura, M. A simple method for estimating evolutionary rates of base substitutions through comparative studies of nucleotide sequences. J. Mol. Evol. 1980, 16, 111–120. [Google Scholar] [CrossRef] [PubMed]
  40. Felsenstein, J. Confidence limits on phylogenies: An approach using the bootstrap. Evolution 1985, 39, 783–791. [Google Scholar] [CrossRef]
  41. Tamura, K.; Stecher, G.; Peterson, D.; Filipski, A.; Kumar, S. MEGA6: Molecular evolutionary genetics analysis version 6.0. Mol. Biol. Evol. 2013, 30, 2725–2729. [Google Scholar] [CrossRef] [Green Version]
  42. Sparks, D.L.; Page, A.L.; Helmke, P.A.; Loeppert, R.H. (Eds.) Methods of Soil Analysis, Part 3: Chemical Methods; John Wiley and Sons: Hoboken, NJ, USA, 2020; Volume 14. [Google Scholar]
  43. Hajiboland, R.; Aliasgharzadeh, N.; Farsad Laiegh, S.H.; Poschenieder, C.H. Colonization with arbuscular mycorrhizal fungi improves salinity tolerance of tomato (Solanum lycopersicum L.) plants. Plant Soil 2010, 331, 313–327. [Google Scholar] [CrossRef]
  44. Anderson, J.P.E.; Page, A.L.; Miller, R.H.; Keeney, D.R. (Eds.) Soil Respiration. In Methods of Soil Analysis: Microbiological and Chemical Properties, Part 2, 2nd ed.; SSSA: Madison, WI, USA, 1982; pp. 831–872. [Google Scholar]
  45. Nakamoto, T.; Wakahara, S. Development of substrate induced respiration (SIR) method combined with selective inhibition for estimating fungal and bacterial biomass in humic andosols. Plant Prod. Sci. 2004, 7, 70–76. [Google Scholar] [CrossRef]
  46. Tabatabai, M.A.; Bremner, J.M. Use of p-nitrophenyl phosphate for assay of soil phosphatase activity. Soil Biol. Biochem. 1969, 1, 301–307. [Google Scholar] [CrossRef]
  47. Jenkinson, D.S.; Ladd, J.N. Microbial biomass in soil measurement and turnover. Soil Biochem. 1981, 5, 415–471. [Google Scholar]
  48. Vance, E.D.; Brookes, P.C.; Jenkinson, D.S. An extraction method for measuring soil microbial biomass C. Soil Biol. Biochem. 1987, 19, 703–707. [Google Scholar] [CrossRef]
  49. Martens, R. Methoden zur Quantitative Bestimmung und Charakterisierung der Mikrobiellen Biomasse in Böden. Eigenverlag des Institutes für Bodenbiologie der FAL Braunschweig 1991. Available online: https://www.openagrar.de/receive/timport_mods_00005888 (accessed on 7 October 2021).
  50. Liu, H.; Lv, W.; Wang, S.; Luo, C.; Zhang, Z.; Wang, Z.; Jiang, L.; Cui, X. Decreased soil substrate availability with incubation time weakens the response of microbial respiration to high temperature in an alpine meadow on the Tibetan Plateau. J. Soils Sediments 2019, 19, 255–262. [Google Scholar] [CrossRef]
  51. Phillips, J.M.; Hayman, D.S. Improved procedures for clearing roots and staining parasitic and vesicular-arbuscular mycorrhizal fungi for rapid assessment of infection. Trans. Brit. Mycol. Soc. 1970, 55, 158–161. [Google Scholar] [CrossRef]
  52. Moira, E.K.; Henderson, M.E.K.; Duff, R.B. The release of metallic and silicates ions from minerals, rocks and soils by fungal activity. J. Soil Sci. 1963, 14, 237–245. [Google Scholar]
  53. Barin, M.; Sadeghi, S.; Rasouli-Sadaghiani, M.H.; Sepehr, E.; Dovlti, B.; Vahedi, R. Influence of K-solubilizing fungi on potassium release from silicate minerals and some growth indexes on corn (Zea mays L.). Appl. Soil Res. 2018, 3, 29–41. [Google Scholar]
  54. Hashemnejad, F.; Barin, M.; Khezri, M.; Ghoosta, Y.; Hammer, E.C. Isolation and identification of insoluble zinc-solubilising bacteria and evaluation of their ability to solubilise various zinc minerals. J. Soil Sci. Plant Nutr. 2021, 21, 1–9. [Google Scholar] [CrossRef]
  55. Wu, P.S.; Lu, C.Y.; Chang, L.Y.; Hsueh, P.R.; Lee, P.I.; Chen, J.M.; Lee, C.Y.; Chan, P.C.; Chang, P.Y.; Yang, T.T.; et al. Stenotrophomonas maltophilia bacteremia in pediatric patients—A 10-year analysis. J. Microbiol. Immunol. Infect. 2006, 39, 144–149. [Google Scholar]
  56. Deredjian, A.; Alliot, N.; Blanchard, L.; Brothier, E.; Anane, M.; Cambier, P.; Jolivet, C.; Khelil, M.N.; Nazaret, S.; Saby, N.; et al. Occurrence of Stenotrophomonas maltophilia in agricultural soils and antibiotic resistance properties. Res. Microbiol. 2016, 167, 313–324. [Google Scholar] [CrossRef]
  57. Messiha, N.A.S.; van Diepeningen, A.D.; Farag, N.S.; Abdallah, S.A.; Janse, J.D.; van Bruggen, A.H.C. Stenotrophomonas maltophilia: A new potential biocontrol agent of Ralstonia solanacearum, causal agent of potato brown rot. Eur. J. Plant Pathol. 2007, 118, 211–225. [Google Scholar] [CrossRef] [Green Version]
  58. Sitaraman, R. Pseudomonas spp. as models for plant-microbe interactions. Front. Plant Sci. 2015, 6, 787. [Google Scholar] [CrossRef] [Green Version]
  59. Taurian, T.; Anzuay, M.S.; Angelini, J.G.; Tonelli, M.L.; Ludueña, L.; Pena, D.; Ibáñez, F.; Fabra, A. Phosphate-solubilizing peanut associated bacteria: Screening for plant growth-promoting activities. Plant Soil 2010, 329, 421–431. [Google Scholar] [CrossRef]
  60. Ali, S.; Charles, T.C.; Glick, B.R. Amelioration of high salinity stress damage by plant growth-promoting bacterial endophytes that contain ACC deaminase. Plant Physiol. Biochem. 2014, 80, 160–167. [Google Scholar] [CrossRef] [PubMed]
  61. Sardinha, M.; Müller, T.; Schmeisky, H.; Joergensen, R.G. Microbial performance in soils along a salinity gradient under acidic conditions. Appl. Soil Ecol. 2003, 23, 237–244. [Google Scholar] [CrossRef]
  62. Aghababaei, F.; Raiesi, F.; Hosseinpur, A. The combined effects of earthworms and arbuscular mycorrhizal fungi on microbial biomass and enzyme activities in a calcareous soil spiked with cadmium. Appl. Soil Ecol. 2014, 75, 33–42. [Google Scholar] [CrossRef]
  63. Rasul, G.; Appuhn, A.; Müller, T.; Joergensen, R.G. Salinity-induced changes in the microbial use of sugarcane filter cake added to soil. Appl. Soil Ecol. 2006, 31, 1–10. [Google Scholar] [CrossRef]
  64. Anderson, T.H.; Domsch, K.H. Application of eco-physiological quotients (qCO2 and qD) on microbial biomasses from soils of different cropping histories. Soil Biol. Biochem. 1990, 22, 251–255. [Google Scholar] [CrossRef]
  65. Karimi, A.; Khodaverdiloo, H.; Rasooli Sadaghiani, M.H.; Khajavi, S. Changes of Microbial Indices of Inoculated Fungi and Bacteria at Hyoscyamus niger L. Rhizosphere at Different Levels of Soil Lead (Pb) Pollution. Iran. J. Soil Water Res. 2018, 49, 59–69. [Google Scholar]
  66. Marulanda, A.; Porcel, R.; Barea, J.M.; Azcón, R. Drought tolerance and antioxidant activities in lavender plants colonized by native drought-tolerant or drought-sensitive Glomus species. Microb. Ecol. 2007, 54, 543–552. [Google Scholar] [CrossRef]
  67. Rabie, G.H.; Almadini, A.M. Role of bioinoculants in development of salt-tolerance of Vicia faba plants under salinity stress. Afr. J. Biotechnol. 2005, 4, 210–222. [Google Scholar]
  68. Barin, M.; Aliasgharzad, N.; Samadi, A. Influence of mycorrhization on the mineral nutrition and yield of tomato under sodium chloride and salts mixture induced salinity levels. Iran. J. Soil Waters Sci. 2006, 20, 94–105. [Google Scholar]
  69. Zahir, Z.A.; Ghani, U.; Naveed, M.; Nadeem, S.M.; Asghar, H.N. Comparative effectiveness of Pseudomonas and Serratia sp. containing ACC-deaminase for improving growth and yield of wheat (Triticum aestivum L.) under salt-stressed conditions. Arch. Microbiol. 2009, 191, 415–424. [Google Scholar] [CrossRef] [PubMed]
  70. Stajkovic, O.; Delic, D.; Josic, D.; Kuzmanovic, D.; Rasulic, N.; Knezevic-Vukcevic, J. Improvement of common bean growth by co-inoculation with Rhizobium and plant growth-promoting bacteria. Rom. Biotechnol. Lett. 2011, 16, 5919–5926. [Google Scholar]
  71. Hajinia, S.; Zare, M.J.; Mohammadi Goltapeh, E.; Rajali, F. Evaluation of the usefulness of endophytic fungus Piriformospora indica and Azospirillum sp. in increasing the tolerance of wheat cultivar Sardari (Triticum aestivum) to salinity stress. J. Environ. Stresses Crop Sci. 2011, 4, 21–31. [Google Scholar]
  72. Ahmadi Geshlagi, S.; Aliasgharzad, N.; Tavassoli, A. Evaluation of nutrients uptake and yield of mycorrhizal corn under salt stress condition. Water Soil Sci. 2014, 25, 79–89. [Google Scholar]
Figure 1. Neighbor-joining phylogenetic tree of 16S rDNA partial sequences from selected ten isolates. Sequences of the compared strains were obtained from databases, and the accession numbers are in parenthesis. Bootstrap values (n = 1000 replicates) were indicated at the nodes.
Processes 09 01810 g001
Figure 2. The effect of salinity on (a) basal respiration and (b) substrate-induced respiration. Bars show means ± standard error of the mean. Means with a different letters indicate significantly different values at p < 0.05 based on Duncan’s multiple range test.
Processes 09 01810 g002
Figure 3. The effect of microbial inoculation on (a) basal respiration and (b) substrate-induced respiration. Bars show means ± standard error of the mean. Means with a different letters indicate significantly different values at p < 0.05 based on Duncan’s multiple range test.
Processes 09 01810 g003
Figure 4. The effect of (a) salinity levels and (b) microbial inoculation on root colonization. Bars show the means ± standard error of the mean. Means with a different letters indicate significantly different values at p < 0.05 based on Duncan’s multiple range test.
Processes 09 01810 g004
Figure 5. The effect of (a) salinity levels and (b) microbial inoculation on shoot dry weight. Bars show the means ± standard error of the mean. Means with a different letters indicate significantly different values at p < 0.05 based on Duncan’s multiple range test.
Processes 09 01810 g005
Table 1. Physical and chemical characteristics of soil used in the study.
Soil TexturepHEC
(dS m−1)
Calcium Carbonate Equivalence (CCE)
(%)
Organic Carbon
(%)
Available Phosphorus
(mg kg−1)
Available Potassium
(mg kg−1)
Loam-clay7.690.5019.500.507.40194
Table 2. PGPR and salinity-resistance tests of the selected isolates.
IsolateInsoluble P Solubilizing Potential
(cm)
Insoluble P Compound Solubilizing Potential in Broth Medium
(μg mL−1)
Insoluble K Solubilizing Potential
(cm)
Auxin ProductionSiderophore ProductionSalinity Tolerance
(Up to 10%)
Ur83324.044.16++
Ur673.426.293.3+++
Ur521.220.163.5++
Table 3. The phenotypic properties of the selected isolates.
IsolateGram StainingObligatory
Aerobic
Growth
MobilityOxidaseCatalaseFlorescent
Pigment
Production
Levan ProductionEndospore
Production
Gelatine
Hydrolysis
Citrate
Ur83++++++++
Ur67++++++++
Ur52++++++
Table 4. The effect of salinity levels on some qualitative indices of the studied soil.
Salinity Level
(dS m−1)
Microbial Biomass Carbon
(mg CO2-C g−1)
Acid Phosphatase Enzyme
(μg PNP g−1 h−1)
Alkaline Phosphatase Enzyme
(μg PNP g−1 h−1)
Carbon Availability
(μg PNP g−1 h−1)
0.5238.7 ± 37.28 a19.76 ± 2.16 a25.91 ± 2.19 a0.73 ± 0.038 a
8188.1 ± 38.42 b13.39 ± 1.88 b22.67 ± 2.25 b0.67 ± 0.039 b
14141.9 ± 29.49 c7.97 ± 1.9 c17.19 ± 2.01 c0.66 ± 0.026 a
Means with a similar letter in each column did not differ significantly (p < 0.05) based on Duncan’s multiple range test. PNP: para-nitrophenol. Data are presented as means ± standard error.
Table 5. The effect of microbial inoculation on qualitative indices of the soil studied.
Microbial InoculationMicrobial Biomass Carbon
(mg CO2-C g−1)
Acid Phosphatase Enzyme
(μg PNP g−1 h−1)
Alkaline Phosphatase Enzyme
(μg PNP g−1 h−1)
Metabolic Quotient
(μg PNP g−1 h−1)
Carbon Availability
(μg PNP g−1 h−1)
Control130.53 ± 34.3 c6.88 ± 1.3 c19.04 ± 2.2 b0.37 ± 0.03 a0.63 ± 0.02 b
PGPR239.06 ± 36.3 a21.17 ± 2.2 a24.64 ± 2.0 a0.27 ± 0.04 b0.70 ± 0.03 a
Endophytic177.46 ± 39.5 b11.77 ± 1.9 b20.56 ± 2.3 b0.33 ± 0.05 ab0.70 ± 0.04 a
AMF211.2 ± 30.1 a15.01± 2.5 b23.45 ± 2.1 a0.28 ± 0.03 b0.71 ± 0.06 a
Means with a similar letter(s) in each column did not differ significantly (p < 0.05) based on Duncan’s multiple range test. PNP: para-nitrophenol; PGPR: Plant growth-promoting rhizobacteria; AMF: Arbuscular mycorrhizal fungi. Data are presented as means ± standard error.
Publisher’s Note: MDPI stays neutral with regard to jurisdictional claims in published maps and institutional affiliations.

