1. Introduction
The strong noise, vibration, loss in the efficiency and the material erosion are effects associated with cavitation phenomenon in the field of turbomachinery. These undesirable effects are caused by collapsing cavitation bubbles or cavitation bubble clouds close to the material surfaces. During the final stage of the collapse, phenomena such as microjets and shock waves are formed. These effects, accompanying the bubble collapse, impact and erode the surfaces and cause the material damage and mass loss. The study of the impacts of microjets and shock waves is done on both the material and the fluid side. On the material side, the pitting tests are usually performed. Pitting tests are based on the study of micro deformations and their geometries formed during the impact loads. These tests are connected with properties of the tested material. On the fluid side, it is possible to measure directly cavitation impact loads by suitable sensors [
1]. The time scale of these impacts is in order of microseconds [
2]; thus, a high resonant frequency in the order of MHz and a resistance during the cavitation impact load are required from the sensors.
Several researchers measured cavitation impact forces by piezoelectric sensors. The high resonance frequency of these sensors is well suited to the short time duration of the cavitation phenomenon. Franc et al. [
3] measured impact loads in a high-speed cavitation tunnel with a compact commercial pressure sensor (PCB 108A02) of resonant frequency about 250 kHz. The authors showed that the used sensor was not optimal because of the limited resonance frequency. Furthermore, very aggressive flow in the cavitation tunnel damaged the sensor rapidly. Other researchers used piezoelectric polyvinylidene fluoride (PVDF) film sensors. Momma et al. [
4] developed a 110 μm thick PVDF film sensor which was mounted on a stainless-steel support. The sensor was protected on top by 70 μm thick polyamide tapes from water and cavitation damage in the cavitating jet apparatus. These protective layers can, however, influence the sensor sensitivity. The authors tested the effect of two, four and six protective layers of polyimide tapes on pulse height distribution; however, the output in all cases was indistinguishable. Soyama et al. [
5] used a 110 μm thick PVDF film sensor to measure pulses in cavitating jet apparatus. The sensor was protected by 60 μm thick polyimide tape. Wang et al. [
6] used 28 μm thick PVDF film transducer to measure impact forces due to single bubble collapses. The authors protected the sensor by a one layer of scotch tape which resulted to sensitivity 0.013 V/N. Grinspan et al. [
7] used 52 μm thick commercial PVDF film transducer (DT2-052K, TE Connectivity) protected by the cellophane tape. The sensor sensitivity was 0.116 V/N.
The utilization of the commercial sensors sets the limits in parameters and for the installation. A promising opportunity is to fabricate a PVDF sensor photolithographically from a metallized sheet of a PVDF film which implies an optionally defined size of a sensor or even a matrix of sensors. The aim of this study is to produce, test and calibrate a home-made PVDF sensor for cavitation impact load measurement and compare it with the commercial PVDF sensor (DT1-028K/L, manufactured by TE Connectivity) of the same size used by Wang et al. [
6] and Hujer et al. [
8]. The influence of a protective layer’s thickness on the home-made PVDF sensor sensitivity is also evaluated.
The numerical simulations based on FEM (Finite Elemens Method) techniques are, in recent years, used to supplement the experiments and to get deeper insight into the physics of the tested phenomena, and also to obtain results which are not accessible from the experiment [
9,
10].
2. Fabrication of PVDF Sensors
The sketch of a home-made PVDF sensor composition with basic dimensions is illustrated in the
Figure 1. The sensor was made from a multi-purpose, both side metallized piezo PVDF sheet (TE Connectivity, part number 1-1003702-7). The piezo film thickness was 28 μm with 800 Å of Cu-Ni metallization, consisting of a 700 Å copper layer and a 100 Å nickel layer.
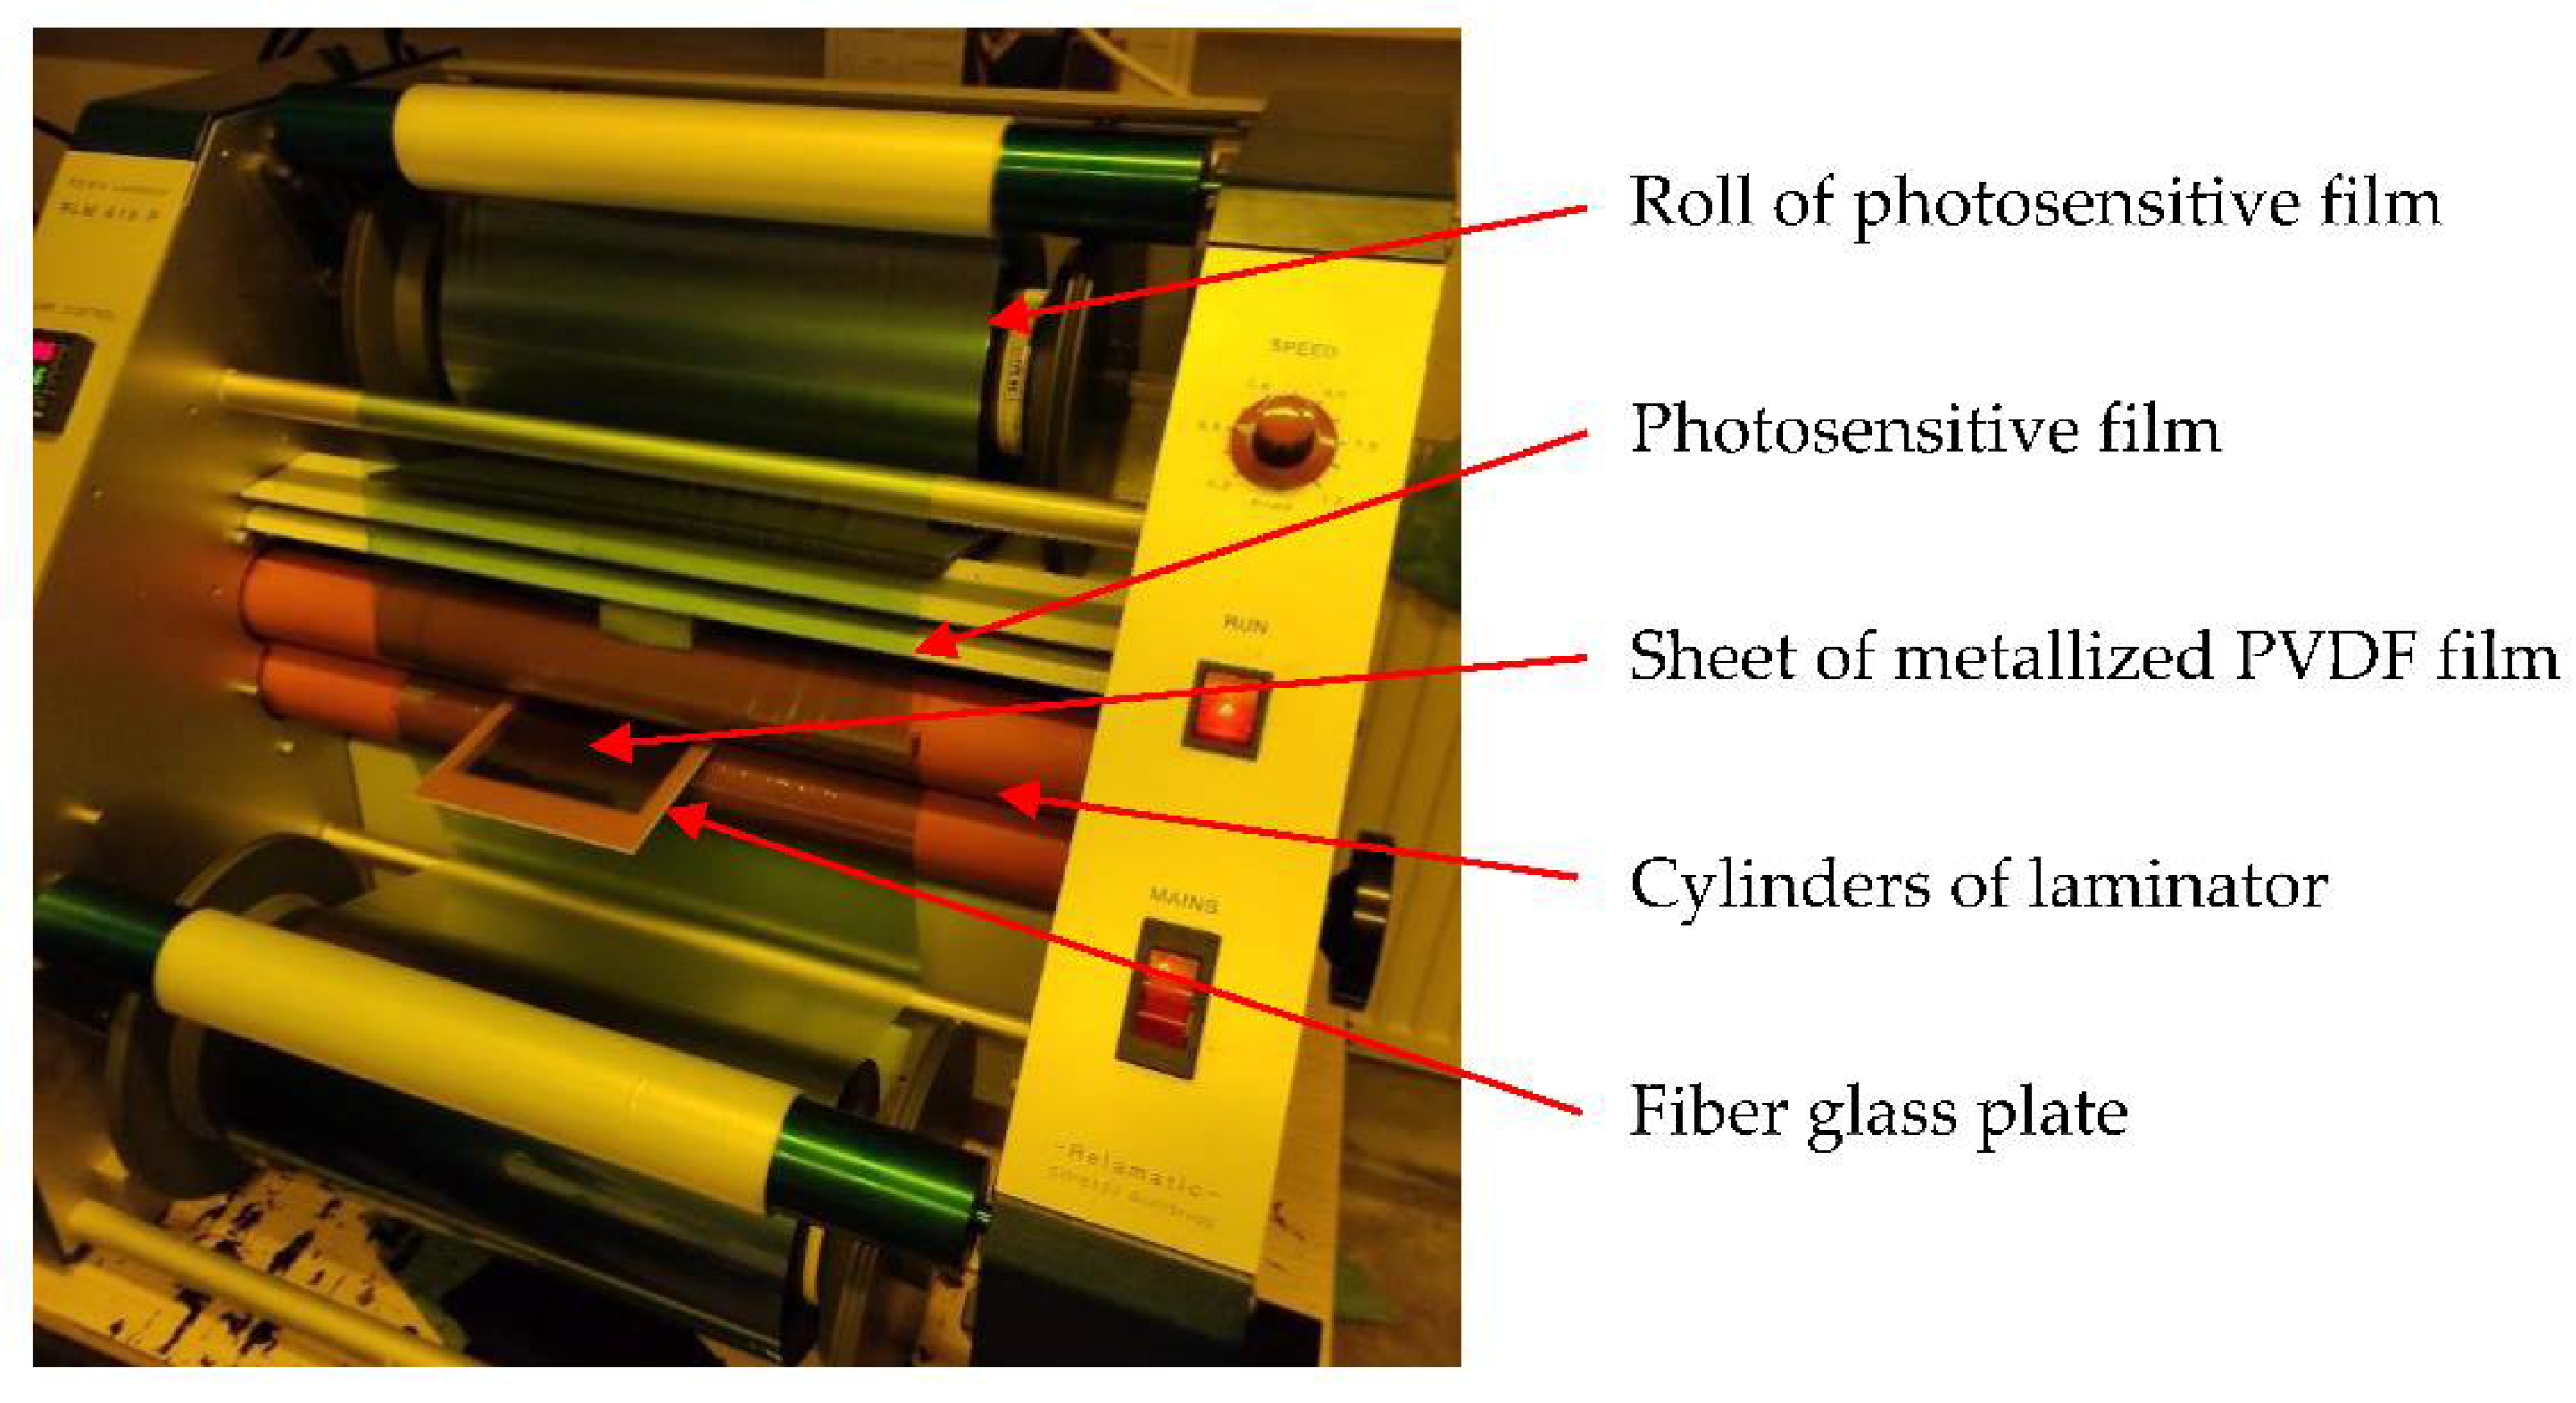
The standard photolithography process was used for fabrication. Photolithography is a process used to fabricate a pattern on a thin film of a substrate. The process uses a light to transfer a geometric pattern given by a photomask to a light-sensitive chemical photoresist on the substrate. A set of chemical treatments is used to etch the exposure pattern of the thin film of a substrate. This method is generally used in the production of printed circuit boards and, with little modifications described in next text, can be used for the fabrication of sensors by treatment of its metallization. The sensor production workflow included several steps. Firstly, a photosensitive film was joined to the metallization of the PVDF film on both sides by the Laminator RLM 419P. Since a PVDF film is thin and flexible, a fiberglass plate was used to support the film during the rolling between cylinders in the laminator as is seen in the
Figure 2. Although the laminator provides both side lamination, the lamination of photosensitive film was done for both sides separately due to the use of the supporting plate.
In the next step, a photomask in CAD software was created and then printed on a glass plate. The photomask was used to define the shape and size of the sensor. The PVDF sheet with the photosensitive film was then put between two photomasks. This sandwich was place in the exposure unit Bungard and both side UV light was applied for 80 s, as is shown in the
Figure 3.
The development of photoresist was done with sodium carbonate solution (Na
2CO
3) by spraying for 150 s, as is shown in the
Figure 4a. The next steps included the etching in ferric chloride solution (FeCl
3) for 10 s and removing the remaining photoresist with sodium hydroxide solution (NaOH), as is shown in the
Figure 4b.
Finally, copper wires for both top and bottom electrodes were riveted. Before the sensor mounting, uncovered sensor electrodes were electrically insulated by a 65 μm thick Kapton tape (KPT 201-2540). Sensors were glued on a stainless steel plate by a cyanoacrylate glue (Loctite Super Attak Power Flex Gel). The thickness of the glue layer is approximately 5 μm. Rivets were covered by an epoxy glue (BISON Epoxy 5 min). The PVDF sensor in its final form mounted on a stainless steel plate is in the
Figure 5.
3. Testing Methods of PVDF Sensors
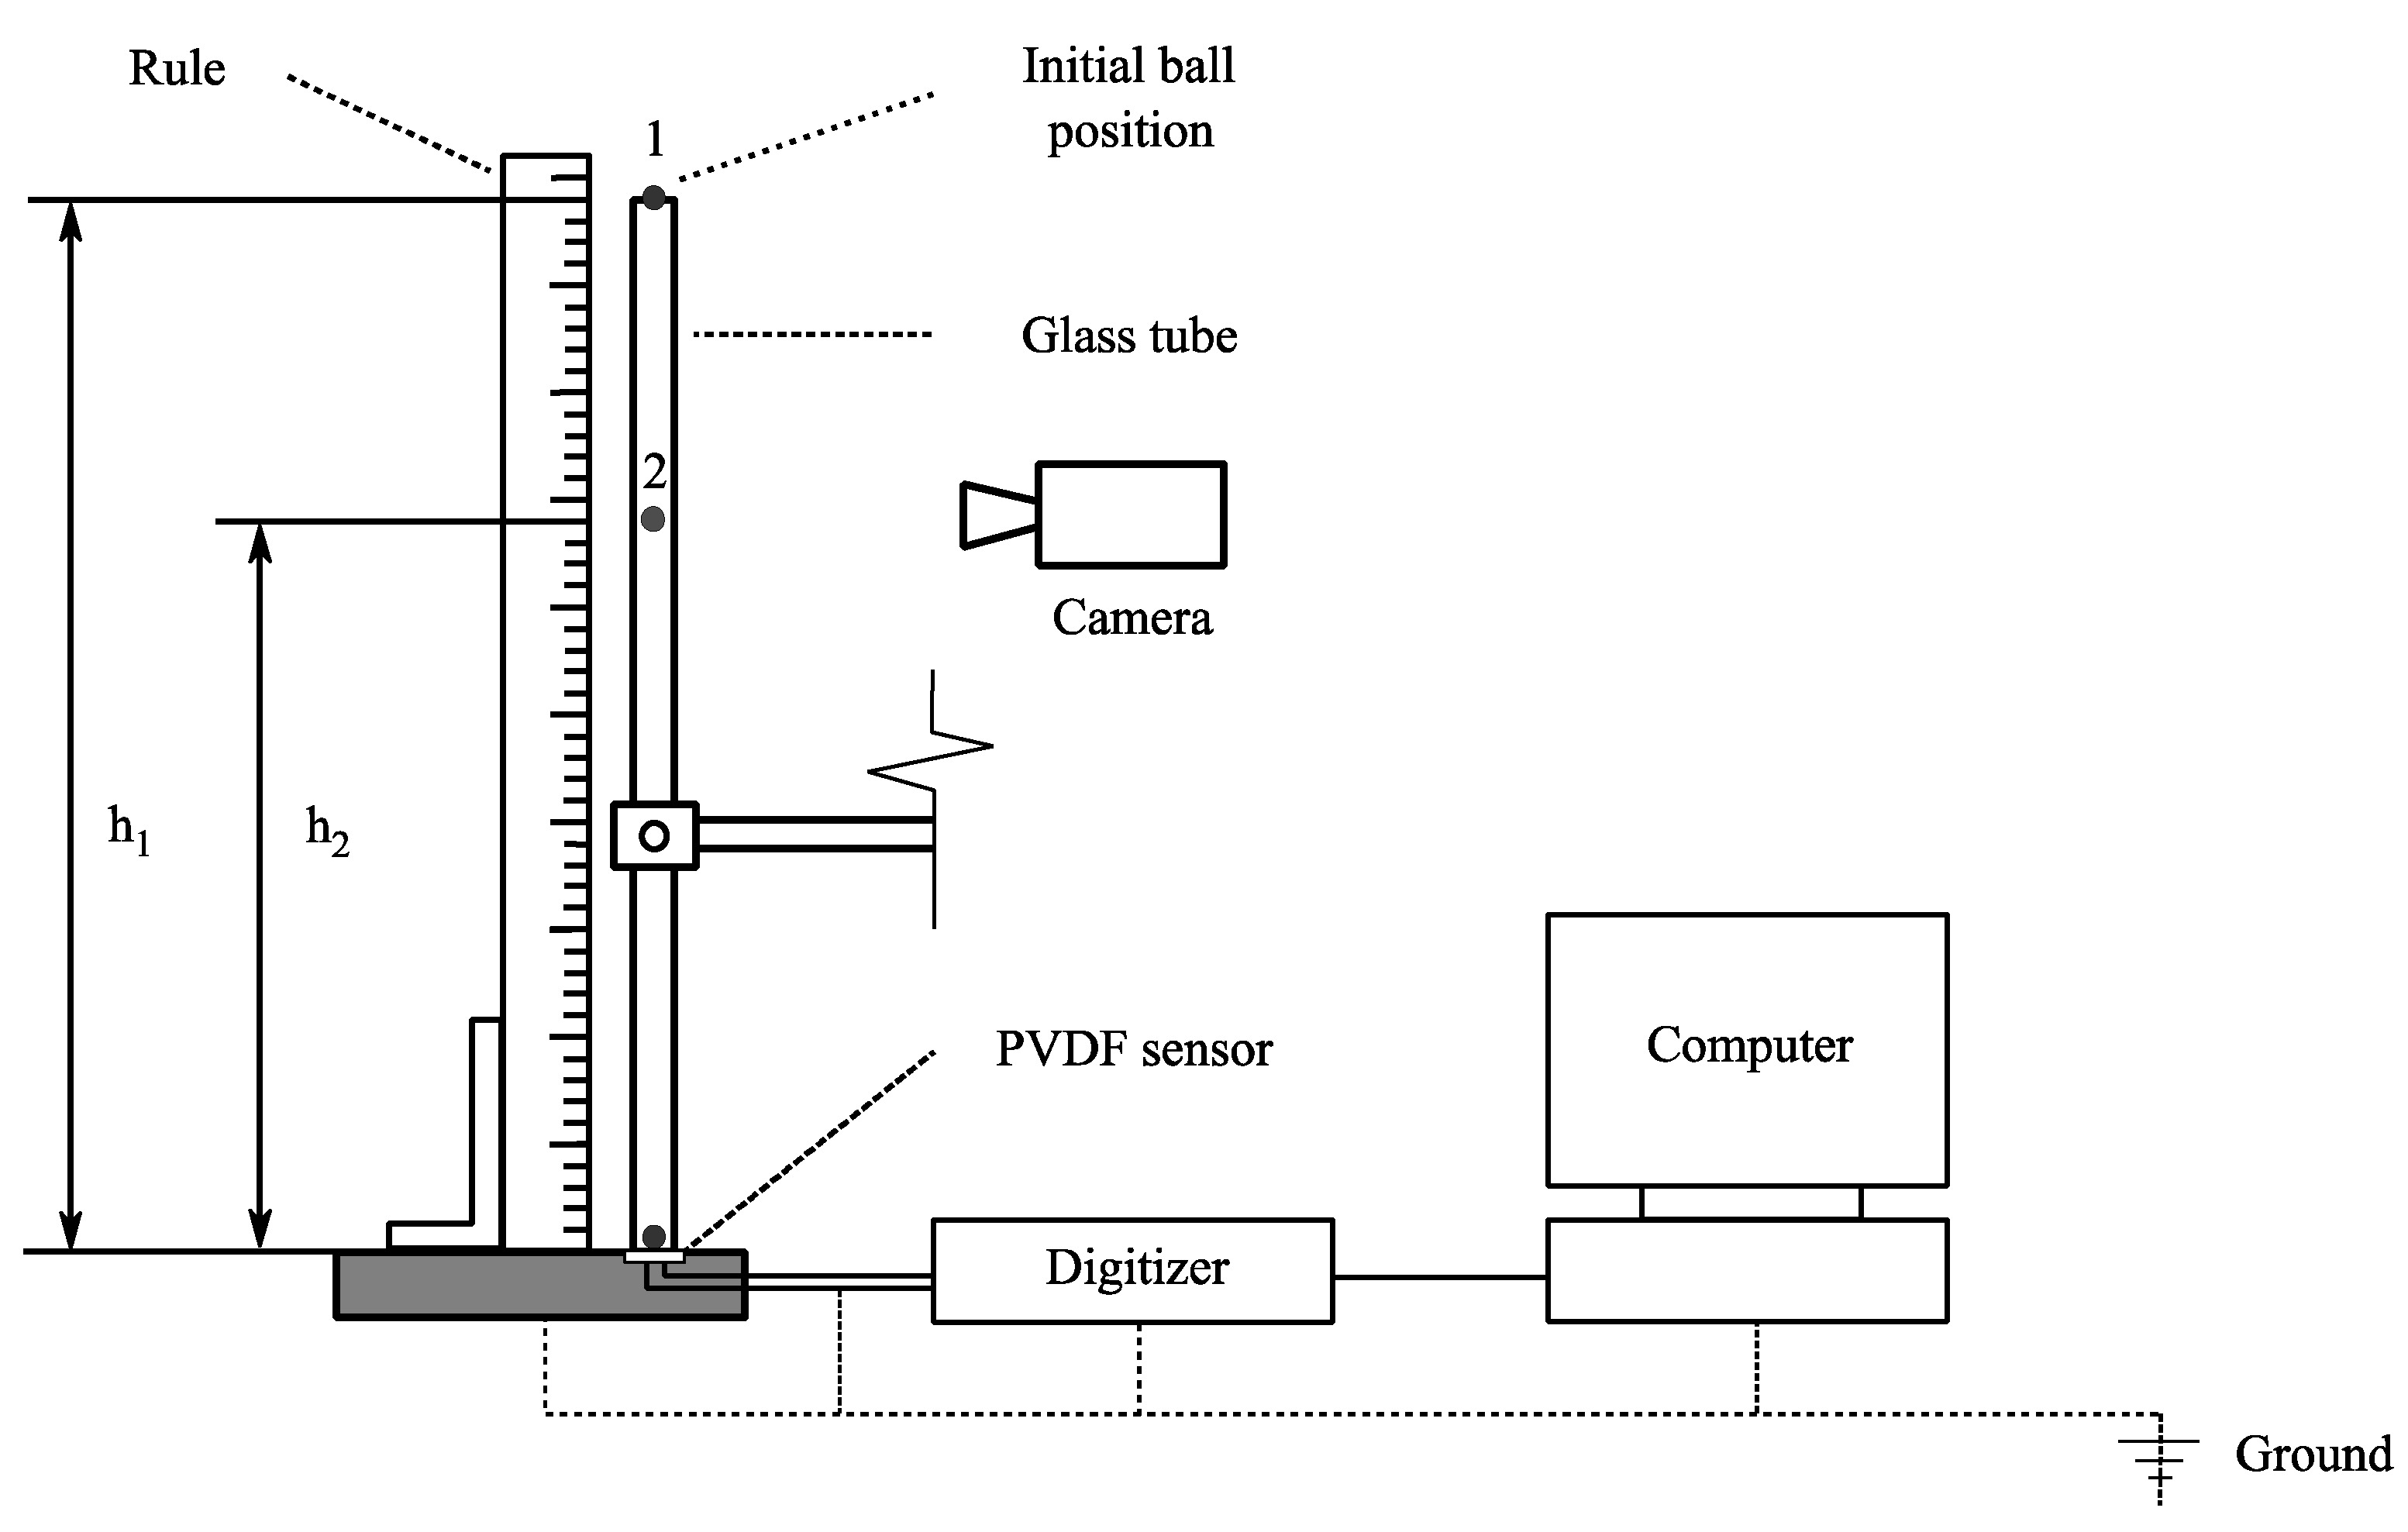
The testing of home-made PVDF sensors was conducted by the ball drop method, which is commonly used for the calibration of impact transducers [
11]. The testing method is illustrated in the
Figure 6. A stainless-steel ball of a certain weight
drops down vertically from initial position 1, hits the calibrated sensor and rebounds to position 2. Initial and final ball positions
and
are read on a scale of rule recorded by camera during each test. A glass tube is used for the ball guiding. During the ball impact, a part of the initial ball energy is transformed into a deformation of sensor. The sensor generates an electric charge which is directly measured as an electric voltage output. The maximum voltage
and the time duration of the impact
are determined from the measured signal.
The calculation of mean impact force
is based on the impulse-momentum theorem expressed by the following formula
Velocities before and after the ball impact are calculated from the formula
where
are initial and final heights of the ball and
is gravity acceleration. Maximum force
results from the shape of the measured signal and is considered as double the mean force
as
4. Experimental Setup
Two types of sensors were tested in this study. The home-made PVDF sensor described above in detail, and a commercial PVDF film transducer (DT1-028K/L) manufactured by TE Connectivity. The active area of the standard commercial sensor is 12 mm × 30 mm. For the comparison, the home-made PVDF sensor was fabricated with active area 12 mm × 30 mm. To evaluate the influence of the active sensor area, two sensors 12 mm × 10 mm and 12 mm × 1 mm were fabricated. The commercial sensor consists of 28 μm thick PVDF film with silver ink electrodes and protective urethane coating over the electrodes. The total thickness of the sensor was 40 μm.
The sketch of the experimental setup is in the
Figure 6. The tested sensors were connected directly to the input of the acquisition card of the 12-bit NI USB 5105 digitizer controlled by a computer. The acquired signals were analyzed in the software LabVIEW Signal Express. The impact duration
and maximum voltage
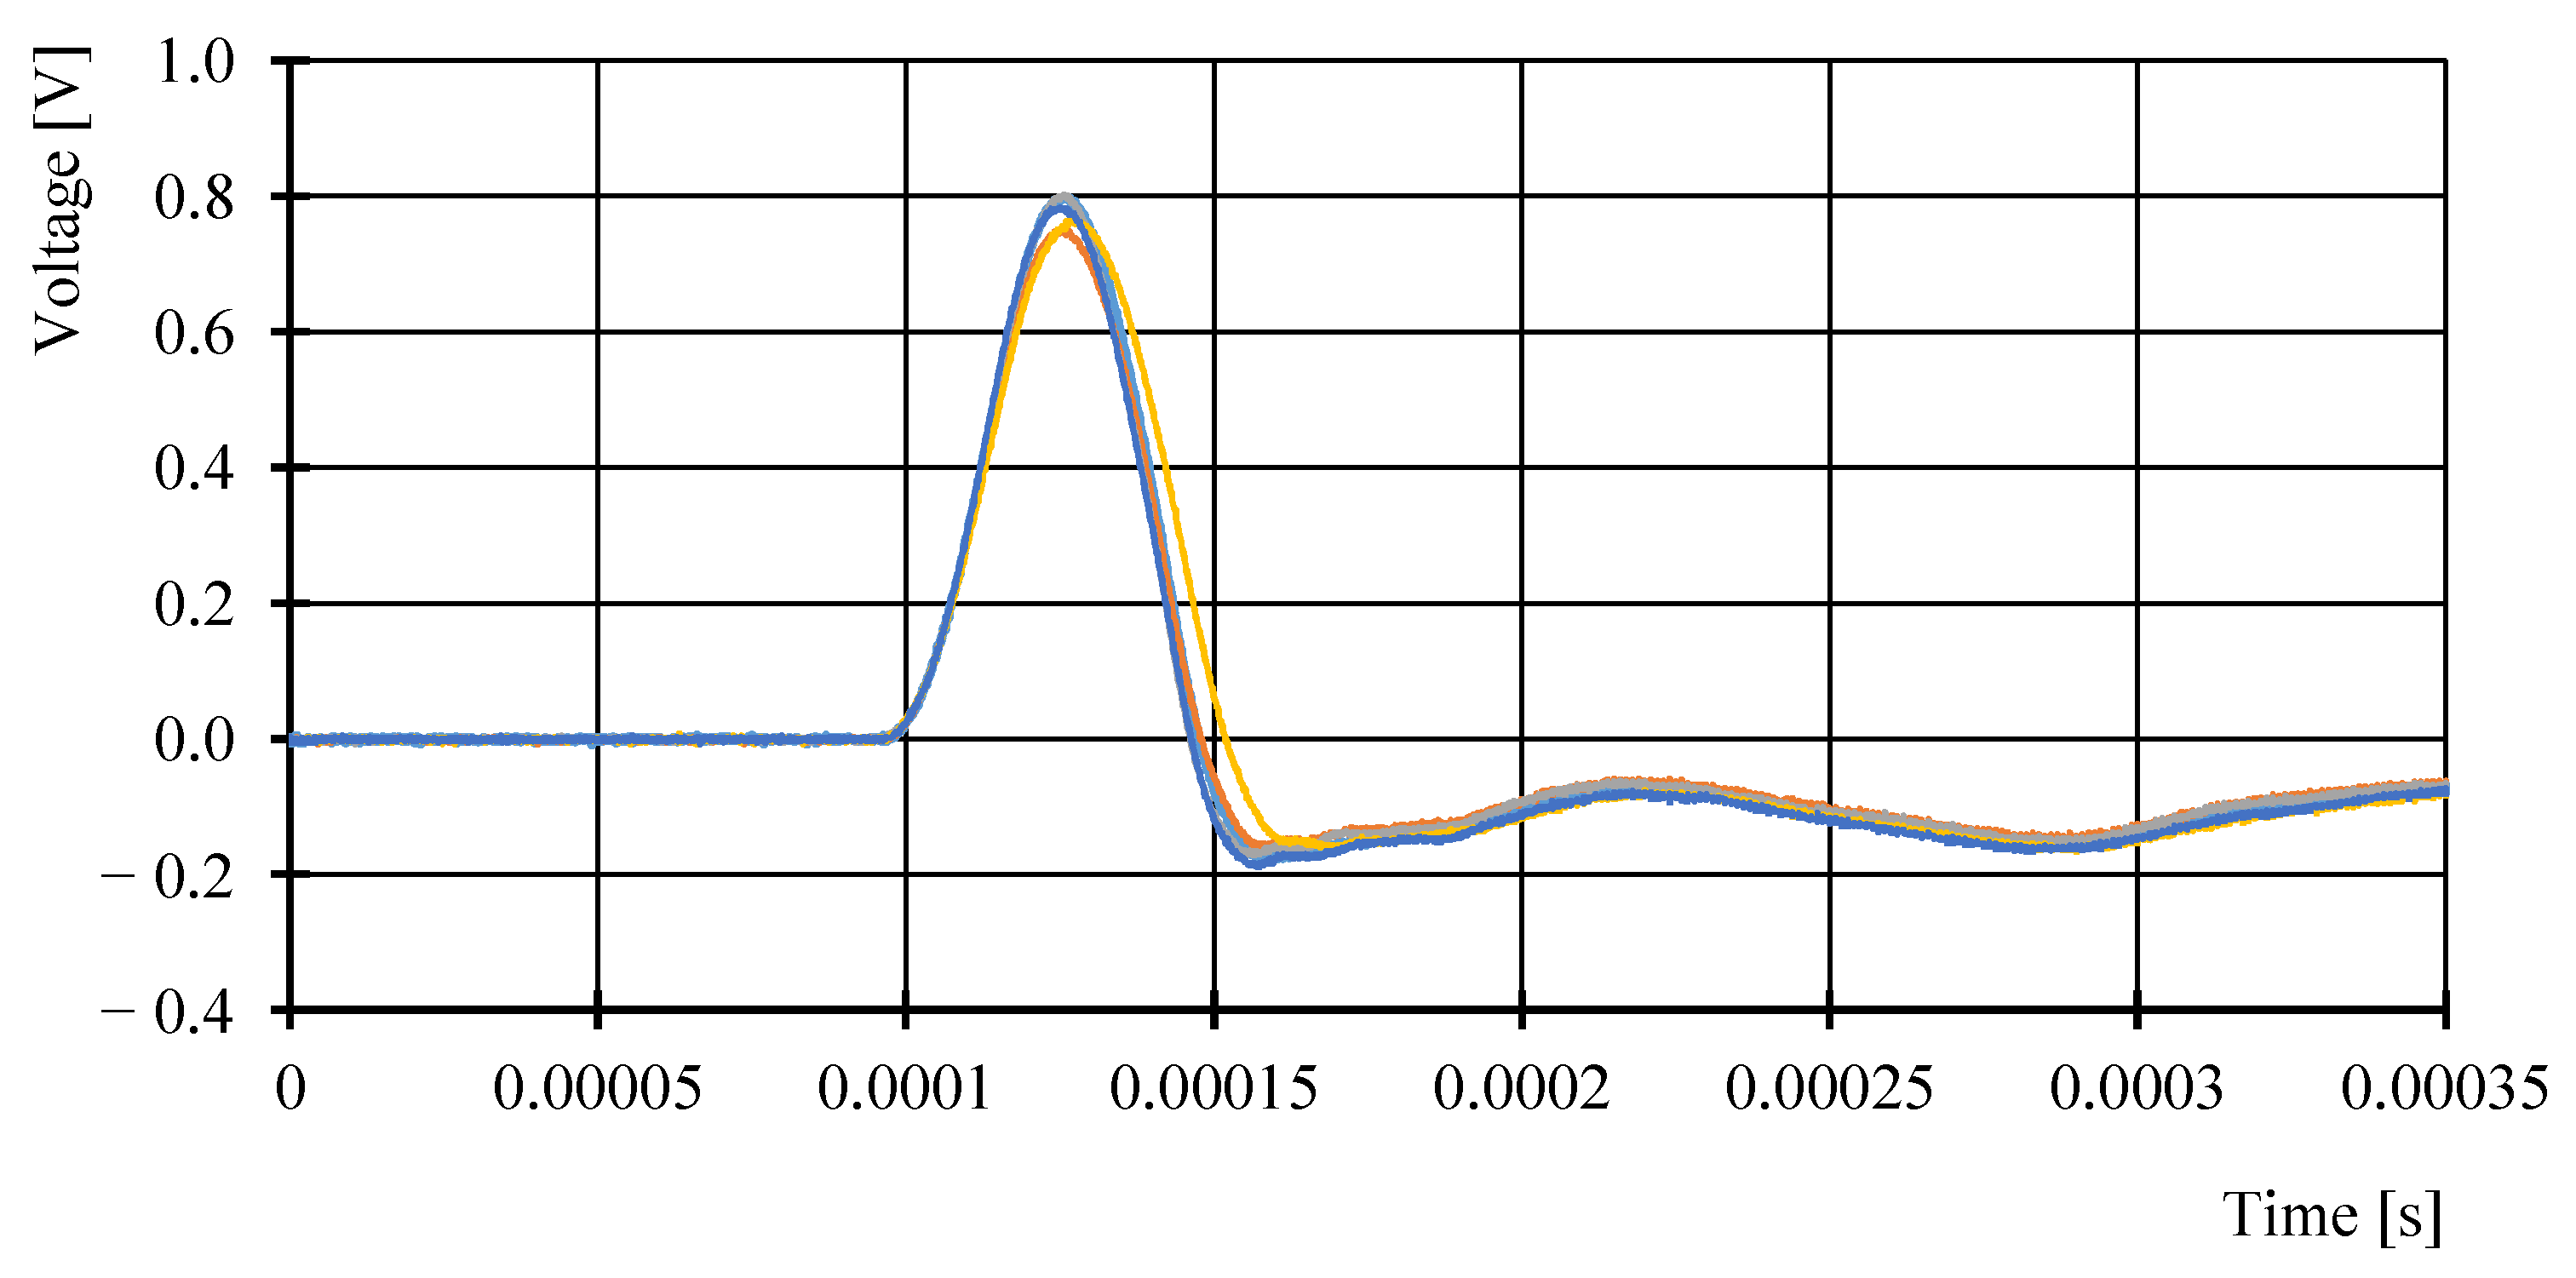
were detected. All devices, the digitizer, computer, stainless steel plate and negative pole of PVDF transducer were grounded to avoid a signal noise. Examples of measured voltage/time curves are given in the
Figure 7.
The impact duration was evaluated as the full width at the half of the signal maximum. The ball drop testing of sensors was conducted with four sizes of stainless-steel ball 0.132 g; 0.260 g; 0.441 g; 0.700 g, of corresponding diameters 3.17 mm; 3.99 mm; 4.74 mm; 5.54 mm and with three lengths of glass tubes. The glass tubes’ length determines the initial ball positions (150 mm; 300 mm; 400 mm). The final ball position after the rebound was recorded by the camera. The digitizer sampling frequency was set to 10 MHz and input impedance was set to 10 MΩ.
The ball height after the rebound was recorded by MotionPro X3 camera with resolution 1280 × 1024 pixels at the frame rate of 200 fps. The ball position was read from the frames against the ruler attached to the glass tube.
5. Results
The commercial sensors were tested for points from the combination of three initial ball heights 400 mm; 300 mm; 150 mm, and four ball masses 0.132 g; 0.260 g; 0.441 g; 0.700 g. The home-made sensors HM 12 × 10 (12 × 10 in short form is 12 mm × 10 mm); HM 12 × 30 and HM 12 × 10 with added protection layer were tested for points from a combination of three initial ball heights 400 mm; 300 mm; 150 mm, and four ball masses 0.132 g; 0.260 g; 0.441 g; 0.700 g. The home-made sensor HM 12 × 1 was tested for points from a combination of initial ball height 300 mm and ball masses 0.132 g; 0.260 g; initial ball height 150 mm and ball masses 0.132 g; 0.260 g; 0.441 g. The number of points for this sensor was reduced due to potential damage by higher ball masses and higher initial ball heights. Each point for all sensors was repeated five times to ensure the reproducibility of the measurements.
The dependence of the measured maximum voltage
and calculated mean impact force
followed a linear trend over all measurements. Therefore, the linear least square method was used to fit the data.
Figure 8 shows the determination of the sensitivity constant on the measured data for the home-made PVDF sensor of size 12 mm x 30 mm. The linear fit gives sensitivity 0.013 V/N with the square of the correlation coefficient
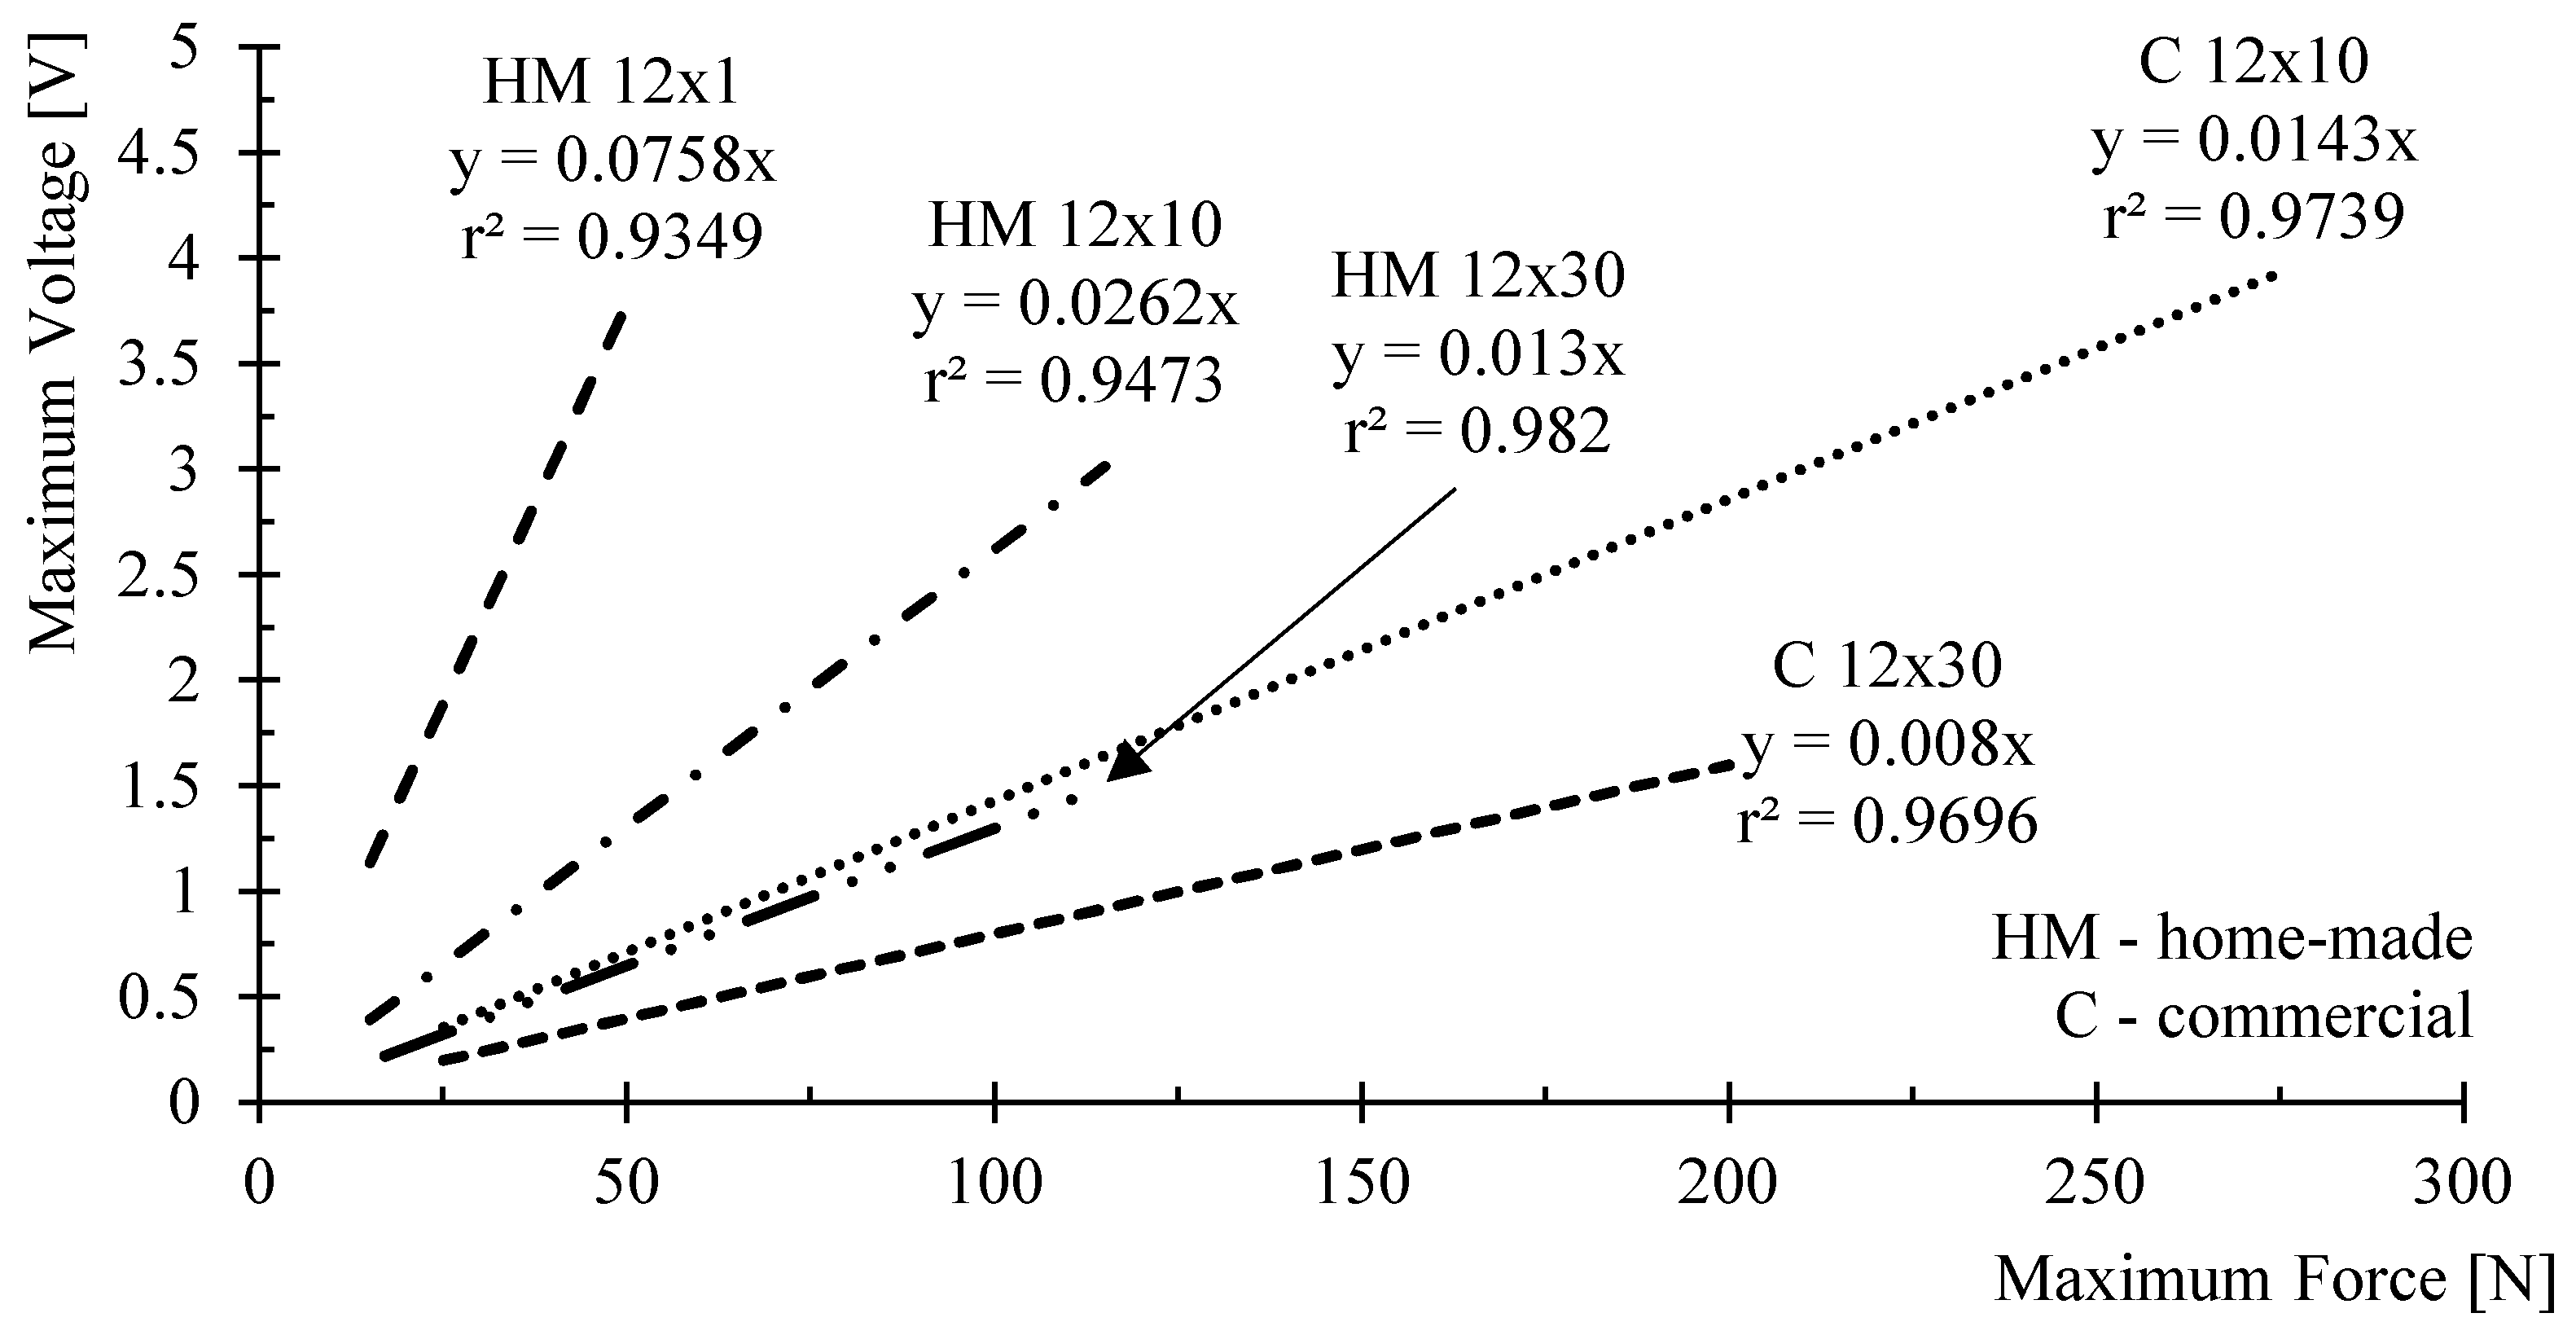
r2 = 0.982. For the sensitivity, constant fitting the condition of the zero maximum voltage at zero maximum force is considered. The comparison of the calibration lines and sensitivities for the home-made PVDF sensors and commercial PVDF sensors for different sensors active areas is plotted in the
Figure 9.
The sensitivities of home-made PVDF sensors of sizes 12 mm × 30 mm; 12 mm × 10 mm and 12 mm × 1 mm were 0.013 V/N; 0.0262 V/N and 0.0758 V/N respectively. The sensitivities of commercial PVDF sensors of sizes 12 mm × 30 mm and 12 mm × 10 mm were 0.008 V/N and 0.0143 V/N. It can be seen that the reduction of the sensor active area increases the sensor sensitivity. This applies to both home-made and commercial sensors. The sensitivity of commercial sensors is smaller than for the home-made sensors.
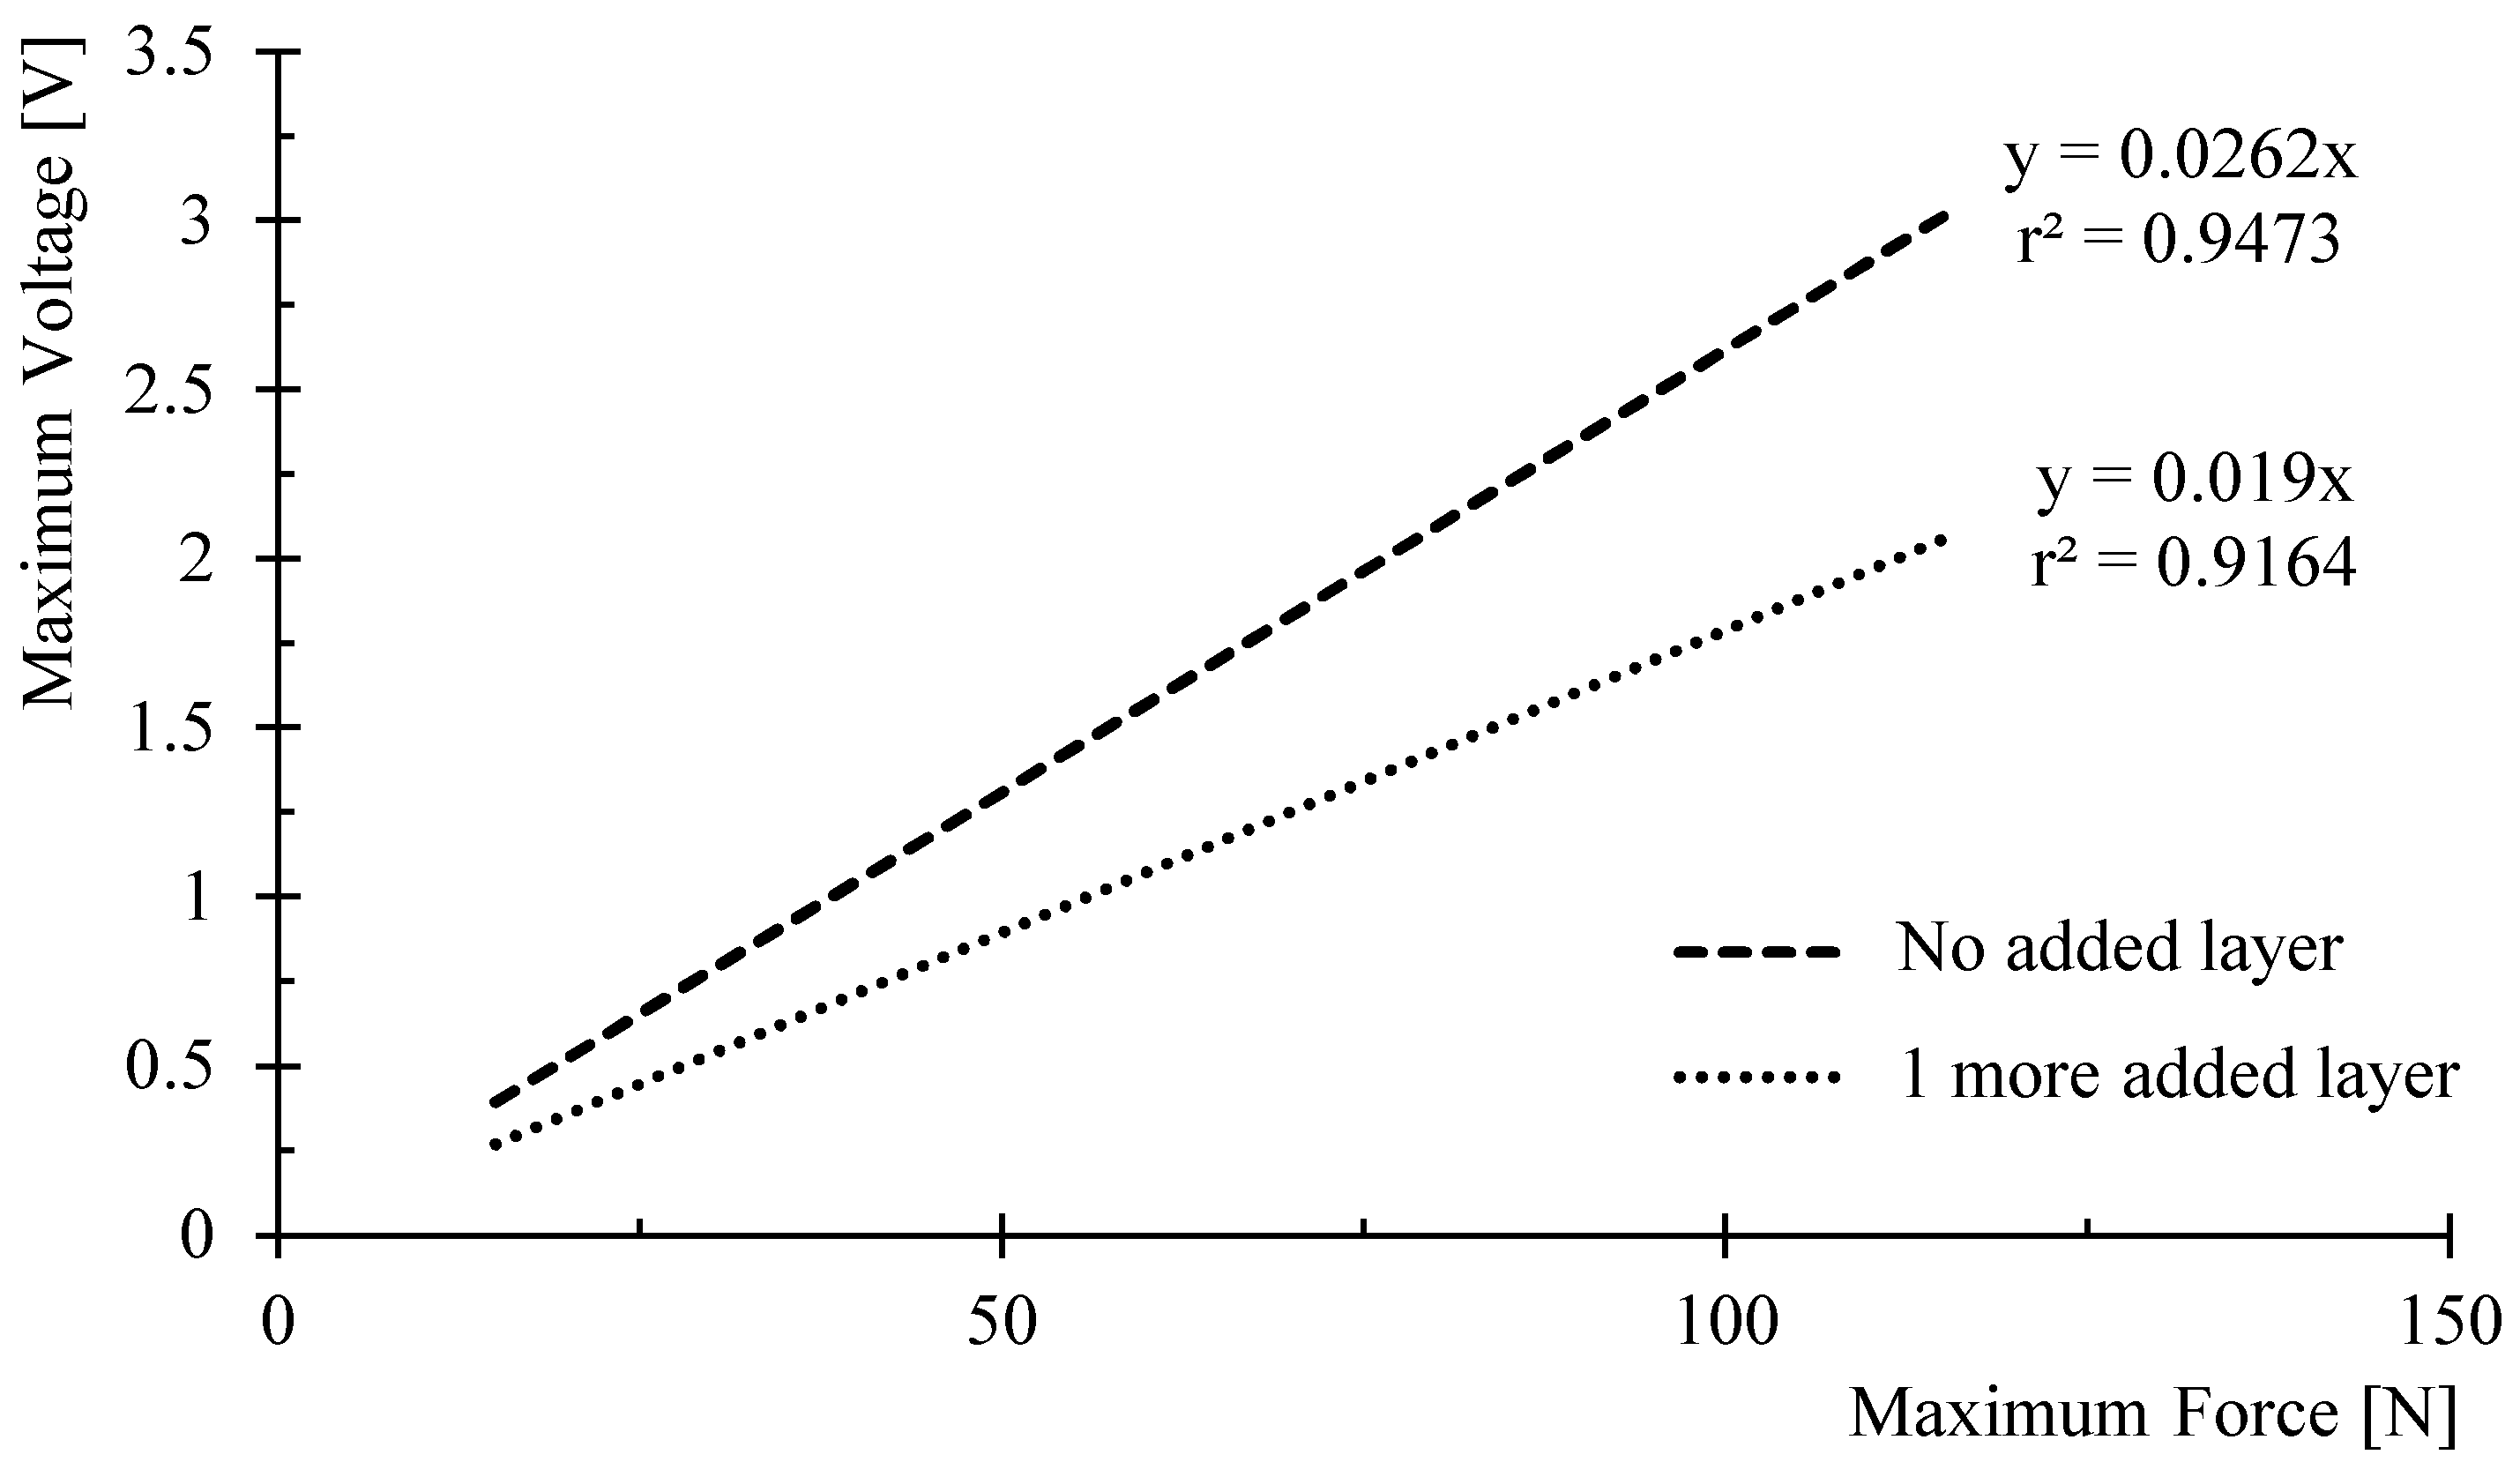
The effect of protective layers on the home-made PVDF sensor sensitivity was evaluated. The comparison of the sensor sensitivity with no additional protection layer of Kapton tape and with one additional protection layer are shown in the
Figure 10. It is observed that sensor sensitivity decreases as the protective layer increases. The values of the square of the correlation coefficient for tested sensors are indicated in
Figure 9 and
Figure 10.
The possible error sources related to the calibration constant determination come from the experiment realization and from the data evaluation.
The error connected to the determination of the ball position from the camera frames is based on the frame rate. The ball position/time curve has a parabolic profile with the smallest slope close to the position . Considering the used frame rate 200 fps and the overall maximum rebound velocity reached 2.2 m/s, the ball movement between the three camera frames before reaching the maximum position is less than 5.0 × 10⁻⁵ m. The error from the camera resolution was approximately 0.3 mm per pixel. The sampling frequency for the voltage/time signal on the oscilloscopic card is 1.0 × 10⁻⁷ s, which corresponds to the 660 samples for the longest recorded impact signal 66 us.
The inaccuracy connected to the physical realization of the experiment comes from the way in which the sensor is impacted. During the sensor manufacturing and the sensor attachment to the surface, small deviations in the sensor surface flatness occurs. This results in deviations from the perpendicular rebound when different sensor locations are impacted. This fact contributes significantly to the deviation of the measured data. The standard deviation in the determination of the ball position after the rebound was up to 14%, and the standard deviation in the determination of the impact duration was up to 9% for all the measured points.
6. Theoretical Analysis
Analytical and numerical methods were applied to obtain a deeper insight into the sensor loading. The analytical estimation of the impact force for elastic materials can be obtained from the Herzian contact theory [
12].
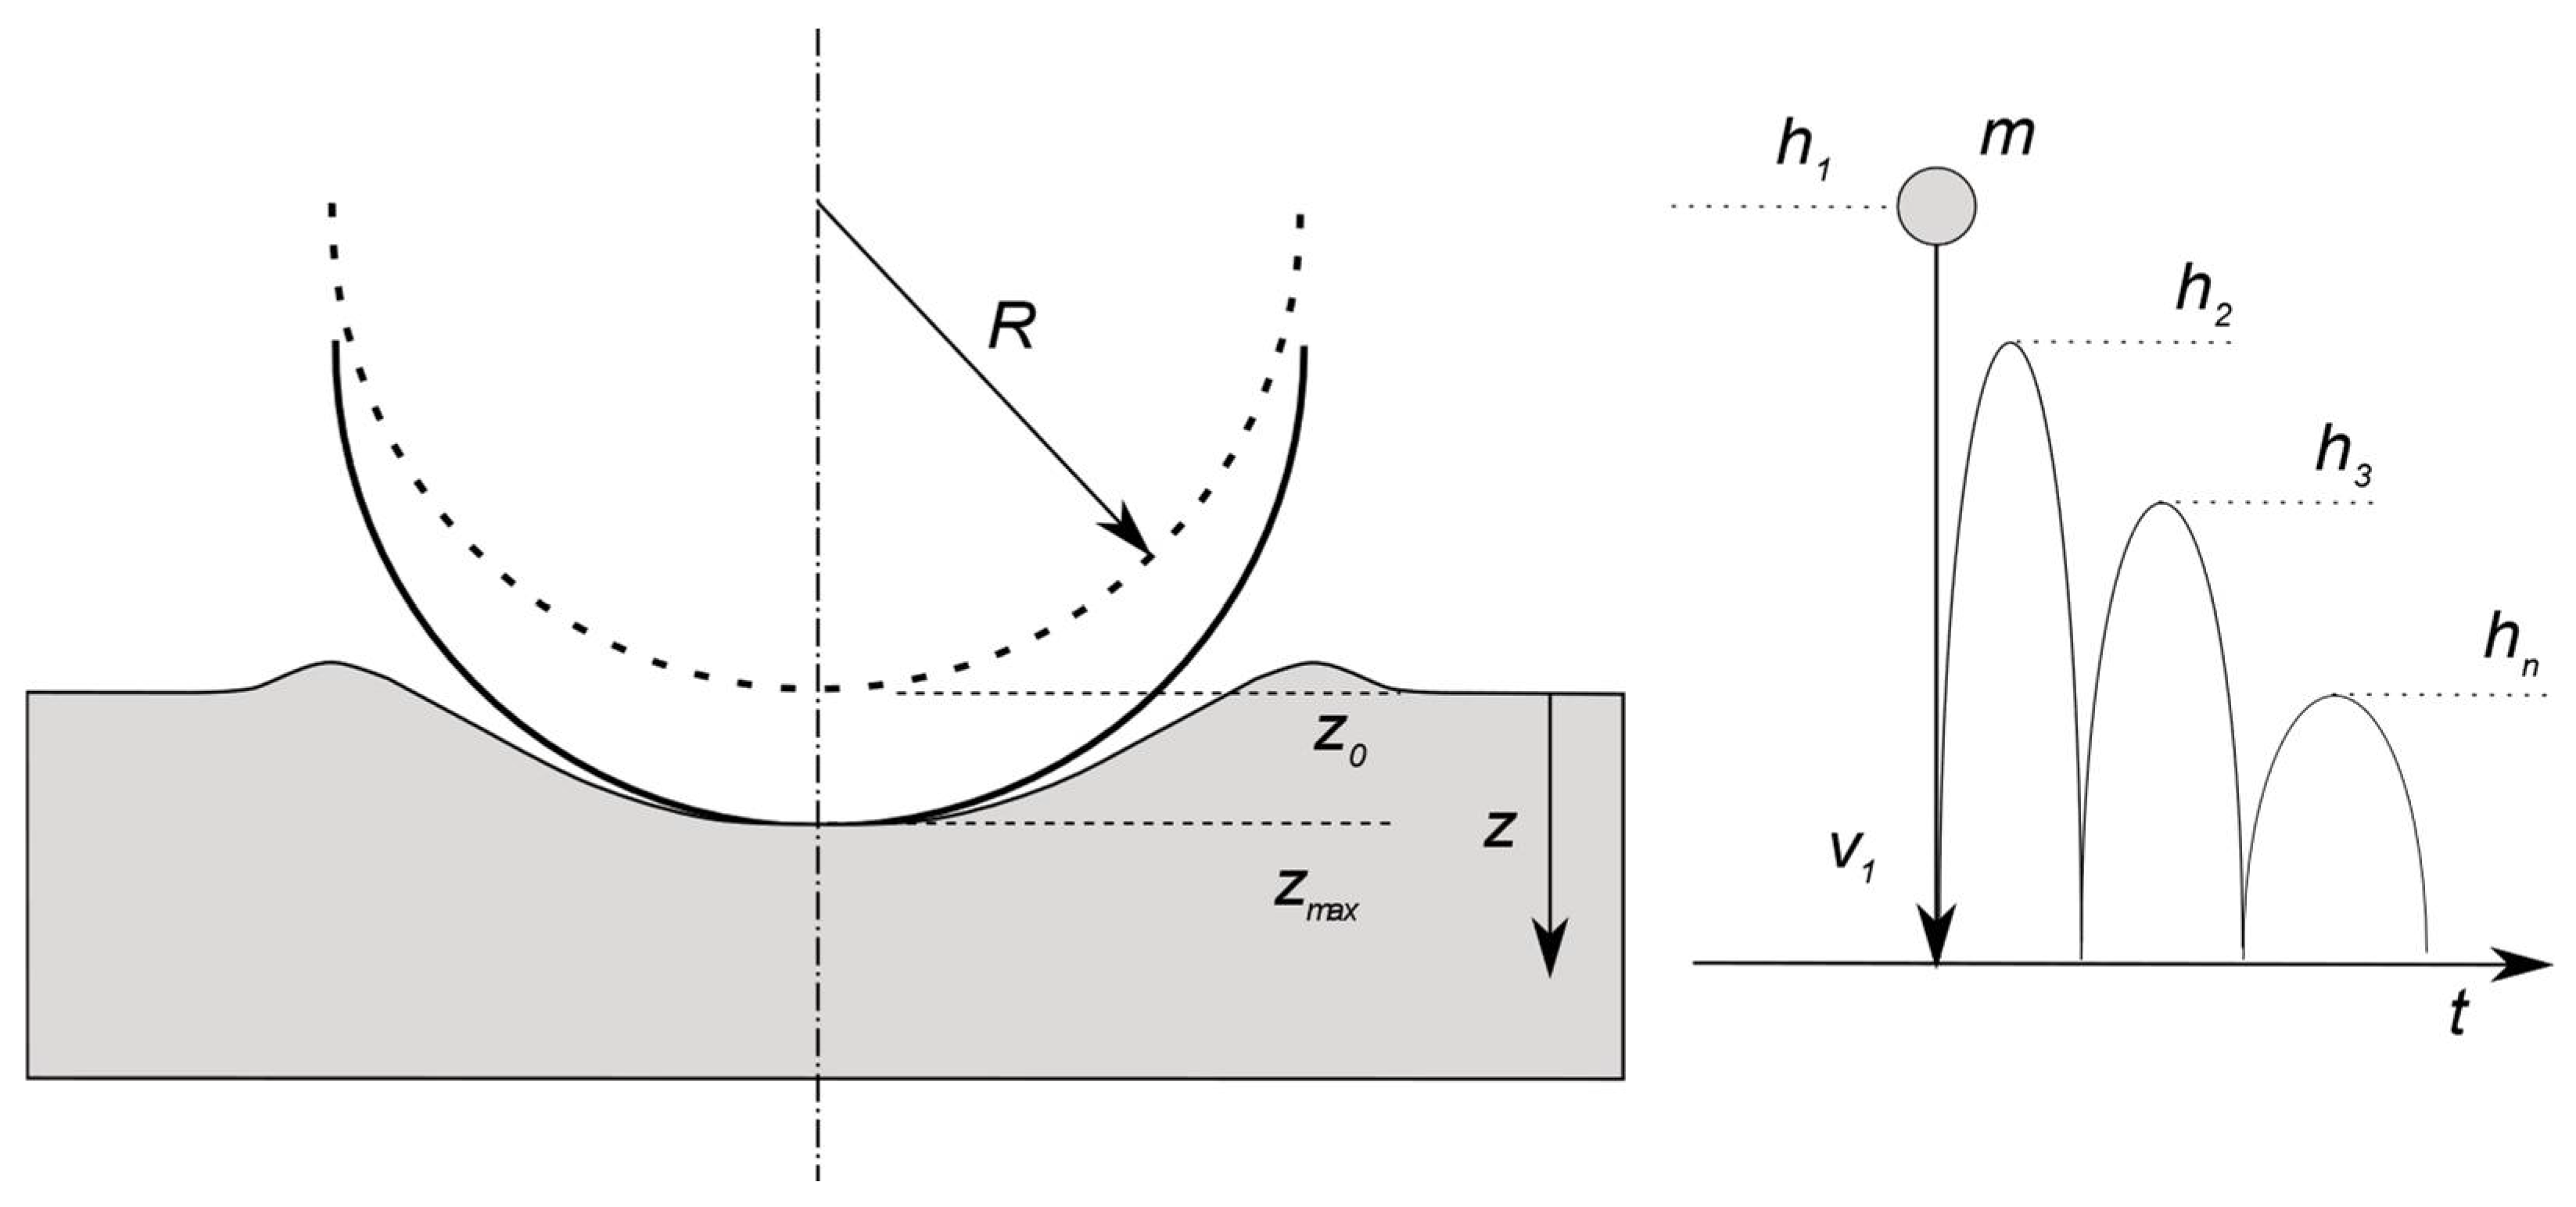
The illustration of the impact process is indicated in the
Figure 11. According to the Hertz theory [
13,
14], the force of a spherical impactor of radius
on the flat surface can be calculated as
The effective elasticity modulus
is defined from the elasticity moduli
and
, and Poisson’s ratios
and
, of the impacted surface (PVDF film) and the impactor (ball) respectively as
The maximum impact force in an elastic collision can be calculated from the energy balance. The potential energy stored during the elastic contact deformation can be obtained according to the Hertz model [
12] in the form
Considering a perfectly elastic impact (neglecting energy losses) the energy balance during the collision has the form
The maximum impact force
is considered at the maximum indentation depth
for
in form
The maximum impact force is obtained after the substitution of
from Equation (8) to Equation (4). The integration of Equation (8) gives the elastic impact duration [
13,
14]
From this analysis, it can be indicated that the maximum force is a function of materials of bodies in impact and the dimensions of the impactor. The sensor installation during the real impact represents a composite structure. The analytical approach given by Equation (4) considers one material for each impacting body, which can influence the resulting maximum force.
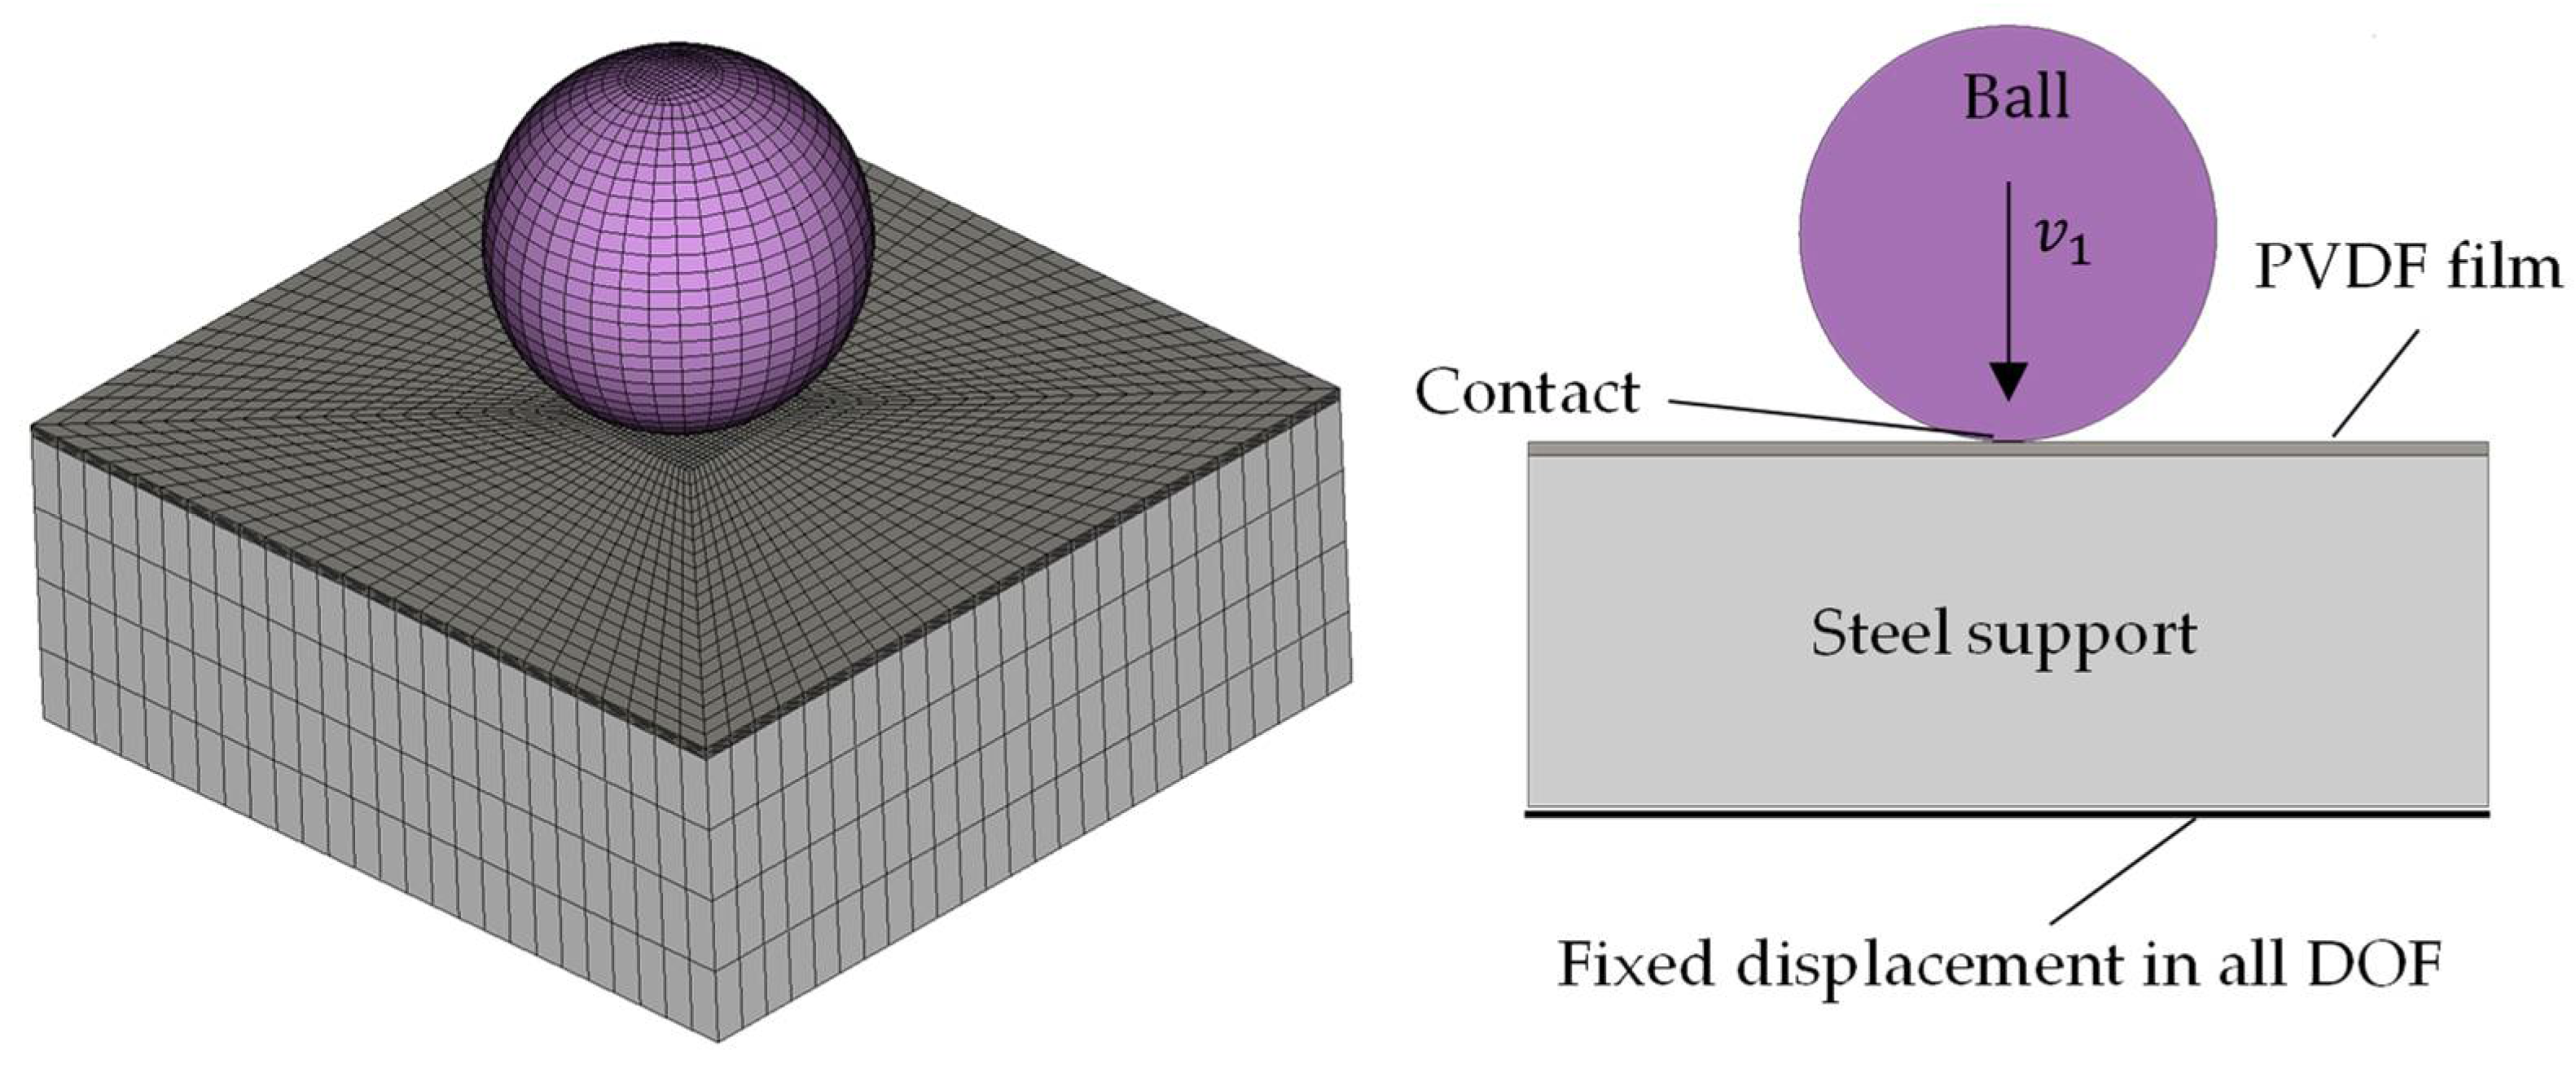
The numerical solution was obtained using the commercial explicit code PAM-CRASH. The FEM model and the used boundary conditions are illustrated in the
Figure 12. The model consists of two parts. The ball is initiated by the impact velocity
and located near the PVDF surface. The PVDF is supported by a steel plate. The fixation glue properties and also the metallization are not considered in the FEM model. As the average material properties of the Kapton tape and the PVDF film are very close, the film composite is considered as one layer. The mechanical properties of the considered layers are given in the
Table 1. Note that the properties of the PVDF material given by the producers are in a wide range [
15,
16]. Material properties used for the simulation were
E = 2500 MPa,
ν = 0.35 and σ
y = 30 MPa. The value of the yield stress was adjusted to reach identical ball rebound velocity
as in the experiment. The size of the elements in the contact area was set to 0.08 mm. This is a compromise between the simulation duration and the results accuracy. The elastic–plastic materials were used for the simulation. Note that the simulation of the complete drop from height 300 mm is possible. However, neglecting the drag forces allows for the use of velocity at the end of the fall as the initial condition, and to reduce the simulation time. From the experimental data set, the 300 mm initial height of the impact, and the ball with diameter 4.74 mm and mass 0.441g mass, were considered for the theoretical and numerical analysis. The initial impact velocity
calculated from Equation (2) was 2.43 m.s
−1.
The verification of the FEM model to the experimental data is provided by the comparison of the height
reached after the first impact. This height can be obtained from the velocity after the collision using Equation (2). The summary of the results is given in the
Table 2.
The comparison between the measured maximum impact force, the simulated maximum impact force and the ball velocity are given in the
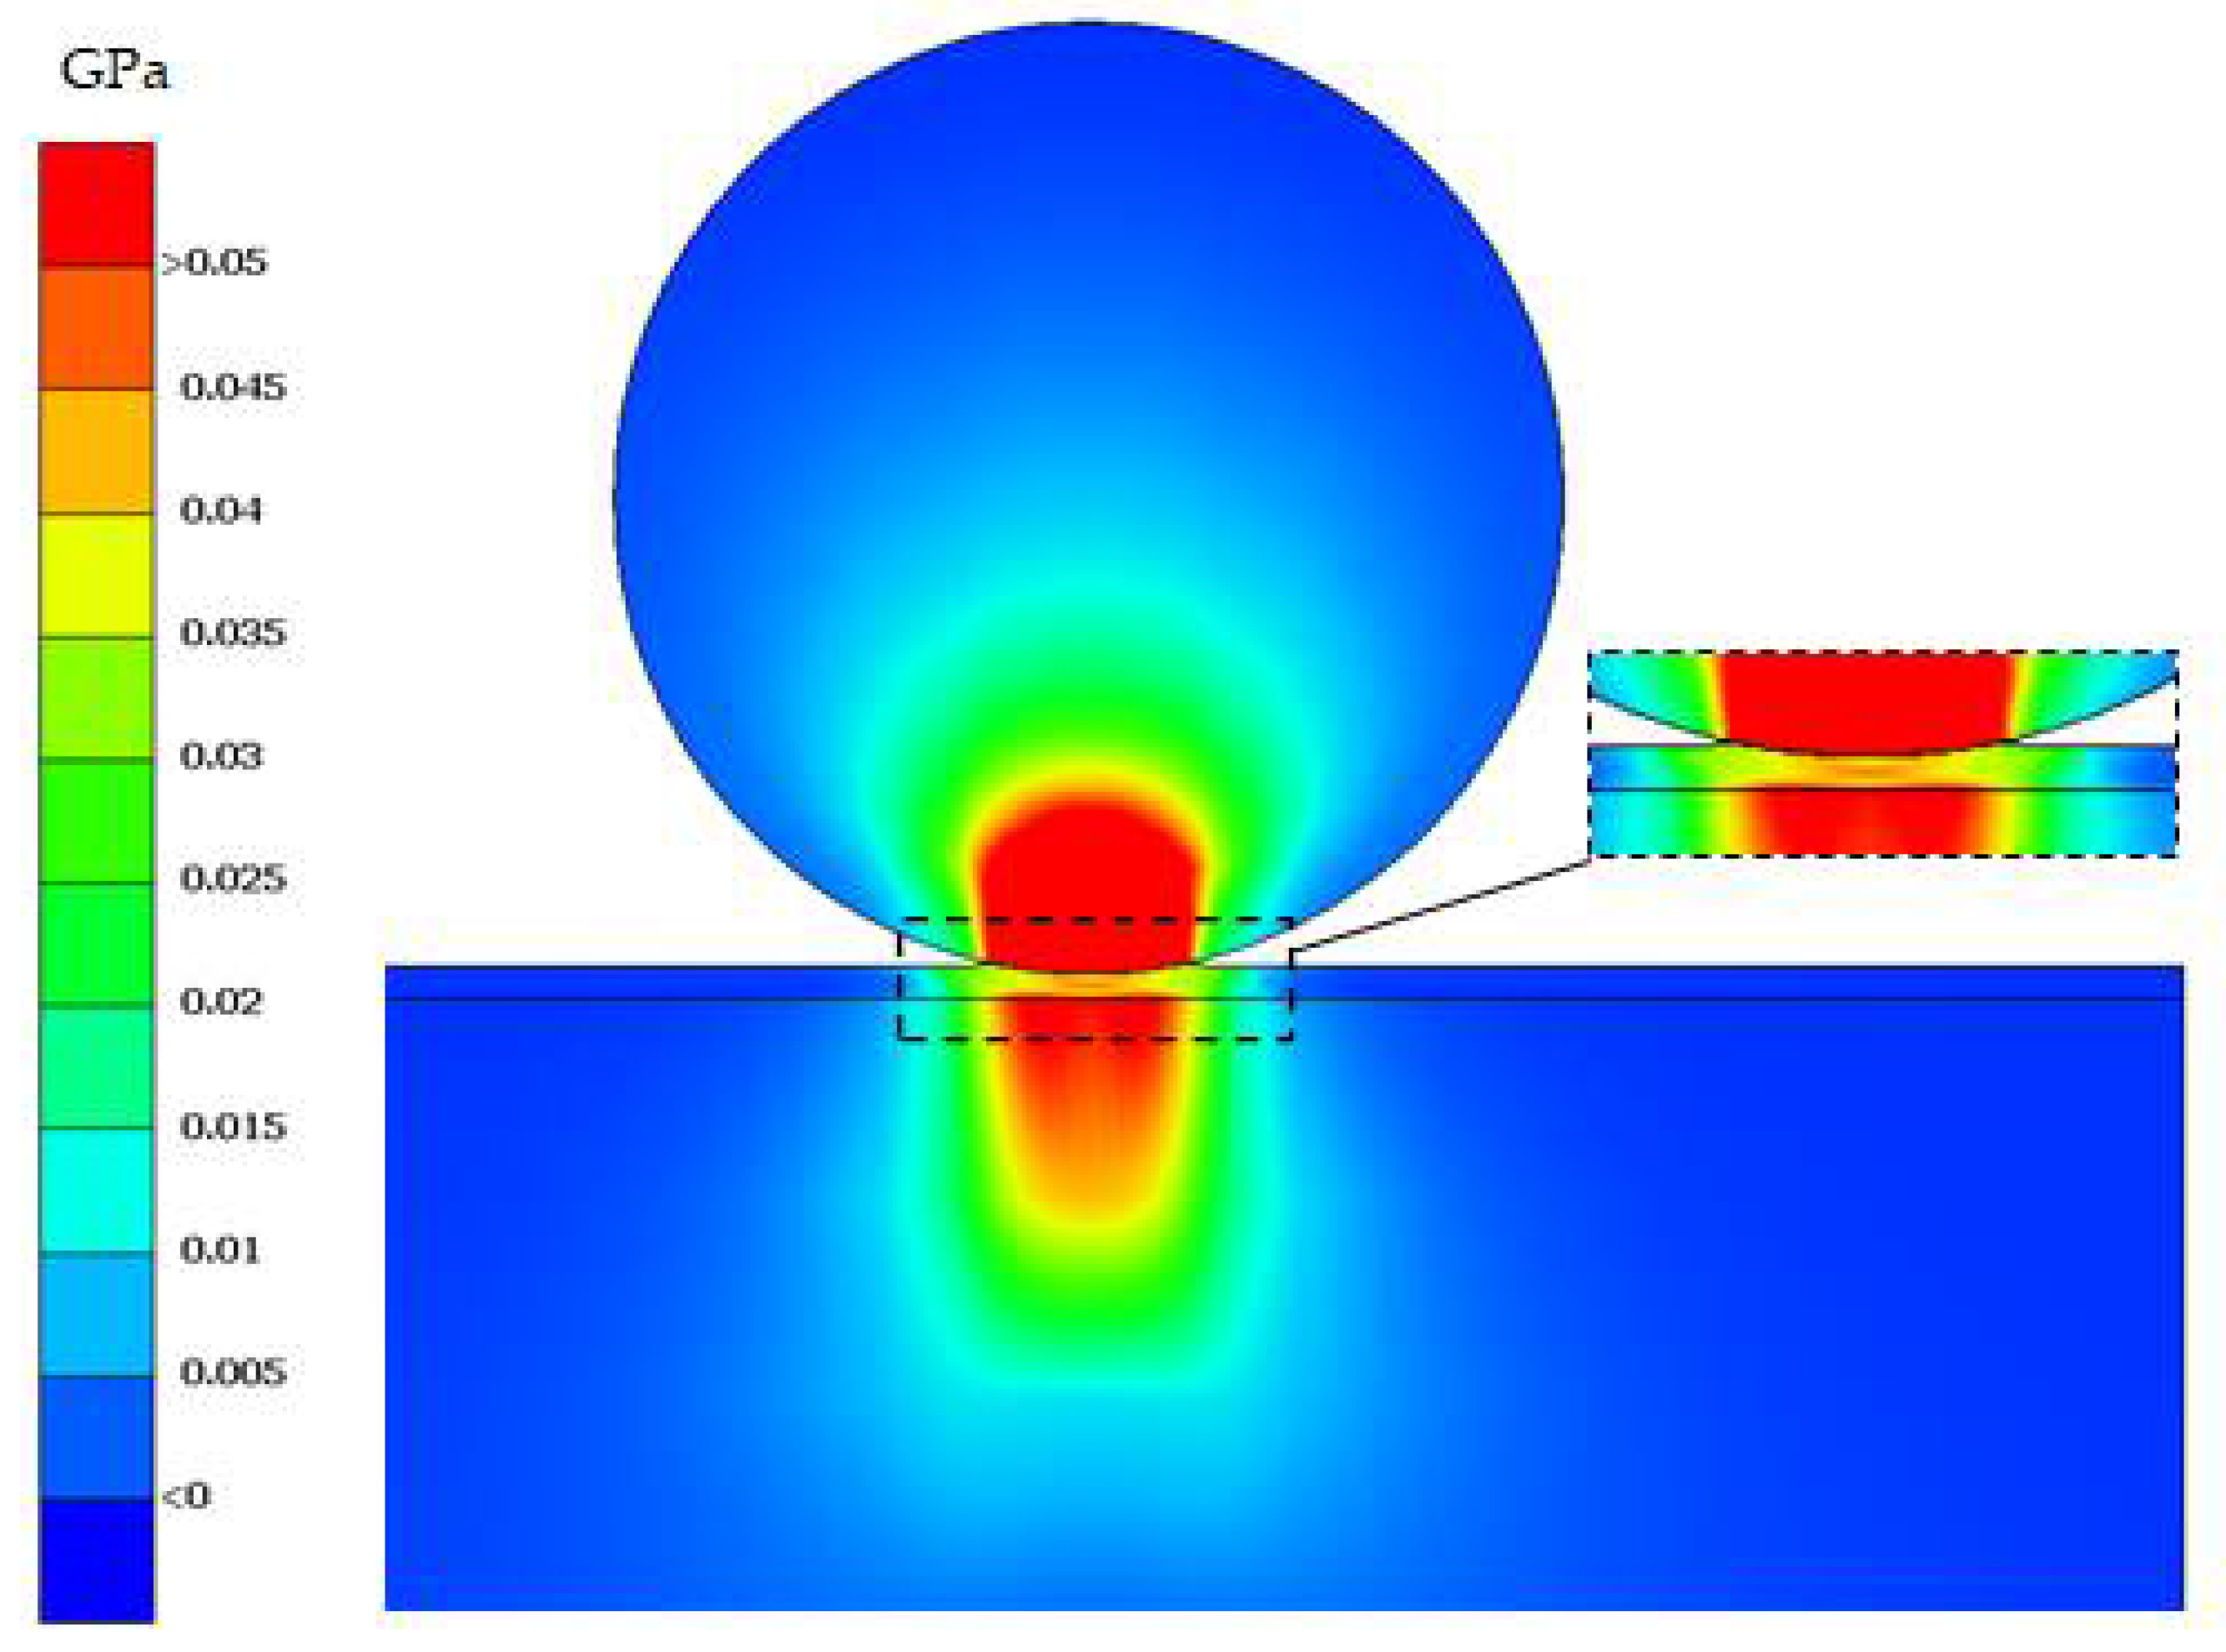
Figure 13. The slope of the force history for the loading and the unloading phase differs, which can be caused by the plastic deformation on the contact region. The numerical simulation by FEM model predicts a higher value of the maximum force than the experiment. When testing the numerical FEM model, it was indicated, that the value of the force 68 N corresponds to the impact where the supporting material (steel) is replaced by the elastic PVDF material. In other words, the impact force is higher as the steel support contributes to the stiffness of the structure. The detailed information about the sensor loading is indicated in the
Figure 14. It can be seen that the ball penetrates the PVDF film surface and displaces the sensor material from the impact center. The contours in the
Figure 14 represent the distribution of the equivalent stress. It can be seen that the impact influences the stress distribution also in regions close to the contact surface.
The pressure values in the contact region are about 50 MPa in the considered case. It is clear that the maximum stress values in the region correspond to the pressure loading; however, some parts of the region are under tensile stress. This can be evaluated from the
Figure 15, where the contours of the first principal stress are indicated. The values of pressure loading correspond to the negative values, and the values of tension correspond to positive values. The main part of the contact region is fully in pressure loading; however, at the side of the regions the tensile loading can be indicated. This loading contributes to the sensor output voltage signal. Note that the tensile stress values in the
Figure 15 are in the range of units of MPa, whereas the pressure values are at least one order higher.
Figure 14 and
Figure 15 also indicate that the stress field vanishes proportionate to the distance from the impact center. This can result in different values of the impact voltage for identical impacts but different sensor sizes. As the stress values in the contact region reached yield stress of the PVDF material, permanent deformation of the sensor occurs.
7. Discussions and Conclusions
Home-made PVDF sensors were produced, tested and compared to commercial PVDF sensors. The photolithography method was successfully used for the fabrication of home-made PVDF sensors. The sensitivities of the home-made PVDF sensors were higher than for the commercial variants. This can be influenced by the composition of the protection layers of the sensors. Note that for the measurement in the real cavitating flow, high sensor protection is required which, on the contrary, decreases the sensor sensitivity. The optimum between the sensor sensitivity and the sensor protection should be further investigated. The sensitivity of the sensors is also influenced by the sensors’ active area. A smaller active area corresponds to a higher sensitivity of the sensor. A smaller active area also corresponds to a better special resolution of the impacts measurement.
The duration of the signal generated by the calibration method should be close to the signal generated during the impact in the real cavitating flow. The breaking pencil lead method [
9] will be used to generate the calibration signal to prove this condition. The further work will be also focused on the application of the home-made PVDF films for the measurement of the cavitation impacts in the real cavitating flow.
The theoretical analysis indicates that the measured force is slightly underestimated which can origin it the assumption given by Equation (3). The material properties used for the analytical and the numerical simulation are based on the producer data and the variability, especially of the yield stress, can influence the maximum force obtained from the simulation.


