Article

Photocatalytic Degradation of Rhodamine B Dye in Aqueous Suspension by ZnO and M-ZnO (M = La3+, Ce3+, Pr3+ and Nd3+) Nanoparticles in the Presence of UV/H2O2

by
José C. González-Crisostomo
1,2,*,
Rigoberto López-Juárez
3 and
Vitalii Petranovskii
1
1
Centro de Nanociencias y Nanotecnología, Universidad Nacional Autónoma de México, Km 107 Carretera Tijuana-Ensenada, Ensenada 22800, Mexico
2
Facultad de Ciencias Químicas e Ingeniería, Universidad Autónoma de Baja California, Calzada Tecnológico, Mesa de Otay, Tijuana 22390, Mexico
3
Instituto de Investigaciones en Materiales, Unidad Morelia, Universidad Nacional Autónoma de México, Antigua Carretera a Pátzcuaro, Ex Hacienda San José de la Huerta, Morelia 58190, Mexico
*
Author to whom correspondence should be addressed.
Processes 2021, 9(10), 1736; https://doi.org/10.3390/pr9101736
Submission received: 2 September 2021 / Revised: 21 September 2021 / Accepted: 22 September 2021 / Published: 28 September 2021

Abstract

:
In this study, nanoparticles of five photocatalytic systems based on pure zinc oxide and with rare earths ions M-ZnO (M = La3+, Ce3+, Pr3+ or Nd3+) calcined at 500 °C or 700 °C were synthesized and investigated as potential photocatalysts for the removal of dyes. The addition of rare earth ions causes a decrease in the bandgap of ZnO; therefore, it can be well used to improve the photocatalytic properties. The photocatalytic activity of the synthesized nanoparticles was evaluated by the degradation of Rhodamine B in the presence of H2O2 under ultraviolet illumination. The results indicate that all the synthesized nanoparticles show good dye degradation efficiency. The highest degradation efficiency was 97.72% for the Ce-ZnO sample calcined at 500 °C and was achieved in 90 min with an excellent constant of the dye degradation rate k = 0.0363 min−1 following a first-order kinetic mechanism. The presence of oxychlorides as secondary phases inhibits the rate of the photocatalytic reaction.

1. Introduction

The preparation and study of nanoscale zinc oxide is currently of great interest. ZnO is a semiconductor material, which crystallizes in two main well-known forms: hexagonal wurtzite and cubic zinc blende. The structure of wurtzite is the most stable under environmental conditions [1]. Zinc oxide with a rock salt structure can be obtained at high pressures; it can also exist in nanostructured forms and, due to stabilization in matrices, a cubic structure (for example, MgO, NaCl) [2]. ZnO with wurtzite-like structure is thermodynamically stable, due to its tetrahedral structure, where each zinc atom is coordinated with four oxygen atoms. In any of the existing forms, ZnO is a semiconductor material with a wide and direct bandgap ranging from 3.1 to 3.3 eV and a gap bond energy of 60 meV, making it a material with low photocatalytic activity [3,4]. Due to its excellent dielectric, ferroelectric, piezoelectric and pyroelectric properties, ZnO is considered a multifunctional materials and has a wide range of applications such as solar cells [5], gas sensors [6], piezoelectric devices and field emission devices [7].
ZnO nanostructures have a large surface area and can be used for photocatalytic applications due to their high photosensitivity, high redox potential, low toxicity and high photocatalytic activity. However, one of the main disadvantages of nano-ZnO is associated with photocorrosion caused by exposure to light for extended periods of time [8]. Comparison of the photocatalytic activity of some semiconductor materials revealed that ZnO is the most active photocatalyst in the degradation of contaminants [9]. This activity is due to the absorption of a large fraction of the solar spectrum. It is clear that, if ZnO is used as a catalyst, a significant amount of visible light can be harnessed [10]. The main methods commonly used for the synthesis of ZnO nanoparticles are precipitation [11], spray pyrolysis [12], hydrothermal synthesis [13], electrochemical methods, microwave synthesis [14] and sol-gel [15].
ZnO is one of the ideal materials for the synthesis of nanocomposites doped with rare earths (RE). By varying particle size, morphology and doping agents, it is possible to expand the range of their visible luminescence from red to blue [16]. Doping with metal ions and surface modification are alternatives to improve the optical absorption of ZnO in the visible region [17,18,19]. Rare earth ions have partially filled 4f layers, and when they are included into suitable matrices, their intra-4f transitions become possible due to separation induced by the crystal field of the matrix [20,21]. Internal doping and efficient energy transfer from the ZnO host to RE ions is carried out [22]. Doping with rare earth elements provides many interesting properties of ZnO materials, including efficient modulation of emission in the visible range due to their unique optical properties [23].
Doping of crystalline ZnO with RE elements in a wide concentration range is difficult. The ionic size of the RE elements and the charge difference of trivalent ions and the Zn2+ ion practically prevent doping and lead to a low saturated concentration of RE3+ ions in the ZnO lattice; it should also be noticed the inappropriate location of the energy level of the RE3+ ion with respect to the valence and conduction bands of pure ZnO [24,25,26]. At the same time, such materials show very attractive properties. ZnO materials doped with lanthanum (La) exhibit excellent gas sensitivity and photocatalytic activity. Lanthanum plays an important role in regulating the size, bandgap and photoluminescence properties of ZnO nanoparticles [27,28]. The luminescent properties of Ce3+ ions make it suitable for a variety of applications such as scintillators for UV absorbing filters, ionizing radiation and cathodoluminescence devices. Ce3+ ions have received great attention in research due to their optical and catalytic properties, determined by their 4f levels [29]. Near-infrared emission of Nd3+ ions in the 860–1100 nm region is desirable for possible applications in biological tissues, since they have a maximum light transmission in the 850–1100 nm region [30]. In the present study, the synthesis of ZnO and M-ZnO (M = La3+, Ce3+, Pr3+ and Nd3+) nanoparticles was performed using the sol-gel method in the absence of a gelling agent for the degradation of the dye Rhodamine B. The synthesized nanoparticles were thermally treated at 500 °C and 700 °C. The results indicate that the morphological, crystalline, optical, surface properties and photocatalytic activity of the synthesized nanoparticles were influenced by the presence of RE ions and calcination temperature. Nanoparticles calcined at 500 °C showed higher specific surface areas and lower band gap values, as well as the best results of photocatalytic activity mostly. Our study demonstrates the efficiency of photocatalysts developed with applications in wastewater treatment of the textile industry.

2. Materials and Experimental Procedures

2.1. Materials and Chemical Reagents

For the synthesis of undoped and RE-doped ZnO, the following raw materials were used: Zinc nitrate hexahydrate Zn(NO3)2·6H2O, 98%; cerium nitrate hexahydrate Ce(NO3)2·6H2O, 99.9%; praseodymium nitrate hexahydrate Pr(NO3)2·6H2O, 99.9%; neodymium nitrate hexahydrate Nd(NO3)2·6H2O, 99.9%; and butanol C4H10O, 99.5% were supplied by Aldrich Chemical Company, Inc. Lanthanum nitrate hexahydrate La(NO3)3·6H2O, 99.9%, was obtained from J.T. Baker and hydrochloric acid HCl, 37%w/w, from Fermont, while ammonium hydroxide NH4OH, and hydrogen peroxide H2O2, 50%w/w were obtained from Jalmek. Finally, Rhodamine B was obtained from Fluka.

2.2. Chemical Synthesis of ZnO and M-ZnO (M = La3+, Ce3+, Pr3+ and Nd3+) Nanoparticles

RE-doped ZnO nanoparticles were prepared by the sol-gel method. The initial amounts of nitrates for each synthesis were calculated in accordance with the formula Zn1-xM2/3xO (M = La3+, Ce3+, Pr3+ y Nd3+), with x = 0 (pure ZnO) and 0.05 (M-ZnO). Zinc nitrate Zn(NO3)2·6H2O [Zn2+ (1-x) mol] was dissolved in butanol (20 mL), and the calculated amount of RE nitrate [RE3+ (2/3x) mol] was added to the clear solution. Table 1 shows the amounts of hexahydrate nitrates used. The resulting mixture was stirred for 1 h. The reaction-critical pH was maintained at 4 with HCl or NH4OH solutions. The condensation reaction led to the formation of a local polymeric structure within the sol particles with Zn (Ce/La/Nd/Pr)-O-Zn fragments. The mixture was then heated to 80 °C for several hours until it was completely gelled to obtain smaller homogeneous gel particles. The gel was dried at 100 °C for 24 h to obtain a xerogel. Then, the xerogel was placed in the furnace (Thermolyne-46100) and calcined to 500 °C and 700 °C for 3 h, at a heating rate of 5 °C/min an air atmosphere to remove inorganic groups and obtain an oxide phase.
The resulting final products were further labeled in the text and figures as ZnO, La-ZnO, Ce-ZnO, Pr-ZnO and Nd-ZnO.

2.3. Characterization Methods

The crystalline phases of the obtained nanoparticles calcined at both 500 °C and 700 °C were characterized by X-ray diffraction. For this purpose, a Bruker 08 Advance XRD equipment was used with Cu tube (Kα radiation, λ = 1.54056 Å) in the 2-theta range from 20° to 80° with a 0.020° 2θ scan step and 1.2 s step time per each data point. Nanoparticles of all samples were observed using a JEOL JSM-7600F scanning electron microscope. In order to identify the presence of functional groups in nanoparticles calcined at 500 °C and 700 °C, Fourier transform IR spectra were recorded using an FTIR OMNIC 9 infrared spectrometer (Thermo Fisher Scientific Inc.) in the wavenumber range from 4000 to 400 cm−1. The specific surface area, total pore area and total pore volume of the synthesized nanoparticles were determined by measurements of nitrogen adsorption–desorption isotherms at −196 °C taken P/P0 from 0 to 0.99 using a Micromeritics Tristar II apparatus on degassed samples at 300 °C under vacuum. The specific surface area was calculated by Brunauer–Emmett–Teller (BET) method between 0.1 and 0.3 relative pressures. Total pore area and total pore volume were determined by Barret–Joyner–Halenda (BJH) method. Measurements of UV–Vis diffuse reflectance spectroscopy (DRS) of the obtained materials were performed in the wavelength range from 200 to 800 nm using a Cary 5000 spectrometer. UV–Vis measurements of RhB photocatalytic degradation products were recorded in the wavelength range from 400 to 650 nm using a spectrometer Hach DR 5000.

2.4. Photocatalytic Degradation of Rhodamine B

The photocatalytic properties of the of ZnO, La-ZnO, Ce-ZnO, Pr-ZnO and Nd-ZnO nanoparticles calcined at 500 °C and 700 °C d were evaluated in the decomposition reaction of Rhodamine B (RhB) dye, which was carried out in a Pyrex vessel-type reactor, under UV illumination using a UV lamp UVP UVGL-58, 254/365 nm, 6W. RhB solutions of concentration 1 × 10⁻⁵ mol · L−1 were used. For degradation test, 80 mL of the solution was added 80 mg of nanoparticles of one of the photocatalyst calcined at 500 °C or 700 °C and 2.0 mL of H2O2; the pH was adjusted to 3 with HCl or NH4OH. Prior to irradiation with UV light, the suspension was kept under stirring for 30 min in the dark to achieve an adsorption–desorption balance between the dye and the photocatalyst. Then the dye suspension was irradiated with UV light with constant stirring. The dye sample was periodically removed every 15 min and centrifuged at 3000× g rpm to separate the photocatalyst. The degradation rate was calculated using the following equation:
D y e   d e g r a d a t i o n   e f f i c i e n c y = 1 C C 0 × 100
where C y C0 are the final and initial concentration of RhB dye in the solution.

3. Results and Discussion

3.1. Characterization of ZnO and M-ZnO (M = La3+, Ce3+, Pr3+ and Nd3+) Photocatalysts

Figure 1 illustrates the XRD patterns of the ZnO, La-ZnO, Ce-ZnO, Pr-ZnO and Nd-ZnO nanoparticles calcined at 500 °C and 700 °C in the range from 20 to 80° 2 theta. The existence of well-crystallized ZnO (JCPDS number 00-036-1451) of zincite type with a hexagonal crystal structure (space group: P63mc (186); a = 0.3249 nm, c = 0.5206 nm) is confirmed by well-defined, intense and thin peaks. The average crystal size was calculated using the Debye–Scherrer equation, which states that the grain size is inversely proportional to the average width of the maximum diffraction peak and the cosine of the maximum peak angle, according to Equation (2):
τ = K λ β C o s θ B
where τ is the mean size of the crystalline domains, which may be smaller or equal to the grain size; λ is the wavelength of X-ray radiation; K = 0.94, that is, a dimensionless shape factor with a value close to unity but that varies with the actual shape of the crystallite; β is the mean width of the peak in radians at half the maximum intensity (FWHM) and θB is the diffraction angle (Bragg angle) of the peak with the highest intensity. In Figure 1, the peaks of the highest intensity are at values of 2θ equal to 31.765°, 34.428°, 36.262°, 47.554°, 56.609°and 62.870°, which correspond to the (hkl) of the following planes: (100), (002), (101), (102), (110) and (103), respectively. Lattice constants a and c for hexagonal system was calculated using the following formula, Equation (3) [31]:
1 d h k l 2 = 4 3 h 2 + h k + k 2 a 2 + l 2 c 2
according to Bragg’s law, where n is the diffraction order (usually n = 1); d is the lattice spacing; a and c are the lattice constants; h, k and l are the Miller indices; θ is the corresponding peak angle and λ is the X-ray wavelength. For (100) and (002) diffraction planes, the lattice constants a and c were calculated, respectively, using the following formulas, Equations (4) [25]:
a = λ 3 S e n θ           a n d ,           c = λ S e n θ
The unit cell volume is given by the formula V = (0.866) a2c [32].
The relative intensity of the ZnO (101) peak is higher than the intensities of other ZnO peaks, which indicates the predominant growth of nanoparticles. For the doped samples La-ZnO and Ce-ZnO calcined at 500 °C and 700 °C, although the preferential growth of the nanoparticles remains in the (101) plane, the intensity of the (100) peak shows the appearance of a second preferred direction of growth. At the same time, in the samples Pr-ZnO and Nd-ZnO calcined at 500 °C and 700 °C, even though the intensity of the (101) peak is slightly higher, the intensities of the (100) and (002) peaks are very close, showing growth preferences for these planes (002) and (100). The following secondary phases were found in some samples: LaOCl (JCPDS number 01-088-0064) with a tetragonal crystal structure in La-ZnO; CeO2 (JCPDS number 03-065-5923) with a face-centered cubic crystal structure in Ce-ZnO; Pr12O22 (JCPDS number 01-089-0573) with monoclinic crystalline structure; PrOCl (JCPDS number 01-085-0948) with a tetragonal crystal structure in Pr-ZnO and NdOCl (JCPDS number 01-085-1198) with a tetragonal crystal structure in Nd-ZnO. The compounds that were identified as oxychlorides are due to pH adjustment during synthesis with hydrochloric acid solution.
Table 2 shows the results for crystallite size, unit cell parameters and unit cell volume. The crystallite size for several samples ranges from 40 to 44 nm. The estimated sizes for impurity phases give the following values: LaOCl ~36 nm, CeO2 ~15 nm, Pr12O22 ~15 nm, PrOCl ~32 nm, NdOCl ~26 nm. The data for the a and c lattice constants of ZnO and RE-doped ZnO are shown in Table 2. It can be observed that the lattice parameter a changes very slightly, but the lattice parameter c decreases in all samples; this may be because La3+, Ce3+, Pr3+ and Nd3+ trivalent ions with different ionic radii will replace Zn2+ ions, breaking the matching in ionic radii and decreasing the number of oxygen vacancies in the crystal lattice. A small change in the c/a ratio is observed for doped samples, considering the change in the third decimal place, except for the Nd-ZnO samples, which show a slightly decrease. The specific volume decreases related to the reference ZnO (ZnO calcined to 500 °C) by about 0.36%.
Fourier transform infrared analysis performed on samples to analyze changes in the Zn-O bond is shown in Figure 2. The spectra show an absorption band at 3486 cm−1 that corresponds to the O-H bond vibration caused by atmospheric humidity on the ZnO surface. The absorption band at 2165 cm−1 indicates the presence of O=C=O bonds due to the absorption of CO2 from the air due to the porosity of these materials. The peaks at 1385 and 1506 cm−1 correspond to C=O bonds. Strong absorption bands between 554 and 445 cm−1 are attributed to vibrations of the Zn-O bond of nanoparticles [32]; for Pr-ZnO, it is shifted to a higher frequency at 418 cm−1, while the Ce-ZnO sample presents peaks at 403 and 418 cm−1, which can be associated with the ZnO bond vibration and the formation of CeO2 [32]. The band that appears at 409–452 cm−1 is attributed to the stretching frequency of the Nd-O bond [34]. Peaks at 706, 542 and 482 cm−1 indicate the presence of LaOCl, PrOCl and NdOCl. The peaks at 706 cm−1 are possibly related to of La-Cl, Pr-Cl or Nd-Cl vibrations, as appropriate for each sample [35,36].
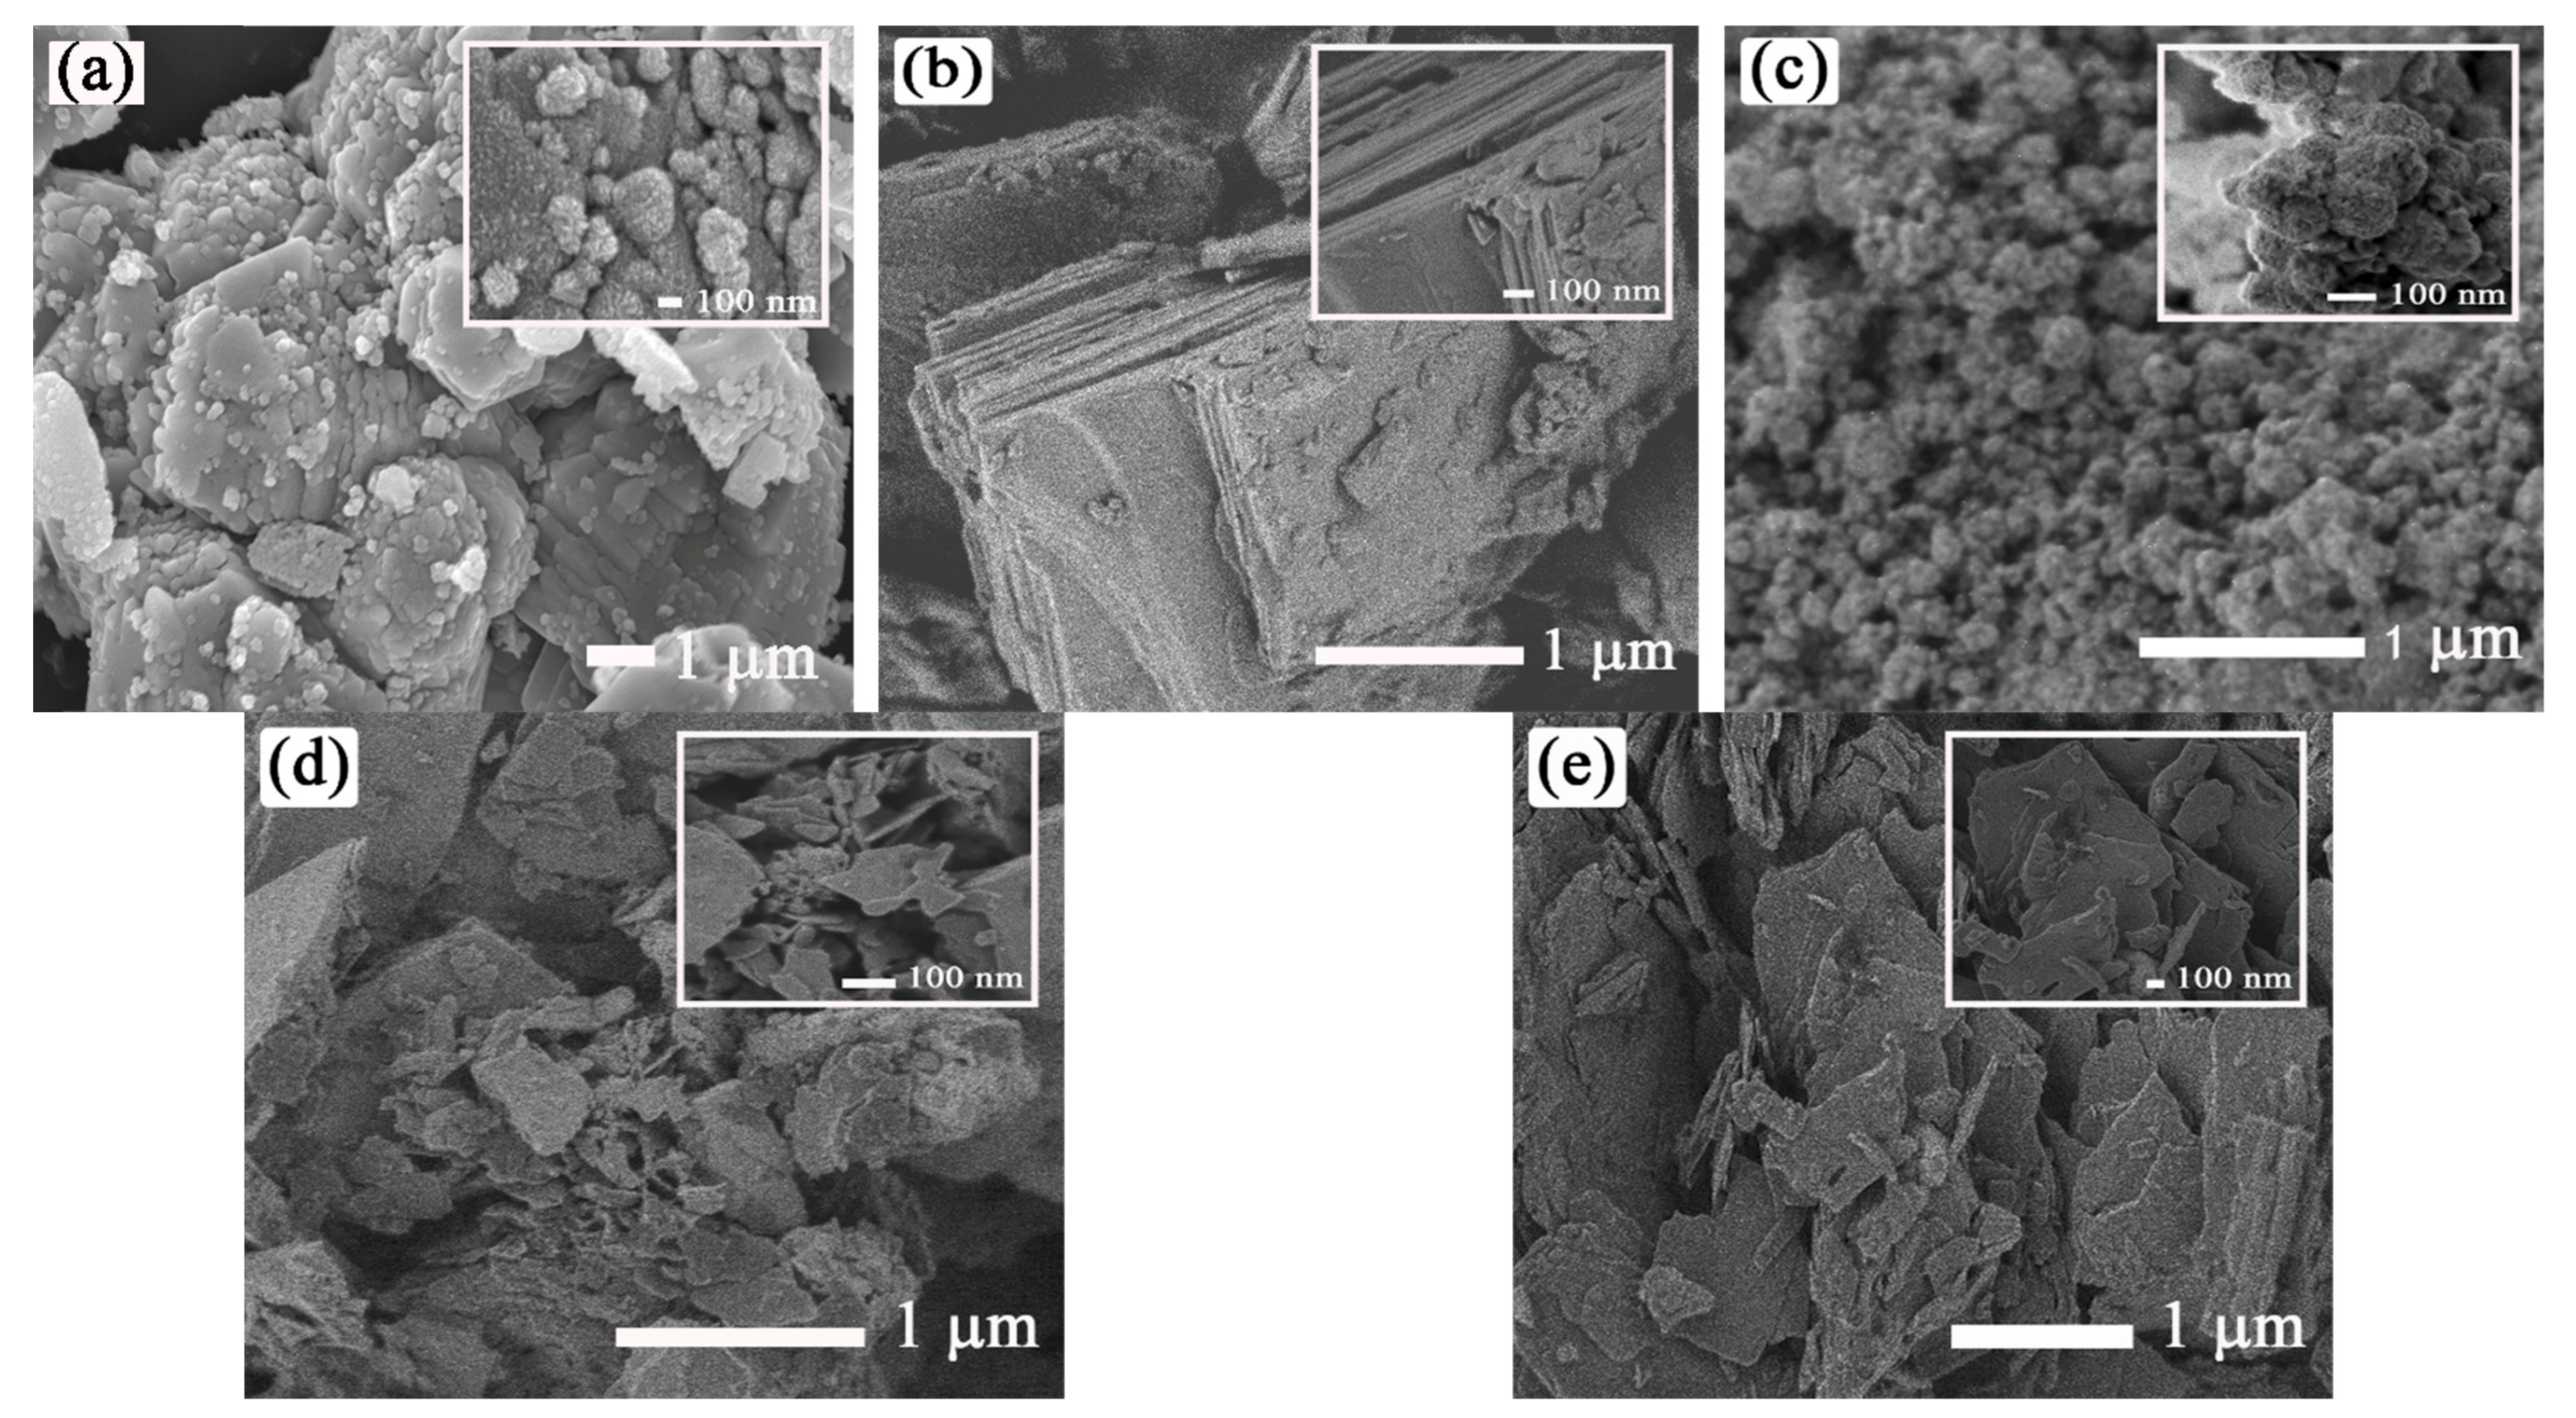
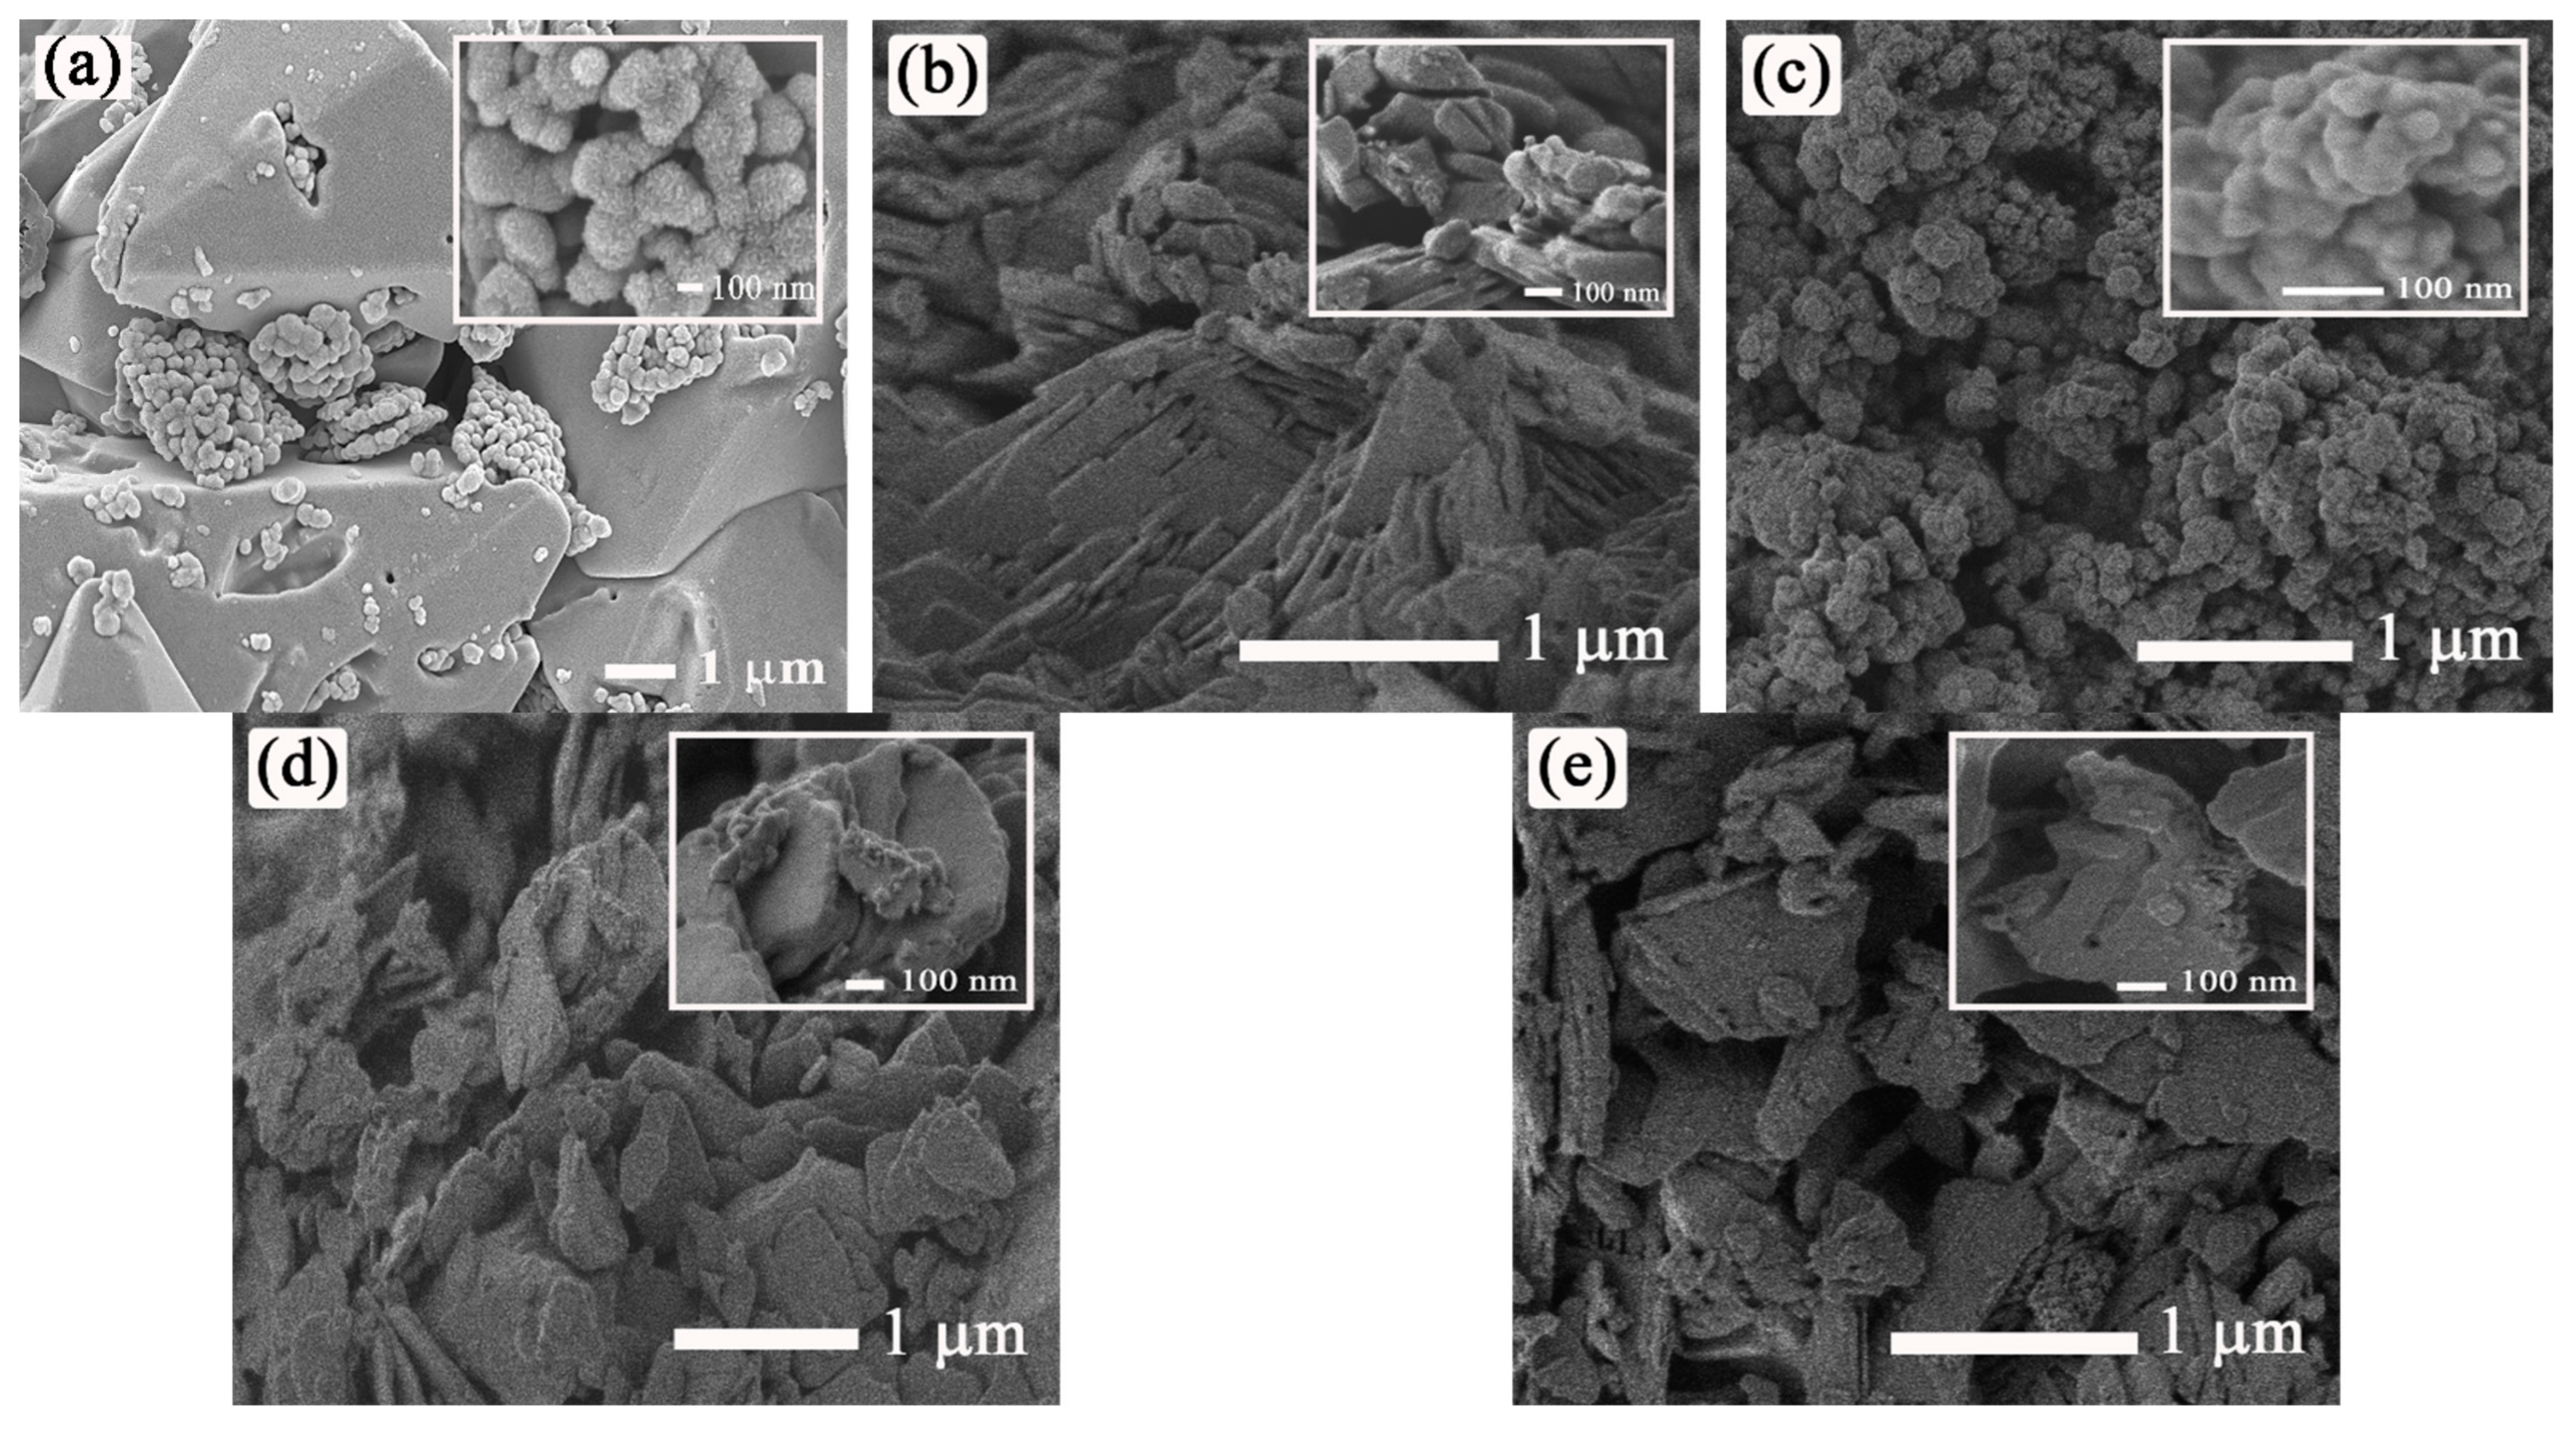
Figure 3 and Figure 4 show SEM images of all obtained samples calcined at 500 °C (Figure 3) and 700 °C (Figure 4), respectively. The morphology of the nanoparticles loses uniformity during the synthesis process, which is consistent with the differences in intensities observed on XRD (Figure 1).
In Figure 3a and Figure 4a, La-ZnO nanoparticles are shown. Formation of particles wit laminar type is observed, with the preservation of the nanometric size in one of their dimensions. Figure 3c and Figure 4c represent Ce-ZnO nanoparticles. In these images, many aggregate pseudospherical particles with a diameter ~40 nm are observed. Figure 3d,e and Figure 4d,e show the morphology of Pr-ZnO and Nd-ZnO nanoparticles calcined at 500 °C and 700 °C, respectively. It is noteworthy to observe the lack of uniformity that can be explained by the aggregation of ZnO nanoparticles and the growth of irregular crystal grains during synthesis.
Table 3 shows the results obtained using the BET and BJH methods. It can be observed that almost all samples have a small surface area. When the gel is prepared and an intermediate material consisting of primary nanoparticles is formed, they first agglomerate. When the xerogel is calcined at 500 °C or 700 °C, this treatment transforms the agglomerates into aggregates, which consequently significantly reduces the surface area and pore volume. When primary nanoparticles are combined into groups by interparticle bonding and sintering, the final assemblies are polycrystalline [37,38]. The Ce-ZnO samples exhibits the highest BET surface area among all synthesized materials, which is consistent with the SEM images (Figure 3 and Figure 4), while the particles are uniform in shape and size. The accumulated pore surface area in adsorption–desorption processes was more noticeable in the Ce-ZnO sample calcined at 500 °C, as was the total area and volume in the DFT pores. The pore size indicates the presence of mesoporous structures.
The optical properties of nanoparticles of all samples calcined at 500 and 700 °C were studied by UV–Vis diffuse reflectance spectroscopy (DRS), and the results are shown in Figure 5. The nanoparticles have a pronounced optical absorption edge located in the range of λ from 333 to 380 nm (in the region near UV rays), which corresponds to the transition of electrons from the valence to the conduction bands according to the energy band structure of ZnO. However, Pr-ZnO nanoparticles presented an absorption maximum at 235 nm and an absorption intensity in the range from 448 nm to 800 nm, which indicates the activity of these nanoparticles in visible light [39]. Nd-ZnO nanoparticles have different absorption peaks from 500 to 800 nm, indicating their ability to absorb visible light photons [40]. The bandgap Eg of nanoparticles was calculated with the following well-known equation:
α = A h v E g 1 / 2 h v
where α, Eg and A are the absorption coefficient, bandgap and material parameter, respectively. Extrapolation of the linear region of (αhv)2 vs. hv plots (Figure 6) provides the bandgap for the investigated nanoparticles calcined at 500 and 700 °C. The calculated bandgap values are shown in Figure 6 and Table 4. As observed, the presence of secondary phases does not make a direct contribution to the bandgap of the samples compared with ZnO. As can be seen in Figure 1, the peaks of the secondary phases are quite noticeable, so it would be expected to observe contribution from such impurities as LaOCl (Eg = 5.53 eV) [41] in the La-ZnO samples and the CeO2 (Eg = 3.71 eV) [42] in Ce-ZnO samples; the bandgaps of Pr12O22, PrOCl and NdOCl have not been found in the literature. In the obtained materials, a decrease in the bandgap of undoped ZnO (3.12 eV) is observed (with the exception of Ce-ZnO and Nd-ZnO, calcined at 700 °C). This decrease can be explained by charge transfer between electrons of the 4f level of RE ions and the conduction band of ZnO [43,44].

3.2. Photocatalytic Activity of ZnO and M-ZnO (M = La3+, Ce3+, Pr3+ and Nd3+) Nanoparticles

Photocatalytic reaction consists in the generation of an electron–hole pair by semiconductor nanoparticles by applying photons with an energy exceeding the bandgap of the material under study, while an electron of the valence band is excited into the conduction band, migrating to the surface of the particle. These charge-carrying species can react with absorbed molecules, as is the case of RhB. One of the factors that can affect the degradation of the dye is pH, since pH affects not only the surface properties of ZnO but also the dissociation of dye molecules and the formation of hydroxyl radicals. Under acidic conditions, the perhydroxyl radical can form hydrogen peroxide, which in turn gives rise to the hydroxyl radical [45]. Experiments previous to those reported here were carried out using only UV light and photocatalyst. Observed is that the RhB degrades very slowly. AlHamedi et al. investigated that using H2O2 in the presence of UV light increases the generation of hydroxyl radicals, causing discoloration of the solution [46]. For this reason, it was decided to carry out the degradation reactions of RhB at pH 3 and use H2O2. RhB is a typical pollutant in the wastewater of the textile industry. Degradation of RhB was studied in the presence of nanoparticles of all prepared calcined at 500 °C and 700 °C in the presence of H2O2 under UV–Vis light irradiation for a period of 120 min. Figure 7 and Figure 8 show the time-varying UV–Vis spectra of the RhB dye in the presence of nanoparticles of all catalysts under study, calcined to 500 °C (Figure 7) and to 700 °C (Figure 8), respectively, in the reaction mixture, upon irradiation with UV–Vis light for a period of 120 min. Spectra show the maximum absorption wavelength at ~554 nm. RhB absorbance intensities gradually decrease with increasing exposure time, indicating a decrease in the RhB dye concentration.
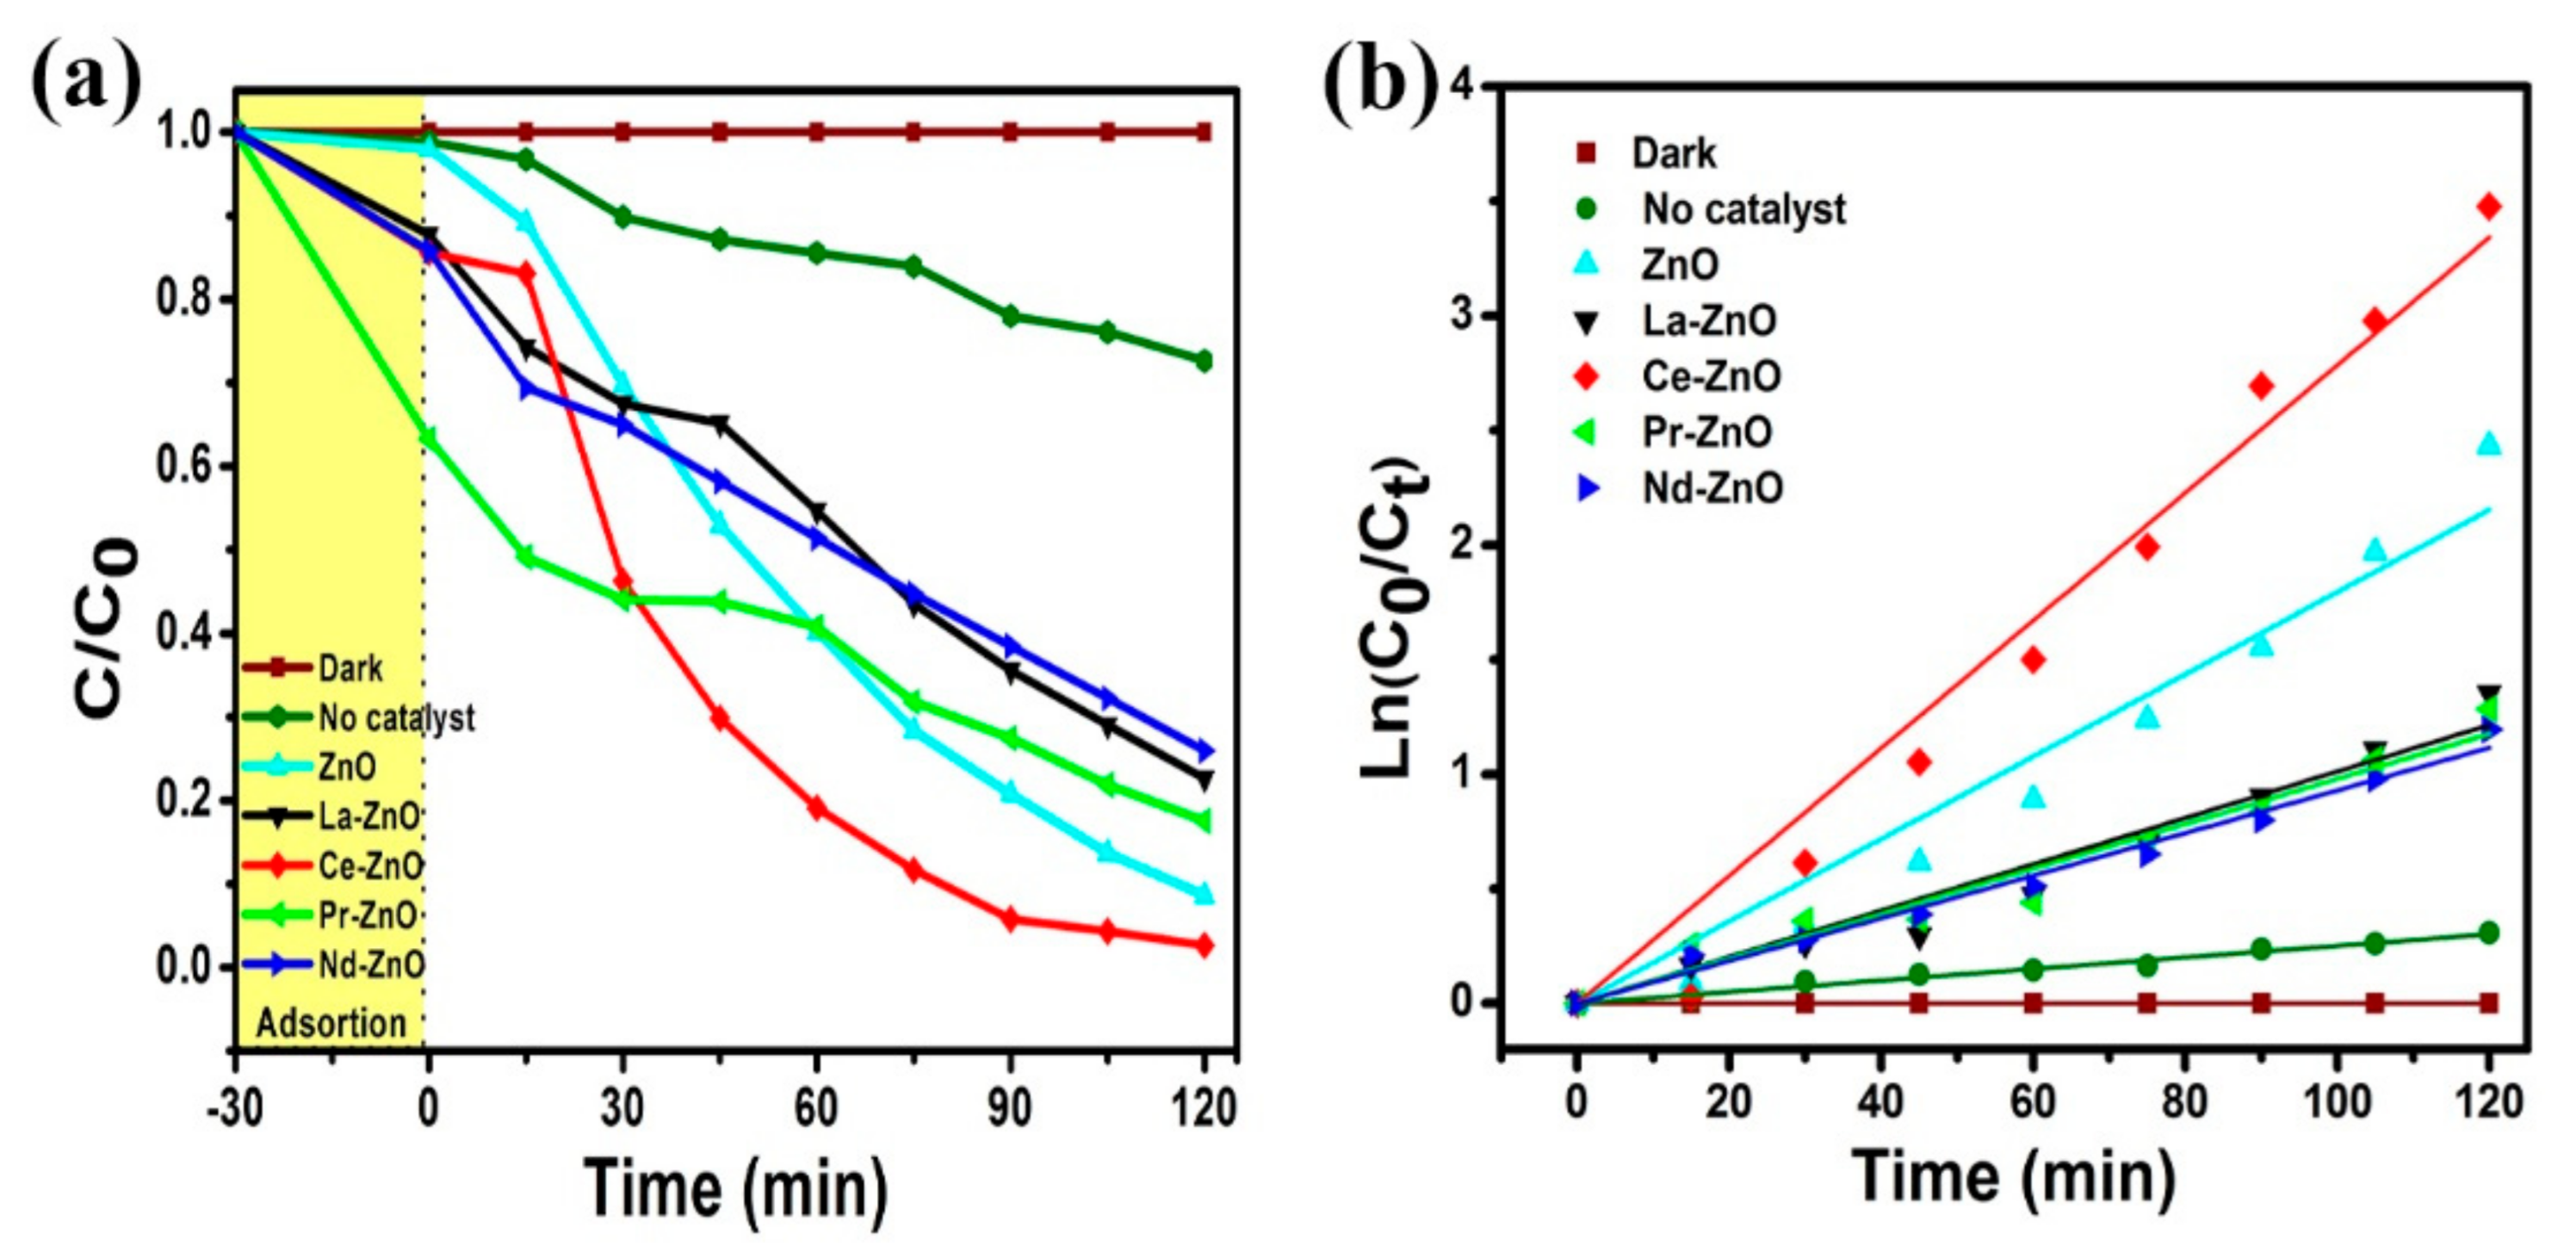
Figure 9a and Figure 10a show the degree of degradation of RhB in the presence of photocatalyst nanoparticles calcined at 500 °C (Figure 9a) and 700 °C (Figure 10a) as a function of exposure time to UV light. In this graph, it can be seen that RhB in the dark and in the presence of H2O2 did not degrade. Another of the experiments carried out in order to know if the photocatalysts influenced the degradation of RhB was in the absence of a photocatalyst (only dye and H2O2), degrading 27.37%. For the other samples, it can be seen that the relative concentration of the RhB dye significantly decreased with exposure to ultraviolet radiation over time. It was also observed that nanoparticles caused different kinetics of concentration reduction.
For all photocatalysts, some RhB dye absorption occurs within 30 min under the exposure in the dark. The most significant absorption of the dye can be seen in Pr-ZnO nanoparticles calcined at both 500 °C and 700 °C. This absorption by nanoparticles is associated with a change in the physical or chemical properties of ZnO due to doping. Pr3+ ions (like ions of any other RE) can form chemical complexes with azo dyes, such as RhB [47,48], which determine the absorption capacity of the prepared materials. Pr-ZnO nanoparticles calcined at both temperatures and Ce-ZnO nanoparticles calcined at 500 °C caused the greatest decrease in the RhB concentration compared to other nanoparticles.
The data in the graphs in Figure 9a and Figure 10a were adjusted according to the pseudo-first-order kinetic model to determine the kinetic velocity of each assay. Figure 9b and Figure 10b present the graphs of the degradation kinetics of the RhB dye in the reaction mixture by nanoparticles of synthesized samples calcined at both temperatures under irradiation with UV light. The values of the kinetic velocity constant are presented in Table 4. In agreement with the highest result for surface area BET, Ce-ZnO nanoparticles calcined at 500 °C and 700 °C present the highest values of kinetic rate constants for RhB degradation, which are 3.63 × 10⁻² min−1 and 2.79 × 10⁻² min−1, respectively (Table 4). The percentage of RhB degradation efficiency as a function of time was also determined from the data in the graphs in Figure 9a and Figure 10a, the results of which are shown in Table 4. The Ce-ZnO nanoparticles calcined at 500 °C and 700 °C demonstrated high degradation, reaching values 97.72% in 90 min and 97.36% in 120 min, respectively. Other nanoparticles produced gradual degradation and, to a lesser extent, reaching values of 96.81% for Pr-ZnO nanoparticles, calcined at 500 °C and irradiated for 120 min. Eight samples of RE-doped ZnO nanoparticles calcined at 500 °C and 700 °C degraded RhB in the reaction mixture through the photocatalytic process under UV light, although Ce-based nanoparticles presented the best photodegradation efficiency, which may be attributed to the absence of oxychloride compound as a secondary, unlike other systems in which they are present, and these compounds can inhibit the photocatalytic degradation of the RhB dye [49].
The calcination temperature causes variation in the morphological, surface and optical properties of the samples influencing their photocatalytic activity. The band gap of the samples calcined at 500 °C was lower than that of those calcined at 700 °C (Table 4), influencing the photoexcitation process of the electrons as they passed from the valence band to the conduction band. As can be seen in the RhB degradation results (Table 4), the Ce-ZnO samples showed the best degradation efficiency results. This may be because these samples have a regular pseudospherical morphology, with aggregates of nanoparticles (Figure 3c and Figure 4c) also showing the largest BET surface area, while the La-ZnO samples were the ones that showed a lower efficiency in the degradation of RhB, which were larger particles with the smallest BET surface area and therefore with fewer active sites for the photocatalysis process.
Degradation of RhB in the reaction mixture by nanoparticles of all synthesized photocatalysts under the action of UV radiation is caused by the stimulation of the transition of electrons from the conduction band (CB) to the valence band (VB); this generates electrons in the conduction band (eCB) and electron holes in the valence band (hVB+). On the surface of the photocatalyst, redox reactions take place with the molecules present on the surface.
Electrons eCB located on the surface can react with O2 to produce superoxide anion (O2), while hVB+ can react with H2O or OH- bound on the surface to generate OH radicals. O2 can react with H+ to produce H2O2 and generate OH, and these radicals can react with the RhB dye and degrade it.
Z n O + h v Z n O ( e C B + h V B + )
H 2 O + h V B + O H + H   +
O 2 + e C B O 2  
2 H + + 2 O 2   H 2 O 2 + O 2
H 2 O 2 + h v 2 O H  
  O H + d y e i n t e r m e d i a t e s p r o d u c t s
Degradation in the presence of H2O2 is due to an increase in the concentration of hydroxyl radicals, as shown in Equations (12) and (13) [50]:
Z n O e C B + H 2 O 2 Z n O +   O H + O H
H 2 O 2 h v   O H +   O H
As mentioned earlier, eCB- and hVB+ located on the surface can generate these reactive oxygen species (O2, OH, O2), which are responsible for the degradation of the RhB dye. This is consistent with the data for SEM images of nanoparticles of various photocatalysts synthesized in this work. A higher density of grain boundaries and defects is observed in the Ce-ZnO samples, which generates the largest number of active centers, which leads to the rapid photocatalytic degradation of the RhB dye.
The reaction of Ce3+ ions with the O2 molecule produce superoxide anion (O2) and Ce4+ ions according to the following mechanism [33]:
Z n O + h v e C B + h V B +
C e 4 + + e C B C e 3 +
C e 3 + + O 2 O 2   + C e 4 +
On the contrary, in the samples of the other three doped photocatalysts, M-ZnO (M = La3+, Pr3+ and Nd3+), which form oxychloride compounds as the second phase, larger particles are observed, which, although they have a nanometric size in at least one of their dimensions, have a lower density of grain boundaries, causing a decrease in the density of OH· y hVB+ on the surface accessible for the reaction [46,49].

4. Conclusions

Nanoparticles of four photocatalytic systems based on zinc oxide with RE ions, M-ZnO (M = La3+, Ce3+, Pr3+ and Nd3+) were synthesized by the sol-gel method using zinc nitrate and the corresponding nitrates of rare earth elements (La, Ce, Pr and Nd). The resulting solid phases were calcined at 500 °C or 700 °C. The structural, morphological and optical properties of the obtained samples were characterized using XRD, SEM, BET and UV–Vis DRS techniques. Nanoparticles of all prepared photocatalysts showed a crystallite size of 40 to 44 nm. Photocatalytic evaluation was carried out by degrading the RhB dye in the presence of H2O2 at pH 3 under UV illumination using suspensions of synthesized nanoparticles. The best results for the RhB dye degradation were shown by Ce-ZnO nanoparticles, reaching 97.72 % with an excellent constant rate for the degradation of the dye k = 0.0363 min−1 following a first-order kinetic mechanism. The presence of oxychlorides as secondary phases inhibits the degradation rate of the dye, eliminating radicals (OH·and hVB+), which contribute to the degradation of the RhB.

Author Contributions

J.C.G.-C., Conceptualization, Methodology, Investigation, Writing—Original Draft; R.L.-J., Resources, Writing—Review and Editing; V.P., Resources, Writing—Review and Editing, Supervision. All authors have read and agreed to the published version of the manuscript.

Funding

This research received no external funding.

Institutional Review Board Statement

Not applicable.

Informed Consent Statement

Not applicable.

Data Availability Statement

The raw/processed data required to reproduce these findings cannot be shared at this time as the data also form part of an ongoing study.

Acknowledgments

The authors would like to thank Adriana Tejeda and Omar Novelo of the Instituto de Investigaciones en Materiales of the Universidad Autónoma de México for the XRD measurements and SEM images, respectively, and Rosario Isidro Yocupicio of the Centro de Nanociencias y Nanotecnología of the Universidad Nacional Autónoma de México for the DRS measurements.

Conflicts of Interest

The authors declare no conflict of interest.

References

  1. Sugimoto, T. Metal Oxides; CRC Press Fr. Gr.: Boca Raton, FL, USA, 2006; pp. 133–194. [Google Scholar] [CrossRef]
  2. Solozhenko, V.L.; Kurakevych, O.O.; Sokolov, P.S.; Baranov, A.N. Kinetics of the wurtzite-to-rock-salt phase transformation in Zno at high pressure. J. Phys. Chem. A 2011, 115, 4354–4358. [Google Scholar] [CrossRef]
  3. Marotti, R.E.; Guerra, D.N.; Bello, C.; Machado, G.; Dalchiele, E.A. Bandgap energy tuning of electrochemically grown ZnO thin films by thickness and electrodeposition potential. Sol. Energy Mater. Sol. Cells 2004, 82, 85–103. [Google Scholar] [CrossRef]
  4. Espitia, P.J.P.; Soares, N.D.F.F.; Coimbra, J.S.d.R.; de Andrade, N.J.; Cruz, R.S.; Medeiros, E.A.A. Zinc Oxide Nanoparticles: Synthesis, Antimicrobial Activity and Food Packaging Applications. Food Bioprocess Technol. 2012, 5, 1447–1464. [Google Scholar] [CrossRef]
  5. Yu, L.; Hao, W.; Li, Z.; Ren, X.; Yang, H.; Ma, H. Synthesis of ZnO core/shell hollow microspheres to boost light harvesting capability in quantum dots-sensitized solar cell. Chem. Phys. Lett. 2021, 764, 138283. [Google Scholar] [CrossRef]
  6. Pradeep, N.; Venkatraman, U.; Grace, A.N. Flexible hydrogen gas sensor: ZnO decorated SnO2 nanowire on over head projector (OHP) sheet substrate. Mater. Today Proc. 2021, 45, 4073–4080. [Google Scholar] [CrossRef]
  7. Tong, X.; Zhang, S.; Xue, X.; Lu, G. Unique approach to change ZnO appearance and its properties during its growth: Current. Mater. Lett. 2015, 139, 311–313. [Google Scholar] [CrossRef]
  8. Goulart, L.A.; Santos, G.O.S.; Eguiluz, K.I.B.; Salazar-Banda, G.R.; Lanza, M.R.V.; Saez, C.; Rodrigo, M.A. Towards a higher photostability of ZnO photo-electrocatalysts in the degradation of organics by using MMO substrates. Chemosphere 2021, 271, 129451. [Google Scholar] [CrossRef] [PubMed]
  9. Chakrabarti, S.; Dutta, B.K. Photocatalytic degradation of model textile dyes in wastewater using ZnO as semiconductor catalyst. J. Hazard. Mater. 2004, 112, 269–278. [Google Scholar] [CrossRef] [PubMed]
  10. Sakthivel, S.; Neppolian, B.; Shankar, M.V.; Arabindoo, B.; Palanichamy, M.; Murugesan, V. Solar photocatalytic degradation of azo dye: Comparison of photocatalytic efficiency of ZnO and TiO2. Sol. Energy Mater. Sol. Cells 2003, 77, 65–82. [Google Scholar] [CrossRef]
  11. Abdeldayem, H.M.; Al-Shihry, S.S.; Hassan, S.A. Selective methanol oxidation to hydrogen over Ag/ZnO catalysts doped with mono- and Bi-rare earth oxides. Ind. Eng. Chem. Res. 2014, 53, 19884–19894. [Google Scholar] [CrossRef]
  12. He, L.; Tong, Z.; Wang, Z.; Chen, M.; Huang, N.; Zhang, W. Effects of calcination temperature and heating rate on the photocatalytic properties of ZnO prepared by pyrolysis. J. Colloid Interface Sci. 2018, 509, 448–456. [Google Scholar] [CrossRef] [PubMed]
  13. Gao, S.; Zhang, H.; Deng, R.; Wang, X.; Sun, D.; Zheng, G. Engineering white light-emitting Eu-doped ZnO urchins by biopolymer-assisted hydrothermal method. Appl. Phys. Lett. 2006, 89, 123125. [Google Scholar] [CrossRef]
  14. Wojnarowicz, J.; Chudoba, T.; Lojkowski, W. A Review of Microwave Synthesis of Zinc Oxide Nanomaterials: Reactants, Process Parameters and Morphoslogies. Nanomaterials 2020, 10, 1086. [Google Scholar] [CrossRef]
  15. Shirdel, B.; Behnajady, M.A. Sol-gel synthesis of Ba-doped ZnO nanoparticles with enhanced photocatalytic activity in degrading Rhodamine B under UV-A irradiation. Optik (Stuttg) 2017, 147, 143–150. [Google Scholar] [CrossRef]
  16. Kalaiezhily, R.K.; Saravanan, G.; Asvini, V.; Vijayan, N.; Ravichandran, K. Tuning violet to green emission in luminomagnetic Dy, Er co-doped ZnO nanoparticles. Ceram. Int. 2018, 44, 19560–19569. [Google Scholar] [CrossRef]
  17. Wu, C.; Shen, L.; Yu, H.; Zhang, Y.C.; Huang, Q. Solvothermal synthesis of Cu-doped ZnO nanowires with visible light-driven photocatalytic activity. Mater. Lett. 2012, 74, 236–238. [Google Scholar] [CrossRef]
  18. Lu, X.; Liu, Z.; Zhu, Y.; Jiang, L. Sonochemical synthesis and photocatalytic property of zinc oxide nanoparticles doped with magnesium(II). Mater. Res. Bull. 2011, 46, 1638–1641. [Google Scholar] [CrossRef]
  19. El Mir, L. Luminescence properties of calcium doped zinc oxide nanoparticles. J. Lumin. 2017, 186, 98–102. [Google Scholar] [CrossRef]
  20. Geburt, S.; Stichtenoth, D.; Müller, S.; Dewald, W.; Ronning, C.; Wang, J.; Jiao, Y.; Rao, Y.Y.; Hark, S.K.; Li, Q. Rare earth doped zinc oxide nanowires. J. Nanosci. Nanotechnol. 2008, 8, 244–251. [Google Scholar] [CrossRef]
  21. Röder, R.; Geburt, S.; Zapf, M.; Franke, D.; Lorke, M.; Frauenheim, T.; da Rosa, A.L.; Ronning, C. Transition Metal and Rare Earth Element Doped Zinc Oxide Nanowires for Optoelectronics. Phys. Status Solidi Basic Res. 2019, 256, 1800604. [Google Scholar] [CrossRef] [Green Version]
  22. Ji, S.; Yin, L.; Liu, G.; Zhang, L.; Ye, C. Synthesis of rare earth ions-doped ZnO nanostructures with efficient host-guest energy transfer. J. Phys. Chem. C 2009, 113, 16439–16444. [Google Scholar] [CrossRef]
  23. Manikandan, A.; Manikandan, E.; Meenatchi, B.; Vadivel, S.; Jaganathan, S.K.; Ladchumananandasivam, R.; Henini, M.; Maaza, M.; Aanand, J.S. Rare earth element (REE) lanthanum doped zinc oxide (La: ZnO) nanomaterials: Synthesis structural optical and antibacterial studies. J. Alloys Compd. 2017, 723, 1155–1161. [Google Scholar] [CrossRef] [Green Version]
  24. Zeng, X.; Yuan, J.; Zhang, L. Synthesis and photoluminescent properties of rare earth doped ZnO hierarchical microspheres. J. Phys. Chem. C 2008, 112, 3503–3508. [Google Scholar] [CrossRef]
  25. Khatamian, M.; Khandar, A.A.; Divband, B.; Haghighi, M.; Ebrahimiasl, S. Heterogeneous photocatalytic degradation of 4-nitrophenol in aqueous suspension by Ln (La3+, Nd3+ or Sm3+) doped ZnO nanoparticles. J. Mol. Catal. A Chem. 2012, 365, 120–127. [Google Scholar] [CrossRef]
  26. Ishizumi, A.; Kanemitsu, Y. Structural and luminescence properties of Eu-doped ZnO nanorods fabricated by a microemulsion method. Appl. Phys. Lett. 2005, 86, 253106. [Google Scholar] [CrossRef] [Green Version]
  27. Suwanboon, S.; Amornpitoksuk, P.; Sukolrat, A.; Muensit, N. Optical and photocatalytic properties of La-doped ZnO nanoparticles prepared via precipitation and mechanical milling method. Ceram. Int. 2013, 39, 2811–2819. [Google Scholar] [CrossRef]
  28. Deng, S.H.; Duan, M.Y.; Xu, M.; He, L. Effect of la doping on the electronic structure and optical properties of ZnO. Phys. B Condens. Matter 2011, 406, 2314–2318. [Google Scholar] [CrossRef]
  29. Kumar, V.; Ntwaeaborwa, O.M.; Soga, T.; Dutta, V.; Swart, H.C. Rare Earth Doped Zinc Oxide Nanophosphor Powder: A Future Material for Solid State Lighting and Solar Cells. ACS Photonics 2017, 4, 2613–2637. [Google Scholar] [CrossRef]
  30. Liu, Y.; Luo, W.; Li, R.; Zhu, H.; Chen, X. ions doped ZnO nanocrystals. Opt. Express 2009, 17, 838–842. [Google Scholar]
  31. Lupan, O.; Chow, L.; Chai, G.; Roldan, B.; Naitabdi, A.; Schulte, A.; Heinrich, H. Nanofabrication and characterization of ZnO nanorod arrays and branched microrods by aqueous solution route and rapid thermal processing. Mater. Sci. Eng. B Solid-State Mater. Adv. Technol. 2007, 145, 57–66. [Google Scholar] [CrossRef]
  32. Kannadasan, N.; Shanmugam, N.; Cholan, S.; Sathishkumar, K.; Viruthagiri, G.; Poonguzhali, R. The effect of Ce4+ incorporation on structural, morphological and photocatalytic characters of ZnO nanoparticles. Mater. Charact. 2014, 97, 37–46. [Google Scholar] [CrossRef]
  33. Martynova, N.A.; Umedov, T.; Lepnev, L.S.; Komarova, M.Y.; Grigorieva, A.V. Electrochemicaly formed ZnO and Au/ZnO opal films. SN Appl. Sci. 2020, 2, 1–13. [Google Scholar] [CrossRef] [Green Version]
  34. Nguyen, L.T.T.; Nguyen, H.T.T.; Le, T.H.; Nguyen, L.T.H.; Nguyen, H.Q.; Pham, T.T.H.; Bui, N.D.; Tran, N.T.K.; Nguyen, D.T.C.; Van Lam, T.; et al. Enhanced photocatalytic activity of spherical Nd3+ substituted ZnFe2O4 nanoparticles. Materials 2021, 14, 2054. [Google Scholar] [CrossRef] [PubMed]
  35. Wang, M.; Deng, X.; Feng, J.; Yu, B.; Zhu, H.; Li, X.; Zheng, X.; Bai, J.; Peng, Y. Nonhydrolytic colloidal synthesis of ligand-capped single-crystalline NdOCl nanocubes and their magnetic properties. J. Alloys Compd. 2015, 619, 681–685. [Google Scholar] [CrossRef]
  36. Li, X.; Deng, X.; Zhu, H.; Feng, J.; Peng, Y.; Bai, J.; Zheng, X.; Fan, H.; Wang, M.; Chen, H. Well-Defined Flowerlike NdOCl Nanostructures: Nonaqueous Sol-Gel Synthesis, Nanoscale Characterization and Their Magnetic and Photoluminescence Properties. Chem. Asian J. 2014, 9, 584–589. [Google Scholar] [CrossRef] [PubMed]
  37. Stevanovic, S.; Zeljkovic, V.; Obradovic, N.; Labus, N. Investigation of sintering kinetics of ZnO by observing reduction of the specific surface area. Sci. Sinter. 2007, 39, 259–265. [Google Scholar] [CrossRef] [Green Version]
  38. Sakhaei, Z.; Rezaei, M. Mechanochemical synthesis of ZnO.Al2O3 powders with various Zn/Al molar ratios and their applications in reverse water-gas shift reaction. Environ. Sci. Pollut. Res. 2021, 28, 13790–13799. [Google Scholar] [CrossRef]
  39. Zhang, L.; Yang, Y.; Fan, R.; Yu, J.; Li, L. Improving the efficiency of ZnO-based dye-sensitized solar cells by Pr and N co-doping. J. Mater. Chem. A 2013, 1, 12066–12073. [Google Scholar] [CrossRef]
  40. Xie, Y.; Yuan, C. Photocatalysis of neodymium ion modified TiO2 sol under visible light irradiation. Appl. Surf. Sci. 2004, 221, 17–24. [Google Scholar] [CrossRef]
  41. Lv, L.; Wang, T.; Li, S.; Su, Y.; Wang, X. Tuning the optical, electronic and luminescence properties of LaOCl:Eu3+ via structural and lattice strain modulation. CrystEngComm 2016, 18, 907–916. [Google Scholar] [CrossRef]
  42. Chen, H.I.; Chang, H.Y. Synthesis of nanocrystalline cerium oxide particles by the precipitation method. Ceram. Int. 2005, 31, 795–802. [Google Scholar] [CrossRef]
  43. Anandan, S.; Miyauchi, M. Ce-doped ZnO (CexZn1-xO) becomes an efficient visible-light-sensitive photocatalyst by co-catalyst (Cu2+) grafting. Phys. Chem. Chem. Phys. 2011, 13, 14937–14945. [Google Scholar] [CrossRef]
  44. Ahmad, I.; Akhtar, M.S.; Ahmed, E.; Ahmad, M. Facile synthesis of Pr-doped ZnO photocatalyst using sol–gel method and its visible light photocatalytic activity. J. Mater. Sci. Mater. Electron. 2020, 31, 1084–1093. [Google Scholar] [CrossRef]
  45. Byrappa, K.; Subramani, A.K.; Ananda, S.; Lokanatha Rai, K.M.; Dinesh, R.; Yoshimura, M. Photocatalytic degradation of rhodamine B dye using hydrothermally synthesized ZnO. Bull. Mater. Sci. 2006, 29, 433–438. [Google Scholar] [CrossRef] [Green Version]
  46. AlHamedi, F.H.; Rauf, M.A.; Ashraf, S.S. Degradation studies of Rhodamine B in the presence of UV/H2O2. Desalination 2009, 239, 159–166. [Google Scholar] [CrossRef]
  47. Liang, C.; Liu, C.; Li, F.; Wu, F. The effect of Praseodymium on the adsorption and photocatalytic degradation of azo dye in aqueous Pr3+-TiO2 suspension. Chem. Eng. J. 2009, 147, 219–225. [Google Scholar] [CrossRef]
  48. Vaiano, V.; Matarangolo, M.; Sacco, O.; Sannino, D. Photocatalytic treatment of aqueous solutions at high dye concentration using praseodymium-doped ZnO catalysts. Appl. Catal. B Environ. 2017, 209, 621–630. [Google Scholar] [CrossRef]
  49. Rauf, M.A.; Bukallah, S.B.; Hamadi, A.; Sulaiman, A.; Hammadi, F. The effect of operational parameters on the photoinduced decoloration of dyes using a hybrid catalyst V2O5/TiO2. Chem. Eng. J. 2007, 129, 167–172. [Google Scholar] [CrossRef]
  50. Muruganandham, M.; Swaminathan, M. Photocatalytic decolourisation and degradation of Reactive Orange 4 by TiO2-UV process. Dyes Pigments 2006, 68, 133–142. [Google Scholar] [CrossRef]
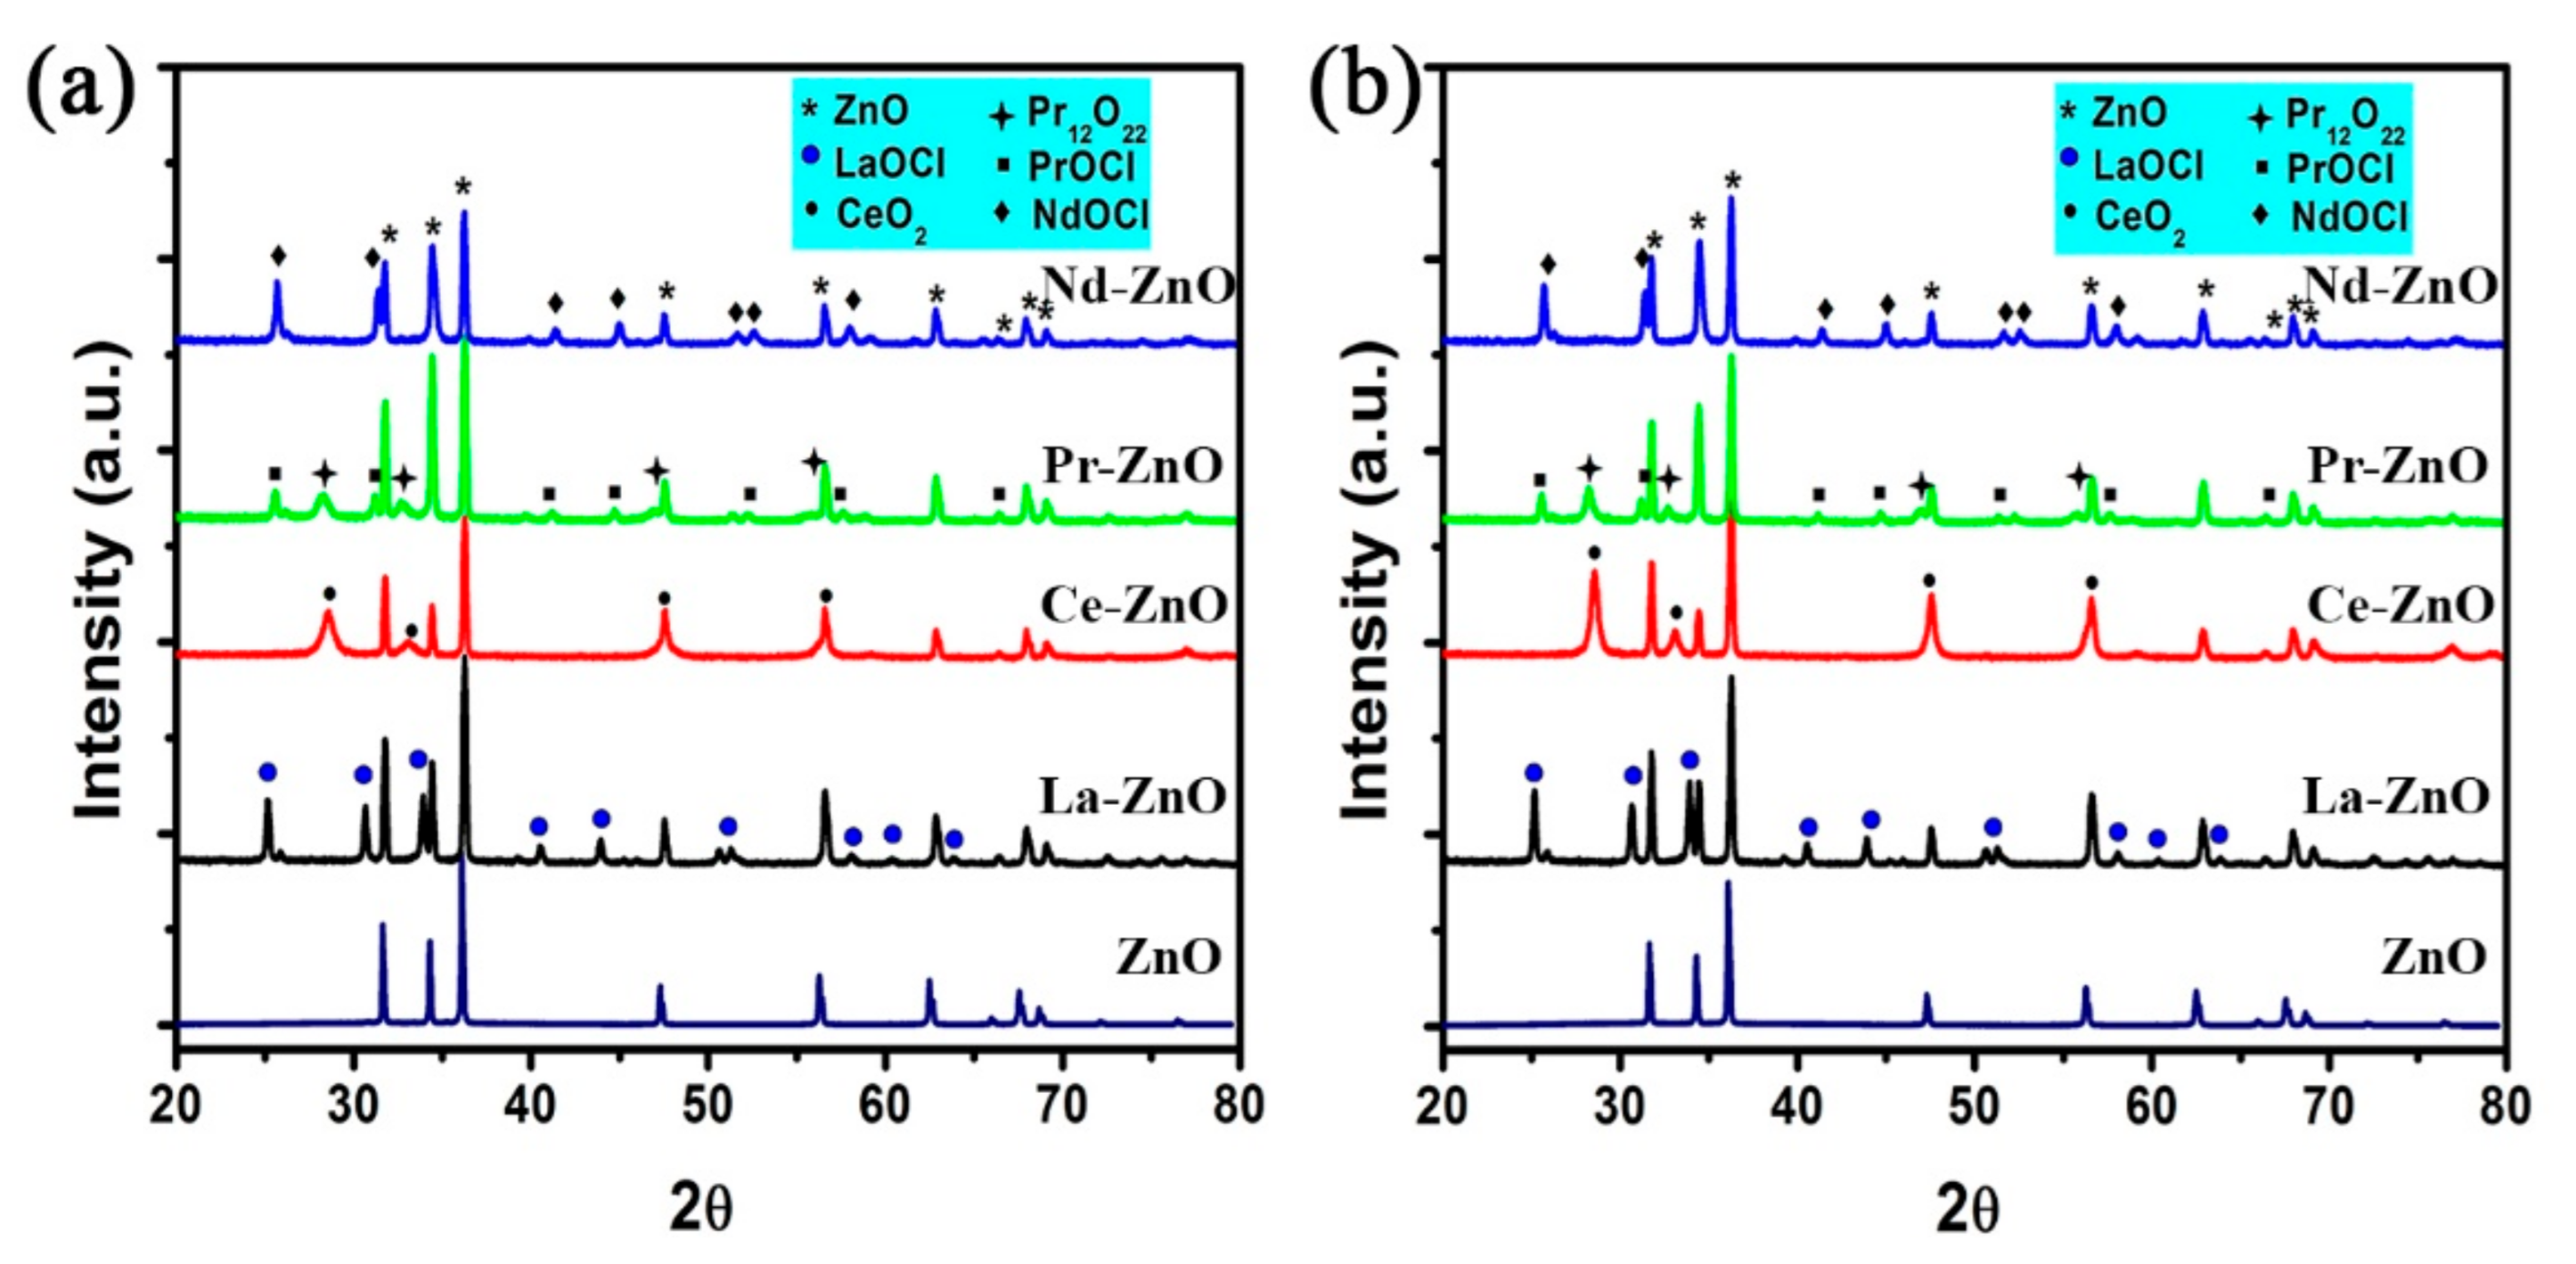
Figure 1. XRD patterns of ZnO and M-ZnO (M = La3+, Ce3+, Pr3+ and Nd3+) nanoparticles (a) calcined to 500 °C and (b) calcined to 700 °C.
Processes 09 01736 g001
Figure 2. FTIR spectra of ZnO and M-ZnO (M = La3+, Ce3+, Pr3+ and Nd3+) nanoparticles (a) calcined to 500 °C and (b) calcined to 700 °C.
Processes 09 01736 g002
Figure 3. SEM images of (a) ZnO, (b) La-ZnO, (c) Ce-ZnO, (d) Pr-ZnO and (e) Nd-ZnO calcined to 500 °C.
Processes 09 01736 g003
Figure 4. SEM images of (a) ZnO, (b) La-ZnO, (c) Ce-ZnO, (d) Pr-ZnO and (e) Nd-ZnO calcined to 700 °C.
Processes 09 01736 g004
Figure 5. UV–Vis DRS of ZnO and M-ZnO (M = La3+, Ce3+, Pr3+ and Nd3+) nanoparticles: (a) calcined to 500 °C and (b) calcined to 700 °C.
Processes 09 01736 g005
Figure 6. The band gap energies of ZnO and M-ZnO (M = La3+, Ce3+, Pr3+ and Nd3+) nanoparticles: (a) calcined to 500 °C and (b) calcined to 700 °C.
Processes 09 01736 g006
Figure 7. UV–Vis absorption spectra of the RhB dye in the reaction mixture as a function of time t in the presence of the photocatalysts under study and upon irradiation with UV light. Data are given for nanoparticles calcined to 500 °C.
Processes 09 01736 g007
Figure 8. UV–Vis absorption spectra of the RhB dye in the reaction mixture as a function of time t in the presence of the photocatalysts under study and upon irradiation with UV light. Data are given for nanoparticles calcined to 700 °C.
Processes 09 01736 g008
Figure 9. (a) The degree of degradation of the RhB dye in each time interval; (b) a graph of the kinetics of the degradation of the RhB dye, plotted for the first linear order as Ln(C0/Ct) vs. irradiation time (t). Data are given for nanoparticles calcined to 500 °C.
Processes 09 01736 g009
Figure 10. (a) The degree of degradation of the RhB dye in each time interval; (b) a graph of the kinetics of the degradation of the RhB dye, plotted for the first linear order as Ln(C0/Ct) vs. irradiation time (t). Data are given for nanoparticles calcined to 700 °C.
Processes 09 01736 g010
Table 1. Amounts of chemical reagents used for the chemical synthesis of ZnO and M-ZnO (M = La3+, Ce3+, Pr3+ and Nd3+) nanoparticles.
SamplesAmount of Hexahydrate Nitrates (Grams)
Zn2+La3+Ce3+Pr3+Nd3+
ZnO10.97----
La-ZnO6.843.49---
Ce-ZnO6.81-3.48--
Pr-ZnO6.78--3.48-
Nd-ZnO6.75---3.49
Table 2. Average crystallite size (τ), lattice parameters and unit cell volume of the ZnO and M-ZnO (M = La3+, Ce3+, Pr3+ and Nd3+) nanoparticles calcined to 500 °C and 700 °C.
SamplesCalcination Temperature (°C)Diffraction Peak (101)
(2θ)
FWHM
(in Degrees)
(β)
τ
(nm)
Lattice Parameters (Å)Volume (Å)
a = bcc/a
ZnO500 a36.26 a-----50 a3.250 a5.214 a1.6043 a47.70 a
50036.240.120723.2505.2081.602547.64
70036.260.121723.2505.2051.601647.61
La-ZnO50036.260.204433.2505.2051.601747.61
70036.260.208423.2495.2061.602247.59
Ce-ZnO50036.270.197443.2495.2041.601647.57
70036.250.218403.2495.2051.601947.58
Pr-ZnO50036.270.205433.2495.2041.601847.47
70036.260.201433.2495.2051.602047.58
Nd-ZnO50036.240.212413.2505.2021.600347.58
70036.250.209423.2515.2001.599547.59
a Values taken from the reference [33].
Table 3. Characteristics of M-ZnO (M = La3+, Ce3+, Pr3+ and Nd3+) nanoparticles calcined up to 500 °C and 700 °C.
SamplesCalcination Temperature (°C)Surface Area (m2/g) Cumulative Surface Area of Pores (m2/g)Total in Pores DFTAverage Pore Width (4 V/A) Å
Single Point P/Po = 0.2655BETAdsorptionDesorptionArea
(m2/g)
Volume
(cm3/g)
(×10−4)
AdsorptionDesorption
La-ZnO5001.00.90.50.50.17.755.2114.5
7000.90.80.50.40.17.355.692.8
Ce-ZnO50012.112.814.616.110.2198.753.956.6
7005.86.16.06.14.8110.072.086.3
Pr-ZnO5002.42.42.21.40.924.152.590.6
7001.81.71.90.90.617.942.492.5
Nd-ZnO5003.33.23.12.21.336.561.0100.1
7002.22.11.91.00.821.946.0100.4
Table 4. Degradation efficiency (%) and pseudo-first-order rate constant (κ) for the photocatalytic degradation of RhB using ZnO and M-ZnO (M = La3+, Ce3+, Pr3+ and Nd3+) nanoparticles calcined to 500 °C and 700 °C.
SamplesCalcination Temperature (°C)Band Gap (eV)Degradation Efficiency(%)κ
(min−1)
R2
ZnO5003.1282.700.01470.9968
7003.1291.410.01800.9919
La-ZnO5003.0064.000.00760.9969
7003.0677.360.01010.9927
Ce-ZnO5003.0597.720.03630.9691
7003.1397.360.02790.9953
Pr-ZnO5002.5896.810.02030.9957
7002.6182.490.00980.9932
Nd-ZnO5003.0876.570.00970.9889
7003.1374.030.00930.9978
Publisher’s Note: MDPI stays neutral with regard to jurisdictional claims in published maps and institutional affiliations.