Article

Hg2+ Detection with Rational Design of DNA-Templated Fluorescent Silver Nanoclusters

by
Liam Yourston
1,
Polikron Dhoqina
2,
Nolan Marshall
1,
Rujani Mahmud
1,
Ethen Kuether
1 and
Alexey Viktorovich Krasnoslobodtsev
1,*
1
Department of Physics, University of Nebraska at Omaha, Omaha, NE 68182, USA
2
Department of Physics, Faculty of Natural Sciences, University of Tirana, 1001 Tirana, Albania
*
Author to whom correspondence should be addressed.
Processes 2021, 9(10), 1699; https://doi.org/10.3390/pr9101699
Submission received: 16 August 2021 / Revised: 13 September 2021 / Accepted: 18 September 2021 / Published: 23 September 2021
(This article belongs to the Section Manufacturing Processes and Systems)

Abstract

:
Atomically precise silver nanoclusters (AgNCs) are small nanostructures consisting of only a few atoms of silver. The combination of AgNCs with cytosine-rich single-stranded oligonucleotides results in DNA-templated silver nanoclusters (DNA-AgNCs). DNA-AgNCs are highly luminescent and can be engineered with reproducible and unique fluorescent properties. Furthermore, using nucleic acids as templates for the synthesis of AgNCs provides additional practical benefits by expanding optical activity beyond the visible spectral range and creating the possibility for color tunability. In this study, we explore DNA oligonucleotides designed to fold into hairpin-loop (HL) structures which modulate optical properties of AgNCs based on the size of the loop containing different number of cytosines (HL-CN). Depending on the size of the loop, AgNCs can be manufactured to have either single or multiple emissive states. Such hairpin-loop structures provide an additional stability for AgNCs and further control over the base composition of the loop, allowing for the rational design of AgNCs’ optical properties. We demonstrate the potential of AgNCs in detecting Hg2+ by utilizing the HL-C13 design and its variants HL-T2C11, HL-T4C9, and HL-T6C7. The replacement of cytosines with thymines in the loop was intended to serve as an additional sink for mercury ions extending the detectable range of Hg2+. While AgNC@HL-T0C13 exhibits an interpretable quenching curve, AgNC@HL-T6C7 provides the largest detectable range of Hg2+. The results presented herein suggest that it is possible to use a rational design of DNA-AgNCs based on the composition of loop sequence in HL structures for creating biosensors to detect heavy metals, particularly Hg2+.

1. Introduction

DNA-templated silver nanoclusters that are comprised of only a few silver atoms display attractive optical properties. Measuring less than two nm in size, AgNCs are highly luminescent [1,2]. The unique optical properties of AgNCs stem from their intermediate nature between atomic and bulk metal [3]. Furthermore, atomic composition, shape, and size of AgNCs control a unique optical behavior of these novel nanomaterials [4]. Single-stranded (ss), cytosine-rich DNA oligonucleotides are the most suitable capping agents for templating stable DNA-AgNCs due to high affinity of cytosine’s N3 heterocyclic atom to silver ions, Ag+ [5]. To date, various sequences have been reported to stabilize clusters with unique optical properties, including bright emission bands in the visible part of the spectrum [4]. Various colors have been previously reported based on the prevalent emission wavelengths for a particular DNA-AgNC [6]. The use of nucleic acids (DNA or RNA) as templates for synthesis of AgNCs provides additional practical benefits by expanding optical activity beyond the visible spectral range [6,7].
Combining AgNCs with DNA allows for using many advances already available in DNA nanotechnology. For example, creating larger patterned NA assemblies that incorporate multiple functionalities into one structure in a controllable manner [6,7]. Recently, a great deal of research has been conducted on the design of DNA-based metal ion sensors [8]. Further combining benefits of both DNA and AgNCs might lead to better designs of biosensors for metal ion detection. Both size and unique optical properties of AgNCs have prompted their novel practical applications for heavy metal detection [9,10]. Monitoring the levels of heavy metal ions such as Co(II), Ni(II), Cu(II), Pb(II), and Hg(II) has become quite important due to their wide industrial and medical use, which consequently has resulted in increased environmental levels of these ions [11]. For example, mercury is a highly toxic metal which migrates to soil and groundwater if not handled properly [12]. Mercury ions accumulated in water can have adverse health effects in humans and animals [13]. Short-term exposure to high concentrations, or long term exposure to low concentrations of mercury can cause severe damage to various organs [14]. Since mercury is not bio-degradable, its accumulation in plants and animals presents a significant environmental hazard. The need to detect and monitor the content of mercury in the environment is therefore significantly important from a human health perspective. This has stimulated a great deal of effort aimed at developing cost-effective, rapid, and easy-to-use methods to detect and monitor mercury. Many various potential detection strategies have been explored over the years and have recently also included biosensors [15,16].
Among the available suitable readout designs of biosensors for detecting and monitoring pollutants in the environment, optical assays represent simple, robust, and inexpensive methods. Optical biosensors have been widely utilized for detection of mercury due to their quick measurement processes and their easily detectable optical response, such as fluorescence [17,18]. Since the fluorescence signal produces a bright and distinctive color, it can serve as an effective means for both the detection and monitoring of the environmental mercury levels. Recent efforts concerning fluorescent silver nanoclusters have identified them as novel platforms for the development of mercury sensors with a high potential [9,19,20].
In this study, we report a new method to rationally design biosensors for monitoring and the detection of ionic form of mercury, Hg2+. Due to its toxicity, the detection and monitoring environmental levels of mercury present an important problem. The design of biosensors is based on DNA-templated AgNCs whose fluorescence is quenched in the presence of Hg2+. Typically, cytosine-rich single-stranded nucleic acid sequences are employed for synthesis of AgNCs [5,6,21]. Herein, we tested various sizes of cytosine-rich hairpin-loop structures for their ability to template stable and well-defined fluorescence patterns. Hairpin-loop DNA templates provide reproducibility in making AgNCs by removing structural ambiguity inherent to ss-CN templating sequences [6,22,23]. Such properties as AgNC’s stability and reproducibility of fluorescence signals are desirable for the use of DNA-AgNC as biosensors. We show that the increase of cytosines in CN loops of HL designs beyond N = 11 result in a primarily single emissive state of DNA-AgNC, rendering them suitable for making sensor designs. We chose HL-C13 with 13 cytosines to demonstrate the proof of concept for the rational design of a mercury sensor. The sensing modality is based on fluorescence quenching of AgNC by Hg2+. The fluorescence of AgNC@HL-C13 shows a nice fluorescence quenching response curve, with a linear relationship of (F0F)/F0 vs. CHg2+ at low levels of Hg2+. Further modifications of HL-C13 to include extra thymine bases in the loop extends the range of detectable levels of Hg2+, in some cases up to 4 times, as identified for AgNC@HL-T6C7. This provides the platform for further improvement of biosensor performance based on a rational design of loop sequences in the HL structures.

2. Materials and Methods

2.1. Materials

All DNA oligonucleotides were purchased from Integrated DNA Technologies (IDT Inc., Coralville, IA, USA) as desalted products and are used without further purification. All sequences are listed in the Supporting Information. Nuclease-free water was obtained from IDT (Coralville, IA, USA). Sodium borohydride was purchased from TCI America, Inc. (Portland, OR, USA), and all other reagents were purchased from Sigma-Aldrich, Inc. (Saint Louis, MO, USA).

2.2. Synthesis of Ag-DNA Nanoclusters

In a typical preparation, DNA template – hairpin loop – HL-CN and AgNO3 aqueous solutions were mixed and incubated for 25 min at room temperature in ammonium acetate buffer (100 mM NH4OAc, pH 6.9). Next, an NaBH4 aqueous solution was added and samples were placed on ice and stirred vigorously. The final concentrations (C) of the components were as follows: CDNA-template = 10 μM; CAgNO3 = 12 μM, CNaBH4 = 12 μM, ammonium buffer acetate was at 20 mM. The solution was then incubated in the dark for 24 h at 4 °C. Synthesized DNA-AgNCs were then purified using 3 kDa Amicon centrifugal filters by washing twice with buffer. Purification was performed according to the protocol supplied by the manufacturer. Final concentrations of DNA-AgNC obtained after filtration were ~5.5 ± 1.0 μM and were evaluated by taking DNA absorption at a 265 nm wavelength. For nanocluster formation with prebound Hg2+, mercury was added first to a DNA solution with matching concentrations as per thymines in the loop, followed by the regular protocol. UV-vis absorption spectra of HL-TMCN designs, shown in supplementary Figure S1, were measured using a DS-11 spectrophotometer (DeNovix, Wilmington, DE, USA).

2.3. Fluorescence Measurements

The excitation and emission spectra were acquired on a Duetta – Fluorescence and Absorbance Spectrometer (Horiba, Inc., Chicago, IL, USA). In all the measurements, the concentration of the templating sequence was kept the same at ~6 µM. Fluorescence measurements were carried out in a Sub-Micro Fluorometer Cell, model 16.40F-Q-10 (from StarnaCells, Inc., Atascadero, CA, USA) at a room temperature of ~22 °C. The excitation–emission matrix spectra (EEMS) were recorded with 0.5 nm resolution. Fluorescence spectra were recorded with the emission wavelength range from 400 nm to 1000 nm, and the initial excitation wavelength was set to 350 nm, and the final excitation wavelength was set to 800 nm, with an increment of 0.5 nm. Matrix data were then used for a 2D contour plot using MagicPlot Pro software (St. Petersburg, Russia). Fluorescence quenching measurements were performed with freshly prepared samples (within one hour) by adding small volumes of Cu(NO3)2 or Hg(NO3)2 solution to deliver a desirable amount. The expected fluorescence, F0, was then adjusted using an appropriate dilution factor.

3. Results and Discussion

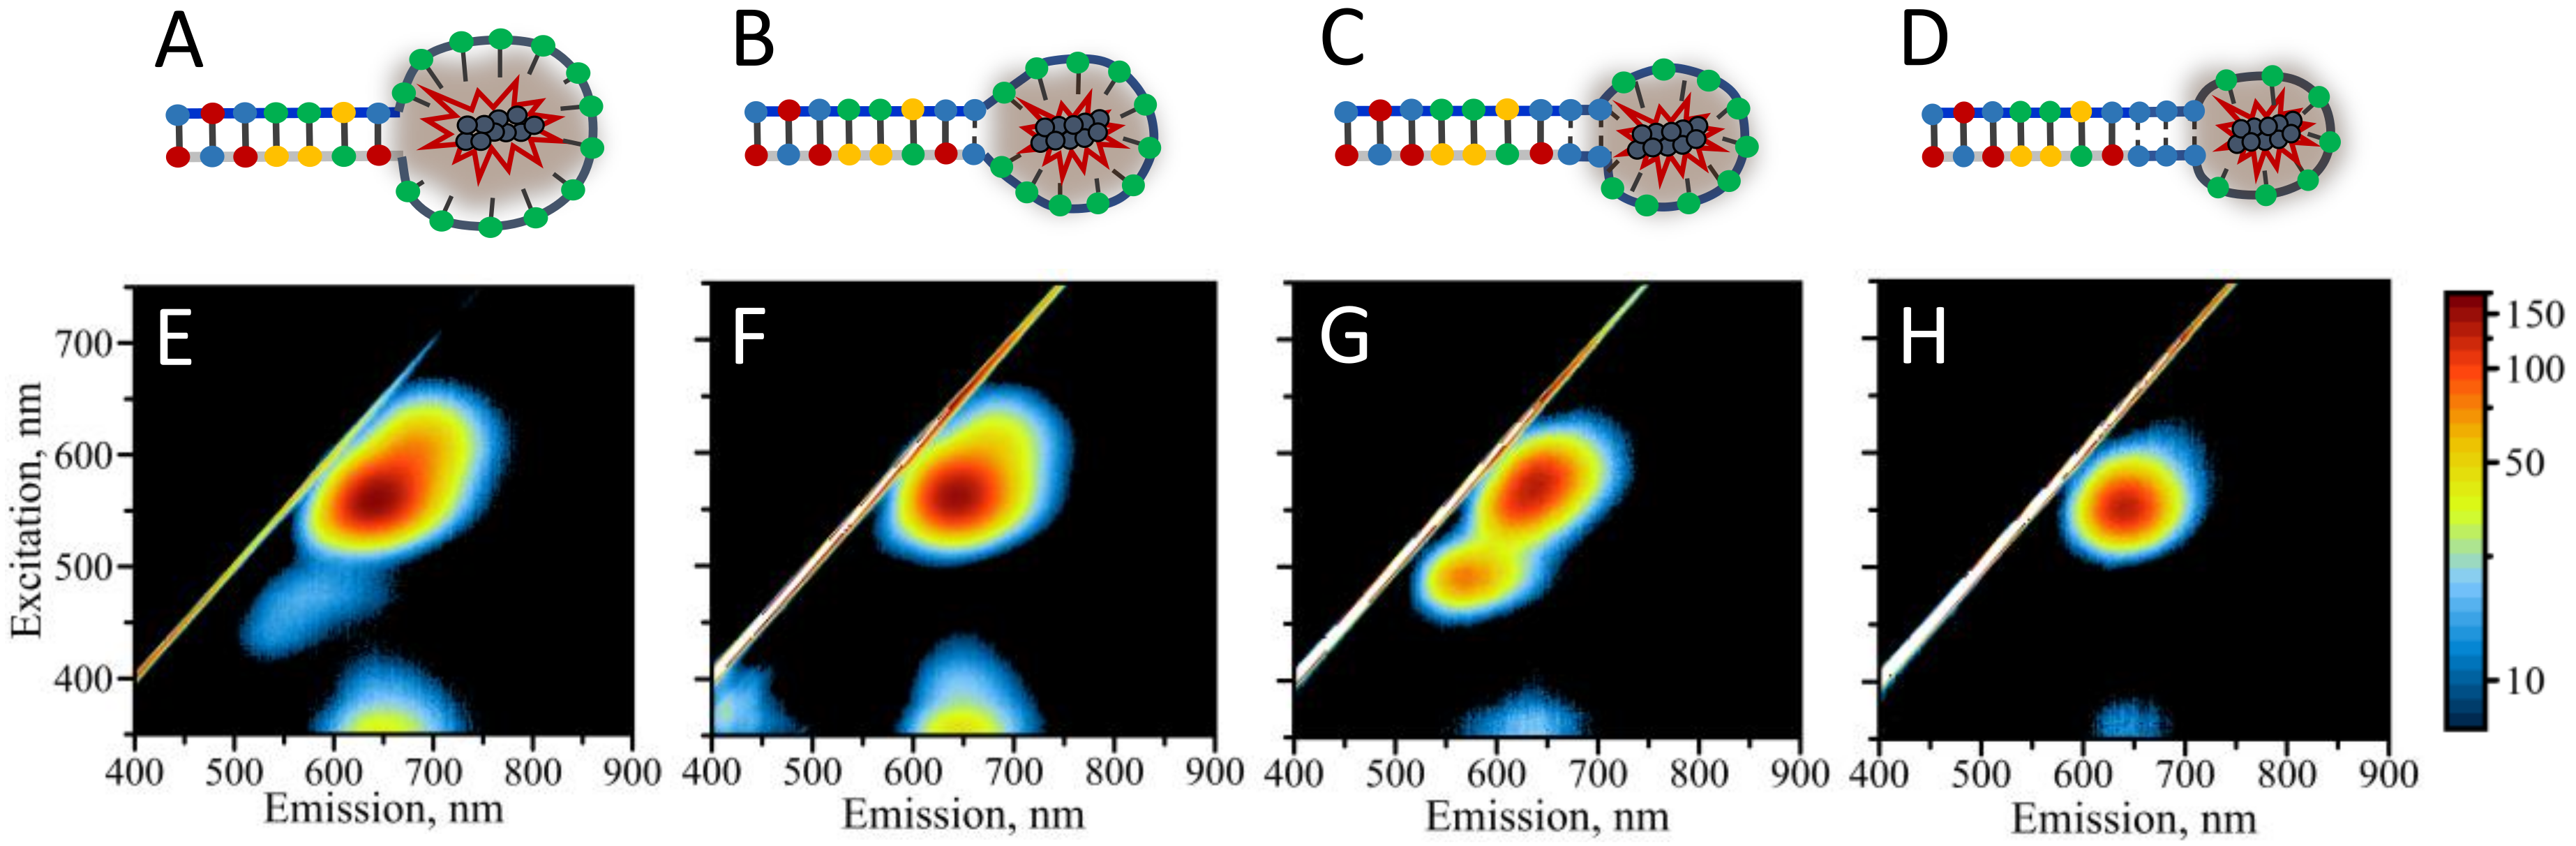
3.1. Design of the Hairpin-Loop AgNC DNA Template

To date, various nucleic acid sequences have been reported to stabilize AgNCs with unique optical properties, including bright emission bands in the visible part of the spectrum [15]. Cytosine-rich DNA oligonucleotides have been demonstrated to be very suitable capping agents for templating stable DNA-AgNCs [21]. This suitability is due to the high affinity of cytosine’s N3 heterocyclic atom to silver ions, Ag+ [5]. Our previously published data suggested that the formation of alternative DNA structures via strong silver mediated C-Ag-C base paring results in heterogeneity of DNA-AgNC populations [6]. HL nucleic acid structures appear to improve the results by forming a homogeneous, both structurally and optically, population of AgNCs [23]. HL consists of a base-paired stem and a loop sequence with unpaired nucleotide bases (Figure 1A) and represent a key building block of many folded RNA secondary structures found in nature, including ribozymes and messenger-RNA [24]. Hairpin-loop DNA are non-canonical structures as DNA primarily exist in a double-stranded form. HL DNA represents a flexible template that has both double and single-stranded regions. While double-stranded regions provide stability, single-stranded cytosine-rich portions are suitable for hosting AgNCs. Additionally, nucleic acid sequences are ubiquitous material building blocks in nucleic acid nanotechnology approaches [25]. They provide versatility and an opportunity to combine unique moieties into larger nano-assemblies, sometimes with multiple functionality [6,7]. We have designed the stem-loop with a varied length of the cytosine only loop containing N cytosines-CN, and a stem comprised of the following 7 complementary nucleobases: 5′-TATCCGGT-3′ (Figure 1, Table S1). A similar design, but with smaller loops, in the range between C3 and C12, has been utilized previously and indicated that the fluorescence pattern is modulated by the size of the loop, suggesting that variation in AgNC’s size and shape guide optical properties of the AgNCs [22].
Herein, we have attempted to identify a suitable loop size for the design of an effective sensing strategy towards heavy metals, particularly Hg2+. Our choice of loop sizes spanned from C7 to C19 with a +2C increment. Although other designs have been utilized for sensing Hg2+ [26], we have chosen to work with DNA HL templates to avoid structural and functional uncertainties [23] and to make the structures suitable for further implementation into larger nano-designs [6,7]. AgNCs are highly susceptible to oxidation with dramatic changes in optical properties of the nanoclusters [6]. A closed geometry of DNA/RNA templates results in an improved stability of AgNCs against oxidative species present in solution, including dissolved oxygen [7,23]. Looped templates used in the current study, therefore, provide additional advantages of increased AgNCs stability.

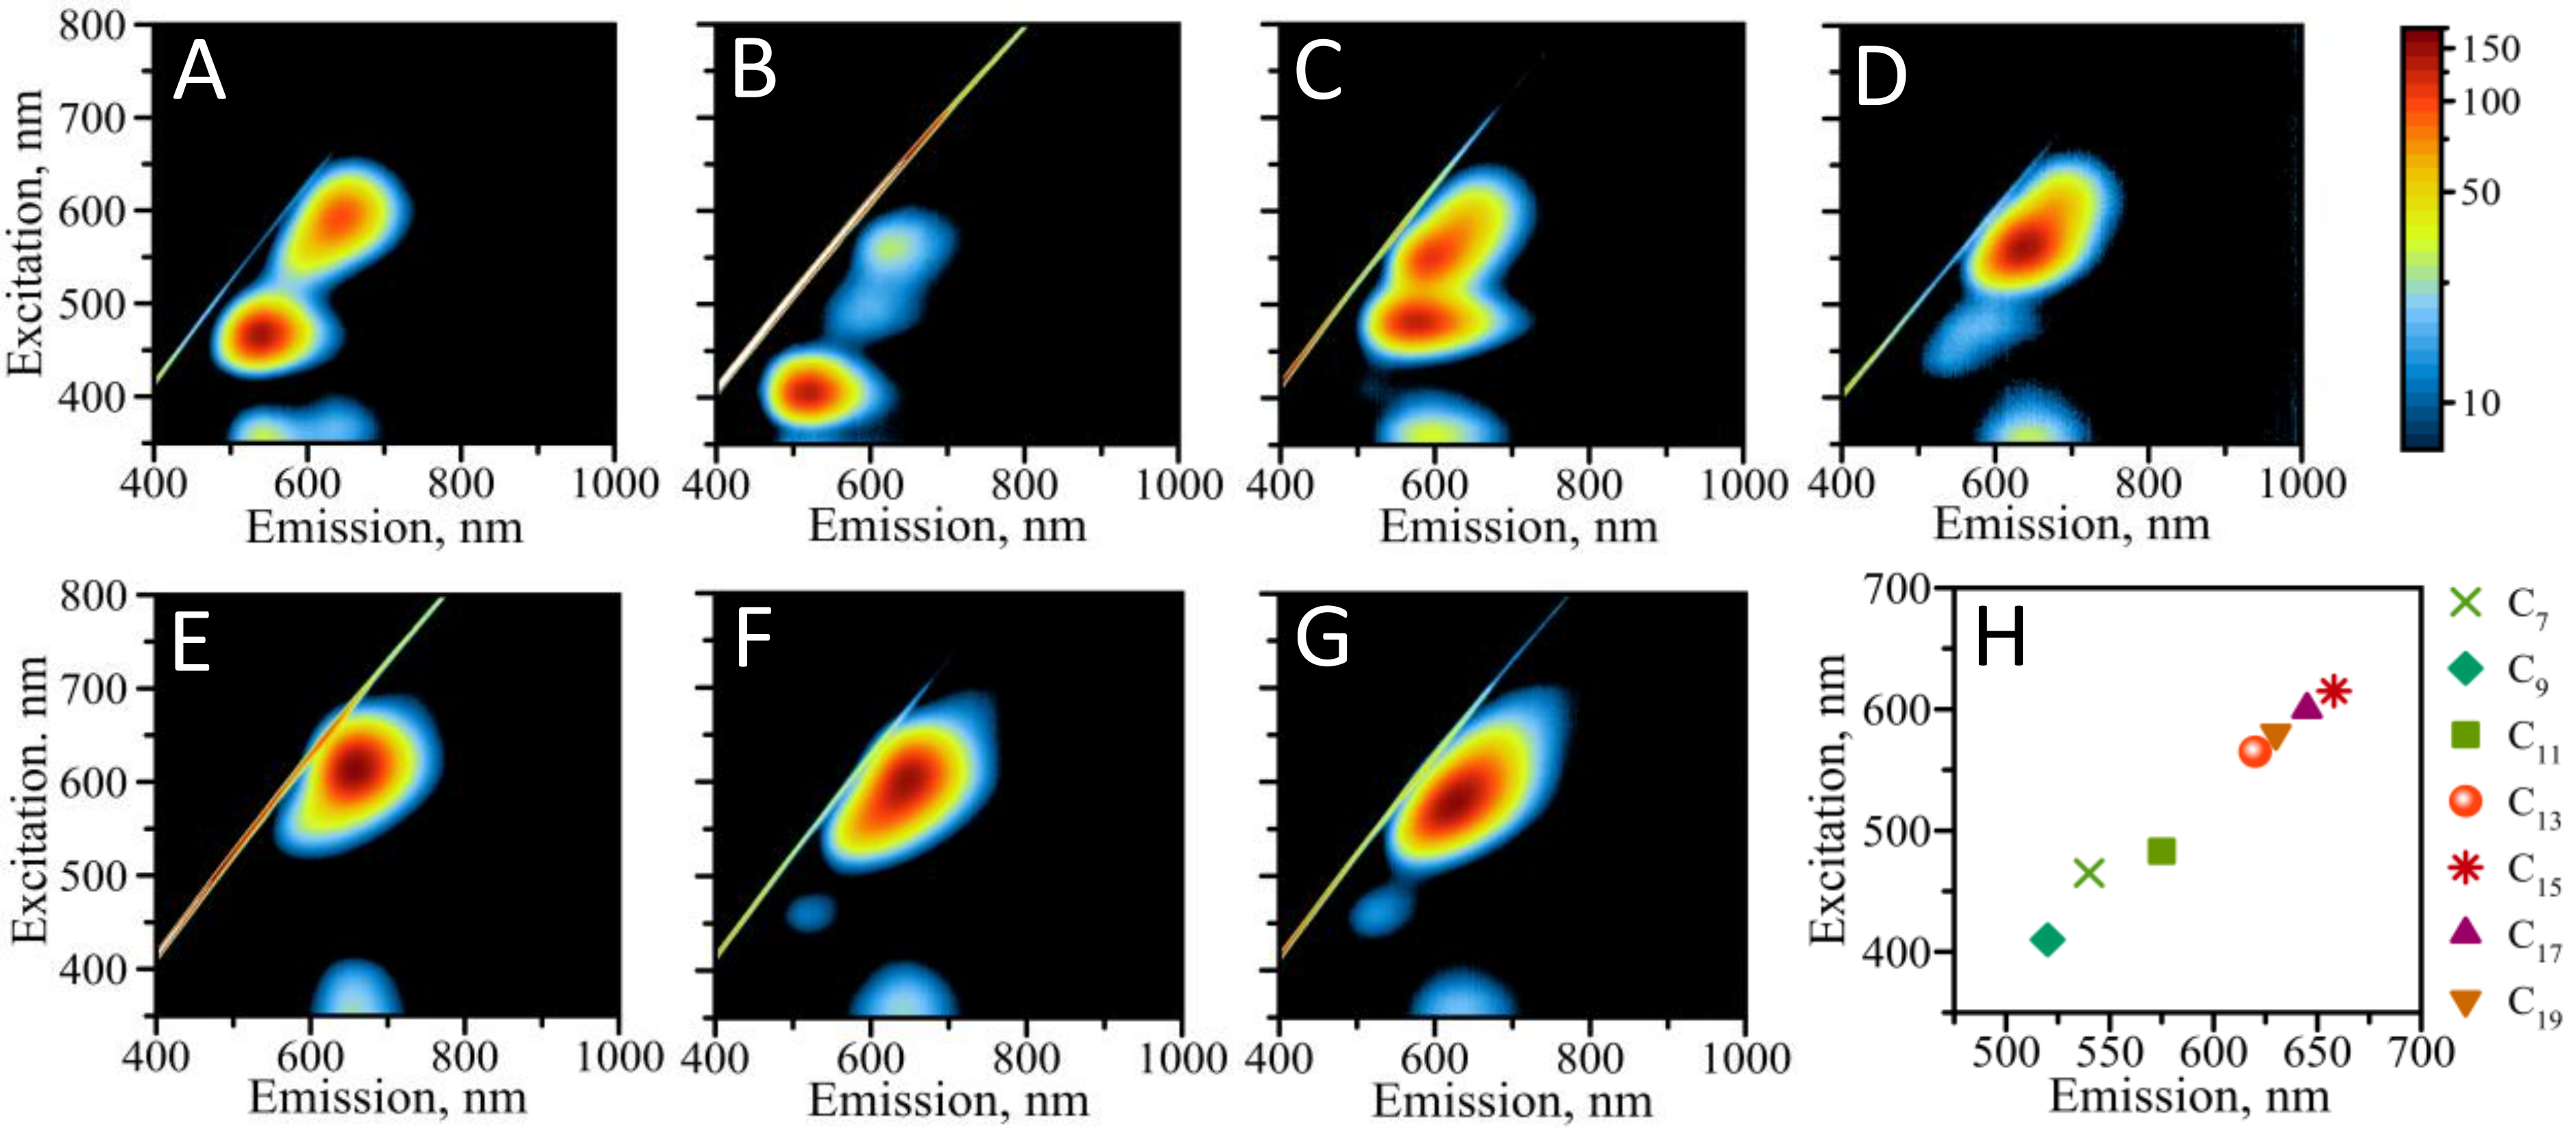
3.2. Optical Properties of AgNCs Templated by Various Hairpin-Loop DNA Templates

The formation of DNA-AgNCs is typically monitored by the color changes in the solution that are observed after the successive addition of silver nitrate and sodium borohydride followed by incubation in the dark for ~24 h (Figure 1B–D). Various colors in the visible spectral range (e.g., blue, green, red) of DNA-AgNCs have been previously reported based on the prevalent emission wavelengths for a particular nanocluster [6]. Recent reports also indicate that DNA-AgNC emissions are not limited to just a visible spectral range, but also extend into UV as well as NIR portions of the electromagnetic spectrum [4,6,27,28]. Various sizes of CN loops generate DNA-AgNCs with distinct fluorescence patterns [22,23]. Figure 2 shows the excitation–emission plots (EEMs) for AgNCs templated on hairpins with C7, C9, C11, C13, C15, C17, and C19 loop sizes.
The HL-CN designs with smaller number of cytosines (N = 7, 9, 11) in the loop produce obvious multi-peak patterns with dominating fluorescence peaks in the “green” region of EEMs of AgNCs. AgNC@HL-C9 has a pattern featuring three peaks: one green (λEXCEM = 410/520 nm) and two red (λEXCEM = 490/600 nm, λEXCEM = 560/602 nm), while both HL-C7 and HL-C11 produce dual peak patterns (λEXCEM = 465/540 nm, λEXCEM = 590/645 nm for C7 and λEXCEM = 483/575 nm, λEXCEM = 545/600 nm for C11). Larger CN loops, such as HL-C13, HL-C15, HL-C17, and HL-C19, feature primarily one dominating red peak of fluorescence (Figure 2D–G). Although red peaks seem dominant in C13-C19 hairpin-loop designs, less intense peaks in the green region still indicate the ubiquitous multi-peak nature of AgNCs’ fluorescence. Figure 2H shows the graph of maxima λEXCEM, of the most intense peaks for all tested AgNC@HL-CN. It is obvious that the increase in the excitation wavelength results in the increase of emission wavelength, which is typically observed for organic fluorophores as well. The plot, shown in Figure S2, reveals that the Stokes shift, ∆E = EEM−EEXC, decreases dramatically with the increase in wavelengths despite the apparent linear appearance of the plot. The Stokes shift changes from ∆E = 11.3 cm−1 for AgNC@HL-C9 to ∆E = 28.8 cm−1 for AgNC@HL-C15. This trend reverses for AgNC@HL-C17 and AgNC@HL-C19, which feature a gradual decrease in the Stokes shift as compared to AgNC@HL-C15 (Figure S2).
Since it is often suggested that the larger size of the clusters produce higher emission wavelengths, it might be tempting to speculate that the increase in loop size allows for larger clusters to be formed. However, upon careful examination of the plot, we noted that while in general loop size does influence the pattern, it does not necessarily increase excitation/emission wavelengths. For example, AgNC@HL-C9 has the lowest wavelengths, while AgNC@HL-C7 and AgNC@HL-C11 both have higher wavelengths. It becomes even more apparent for the larger CN loops: AgNC@HL-C13 has λEM = 620 nm followed by the increased λEM = 658 nm for AgNC@HL-C15, the trend reverses after that with λEM = 645 nm for AgNC@HL-C17 and even lower, λEM = 630 nm, for AgNC@HL-C19. This observation suggests that a complex interplay of factors might be involved in defining AgNC@HL-CN optical properties and emission peak positions. Additionally, we have recently demonstrated that the number of silver atoms that comprise AgNC for AgNC@HL-C7, AgNC@HL-C9, AgNC@HL-C11, and AgNC@HL-C13 remains virtually the same (~10) for all these templates [23]. It is, therefore, reasonable to propose that such factors as nanoclusters’ geometry, their charge state, and the degree of exposure to the environment may play a more important role than size in shaping the fluorescence pattern of AgNC@HL-CN. Additionally, several studies suggested a very tight connection between DNA bases and optical properties of AgNC [27,29,30,31]. One possible explanation is the large degree of charge transfer character between Ag and DNA bases facilitated by cytosines [32]. A different number of cytosines in AgNC@HL-CN can influence the degree of charge transfer and thus can lead to different fluorescence patterns. While the nature of multipeak patterns of AgNC fluorescence is currently debated, practical applications can still be devised using the unique optical properties of AgNCs.
Various practical applications of the hairpin-loop templated AgNCs are feasible. For example, we have recently studied the antibacterial activity of AgNC@HL-C7, AgNC@HL-C9, AgNC@HL-C11, and AgNC@HL-C13 [28]. AgNC@HL-C13 showed the largest inhibition of bacterial growth while maintaining a stable “red” fluorescence peak with maximum emission wavelength at λMAX = 640 nm (Figure 2F). This template also produces bright red emissive AgNCs as visualized by direct excitation using the UV-lamp (Figure 1D).
Based on the prevailing “red” peak for the N > 11 in AgNC@HL-CN shown in Figure 2D–G, we can suggest that larger sizes might all be suitable for designing Hg-sensors. We have chosen AgNC@HL-C13 to demonstrate the feasibility of the sensing strategy and to uncover the details of such a design. Most sensors towards Hg2+ involve some degree of base-pair mismatching of double-stranded nucleic acid. Such base-pair modification primarily includes a T-T mismatch, where mercury may bind via T-Hg-T, artificially pairing two thymines in the double stranded portion of the Hg recognition sequence [33,34].
The four designs we have tested involved progressive incorporation of thymines in the stem of the hairpin-loop structure, replacing cytosines. Figure 3, top panel (A-D) schematically shows the four designs termed as: HL-T0C13; HL-T2C11; HL-T4C9; HL-T6C7, based on the number of thymines and cytosines present in the loop of the HL structure. Cytosines remain the main binding sites for silver atoms and the main templating site for the silver nanocluster. The progressive increase of thymines in the loop effectively decreased the number of AgNC templating cytosines. This change in the DNA template was expected to alter the structure of AgNC and, as a result, its optical properties. Surprisingly, the observed changes were not very significant, with the main “red” peak remaining the dominant emitting state (Figure 3, bottom panel (E–H)). Additionally, the position—λEXC/EM—of this peak is almost identical for all four designs, as summarized in Table 1. This suggests a large degree of similarity in the structure of the fluorescent AgNCs formed on all four HL designs. Perhaps the biggest difference in the fluorescence pattern of AgNCs formed on the HL-TMCN templates is observed in the “green” peak, which is present in the fluorescence pattern of AgNC@HL-T0C13 as a faint trace peak and in the fluorescence pattern of AgNC@HL-T4C9 as a fully developed peak. The “Green” peak is completely absent in both AgNC@HL-T2C11 and AgNC@HL-T6C7. Based on the number of templating cytosines, one would expect that the fluorescence pattern of AgNC@HL-TMCN would resemble that of AgNC@HL-CN. However, comparing the plots of EEMs indicates that the new patterns of the AgNC@HL-TMCN, shown in Figure 3, do not resemble any of the AgNC@HL-CN designs shown in Figure 2. Since the only difference between these designs is the presence of additional thymines in the loop of the HL, this observation suggests the importance of the nucleobase nature positioned close to the stem of the HL structure. The only design with clear multipeaked EEM is AgNC@HL-T4C9, but its appearance is closer to AgNC@HL-C7 than AgNC@HL-C9. We hypothesize that an additional void in the loop created by unpaired thymines provides more room in the loop, changing its geometry and thus the resultant shape of the AgNC in such a loop.

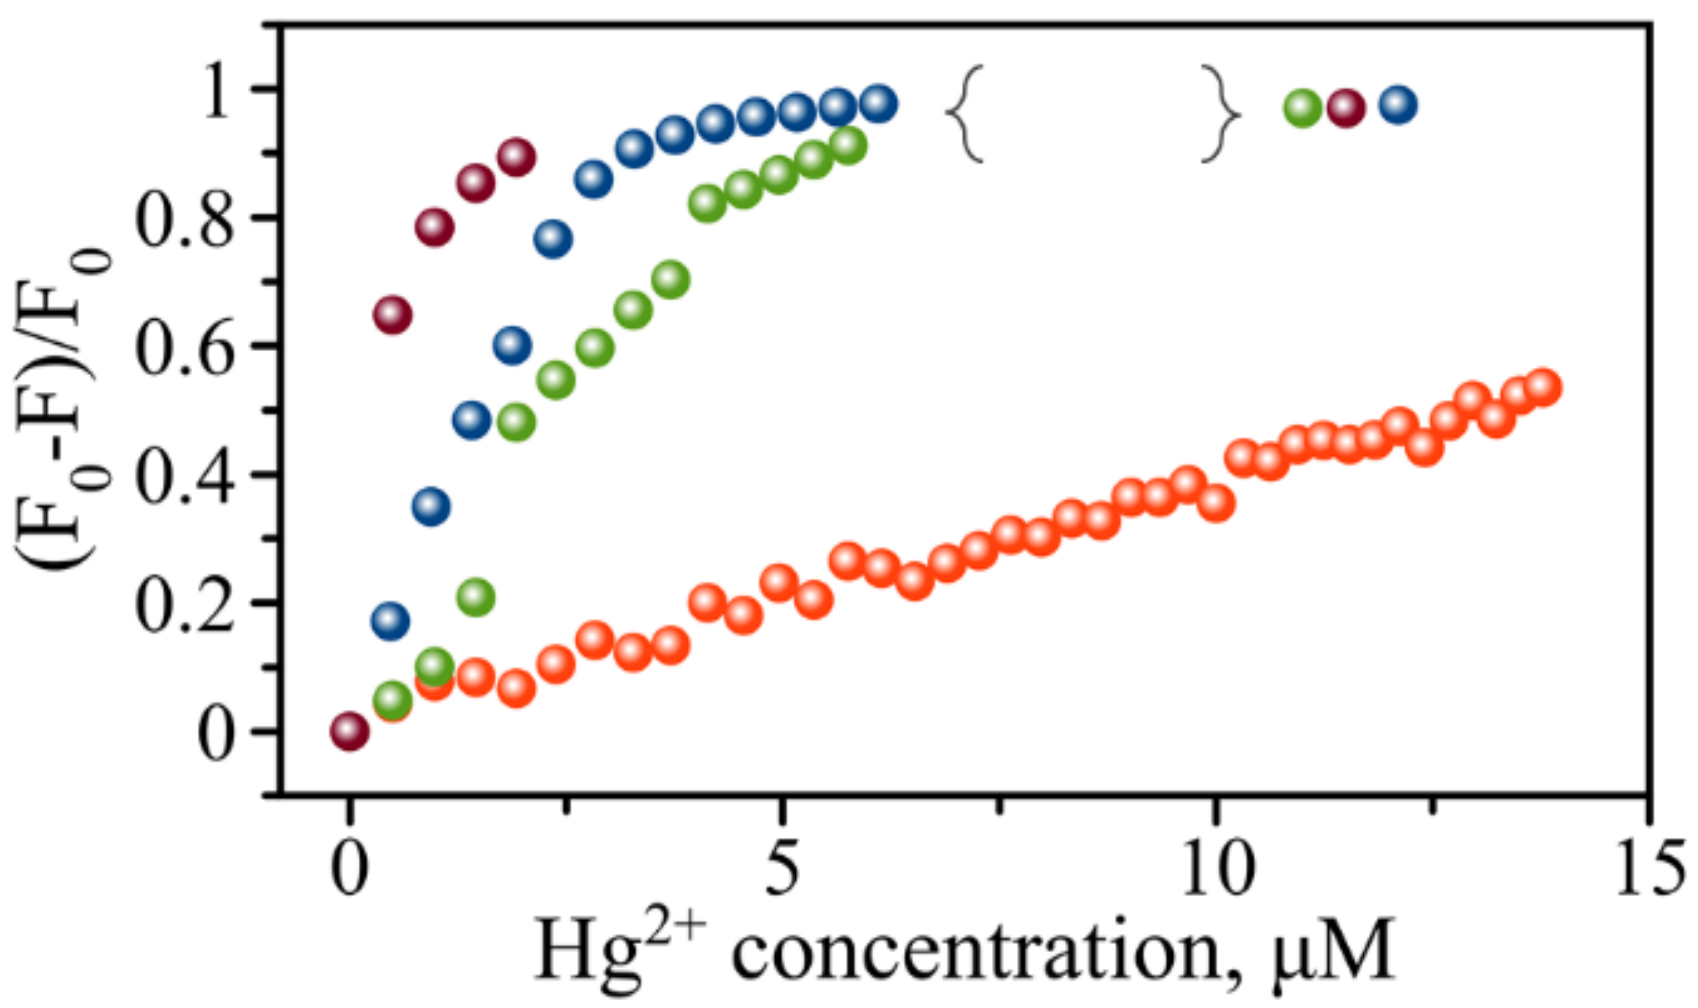
3.3. Hg2+ Sensing with AgNC’s Fluorescence

Detection of mercury relies on the fluorescence response of the recognition sequence in the presence of Hg2+. AgNCs provide several possibilities for sensing mechanism: (1) switch-on (intensity enhancement) [34], (2) switch-off (intensity quenching) [35], (3) fluorescence pattern changes as observed in EEMs [36]. Our designs had the opportunity to provide all three mechanisms. Figure 4 summarizes the outcome of the addition of mercury in a stepwise manner to the pre-preformed AgNC@HL-T0C13. We found that the fluorescence intensity of the “red” peak with λMAX = 640 nm rapidly decreases in the presence of Hg2+, Figure 4A. The concentration of AgNC@HL-T0C13 in solution was kept at 6.2 μM, while the metal ion concentration was varied from 0 μM to 6.2 μM. More quenching occurs with the increase of mercury content, eventually dropping fluorescence to almost undetectable levels (see Figure S3), indicating complete fluorescence quenching at around an equimolar ratio of Hg2+ to AgNC.
We have evaluated the rate of quenching as a function of Hg2+ using a Stern–Volmer relationship. Figure 4B shows the Stern–Volmer fluorescence quenching curve typically plotted for quenching processes as the ratio of F0/F vs. CHg2+, where F is the fluorescence intensity and F0 is the fluorescence intensity observed without the quencher. Measured data points deviate largely from the expected classical Stern–Volmer relationship. Generally, a linear Stern–Volmer plot indicates a single class of fluorophores, which are all equally vulnerable to quenching via a dynamic quenching mechanism [37]. The dynamic quenching takes place due to the collision of an emitting fluorophore, AgNC, with a quenching moiety, Hg2+ in this case. We attempted to fit the data points to Equation (1) assuming only dynamic quenching. Only a few data points at a low range of Hg2+ concentrations could be fitted with the linear relationship as described by Equation (1).
F 0 F = 1 + K D C H g 2 +
Red line in Figure 4B represents the best fit to data points within the range 0–2 μM of Hg2+. The large deviation exhibits an overall upward curvature of the plot, suggesting that the quenching mechanism is not limited to dynamic quenching only (Figure 4B inset). Typically, a static mechanism of quenching might also be incurred in the behavior of fluorescence quenching, leading to upward curvature of the Stern–Volmer plot [37]. Fitting the data points with a modified Stern–Volmer relationship represented by Equation (2) improved the fit only slightly, shown in the blue solid curve in Figure 4B.
F 0 F = 1 + K D C H g 2 + 1 + K S C H g 2 +
This observation suggests a complex nature of fluorescence quenching via more than two deactivation pathways, such as dynamic quenching, with a characteristic constant—KD, and static quenching with characteristic constant—KS not fully describing F0/F vs. CHg2+ dependence. While uncovering all the details of quenching will require further studies, we hypothesize that the complex static mechanism might occur due to binding of Hg2+ to AgNC@DNA.

3.4. Extending the Range of Detectable Hg2+ Concentrations Using Rational Design of HL Template

We have tested all four AgNC@HL-TMCN designs presented in this study to verify that they are all suitable for the detection of Hg2+. Replotting the fluorescence intensity as (F0F)/F0 vs. CHg2+, Figure 5, allowed us to identify the range of Hg2+ concentrations where intensity enters an asymptotic behavior, indicating nearly complete quenching of fluorescence. For example, the blue circles in Figure 5 represent replotted data points for AgNC@HL-T0C13, for the Stern–Volmer curve shown in Figure 4B.
The region beyond 2 μM of CHg2+ can be described as the region where near complete quenching occurs. Since this higher amount of mercury, >2 μM, results in an almost complete quenching, it would still be suitable for detecting mercury. AgNC@HL-T0C13 design, however, would not be suitable for monitoring purposes where reporting on the exact amount of mercury present in the solution is required. The near complete quenching region sets the upper limit of concentrations available for Hg2+ monitoring using the fluorescence of AgNC@HL-TMCN. Earlier reports established that mercury ions can bind to mismatched thymines serving as “glue” between the T of adjacent DNA strands [38]. Thus, we reasoned that the increasing number of mismatching thymines in the loop of the AgNC@HL-TMCN designs might provide an additional sink for the binding of mercury ions and to modify the quenching behavior of AgNCs. Such a design was hypothesized to be suitable for extending the range of monitorable Hg2+ concentrations. Indeed, all four designs exhibit different behaviors of fluorescence quenching by Hg2+. While AgNC@HL-T2C11 delayed complete quenching to ~5 μM, extending the range of monitorable mercury concentration, AgNC@HL-T4C9 was unexpectedly quenched faster than both AgNC@HL-T0C13 and AgNC@HL-T2C11, despite the larger content of T mismatches. We argue that such behavior might be related to the presence of an active extra emissive state in the green region of EEM, Figure 3G. An additional channel of quenching due to intramolecular “red” to “green” conversion could be responsible for faster quenching of AgNC@HL-T4C9 at low Hg2+ concentrations as we have previously observed for other quenchers [23].
Perhaps the best among all four designs is the AgNC@HL-T6C7, shown as red circles in Figure 5. This design extends the range of monitorable Hg2+ concentrations beyond twice the AgNC@HL-T6C7 concentration, reaching only 0.5 of (F0F)/F0 values at CHg = 14 μM. This observation suggests that there is a lot more room for improvement of the biosensor’s capability. The linear relationship of (F0F)/F0 vs. Hg2+, observed for AgNC@HL-T6C7 design is also advantageous for mercury monitoring. The linear regression analysis of the data points provided the slope of the fit as 0.039 with R2 = 0.9965 (see Figure S4 for details). Using the parameters of this fit, we extrapolated the upper limit of monitorable Hg2+ concentration at 25 μM, which is ~4 times the original concentration of AgNC@HL-T6C7 fluorophores. Based on the excellent linear relationship presented in Figure 5, no lower limit of Hg2+ exists for the AgNC@HL-T6C7 design, which is quite advantageous for the monitoring of mercury content.
The performance of a biosensor is usually evaluated based on two critical parameters: sensitivity and specificity. We have showed that the AgNC’s sensitivity can be tailored by the rational design of stem–loop sequences. We next evaluated the specificity of the designed probes. Similar measurements of fluorescence quenching were performed using Cu2+ instead of Hg2+. The results presented in Figure S5 indicate that although sensitive, our DNA-AgNC biosensor is not very specific. The fluorescence of AgNC@HL-TMCN is effectively quenched by Cu2+ in the same range of concentrations. The quenching rates differ for AgNC@HL-T0C13 but appear very similar for AgNC@HL-T6C7. These results reinforced our conclusion that the sensitivity of the probe to the ionic analyte can be rationally designed by selecting the right sequence; however, AgNC@HL-TMCN probes are not completely specific to only one type of ion and recognize both Hg2+ and Cu2+. It is also apparent that the dynamic mechanism dominates the quenching of AgNC@HL-T6C7 fluorescence, making it a more manageable strategy for ion detection and monitoring. On the other hand, fluorescence quenching of AgNC@HL-T0C13 is ruled by a complex mix of both static and dynamic quenching mechanisms.

4. Conclusions

In conclusion, through the characterization of the optical properties of several hairpin-loop DNA templates used in this study, we were able to demonstrate that sensitive probes can be designed for the detection and monitoring of heavy metals, particularly mercury ions, Hg2+. HL templates allow for the reliable and reproducible synthesis of AgNCs, with 2D fluorescence patterns characteristic of specific CN loop sizes in the HL design of DNA. Fluorescence of AgNCs was found to be quenched in the presence of mercury by what appears to be a complex combination of dynamic and static mechanisms of quenching. Furthermore, we demonstrate that by replacing cytosines with thymines in the loop of HL structures, it is possible to (1) rationally design biosensors, and (2) modulate the sensing capability of the biosensor. We hypothesize that thymine mismatching pairs provide additional binding sites for mercury ions, changing thus the sensitivity range to which the sensors can respond. Our findings highlight the large flexibility of the design that can be afforded by novel fluorescently active AgNCs templated on DNA hairpin-loops for sensing applications.

Supplementary Materials

The following are available online at https://www.mdpi.com/article/10.3390/pr9101699/s1, Table S1: List of DNA template sequences used for this study, Figure S1: UV-vis characterization of AgNC@HL-TMCN designs, Figure S2: The trend of Stokes shift expressed in units of energy, cm−1, Figure S3: Titration of AgNCs@HL-C13 with different ratios of CAgNC/CHg2+, Figure S4: Linear regression analysis of quenching data points for AgNC@HL-T6C7, Figure S5: Comparative graph of quenching with Hg2+ and Cu2+ for AgNC@HL-T0C13 and AgNC@HL-T6C7.

Author Contributions

Conceptualization, P.D. and A.V.K.; software, E.K. and R.M.; validation, data acquisition, and formal analysis, L.Y., N.M., E.K., R.M.; supervision, A.V.K.; funding acquisition, A.V.K. All authors have read and agreed to the published version of the manuscript.

Funding

The work was partially supported by the ACS Petroleum Research Fund to AVK, ACS PRF 58498-UNI5.

Institutional Review Board Statement

Not applicable.

Informed Consent Statement

Not applicable.

Data Availability Statement

All data are available and can be shared upon request.

Acknowledgments

The authors would like to thank Ryan Riskowski (UNO) for use of the HORIBA Duetta Spectrometer.

Conflicts of Interest

The authors declare no conflict of interest.

References

  1. Deng, H.; Yu, H. A Mini Review on Controlling the Size of Ag Nanoclusters by Changing the Stabilizer to Ag Ratio and by Changing DNA Sequence. Adv. Nat. Sci. 2016, 8, 1–9. [Google Scholar] [CrossRef]
  2. Geczy, R.; Christensen, N.J.; Rasmussen, K.K.; Kálomista, I.; Tiwari, M.K.; Shah, P.; Yang, S.W.; Bjerrum, M.J.; Thulstrup, P.W. Formation and Structure of Fluorescent Silver Nanoclusters at Interfacial Binding Sites Facilitating Oligomerization of DNA Hairpins. Angew. Chem. Int. Ed. 2020, 59, 16091–16097. [Google Scholar] [CrossRef]
  3. Latorre, A.; Somoza, Á. DNA-Mediated Silver Nanoclusters: Synthesis, Properties and Applications. ChemBioChem 2012, 13, 951–958. [Google Scholar] [CrossRef]
  4. Gonzàlez-Rosell, A.; Cerretani, C.; Mastracco, P.; Vosch, T.; Copp, S.M. Structure and luminescence of DNA-templated silver clusters. Nanoscale Adv. 2021, 3, 1230–1260. [Google Scholar] [CrossRef]
  5. New, S.Y.; Lee, S.T.; Su, X.D. DNA-templated silver nanoclusters: Structural correlation and fluorescence modulation. Nanoscale 2016, 8, 17729–17746. [Google Scholar] [CrossRef] [PubMed]
  6. Yourston, L.E.; Lushnikov, A.Y.; Shevchenko, O.A.; Afonin, K.A.; Krasnoslobodtsev, A.V. First Step Towards Larger DNA-Based Assemblies of Fluorescent Silver Nanoclusters: Template Design and Detailed Characterization of Optical Properties. Nanomaterials 2019, 9, 613. [Google Scholar] [CrossRef] [PubMed] [Green Version]
  7. Yourston, L.; Rolband, L.; Lushnikov, A.; West, C.; Afonin, K.; Krasnoslobodtsev, A. Tuning properties of silver nanoclusters with RNA nanoring assemblies. Nanoscale 2020, 12, 16189–16200. [Google Scholar] [CrossRef] [PubMed]
  8. Sun, C.; Ou, X.; Cheng, Y.; Zhai, T.; Liu, B.; Lou, X.; Xia, F. Coordination-induced structural changes of DNA-based optical and electrochemical sensors for metal ions detection. Dalton Trans. 2019, 48, 5879–5891. [Google Scholar] [CrossRef]
  9. MacLean, J.L.; Morishita, K.; Liu, J. DNA stabilized silver nanoclusters for ratiometric and visual detection of Hg2+ and its immobilization in hydrogels. Biosens. Bioelectron. 2013, 48, 82–86. [Google Scholar] [CrossRef] [Green Version]
  10. Song, C.; Xu, J.; Chen, Y.; Zhang, L.; Lu, Y.; Qing, Z. DNA-Templated Fluorescent Nanoclusters for Metal Ions Detection. Molecules 2019, 24, 4189. [Google Scholar] [CrossRef] [Green Version]
  11. Ali, H.; Khan, E.; Ilahi, I. Environmental Chemistry and Ecotoxicology of Hazardous Heavy Metals: Environmental Persistence, Toxicity, and Bioaccumulation. J. Chem. 2019, 2019, 6730305. [Google Scholar] [CrossRef] [Green Version]
  12. Tangahu, B.V.; Sheikh Abdullah, S.R.; Basri, H.; Idris, M.; Anuar, N.; Mukhlisin, M. A Review on Heavy Metals (As, Pb, and Hg) Uptake by Plants through Phytoremediation. Int. J. Chem. Eng. 2011, 2011, 939161. [Google Scholar] [CrossRef]
  13. Wuana, R.A.; Okieimen, F.E. Heavy Metals in Contaminated Soils: A Review of Sources, Chemistry, Risks and Best Available Strategies for Remediation. ISRN Ecol. 2011, 2011, 402647. [Google Scholar] [CrossRef] [Green Version]
  14. Nolan, E.M.; Lippard, S.J. Tools and Tactics for the Optical Detection of Mercuric Ion. Chem. Rev. 2008, 108, 3443–3480. [Google Scholar] [CrossRef]
  15. Busairi, N.; Syahir, A. Recent Advances in Mercury Detection: Towards Enabling a Sensitive and Rapid Point-of-Check Measurement. J. Toxicol. Risk Assess. 2018, 4, 1–10. [Google Scholar] [CrossRef] [Green Version]
  16. Salek Maghsoudi, A.; Hassani, S.; Mirnia, K.; Abdollahi, M. Recent Advances in Nanotechnology-Based Biosensors Development for Detection of Arsenic, Lead, Mercury, and Cadmium. Int. J. Nanomed. 2021, 16, 803–832. [Google Scholar] [CrossRef]
  17. Wang, G.-L.; Zhu, X.-Y.; Jiao, H.-J.; Dong, Y.-M.; Li, Z.-J. Ultrasensitive and dual functional colorimetric sensors for mercury (II) ions and hydrogen peroxide based on catalytic reduction property of silver nanoparticles. Biosens. Bioelectron. 2012, 31, 337–342. [Google Scholar] [CrossRef]
  18. Yu, C.-J.; Tseng, W.-L. Colorimetric Detection of Mercury(II) in a High-Salinity Solution Using Gold Nanoparticles Capped with 3-Mercaptopropionate Acid and Adenosine Monophosphate. Langmuir 2008, 24, 12717–12722. [Google Scholar] [CrossRef]
  19. Sun, Z.; Li, S.; Jiang, Y.; Qiao, Y.; Zhang, L.; Xu, L.; Liu, J.; Qi, W.; Wang, H. Silver Nanoclusters with Specific Ion Recognition Modulated by Ligand Passivation toward Fluorimetric and Colorimetric Copper Analysis and Biological Imaging. Sci. Rep. 2016, 6, 20553. [Google Scholar] [CrossRef] [PubMed] [Green Version]
  20. Deng, L.; Zhou, Z.; Li, J.; Li, T.; Dong, S. Fluorescent silver nanoclusters in hybridized DNA duplexes for the turn-on detection of Hg2+ ions. Chem. Commun. 2011, 47, 11065–11067. [Google Scholar] [CrossRef]
  21. Petty, J.T.; Zheng, J.; Hud, N.V.; Dickson, R.M. DNA-Templated Ag Nanocluster Formation. J. Am. Chem. Soc. 2004, 126, 5207–5212. [Google Scholar] [CrossRef]
  22. O’Neill, P.R.; Velazquez, L.R.; Dunn, D.G.; Gwinn, E.G.; Fygenson, D.K. Hairpins with Poly-C Loops Stabilize Four Types of Fluorescent Agn:DNA. J. Phys. Chem. C 2009, 113, 4229–4233. [Google Scholar] [CrossRef]
  23. Rolband, L.; Yourston, L.; Chandler, M.; Beasock, D.; Danai, L.; Kozlov, S.; Marshall, N.; Shevchenko, O.; Krasnoslobodtsev, A.V.; Afonin, K.A. DNA-Templated Fluorescent Silver Nanoclusters Inhibit Bacterial Growth While Being Non-Toxic to Mammalian Cells. Molecules 2021, 26, 4045. [Google Scholar] [CrossRef]
  24. Svoboda, P.; Cara, A.D. Hairpin RNA: A secondary structure of primary importance. Cell. Mol. Life Sci. CMLS 2006, 63, 901–908. [Google Scholar] [CrossRef] [Green Version]
  25. Hunter, P. Nucleic acid-based nanotechnology: The ability of DNA and RNA to fold into precise and complex shapes can be exploited for applications both in biology and electronics. EMBO Rep. 2018, 19, 13–17. [Google Scholar] [CrossRef] [PubMed]
  26. Zhou, H.; Zhu, X. MicroRNA-21 and microRNA-30c as diagnostic biomarkers for prostate cancer: A meta-analysis. Cancer Manag. Res. 2019, 11, 2039–2050. [Google Scholar] [CrossRef] [PubMed] [Green Version]
  27. Volkov, I.L.; Reveguk, Z.V.; Serdobintsev, P.Y.; Ramazanov, R.R.; Kononov, A.I. DNA as UV light–harvesting antenna. Nucleic Acids Res. 2018, 46, 3543–3551. [Google Scholar] [CrossRef] [PubMed] [Green Version]
  28. Copp, S.M.; Gorovits, A.; Swasey, S.M.; Gudibandi, S.; Bogdanov, P.; Gwinn, E.G. Fluorescence Color by Data-Driven Design of Genomic Silver Clusters. ACS Nano 2018, 12, 8240–8247. [Google Scholar] [CrossRef] [PubMed]
  29. Ramazanov, R.R.; Kononov, A.I. Excitation Spectra Argue for Threadlike Shape of DNA-Stabilized Silver Fluorescent Clusters. J. Phys. Chem. C 2013, 117, 18681–18687. [Google Scholar] [CrossRef]
  30. Brown, S.L.; Hobbie, E.K.; Tretiak, S.; Kilin, D.S. First-Principles Study of Fluorescence in Silver Nanoclusters. J. Phys. Chem. C 2017, 121, 23875–23885. [Google Scholar] [CrossRef]
  31. Swasey, S.M.; Karimova, N.; Aikens, C.M.; Schultz, D.E.; Simon, A.J.; Gwinn, E.G. Chiral electronic transitions in fluorescent silver clusters stabilized by DNA. ACS Nano 2014, 8, 6883–6892. [Google Scholar] [CrossRef] [PubMed]
  32. Jabed, M.A.; Dandu, N.; Tretiak, S.; Kilina, S. Passivating Nucleobases Bring Charge Transfer Character to Optically Active Transitions in Small Silver Nanoclusters. J. Phys. Chem. A 2020, 124, 8931–8942. [Google Scholar] [CrossRef]
  33. Ma, H.; Xue, N.; Wu, S.; Li, Z.; Miao, X. Fluorometric determination of mercury(II) using positively charged gold nanoparticles, DNA-templated silver nanoclusters, T-Hg(II)-T interaction and exonuclease assisted signal amplification. Microchim. Acta 2019, 186, 317. [Google Scholar] [CrossRef]
  34. Lu, Z.; Wang, P.; Xiong, W.; Qi, B.; Shi, R.; Xiang, D.; Zhai, K. Simultaneous detection of mercury (II), lead (II) and silver (I) based on fluorescently labelled aptamer probes and graphene oxide. Environ. Technol. 2021, 42, 1–8. [Google Scholar] [CrossRef] [PubMed]
  35. Adhikari, B.; Banerjee, A. Facile Synthesis of Water-Soluble Fluorescent Silver Nanoclusters and HgII Sensing. Chem. Mater. 2010, 22, 4364–4371. [Google Scholar] [CrossRef]
  36. Yourston, L.E.; Krasnoslobodtsev, A.V. Micro RNA Sensing with Green Emitting Silver Nanoclusters. Molecules 2020, 25, 3026. [Google Scholar] [CrossRef]
  37. Lakowicz, J.R. Principles of Fluorescence Spectroscopy, 3rd ed.; Springer: New York, NY, USA, 2006. [Google Scholar]
  38. Zhang, Z.; Zhang, F.; He, P.; Zhang, X.; Song, W. Fluorometric determination of mercury(II) by using thymine-thymine mismatches as recognition elements, toehold binding, and enzyme-assisted signal amplification. Microchim. Acta 2019, 186, 551. [Google Scholar] [CrossRef]
Figure 1. (A) schematic representation of HL-C13 design; (B) AgNC synthesis; (C) AgNC hosted within the loop of HL-C13 has a single peak bright-red emission, AgNC@HL-C13; (D) bright red color is apparent under UV excitation.
Processes 09 01699 g001
Figure 2. Excitation–emission fluorescence maps of tested AgNCs templated on CN hairpin-loop structures: (A) AgNC@HL-C7; (B) AgNC@HL-C9; (C) AgNC@HL-C11; (D) AgNC@HL-C13; (E) AgNC@HL-C15; (F) AgNC@HL-C17; (G) AgNC@HL-C19. (H) The maximum of excitation/emission wavelengths for the most intense peaks of the AgNC@HL-CN.
Processes 09 01699 g002
Figure 3. Top panel schematically shows tested HL-TMCN hairpin-loop structures: (A) HL-T0C13; (B) HL-T2C11; (C) HL-T4C9; (D) HL-T6C7; color code is the same as in Figure 1. Excitation-emission fluorescence maps of tested AgNCs templated on TMCN hairpin-loop structures: (A) AgNC@HL-T0C13; (B) AgNC@HL-T2C11; (C) AgNC@HL-T4C9; (D) AgNC@HL-T6C7.
Processes 09 01699 g003
Figure 4. Fluorescence quenching of AgNC@HL-T0C13 by Hg2+. (A) Concentration dependent fluorescence spectrum of “red” emissive state, λEXC = 560 nm. (B) Stern-Volmer, F0/F vs. CHg2+, plot indicative of unusual quenching behavior of AgNC@HL-T0C13 fluorescence due to Hg2+. Red solid line is the fit of data points at low Hg2+ concentrations (0–2 μM) to Equation (1) and blue solid line is the fit to Equation (2). The inset in Figure 4B shows an enlarged region of low Hg2+ concentrations between 0–2 μM.
Processes 09 01699 g004
Figure 5. Fluorescence quenching curve plotted as (F0−F)/F0 vs. CHg2+. Blue—AgNC@HL-T0C13, green—AgNC@HL-T2C11, burgundy—AgNC@HL-T4C9, red—AgNC@HL-T6C7. Measurements were omitted in the range indicated by brackets.
Processes 09 01699 g005
Table 1. Comparison of the main “red” peak positions, λEXC and λEM, for AgNC@HL-TMCN.
HL-T0C13HL-T2C11HL-T4C9HL-T6C7
λEXC, nm560562568550
λEM, nm640642636640
Publisher’s Note: MDPI stays neutral with regard to jurisdictional claims in published maps and institutional affiliations.

