Abstract
Active pharmaceutical ingredients (API) with suboptimal pharmacokinetic properties may require formulation into nanoparticles. In addition to the quality of the excipients, production parameters are crucial for producing nanoparticles which reliably deliver APIs to their target. Microfluidic platforms promise increased control over the formulation process due to the decreased degrees of freedom at the micro- and nanoscale. Publications about these platforms usually provide only limited information about the soft- and hardware required to integrate the microfluidic chip seamlessly into an experimental set-up. We describe a modular, low-budget prototype for microfluidic mixing in detail. The prototype consists of four modules. The control module is a raspberry pi executing customizable python scripts to control the syringe pumps and the fraction collector. The feeding module consists of up to three commercially available, programable syringe pumps. The formulation module can be any macro- or microfluidic chip connectable to syringe pumps. The collection module is a custom-built fraction collector. We describe each feature of the working prototype and demonstrate its power with polyplexes formulated from siRNA and two different oligomers that are fed to the chip at two different stages during the assembly of the nanoparticles.
1. Introduction
Packaging active pharmaceutical ingredients (API) into nanoparticles can alter the pharmacokinetic properties of drugs fundamentally [1,2,3]. It is a well-established strategy to improve the biodistribution of small molecule drugs like paclitaxel [4] as well as larger, oligomeric drugs like nucleic acids [5,6].
Many methods have been developed to produce nanoparticles containing the target API either with the top-down [7,8,9,10,11] or the bottom-up approach [12]. Mixing cationic oligo- or polymeric excipients with negatively charged nucleic acids to induce nanoparticle formation, for example, is an established method from the bottom-up approach [13]. These nanoparticles are named polyplexes [14].
The properties of polyplexes and ultimately their effectiveness is determined by their individual components and the formulation process parameters [15].
On the one hand, polyplex properties can be controlled by the application of solid-phase supported synthesis (SPSS) [16] to precisely design the chemical components of the polyplex. This technique enables the synthesis of oligomers with defined structures, for example, sequence defined oligo(ethanamino)amides [17]. These oligoamides form the backbone of more elaborate structures with additional functional elements integrated at exactly defined places in the oligomer sequence [18,19].
On the other hand, the formulation process as well exerts a decisive influence on the polyplex characteristics. The polyelectrolyte complex formation is thermodynamically favorable due to a high entropy gain from counter ion released during complexation [20]. Nevertheless, formulation parameters determine the polyplex properties due to kinetic control over the complex formation process [21].
These considerations indicate that both the production process and the defined poly-plex components are important for the therapeutic success of the final formulation. One approach to reduce unintended variation of process parameters is the automation of the process. For example, particle properties can be improved measurably by controlling the educt feeding rates to a T-junction to produce lipoplexes [22] or polyplexes [23].
Additionally, transferring the mixing process to the micrometer scale reduces the degrees of freedom of the system [24]. At this scale, forces from interfaces greatly surpass inertial forces that dominate the macro scale [25]. These effects are exploited in microfluidic devices and potentially lead to an increased control over the mixing process itself. Many studies have demonstrated that methods based on microfluidics can improve the physicochemical properties of nanoparticles [26,27,28,29]. In our previous publication [30], we demonstrated that the application of a microfluidic chip increased control over the sequential polyplex formulation process by exploiting the advantages of solvent exchange in combination with flow focusing inside the microchannel. The educts and the production method are depicted in Figure 1. Sequence-defined formulation components were a lipo-oligomer for nanoparticle core formation [31], a lipid anchor-polyethylene glycol (PEG)-ligand for coating [30], and siRNA. Schematics of the utilized microfluidic chips (Supplemental Figures S1 and S2) are presented in the Supplemental Information. The resulting multi-component polyplexes were well-defined due to the increased level of control over the formulation process and allowed the establishment of structure-function relationships between the PEG-ligand length and the siRNA transfection efficiency [30].
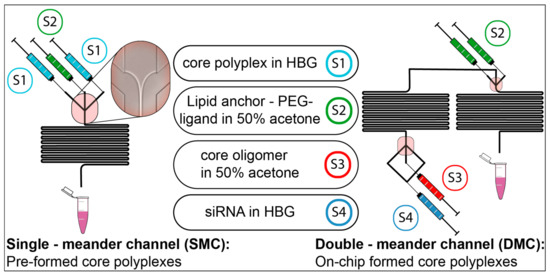
Figure 1.
Production methods for polyplexes from oligomers and siRNA. Formulation components used are depicted with the id label of their corresponding syringe (S1–S4). Two different channels were used to produce nanoparticles during solvent exchange, a single meander channel (left) and a double meander channel (right). In the single meander channel, pre-assembled core particles (S1) were mixed with lipid anchor polyethylene glycol (PEG)-ligand oligomer (S2). In the double meander channel, the polyplex was assembled by microfluidics in two subsequent steps from its starting components (S3, S4, S2). PEG: polyethylene glycol. HBG: HEPES buffered glucose pH 7.4. Core oligomer (S3): cationic lipo-oligomer. Lipid anchor-PEG-ligand (S2): oligomer containing fatty acids to hydrophobically adsorb to the core oligomer, a PEG chain and folic acid as ligand for the folate receptor. Core polyplex (S1): polyplex from siRNA (S4) + core oligomer (S3). Reproduced with modification from Loy et al., 2019 [30], https://doi.org/10.7717/peerj-matsci.1/fig-1. under copyright permission from PEERJ.
Exploiting the benefits of automated nanoparticle production systems is often associated with significant investments in hardware, software, and development work to integrate any microfluidic platform into a typical lab environment. To ameliorate this problem, we have developed a modular, low budget system around the microfluidic chips from our previous publication [30]. The system can easily integrate most microfluidic platforms driven by syringe pumps into its setup. Here, we describe the set-up of the system and its application in detail using educts from our previous publication as an example.
2. Results
The complete nanoparticle production system is depicted in Figure 2. It consists of four modules that can be used independently: the feeding module—up to three programmable syringe pumps—is responsible for supplying educts to the formulation module, which can be any macro or microfluidic chip. The collection module—a custom-built fraction collector—is responsible for collecting the final product into standardized well plates. The control module is a remotely accessible raspberry pi which controls the syringe pumps via a Recommended Standard 232 (RS232) interface and the fraction collector via the general-purpose input/output (GPIO) pins. The design of the fraction collector as well as the python program code are published together with this paper on GitHub [32]. This setup allows the employment of most microfluidic chips while additionally providing the ability to sample the product from the chip directly into standardized well plates. We describe all modules in detail in the following sections.
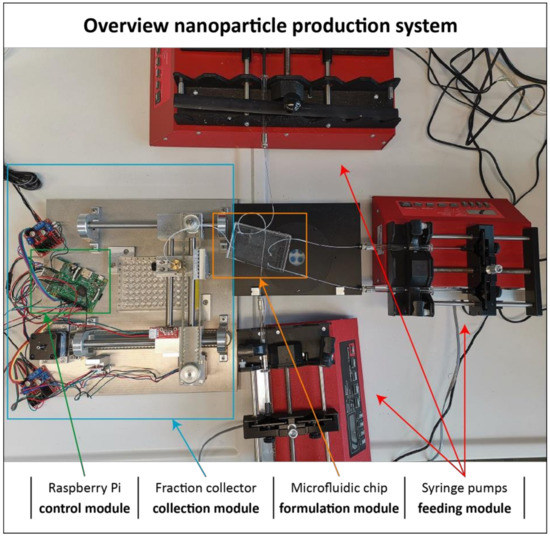
Figure 2.
Overview over the nanoparticle production system. The system consists of four modules that can be used independently. The control module (green) is a raspberry pi which controls the collection module (blue), a custom-built fraction collector, via its GPIO pins. The raspberry pi controls the feeding module (red) via the RS232 interface. It is assembled from up to three syringe pumps. The formulation module can be any macro or microfluidic chip.
2.1. Control Module
The control module is a raspberry pi model 3B. It is a small and inexpensive single-board computer with open hardware, e.g., general-purpose input/output (GPIO) pins. We used the open source operating system (OS) Raspbian version 9 (Stretch) with the open source programming language Python version 3.7.3 for this system. The python code for controlling the feeding module and the collection module is available on our GitHub repository [32].
We chose this computer because of several features. First, its size together with the ability to access it remotely over the network increases the mobility of the complete device. Second, its various interfaces enable the communication with the feeding module via a USB to RS232 interface as well as the communication of the collection module via the GPIO pins. Third, it can be easily replaced by any other computer from the raspberry pi family since it is cheap and the OS together with all data, e.g., the logs of each experiment, are stored on a micro SD card. Therefore, changing the control module, e.g., because it was damaged or more computing power is needed, is only a matter of switching the SD card into the new device.
2.2. Feeding Module
The feeding module consists of up to three syringe pumps that are daisy-chained to the raspberry pi via a R232 to USB interface. Here, we used LA120, LA122, and LA160 from Landgraf Laborsysteme HLL GmbH. LA120 and LA160 are standard syringe pumps with two and six channels, respectively. LA122 is microfluidic syringe pump with two channels which is especially suited for dispensing smaller volumes due to its higher precision.
In principle, any syringe pump can be integrated into the system if it satisfies the following prerequisites: First, the pumps must have an interface that can be connected to the control module, e.g., the RS232 serial interface. Second, the pump must be programmable. In order to reduce the risk of interferences during particle production, the complete program is written to the pumps in advance and the pumps execute the production program independently. If a pump with a different command structure is integrated into the system, however, commands sent to the pump must be adjusted. A detailed description on changing commands sent to the pumps can be found in the Supplemental Information (3.2.3. Module: Module_pumps.py).
The control program of the feeding modules consists of six modules that are described in detail in the Supplemental Information (3.2. Description of the python modules) together with a Unified Modeling Language (UML) class diagram to illustrate the dependencies between the classes of the modules (Figure S3). The main module that calls the required functions from the respective modules to execute a certain pumping program is called ‘main.py.’ We provide a library with different ‘main[…].py’ modules. If the module ‘main.py’ is executed, the user will be asked to input all parameters during runtime, e.g., flow rates and volumes. If one of the modules ‘main_[…]_automated.py’ is executed, the parameters defined in the module will be used to run the pre-defined pumping program without requiring any user input. These modules serve as examples of how to define target variables and how to customize the main module. The code of the ‘main.py’ module is described in the Supplemental Information (3.2.7. Modules main[…].py).
Several features are implemented in the control program to simplify the employment of different formulation modules, to document experiments, and to save educts: first, formulation module specifications are loaded into the program during runtime from a simple text file. In order to employ a new channel, an updated text file needs to be supplied to the program. A detailed description on adding new formulation module specifications can be found in the Supplemental Information (3.2.1 Module: channels.py). Second, a logging function was integrated into the program, which writes every event and its timestamp to a text file stored on the control module. This log can be used for documenting and for troubleshooting purposes. Third, the implementation of ramping and purging capabilities reduces the waste of educts to a minimum. When large flow rate changes occur (e.g., when a pump is started), the system needs some time to adapt to the increased pressure. This can lead to the retardation of educts due to the elasticity of the system. Bringing educts efficiently (i.e., without wasting time or educts) to the mixing zone without involuntarily changing the volume ratios is challenging especially at the beginning of a new run. The easiest solution would be to use the flow rates of the first experiment to pump all educts to the mixing zone. Applying this strategy, however, increases waste of time and educts in relation to the flow rate differences between the educts. Ramping all educts to the mixing zone without changing the mean flow rate alleviates this problem and prevents unnecessary waste.
Additionally, employing the ramping protocol can reduce the backflow from the syringe pumps. During transition from preparations to formulation, the ramping protocol ensures a smooth transition between flow rate changes and keeps the overall flow rate constant, minimizing pressured changes that can provoke backflows. Moreover, when flow rates need to be changed during the formulation of the product, the program automatically inserts an overlap volume between those two fractions to allow some time for the flow to stabilize again. The overlap volume can be adjusted according to the magnitude of the flow rate changes. If large flow rate changes take place (e.g., when flow rates between slow and fast pumping pumps are interchanged), the modularity of the program allows another execution of the ramping protocol. Furthermore, fractions affected by backpressure instabilities can automatically be excluded using the collection module.
The ramping program is described in the Supplemental Information (3.2.5. Module: ramping_class.py).
The purging functions enable the user to choose the least expensive reagent to purge the product from the channel after the experiment. A detailed description of this function can be found in the Supplemental Information (3.2.6. Module: mixing_class.py).
A flowchart describing the workflow from starting the system to collecting the final product(s) and resetting the system to its original state is shown in the Supplemental Information (Figure S4).
2.3. Formulation Module
The formulation module can be any micro- or macrofluidic chip that is connectable to syringe pumps. In our prototype, we employed two different microfluidic chips that are based on the design from Krzysztoń et al. [29]. These chips are made from poly-dimethylsiloxane (PDMS) bonded to glass slides. Both chips exploit the advantages of solvent exchange in combination with flow-focusing inside the microchannel to produce polyplexes from siRNA and polycationic oligomers. The layout of both chips together with the utilized educts is shown in Figure 1. The single meander channel (SMC) employs the design of a Y-junction followed by a long meandering channel section while the double meander channel (DMC) features two successive Y-junctions followed by their respective meandering section which allows the assembly of polyplexes in two consecutive steps. Detailed schematics of both channels are shown in the Supplemental Information (SMC: Figure S1, DMC: Figure S2). The chips were made from polydimethylsiloxane (PDMS) bonded to glass slides. Wang et al. [33] have made suggestions to increase durability of these chips. We used both chips in our previous publication to produce well-defined, multi-component polyplexes that allowed the establishment of structure-function relationships between PEG-ligand length and transfection efficiency due to the increased level of control over the formulation process [30]. Here, we only show data produced with the DMC to highlight the potential of the device to produce sophisticated formulations. For a comparison of the core formulation (siRNA and CO) prepared by the SMC, at a T-junction, or by rapid pipetting, please see Figure 2 in our previous publication [30].
2.4. Collection Module
The design is based on previously published work [34]. It was optimized for greater robustness and user safety, especially by choosing aluminum to decrease wear, increase resistance to common solvents (except acids), and to increase the accuracy of fit of the machine. Increased user safety was realized by including stop switches into the design.
The fraction collector is controlled by a raspberry pi 3, model B running Raspbian GNU/Linux 9 (stretch). The raspberry pi controls the fraction collector via input/output (GPIO) pins. Figure 3 shows an overview of the complete fraction collector (Figure 3A), the wiring of each component (Figure 3B,D), and the GPIO pin assignment (Figure 3C).
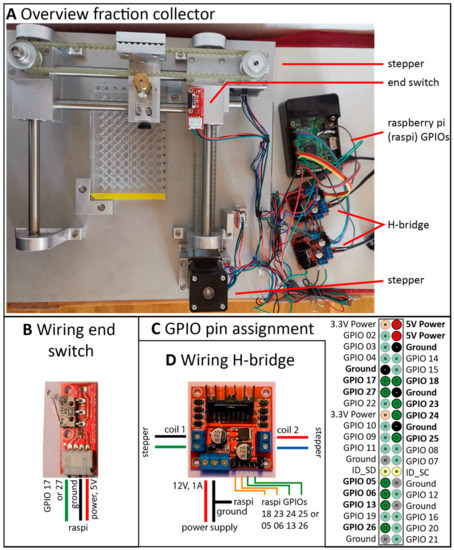
Figure 3.
Overview over the fraction collector. (A) Overview fraction collector. (B) Wiring of the end switches. The end switches are supplied with 5V power from the pins of the raspberry pi, and the signal is sent from the switches to GPIO 17 or 27 (green wire). (C) GPIO pin assignment. Schematics of the GPIO pins of the raspberry pi. Saturated colors and bold script indicate utilized pins. (D) Wiring of the H-bridge. Each H-bridge controls one stepper motor. Power is supplied by a 12 V, 1 A switching power supply and routed to each stepper motor by four output wires (coil one: black and green wires; coil two: red and blue wires). Power distribution is controlled by the GPIO pins. GPIOs 18 and 23 or 05 and 06 (orange wires) control the direction of coil one, while GPIOs 24 and 25 or 13 and 26 (light green wires) control the direction of coil two.
The control program for fraction collector is an independent piece of software. This approach allows the integration of the collector control software into the pumping program but enables usage of this device with other, non-automated processes, as well. It consists of three modules which are described in detail in the Supplemental Information (4.2. Description of python modules). The main module is called ‘main.py.’ It calls the required functions from the respective modules to execute a certain collection program. The module serves as example how to define target variables and how to customize the collection program. A video documenting the execution of the ‘main.py’ module can be found on GitHub [32]. The code of the ‘main.py’ module is described in the Supplemental Information (4.2.3. Module: main.py). A complete list of all classes and functions of the modules can be found on GitHub, as well [32]. The dependencies between the classes of the program are depicted in a UML class diagram in the Supplemental Information (Figure S3).
2.5. Application for Polyplex Formation
In the following, we highlight the importance of precisely defined process parameters and show the formulation of three component polyplexes with the automated nanoparticle production system.
Figure 4 demonstrates the influence of formulation parameters on polyplexes formulated from two components by rapid pipetting. By adjusting the volume ratios and the mixing order of the oligomer and siRNA solutions, significant changes in size (hydrodynamic diameter) and polydispersity index (PDI) can be achieved.
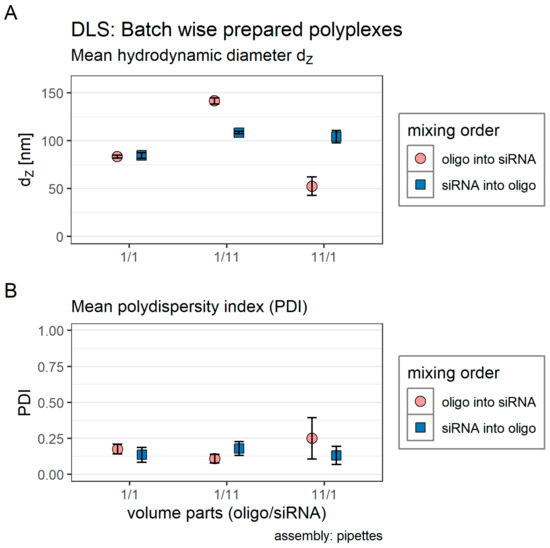
Figure 4.
Influence of formulation conditions on manually prepared polyplexes (oligomer CO + siRNA). Dynamic light scattering (DLS) data are represented as the mean of three measurements. Color and shape encode the mixing order. The volume parts of both educts are denoted on the x-axis. Total volume was 70 μL for each solution. That means, for example, that 64.2 μL of a diluted oligomer solution (oligo) was pipetted to 5.8 μL of a concentrated siRNA solution (light red dot, volume parts 11/1). Blue square: siRNA was pipetted into an oligomer solution. Red dot: The oligomer solution was pipetted into a siRNA solution. (A) Mean hydrodynamic diameter (z-average). (B) Mean polydispersity index (PDI). Statistics: Error bars correspond to 95% confidence intervals. N = 3.
For this experiment we produced polyplexes using siRNA and a core oligomer (CO) [30,31]. Light red dots present data obtained after the oligomer solution was pipetted into the siRNA solution, and blue squares represent the result after pipetting the siRNA into the oligomer solution. The number written on the x-axis denotes the volume parts of the two solutions in the final solution. The final volume of each solution was always 70 μL. For example, data resulting in the third light red dot (11/1 on the x-axis) were obtained from 64.2 μL oligomer solution that was pipetted to 5.8 μL siRNA solution.
Mixtures of equal volumes of educts solutions produced comparable hydrodynamic diameters (Figure 4A, circle: 82.5 ± 2.7 nm, square: 84.4 ± 3.1 nm) and PDIs (Figure 4B, circle: 0.151 ± 0.058, square: 0.136 ± 0.052) independent of the mixing order. If unequal volumes were mixed, however, the mixing order influenced particle characteristics significantly. Pipetting a smaller volume of the oligomer solution into a larger volume of the siRNA solution (1/11 on the x-axis) produced larger polyplexes (141.0 ± 3.2 nm) with a smaller PDI (0.109 ± 0.030), while mixing siRNA solution to an oligomer solution produced smaller particles (108.0 ± 1.4 nm) with a larger PDI (0.180 ± 0.048).
Pipetting a larger volume of the oligomer solution to a smaller volume of the siRNA solution (11/1 on the x-axis) produced very small particles (Figure 4A, 52.5 ± 9.7 nm) with a larger PDI (Figure 4B, 0.249 ± 0.144). Mixing diluted siRNA solution to concentrated oligomer solution produced slightly larger particles (104.0 ± 6.5 nm) with a comparable PDI (0.131 ± 0.063) in comparison to polyplexes from mixtures of equal volumes. The 95% confidence intervals from the z-average as well as from the PDI, however, were very large, indicating the presence of particles from different size classes.
Nanoparticles formulated from more than two components usually require increased control over the production process. Figure 5 highlights this critical issue. The formulation (siRNA/CO; 1/1 on the x-axis, light red dot) described in Figure 4 was further modified with a third oligomer that contributes shielding and targeting features to the nanoparticle. It consists of a lipid anchor for integrating into the core particle, a PEG12 chain for shielding purposes and an azide moiety that allows the simple addition of further shielding and targeting ligands via strain-promoted azide-alkyne click chemistry [35]. Here, we utilize the two simplest versions of the lipid anchor oligomer with a free azide moiety and with (LPOE) or without (LPO) two additional glutamic acids (E). The sequences of all oligomers are depicted in the Supplemental Information (Figure S7). Results from in vitro experiments with these three component polyplexes with PEG-Folic acid ligands with 12 to 60 ethylene oxide repetitions can be found in our previous publication [30]. In the same publication, we compared the influence of the production method on the biological activity of two component polyplexes. We were able to demonstrate comparable biological activity in vitro [30].
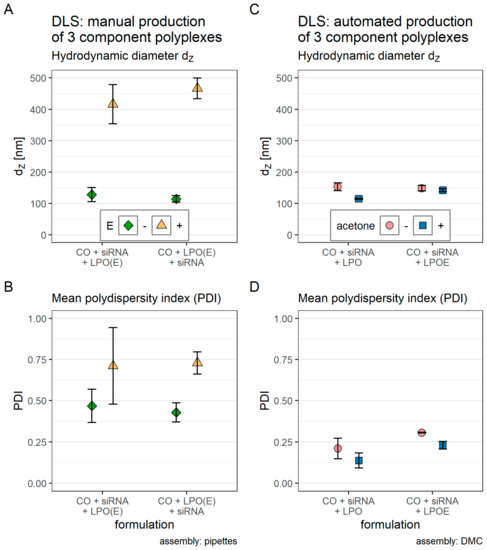
Figure 5.
Manual or automated formulation of three component siRNA polyplexes. DLS data are represented as the mean of three measurements. Color and shape encode either the difference in the sequence of lipid anchored PEG12 oligomers (LPO, with or without E (glutamic acid), panel A,B) or the difference in formulation conditions (oligomer CO dissolved in HBG with or without 50% acetone, panel C,D). (A,B): polyplexes were formulated manually by mixing all educts with pipettes. The mixing order is denoted on the x-axis. Orange triangle: the sequence of the LPO contains two additional glutamic acids. Green diamond: no additional glutamic acids. (C,D): polyplexes were formulated automatically inside the double meander channel (DMC, Figure 1) by the nanoparticle production system. Flow rates: siRNA 900 μL/h (S4), CO 100 μL/h (S3). LPO(E) 50 μL/h (S2, two syringes). Total flow rate: 1100 μL/h. The educts are denoted on the x-axis. Red dots: CO was dissolved in HBG only. Blue squares: CO was dissolved in HBG with 50% acetone. (A,C): mean hydrodynamic diameter (z-average). (B,D): Mean polydispersity index (PDI). Error bars correspond to 95% confidence intervals. N = 3. Raw data were selected from our previous publication [30], here presented in a new format.
In Figure 5A,B, equal volumes of the three educts were mixed sequentially by rapid pipetting according to the order of appearance denoted on the x-axis. Color and shape indicate if LPO or LPOE was used. Manual production of three component polyplexes from CO, siRNA, and LPO yielded polyplexes with suboptimal hydrodynamic diameters and PDIs regardless of mixing order (CO + siRNA + LPO: dZ = 416.2 ± 62.5 nm, PDI = 0.711 ± 0.233; CO + LPO + siRNA: dZ = 466.7 ± 33.1 nm, PDI = 0.792 ± 0.068). When LPO was replaced with LPOE, the mean hydrodynamic diameter of the polyplexes was reduced to acceptable levels, but the mean PDI was still too large (CO + siRNA + LPOE: dZ = 128.2 ± 22.4 nm, PDI = 0.468 ± 0.101; CO + LPOE + siRNA: dZ = 114.5 ± 1.5 nm, PDI = 0.428 ± 0.058).
In Figure 5C,D, polyplexes from the three educts were produced automatically inside the double meander channel (DMC) by the nanoparticle production system. In the first mixing zone, CO and siRNA were mixed. The color and the shape of the data points indicate if CO was dissolved in HBG with or without 50% acetone. In the second mixing zone, LPO or LPOE was added to the mixture. Polyplexes prepared from CO dissolved in HBG only showed slightly higher hydrodynamic diameters dZ and PDI (CO + siRNA + LPO: dZ = 153.0 ± 12.7 nm, PDI = 0.210 ± 0.062; CO + siRNA + LPOE: dZ = 148.2 ± 8.7 nm, PDI = 0.306 ± 0.003) in comparison to polyplexes prepared from CO dissolved in HBG with 50% acetone (CO + siRNA + LPO: dZ = 114.7 ± 1.5 nm, PDI = 0.137 ± 0.045; CO + siRNA + LPOE: dZ = 141.9 ± 4.7 nm, PDI = 0.230 ± 0.022).
Automated production of three component polyplexes (CO + siRNA + LPO) generated nanoparticles with smaller hydrodynamic diameters and PDIs compared to manually prepared polyplexes. Incorporating glutamic acid into the structure of the lipid anchor PEG12 oligomer facilitated the production of polyplexes with comparable mean hydrodynamic diameters regardless of production method. Nevertheless, the PDI of manually prepared polyplexes was still larger than the PDI of polyplexes prepared with the nanoparticle production system.
3. Discussion
A detailed description of the automated nanoparticle production system, its hardware, and its software is provided. The control module is inexpensive, and its parts are readily available. The feeding module integrates syringe pumps as commonly applied in microfluidic systems such as in Liu et al. (PHD 2000, Harvard Apparatus) [36], Debus et al. (Aladdin, World precision Instruments) [37], Lim et al. (model unspecified, Harvard Apparatus) [38], Karnik et al. (SP220I, World Precision Instruments and PHD 22/2000, Harvard Apparatus) [39], and Belliveau et al. (KD200, KD Scientific) [27]. The schematics of the collection module are published together with this paper on GitHub [32], enabling the replication of this module in any workshop. Additionally, building the collection module with additive fabrication methods, e.g., 3-D printing, might also be feasible.
The software that controls the feeding and the collection module enhances the functionality of any formulation module. With a specific, customized main module for each individual experiment, reproducibility is increased since every production cycle follows the same commands. Additionally, logs of each experiment are available to document the intended execution of the program. With each main module tailored to the specific needs of any experiment, repeating an experiment is done by simply executing the program again. Additional benefits of employing the software to control the feeding module are the ramping and purging functionalities that reduce the waste of educts to a minimum. These functionalities are cumbersome at best to program into each pump manually, but readily available in our software. The ramping functions ensure that all educts reach the mixing zone at the same time and the purging functions enable the user to choose the least expensive reagent to purge the product from the channel after the experiment.
Although volumes and flow rates of each experiment can be taken from its log, the components and concentrations must still be recorded manually. We have demonstrated the importance of detailed experiment descriptions with polyplexes prepared manually from two components. Changing the volume ratios of the educts and the mixing order varied the hydrodynamic diameter and PDI of the resulting polyplexes from 52.5 ± 9.7 nm to 141.0 ± 3.2 nm and 0.249 ± 0.144 to 0.109 ± 0.030, respectively. The effect of volume ratios on particle sizes is probably due to turbulences of varying intensity, which usually promote faster mixing of the educts. This effect is especially important during the polyplex complexation process since charge neutralization occurs in around 50 ms [21]. Additionally, we demonstrated that some formulations might be impossible to be produced with pipettes and require a formulation module—especially formulations from three or more components seem to benefit from the increased control of a microfluidic setup. Krzysztoń et al., for example, improved the efficiency of their mNALP (monomolecular nucleic acid/lipid particles) formulation by microfluidic mixing on the same hydrodynamic flow-focusing chip without our device [29]. We have prepared three component polyplexes manually and automatically. Polyplexes prepared by rapid pipetting showed hydrodynamic diameters and PDIs in suboptimal ranges. With the automated nanoparticle production system, polyplexes with dZ = 114.7 ± 1.5 nm and PDI = 0.137 ± 0.045 could be produced. This finding and the application of the automated nanoparticle production system enabled the establishment of structure-function relationships from three component polyplexes in our previous publication [30].
Sizes and PDIs in a desired range, however, do not automatically guarantee superior biological activity of target nanoparticles in vitro or in vivo. On the one hand, nanoparticles produced with controlled methods might show improved formulation characteristics and equal (but not better) biological activity. Members from our lab, for example, demonstrated the reproducible production of polyplexes from pDNA and LPEI (linear polyethylene imine) with an up-scaled micro-mixer. Compared with manually formulated polyplexes, both formulations showed comparable biological activity in vitro [23]. On the other hand, formulations with larger PDIs and sizes might show apparently better transfection efficiencies in vitro. This is usually due to large particles literally “dropping” on the cells fixed to the bottom of the cell culture flask. A formulation with these properties, however, might fail in vivo.
All in all, the application of this versatile software enables the creation and automated execution of a sophisticated program consisting of many individual steps in order to increase control over the formulation process of nanoparticles and foster reproducibility, which will be most relevant for pharmaceutical production.
The next step on the course to automation is the integration of a fraction collector. The device developed here was designed to work with any standard well plate to realize product collection and separation. It is independent of the previously mentioned setup, which makes it suitable for a wide range of applications. It can be integrated into the target automated process, but it can also be used to gather products produced manually. Overall, it is a versatile addition to any product formulation setup relieving the user of additional manual labor.
A well-known disadvantage of microfluidic systems is the scalability problem [24]. Due to the utilization of fluid phenomena—for example, laminar flow—which are only present under certain conditions, the throughput of one microfluidic chip cannot be escalated indefinitely [25]. The obvious solution to employ parallelization is a valid suggestion, but product output does only scale linearly in relation to dedicated resources at the current development stage of the system due to the many individual steps involved in setting up the device. However, a possible solution is already designed in the system. Since the setup is modular, any part of it can easily be replaced by a more efficient one [40].
Placing the complete system into a laminar flow cabinet is a next obvious step for pharmaceutical applications. In the described work, nanoparticles were formulated outside of the cabinet and subsequently transferred inside for in vitro transfections of cells. With the complete system inside the cabinet, direct application of the product to the target cells could be achieved, which would decrease the influences of external factors and human interactions even further.
4. Materials and Methods
4.1. Materials
The materials and the software used for the control module are listed in the Supplemental Information (2.1. Materials, Table S2; 2.2. Software, Table S3).
The materials used for building the feeding module are listed in the Supplemental Information (3.1. Materials, Table S4).
Materials used for building the formulation modules used in this publication are listed in the Supplemental Information (1.1. Materials, Table S1).
The design and the manufacturing procedure of the microfluidic chips is described in Krzysztoń et al., 2017 [29].
In brief, the design of the microfluidic channels was realized on a silica wafer with soft lithographic methods. The finished wafer was covered with polydimethylsiloxane (PDMS) mixed with 10% (w/w) crosslinker, degassed, and cured (75 °C, 4 h). Subsequently, the solid PDMS was cut and removed from the wafer. Inlets and outlets were pierced with a biopsy puncher and the channel was bonded to a glass slide with an oxygen plasma cleaner (Diener Electronic; 10 W high frequency generator power, 12 s, Pico Model E). Polyethylene tubes (length: 110 mm, inner diameter 0.38 mm) were fitted to the holes and the complete chip was covered in another layer of PDMS to increase resistance to pressure. Wang et al., 2014 investigated the tubing of PDMS channels and offer an improved protocol to prevent channel leakage [33]. Each new channel was tested before application with a standard formulation. The size and PDI measured by DLS were compared to the results from the same formulation produced with the previous channel. A to-scale model of the channels can be found in the Supplemental Information (1.2. Schematics, Figures S1 and S2). We calculated the Reynold’s number (Re), Dean’s number (De), and backpressure (ΔP) for the SMC and DMC at a total flow rate of 1500 μL/h: SMC: Re ≈ 3, De ≈ 1.23, ΔP = 1249.4 mbar; DMC: Re ≈ 2.5, De ≈ 1.25, ΔP = 2498.8 mbar. Solvents used in this paper are classified as low-solubility solvents which are compatible with microfluidic systems fabricated in PDMS by Lee et al. Therefore, they are unlikely to cause considerable changes to the channel geometry due to swelling [41].
Materials used for building the collection module are listed in the Supplemental Information (4.1. Materials, Table S5).
A prototype of the collection module (fraction collector) was built according to the design published at GitHub (https://github.com/Dominikmloy/fraction-collector.git). All parts were cut from aluminum, except the parts noted below. The prototype was built by the workshop of the LMU Munich.
Materials for the formulation of polyplexes and DLS measurements: The synthesis of the oligomers (CO: id = 991, LPO: id = 1203, LPOE: id = 1223) and the required materials are described in detail in [30,31]. The sequences of all oligomers are depicted in the Supplemental Information (5. Oligomers, Figure S7). Solvents: Purified water (produced with Ultra Clear GP UV UF, Evoqua Water Technologies GmbH, Günzburg, Germany), acetone HPLC grade (VWR international GmbH, Darmstadt, Germany). Chemicals: 4-(2-hydroxyethyl)-1-piperazineethanesulfonic acid ultra-pure (HEPES, Biomol GmbH, Hamburg, Germany), D(+)glucose monohydrate DAB (Loewe Biochemica GmbH, Sauerlach, Germany), NaOH pellets puriss. (VWR international GmbH, Darmstadt, Germany), NaOH 1M standard solution (Thermo Fisher Scientific GmbH, Schwerte, Germany), HCl 1M standard solution (VWR international GmbH, Darmstadt, Germany). Nucleic acids: siGFP sense: 5′-AuAucAuGGccGAcAAGcAdTsdT-3′, antisense: 5′-UGCUUGUCGGCcAUGAuAUdTsdT-3′ (Axolabs, Kulmbach, Germany). Small letters: 2′ methoxy; s: phosphorothioate.
4.2. Methods
4.2.1. Polyplex Preparation
Polyplexes were prepared with a final siRNA concentration of 0.025 mg/mL. A nitrogen to phosphate (N/P) ratio of 12 was used to determine the amount of core oligomer CO relative to the amount of siRNA. The N/P ratio relates the number of positive charges from the primary and secondary amines in the oligomer’s backbone to the number of negative charges from the phosphates in the siRNA’s backbone. The manual method of polyplex preparation was done with pipettes and rapid mixing in a batch wise process. The solvent—if not noted differently—was HEPES buffer pH 7.4 with 5% glucose (HBG). This buffer was used because it does not rely on salts to be isotonic, since polyplex formation relies on charge interactions that could be hampered by ions.
Manual polyplex preparation: CO solution (0.504 mg/mL) was added quickly to a siRNA solution (0.05 mg/mL) of equal volume and mixed by rapid pipetting, achieving a final siRNA concentration of 0.025 mg/mL. Subsequently, the formulation was incubated for 45 min. Concentrations and volumes for mixing polyplexes from unequal volumes were adjusted accordingly: 5.8 μL of CO at 3.023 mg/mL, or 64.2 μL of CO at 0.275 mg/mL. 64.2 μL of siRNA at 0.027 mg/mL, or 5.8 μL of siRNA at 0.300 mg/mL.
For the manual formulation of three component polyplexes, equal volumes (27.7 μL) of CO solution (0.637 mg/mL) and siRNA solution (0.063 mg/mL) were used. The amount of LPO and LPOE was set to 20 mol% relative to CO. Concentrations were set to 0.207 mg/mL LPO, 0.224 mg/mL LPOE, volumes were 14.6 μL. Solutions were mixed sequentially by rapid pipetting. When siRNA was used in the first step, a ten-minute break was taken after the two components were mixed to allow the polyplex to stabilize. After the addition of the third component, the formulation was incubated for 45 min before DLS was measured.
Automated polyplex preparation: The formulation module with the double meander channel (DMC) was used without any additional surface treatment (Figure 1). Before each usage, the channel was washed and primed with the same solvents that were used to produce the polyplexes. Details about the washing/priming process can be found in the Supplemental Information (3.2.4 Module: setup.py). siRNA in HBG (0.033 mg/mL) was loaded into S4 (FR = 900 μL/h) and CO (3.025 mg/mL) in HBG or HBG with 50% acetone to retard siRNA compaction was loaded into S3 (FR = 100 μL/h). LPO or LPOE in HBG with 50% acetone to facilitate solvent exchange were loaded into S2. The flow rate of each syringe S2 was 50 μL/h at a total flow rate of 1100 μL/h, resulting in a flow rate ratio of lipid anchor oligomer to core polyplex of 1:11. The final product was diluted with HBG to 0.025 mg siRNA/mL.
Stability of the formulation presented in this paper has been investigated previously. Troiber et al. have found particles assembled from the same class of oligomers by rapid pipetting to be stable over three weeks [42]. In our previous paper, we have investigated the changes in size, PDI, and zeta potential of our core formulation (siRNA and CO) over 90 min. The core formulation was assembled in the single meander channel (SMC) [30]. We saw no changes in size and PDI. However, changes in the zeta potential of the particles up to the 40 min mark were the reason why formulations were always used after 45 min incubation time.
4.2.2. DLS Measurement
Samples used for dynamic light scattering (DLS) measurements were prepared to contain 1.5 μg siRNA in 60 μL HEPES buffered glucose pH 7.4 (HBG) at 25 °C and the corresponding amount of oligomer. Refractive index and viscosity of the solution were calculated using the solvent builder integrated into the software (Zetasizer family software update v7.12). Viscosities and refractive indices (RI) are reported in Figure S6 in the Supplemental Information. RI of all particles was estimated to be 1.45. Scattered light used to determine the hydrodynamic diameter of polyplexes was measured at a 173° angle (backscatter) with a flexible attenuator with a Zetasizer Nano ZS ZEN 3600 (Malvern Panalytical Ltd., Malvern, UK) in DTS1070 micro cuvettes (Malvern Panalytical Ltd., Malvern, UK). Samples were measured three times with 12–15 sub runs each. The mean z-average in nm of those three runs is reported with error bars corresponding to the 95% confidence interval of the three runs.
4.2.3. Standardization of the System
The following steps were taken to ensure standardization of the system.
- Microfluidic channels were always prepared from the same silica wafer template.
- Once the optimal formulation conditions for a target formulation were established, the respective mixing program was stored on the raspberry pi.
- Each formulation produced with this system is measured by DLS.
- Changes made to the system are validated with a standard formulation.
4.2.4. Data Analysis
Data was analyzed with R [43] and RStudio [44]. We always report means with 95% confidence intervals. R code and raw data are made available here: DOI: 10.6084/m9.figshare.13285577.
Supplementary Materials
The following are available online at https://www.mdpi.com/2227-9717/9/1/129/s1: Figure S1: Channel design of the single meander channel, Figure S2: Channel design of the double meander channel, Figure S3: UML class diagram of the control software of the syringe pumps, Figure S4: Flowchart describing the automation process of polyplex formulations, Figure S5: UML class diagram of the fraction collector’s control software, Figure S6: Flowchart describing the workflow of the fraction collector, Figure S7: Chemical structures of CO, LPO, LPOE. Table S1: Materials formulation module, Table S2: Materials control module, Table S3: Software control module, Table S4: Materials feeding module, Table S5. Materials collection module, Table S6. Solvents used for DLS measurements. Code 1: Excerpt from the ‘_set_from_spec_file()’ function, Code 2: Excerpt from the initialization of the logger function, Code 4: ‘GlobalPhaseNumber()‘ class, Code 5: Excerpt from the ‘Setup()’ class, Code 6: Excerpt from the ‘check_connections()’ function, Code 7: Excerpt from the ‘rate()’ function, Code 8: Excerpt from the ‘ramping_calc()’ function, Code 9: Excerpt from the ‘overlap_calc()’ function, Code 10: ’main.py‘ module, Code 11: Excerpt from the ‘Initialize()’ class, Code 12: Excerpt from the ‘Move()’ class, Code 13: The ’main.py‘ module of the fraction collector.
Author Contributions
Conceptualization, D.M.L., R.K., U.L., J.O.R., and E.W.; data curation, D.M.L.; formal analysis, D.M.L.; funding acquisition, J.O.R. and E.W.; investigation, D.M.L.; methodology, D.M.L., R.K., U.L., J.O.R., and E.W.; project administration, D.M.L.; resources, D.M.L., R.K., U.L., J.O.R., and E.W.; software, D.M.L.; supervision, E.W.; validation, D.M.L., U.L. and E.W.; visualization, D.M.L.; writing—original draft, D.M.L.; writing—review and editing, D.M.L., R.K., and E.W. All authors have read and agreed to the published version of the manuscript.
Funding
This work was supported by the Deutsche Forschungsgemeinschaft (DFG), 201269156-SFB 1032 (projects B1 Rädler and B4 Wagner), the Munich Center for NanoScience (CeNS), and the Cluster of Excellence Nanosystems Initiative Munich (NIM). Rafał Krzysztoń was supported by German Research Foundation (DFG) through the Graduate School of Quantitative Biosciences Munich (QBM) (GSC 1006). The funders had no role in study design, data collection and analysis, decision to publish, or preparation of the manuscript.
Institutional Review Board Statement
Not applicable.
Informed Consent Statement
Not applicable.
Data Availability Statement
The data presented in this study are openly available in FigShare at DOI: 10.6084/m9.figshare.13285577 [45].
Acknowledgments
We thank Wolfgang Rödl for technical support and we thank the workshop of the LMU for their enormous help in building the collection module. We are grateful to Philipp Klein for synthesis of the CO oligomer. We thank Thomas Unterlinner for his patience and proficiency in answering all our questions about stepper motors.
Conflicts of Interest
The authors declare no conflict of interest.
References
- Li, S.-D.; Huang, L. Pharmacokinetics and Biodistribution of Nanoparticles. Mol. Pharm. 2008, 5, 496–504. [Google Scholar] [CrossRef] [PubMed]
- Li, M.; Al-Jamal, K.T.; Kostarelos, K.; Reineke, J. Physiologically Based Pharmacokinetic Modeling of Nanoparticles. ACS Nano 2010, 4, 6303–6317. [Google Scholar] [CrossRef] [PubMed]
- Moghimi, S.M.; Hunter, A.C.; Andresen, T.L. Factors Controlling Nanoparticle Pharmacokinetics: An Integrated Analysis and Perspective. Annu. Rev. Pharmacol. Toxicol. 2012, 52, 481–503. [Google Scholar] [CrossRef] [PubMed]
- Gradishar, W.J.; Tjulandin, S.; Davidson, N.; Shaw, H.; Desai, N.; Bhar, P.; Hawkins, M.; O’Shaughnessy, J. Phase III Trial of Nanoparticle Albumin-Bound Paclitaxel Compared with Polyethylated Castor Oil—Based Paclitaxel in Women with Breast Cancer. J. Clin. Oncol. 2005, 23, 7794–7803. [Google Scholar] [CrossRef] [PubMed]
- Dewolf, H.; Snel, C.; Verbaan, F.; Schiffelers, R.; Hennink, W.; Storm, G. Effect of cationic carriers on the pharmacokinetics and tumor localization of nucleic acids after intravenous administration. Int. J. Pharm. 2007, 331, 167–175. [Google Scholar] [CrossRef] [PubMed]
- Zintchenko, A.; Susha, A.S.; Concia, M.; Feldmann, J.; Wagner, E.; Rogach, A.L.; Ogris, M. Drug Nanocarriers Labeled with Near-infrared-emitting Quantum Dots (Quantoplexes): Imaging Fast Dynamics of Distribution in Living Animals. Mol. Ther. 2009, 17, 1849–1856. [Google Scholar] [CrossRef] [PubMed]
- Jang, J.; Oh, J.H. A top-down approach to fullerene fabrication using a polymer nanoparticle precursor. Adv. Mater. 2004, 16, 1650–1653. [Google Scholar] [CrossRef]
- Rolland, J.P.; Maynor, B.W.; Euliss, L.E.; Exner, A.E.; Denison, G.M.; DeSimone, J.M. Direct fabrication and harvesting of monodisperse, shape-specific nanobiomaterials. J. Am. Chem. Soc. 2005, 127, 10096–10100. [Google Scholar] [CrossRef]
- Sun, W.; Mao, S.; Shi, Y.; Li, L.C.; Fang, L. Nanonization of itraconazole by high pressure homogenization: Stabilizer optimization and effect of particle size on oral absorption. J. Pharm. Sci. 2011, 100, 3365–3373. [Google Scholar] [CrossRef]
- Hu, C.M.J.; Zhang, L.; Aryal, S.; Cheung, C.; Fang, R.H.; Zhang, L. Erythrocyte membrane-camouflaged polymeric nanoparticles as a biomimetic delivery platform. Proc. Natl. Acad. Sci. USA 2011, 108, 10980–10985. [Google Scholar] [CrossRef]
- Chen, Y.; Zhou, H.; Wang, Y.; Li, W.; Chen, J.; Lin, Q.; Yu, C. Substrate hydrolysis triggered formation of fluorescent gold nanoclusters-a new platform for the sensing of enzyme activity. Chem. Commun. 2013, 49, 9821–9823. [Google Scholar] [CrossRef] [PubMed]
- Chan, H.-K.; Kwok, P.C.L. Production methods for nanodrug particles using the bottom-up approach. Adv. Drug Deliv. Rev. 2011, 63, 406–416. [Google Scholar] [CrossRef] [PubMed]
- Lächelt, U.; Wagner, E. Nucleic Acid Therapeutics Using Polyplexes: A Journey of 50 Years (and Beyond). Chem. Rev. 2015, 115, 11043–11078. [Google Scholar] [CrossRef] [PubMed]
- Felgner, P.L.; Barenholz, Y.; Behr, J.P.; Cheng, S.H.; Cullis, P.; Huang, L.; Jessee, J.A.; Seymour, L.; Szoka, F.; Thierry, A.R.; et al. Nomenclature for Synthetic Gene Delivery Systems. Hum. Gene Ther. 1997, 8, 511–512. [Google Scholar] [CrossRef] [PubMed]
- Kabanov, A.V.; Kabanov, V.A. DNA Complexes with Polycations for the Delivery of Genetic Material into Cells. Bioconjug. Chem. 1995, 6, 7–20. [Google Scholar] [CrossRef]
- Merrifield, R.B. Solid Phase Peptide Synthesis. I. The Synthesis of a Tetrapeptide. J. Am. Chem. Soc. 1963, 85, 2149–2154. [Google Scholar] [CrossRef]
- Schaffert, D.; Badgujar, N.; Wagner, E. Novel Fmoc-polyamino acids for solid-phase synthesis of defined polyamidoamines. Org. Lett. 2011, 13, 1586–1589. [Google Scholar] [CrossRef]
- Schaffert, D.; Troiber, C.; Salcher, E.E.; Fröhlich, T.; Martin, I.; Badgujar, N.; Dohmen, C.; Edinger, D.; Kläger, R.; Maiwald, G.; et al. Solid-phase synthesis of sequence-defined T-, i-, and U-shape polymers for pDNA and siRNA delivery. Angew. Chem. Int. Ed. Engl. 2011, 50, 8986–8989. [Google Scholar] [CrossRef]
- Scholz, C.; Kos, P.; Wagner, E. Comb-like oligoaminoethane carriers: Change in topology improves pDNA delivery. Bioconjug. Chem. 2014, 25, 251–261. [Google Scholar] [CrossRef]
- Ou, Z.; Muthukumar, M. Entropy and enthalpy of polyelectrolyte complexation: Langevin dynamics simulations. J. Chem. Phys. 2006, 124, 154902. [Google Scholar] [CrossRef]
- Braun, C.S.; Fisher, M.T.; Tomalia, D.A.; Koe, G.S.; Koe, J.G.; Middaugh, C.R. A stopped-flow kinetic study of the assembly of nonviral gene delivery complexes. Biophys. J. 2005, 88, 4146–4158. [Google Scholar] [CrossRef] [PubMed]
- Zelphati, O.; Nguyen, C.; Ferrari, M.; Felgner, J.; Tsai, Y.; Felgner, P.L. Stable and monodisperse lipoplex formulations for gene delivery. Gene Ther. 1998, 5, 1272–1282. [Google Scholar] [CrossRef] [PubMed]
- Kasper, J.C.; Schaffert, D.; Ogris, M.; Wagner, E.; Friess, W. The establishment of an up-scaled micro-mixer method allows the standardized and reproducible preparation of well-defined plasmid/LPEI polyplexes. Eur. J. Pharm. Biopharm. 2011, 77, 182–185. [Google Scholar] [CrossRef] [PubMed]
- Whitesides, G.M. The origins and the future of microfluidics. Nature 2006, 442, 368–373. [Google Scholar] [CrossRef] [PubMed]
- Squires, T.M.; Quake, S.R. Microfluidics: Fluid physics at the nanoliter scale. Rev. Mod. Phys. 2005, 77, 977–1026. [Google Scholar] [CrossRef]
- Koh, C.G.; Kang, X.; Xie, Y.; Fei, Z.; Guan, J.; Yu, B.; Zhang, X.; Lee, L.J. Delivery of Polyethylenimine/DNA Complexes Assembled in a Microfluidics Device. Mol. Pharm. 2009, 6, 1333–1342. [Google Scholar] [CrossRef]
- Belliveau, N.M.; Huft, J.; Lin, P.J.; Chen, S.; Leung, A.K.; Leaver, T.J.; Wild, A.W.; Lee, J.B.; Taylor, R.J.; Tam, Y.K.; et al. Microfluidic Synthesis of Highly Potent Limit-size Lipid Nanoparticles for In Vivo Delivery of siRNA. Mol. Ther. Nucleic Acids 2012, 1, e37. [Google Scholar] [CrossRef]
- Grigsby, C.L.; Ho, Y.-P.; Lin, C.; Engbersen, J.F.J.; Leong, K.W. Microfluidic Preparation of Polymer-Nucleic Acid Nanocomplexes Improves Nonviral Gene Transfer. Sci. Rep. 2013, 3, 3155. [Google Scholar] [CrossRef]
- Krzysztoń, R.; Salem, B.; Lee, D.J.; Schwake, G.; Wagner, E.; Rädler, J.O. Microfluidic self-assembly of folate-targeted monomolecular siRNA-lipid nanoparticles. Nanoscale 2017, 9, 7442–7453. [Google Scholar] [CrossRef]
- Loy, D.M.; Klein, P.M.; Krzysztoń, R.; Lächelt, U.; Rädler, J.O.; Wagner, E. A microfluidic approach for sequential assembly of siRNA polyplexes with a defined structure-activity relationship. PeerJ Mater. Sci. 2019, 1, e1. [Google Scholar] [CrossRef]
- Klein, P.M.; Kern, S.; Lee, D.-J.; Schmaus, J.; Höhn, M.; Gorges, J.; Kazmaier, U.; Wagner, E. Folate receptor-directed orthogonal click-functionalization of siRNA lipopolyplexes for tumor cell killing in vivo. Biomaterials 2018, 178, 630–642. [Google Scholar] [CrossRef] [PubMed]
- Loy, D.M. Dominik Loy on GitHub. 2020. Available online: https://github.com/Dominikmloy (accessed on 7 November 2020).
- Wang, J.; Chen, W.; Sun, J.; Liu, C.; Yin, Q.; Zhang, L.; Xianyu, Y.; Shi, X.; Hu, G.; Jiang, X. A microfluidic tubing method and its application for controlled synthesis of polymeric nanoparticles. Lab Chip 2014, 14, 1673–1677. [Google Scholar] [CrossRef] [PubMed]
- Andersen, G. XY Table. 2016. Available online: https://www.thingiverse.com/thing:18678 (accessed on 18 January 2020).
- Sletten, E.M.; Bertozzi, C.R. From mechanism to mouse: A tale of two bioorthogonal reactions. Acc. Chem. Res. 2011, 44, 666–676. [Google Scholar] [CrossRef] [PubMed]
- Liu, D.; Cito, S.; Zhang, Y.; Wang, C.-F.; Sikanen, T.M.; Santos, H.A. A Versatile and Robust Microfluidic Platform Toward High Throughput Synthesis of Homogeneous Nanoparticles with Tunable Properties. Adv. Mater. 2015, 27, 2298–2304. [Google Scholar] [CrossRef]
- Debus, H.; Beck-Broichsitter, M.; Kissel, T. Optimized preparation of pDNA/poly(ethylene imine) polyplexes using a microfluidic system. Lab Chip 2012, 12, 2498. [Google Scholar] [CrossRef]
- Lim, J.-M.; Swami, A.; Gilson, L.M.; Chopra, S.; Choi, S.; Wu, J.; Langer, R.; Karnik, R.; Farokhzad, O.C. Ultra-High Throughput Synthesis of Nanoparticles with Homogeneous Size Distribution Using a Coaxial Turbulent Jet Mixer. ACS Nano 2014, 8, 6056–6065. [Google Scholar] [CrossRef]
- Karnik, R.; Gu, F.; Basto, P.; Cannizzaro, C.; Dean, L.; Kyei-Manu, W.; Langer, R.; Farokhzad, O.C. Microfluidic Platform for Controlled Synthesis of Polymeric Nanoparticles. Nano Lett. 2008, 8, 2906–2912. [Google Scholar] [CrossRef]
- Chiu, D.T.; DeMello, A.J.; Di Carlo, D.; Doyle, P.S.; Hansen, C.; Maceiczyk, R.M.; Wootton, R.C.R. Small but Perfectly Formed? Successes, Challenges, and Opportunities for Microfluidics in the Chemical and Biological Sciences. Chemistry 2017, 2, 201–223. [Google Scholar] [CrossRef]
- Lee, J.N.; Park, C.; Whitesides, G.M. Whitesides Solvent compatibility of poly (dimethylsiloxane)-based microfluidic devices. Anal. Chem. 2003, 75, 6544–6554. [Google Scholar] [CrossRef]
- Troiber, C.; Kasper, J.C.; Milani, S.; Scheible, M.; Martin, I.; Schaubhut, F.; Küchler, S.; Rädler, J.; Simmel, F.C.; Friess, W.; et al. Comparison of four different particle sizing methods for siRNA polyplex characterization. Eur. J. Pharm. Biopharm. 2013, 84, 255–264. [Google Scholar] [CrossRef]
- R Core Team. R: A Language and Environment for Statistical Computing; R Foundation for Statistical Computing: Vienna, Austria, 2018. [Google Scholar]
- RStudio Team. RStudio: Integrated Development for R; RStudio, Inc.: Boston, MA, USA, 2018. [Google Scholar]
- Loy, D.M. Controlling Nanoparticle Formulation: A Low-Budget Prototype for the Automation of a Microfluidic Platform. 2021. Available online: https://figshare.com/articles/dataset/Controlling_nanoparticle_formulation_a_low-budget_prototype_for_the_automation_of_a_microfluidic_platform/13285577 (accessed on 7 January 2021). [CrossRef]
Publisher’s Note: MDPI stays neutral with regard to jurisdictional claims in published maps and institutional affiliations. |
© 2021 by the authors. Licensee MDPI, Basel, Switzerland. This article is an open access article distributed under the terms and conditions of the Creative Commons Attribution (CC BY) license (http://creativecommons.org/licenses/by/4.0/).