Article

PID Tuning Method Based on IMC for Inverse-Response Second-Order Plus Dead Time Processes

by
Duby Castellanos-Cárdenas
1,
Fabio Castrillón
2,
Rafael E. Vásquez
2,* and
Carlos Smith
3
1
Program of Telecommunications Engineering, Universidad de Medellín, Medellín 050026, Colombia
2
School of Engineering, Universidad Pontificia Bolivariana, Medellín 050031, Colombia
3
Department of Chemical & Biomedical Engineering; University of South Florida, Tampa, FL 33620, USA
*
Author to whom correspondence should be addressed.
Processes 2020, 8(9), 1183; https://doi.org/10.3390/pr8091183
Submission received: 21 August 2020 / Revised: 13 September 2020 / Accepted: 14 September 2020 / Published: 18 September 2020
(This article belongs to the Section Process Control and Monitoring)

Abstract

:
This work addresses a set of tuning rules for PID controllers based on Internal Model Control (IMC) for inverse-response second-order systems with dead time. The transfer function, and some time-response characteristics for such systems are first described. Then, the IMC-based methodology is developed by using an optimization objective function that mixes performance and robustness. A correlation that minimizes the objective function and that allows the user to compute the controller’s tuning parameter is found. The obtained expressions are mathematically simple, which facilitate their application in a ten-step systematic methodology. Finally, the proposed tuning method is compared to other well-known tuning rules that have been reported in literature, for a wide range of parameters of the process. The performance achieved with the proposed method is very good not only for disturbance rejection but for set-point tracking, when considering a wide-range of parameters of the process’ transfer function.

1. Introduction

Inverse response or non-minimum-phase systems have at least one zero located at the right-hand side of the complex plane [1]. Their time response to a step input goes, at the beginning, towards the opposite direction of the steady-state value [2]. Such behavior appears due to the combination of two opposite-dynamics phenomena: A small-gain fast-dynamics responsible for the inverse response, and a slow-dynamics with higher gain, which dominates the transient response [3,4,5].
Since the inverse response phenomenon presents some similar characteristics to those in dead-time systems, it is usual to find tuning techniques with Smith predictor-like structures [6,7]. Other tuning techniques present the model of the non-minimum-phase zero as dead time, which allows one to use traditional tuning techniques developed for time-delayed systems [8]; conservative controllers are obtained with such an approximation [9,10,11]. Another traditional way to deal with inverse response dynamics is to reduce the order of the system and get a first-order model, which allows one to obtain PI controllers; however, these controllers can cause slower transient responses than the aforementioned techniques [12].
The development of Proportional-Integral (PI) and Proportional-Integral-Derivative (PID) controllers for inverse response processes started around the 1970s. Waller and Nygardas [13] compared lead-lag compensators to the conventional PID tuning proposed by Ziegler and Nichols [14]. Then, Scali and Rachid [15], Luyben [16], Chien et al. [17], and Sree and Chidambaram [18], among others, reported different tuning techniques for PI/PID controllers used for inverse-response systems by considering, in general, set-point changes. One can find some references, such as Chen and Seborg [19], Shamsuzzoha and Lee [20], and Pai et al. [9] that developed tuning equations for disturbance rejection. More recently, several PID tuning or controller design methods for processes whose dynamics include inverse-response, time-delay, and integrating characteristics have been developed [21,22,23,24,25,26]. Other authors gone beyond the PID controller and proposed the use of fractional control for non-minimum phase plus dead time systems [27], and Sliding Mode Controllers applied to high-order long dead-time inverse-response processes [28].
Other PID design methods based on frequency response techniques have been developed. For instance, Luyben [29] presented a PI controller tuning procedure for an inverse-response integrating process; the author states that the controller tuning process for this kind of complex dynamics is not a trivial task. Chen and Seborg [19] developed a design method for PID controllers based on direct synthesis; they demonstrated that the design method works very good for several processes, including those with non-minimum phase characteristics that appear when Pade’s approximation is used for systems with dead time. Such approximation induces an additional modeling error, which implies a decrease in the system’s bandwidth [30]. Alfaro et al. [31] used a nondimensional version of equations proposed by Chen and Seborg [19] and found expressions in order to compute the minimum value of the tuning parameter, τ c , which bounds the maximum sensitivity.
Internal Model Control (IMC) has been used as an alternative for designing and tuning PID controllers since 1980s [30]. It has resulted to be of particular interest in industry together with the PID algorithm [32], since the equations for the controller’s parameters can be obtained from the transfer function of the process and the desired behavior of the closed-loop response; in most cases, only the closed-loop time constant is required as the user-defined tuning parameter, considering an appropriate trade-off between performance and robustness [20,33,34,35,36,37]. Additional works, regarding IMC, that have been developed more recently can be found in [38,39,40,41,42,43,44].
This work addresses the design of a tuning methodology for PID controllers, for inverse-response second-order plus dead time processes, extending the work of Chien and Fruehauf [45], which has been recently studied in [46], by using dimensional analysis and experimental design. The development of the tuning technique considers the optimization of an objective function that combines performance and robustness indexes: the Integral of the Absolute Value of the Error (IAE) and the Integral of the change in the Manipulated Variable (IMV). The obtained expressions are simple and can be applied by using the proposed ten-step methodology. The performance of a controller tuned with this method excels the performance offered by other well-known techniques for a wide range of parameters of the process.
The first section contains a description of process’ time response. Then, the design process of the tuning rules is addressed, by using dimensional analysis and experimental design. The third section contains the application methodology and the performance comparison for a controller tuned with the new rules and other tuning methods. Then, the robustness analysis for the variability of parameters is performed. Finally, the conclusions are presented.

2. Inverse Response Second Order Plus Dead Time System Model

The transfer function of an inverse-response second-order system, with total time delay θ , can be written as
G ( s ) = [ G 1 ( s ) + G 2 ( s ) ] e θ s ;
where
G 1 ( s ) = K 1 τ 1 s + 1 ,
G 2 ( s ) = K 2 τ 2 s + 1 ,
are the transfer functions of two opposite-dynamics phenomena: A small-gain fast-dynamics part (3), and a slow-dynamics part with higher gain (2). K 1 and K 2 are the gains, and τ 1 and τ 2 are the time constants. Substituting (2) and (3) into (1) yields
G ( s ) = ( K 1 τ 2 K 2 τ 1 ) s + ( K 1 K 2 ) ( τ 1 s + 1 ) ( τ 2 s + 1 ) e θ s .
As it can be seen in (4), the process’ transfer function only considers the case with real different poles because the dynamics comes from parallel balances [47]; this is a common case in industrial processes containing boilers, heat exchangers, tanks, distillation columns, chemical reactors, waste incinerators, among others [2,47].
Operating expressions in (4) yields the transfer function of the process which is given by
G ( s ) = K ( 1 η s ) ( τ 1 s + 1 ) ( τ 2 s + 1 ) e θ s ,
where K = K 1 K 2 , and η = ( K 2 τ 1 K 1 τ 2 ) ( K 1 K 2 ) , η > 0 .
For this process, at the beginning, the time response slope’s sign is opposite to the sign of the gain, and as η increases, so does the inverse-response behaviour; then, control issues arise due to the fact that the non-minimum phase zero is closer to the imaginary axis [4,15,48,49]. Adding a left-hand side pole into (5) decreases this inverse-response effect, but the settling time increases. When there are multiple non-minimum phase zeros, multiple inversions appear; however, such a system is not commonly found.

3. Design of Tuning Rules

3.1. Internal Model Control

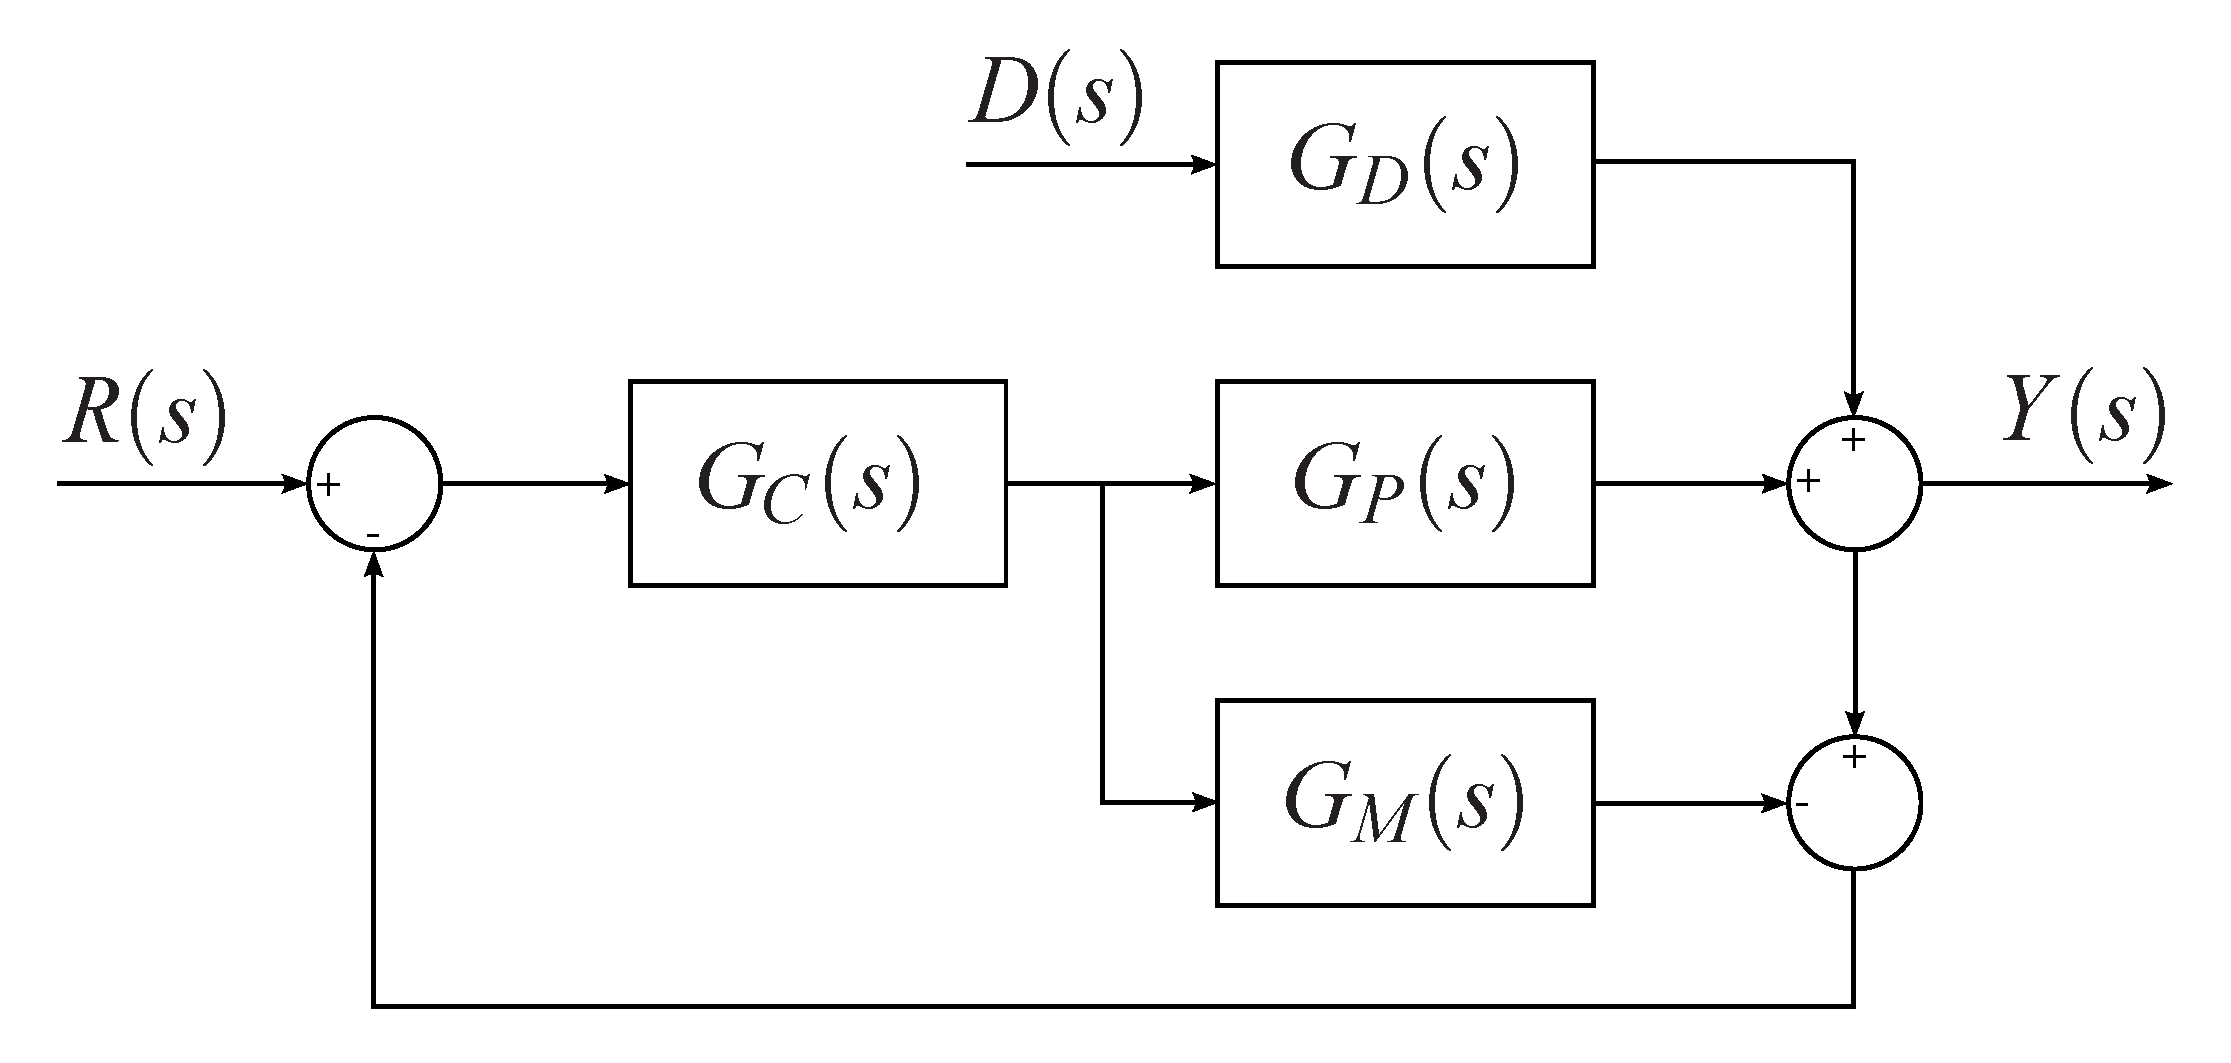
Internal Model Control (IMC) is a technique that uses a simulation of the process, running in parallel [30], as depicted in Figure 1; where: R ( s ) is the input reference, D ( s ) is the disturbance signal, Y ( s ) is the output of the system, G P ( s ) is the process transfer function, G D ( s ) is the transfer function that relates the output and the disturbance, G C ( s ) is the controller transfer function, and G M ( s ) is the model of the process that is simulated in parallel. The IMC methodology requires the transfer function of the model of the process be written as:
G M ( s ) = G M + ( s ) G M ( s ) ,
where G M + ( s ) is a transfer function containing all the non-minimum phase zeros and dead time, and G M ( s ) contains the minimum-phase elements of the system. Then, the IMC controller can be defined in terms of the invertible part of the transfer function and a user-specified low-pass filter f ( s ) , as follows
G I M C = G M 1 ( s ) f ( s ) .
The IMC controller’s structure can be reduced to a classical PI/PID control structure. For this purpose, Chien and Fruehauf [45] defined the filter’s function, for first and second-order systems (without integrator), as follows
f ( s ) = 1 τ c s + 1 .
They used a parallel PID controller structure which is given by
G C ( s ) = K c 1 + 1 T i s + T d s .
These authors obtained equations for the tuning parameters, which are given for an inverse response second order plus dead time system by [45]
K c = τ 1 + τ 2 + η θ τ c + η + θ K ( τ c + η + θ ) ,
T i = τ 1 + τ 2 + η θ τ c + η + θ ,
T d = η θ τ c + η + θ + τ 1 τ 2 τ 1 + τ 2 + η θ τ c + η + θ ,
where τ c is the tuning parameter.

3.2. Optimization Objective Function

In this work, we use the optimization of a performance index that combines the Integral of the Absolute Value of the Error (IAE) and the Integral of the change in the Manipulated Variable (IMV). The controller’s main operation in this case favors disturbance rejection (load regulation); however, reference tracking performance is also evaluated. The objective function is then given by
O F = 0 e ( t ) d t + γ 0 d M V ( t ) d t d t .
The first term in (13) is the IAE, and the second term is the IMV multiplied by a suppression factor γ . Increasing or decreasing γ allows one to modify the weight on the manipulated variable; for instance, when γ = 1 , both, the IAE and IMV are of the same importance, and when γ = 0 only the IAE is considered. Several authors have used this type of objective function in order to measure the performance of different control strategies [50,51]; typical values of the suppression factor are 0 γ 8 [52,53].

3.3. Scaling and Nondimensionalization

In order to reduce the amount of parameters to be optimized, Equations (5), (10)–(12) are scaled using dimensional analysis techniques, allowing us to go from the 4 parameters contained in (5) to the 3 parameters found in Equations (18)–(20); this reduces the number of simulation runs and computation time. Nondimensional equations are written in the form proposed in [49,54] and given by
G ^ ( s ^ ) = ( η ^ s ^ + 1 ) e θ ^ s ^ ( s ^ + 1 ) ( τ ^ 2 s ^ + 1 ) ,
K c K = ( 1 + τ ^ 2 ) ( τ ^ c + η ^ + θ ^ ) + η ^ θ ^ ( τ ^ c + η ^ + θ ^ ) 2 ,
T ^ i = ( 1 + τ ^ 2 ) ( τ ^ c + η ^ + θ ^ ) + η ^ θ ^ ( τ ^ c + η ^ + θ ^ ) ,
T ^ d = η ^ θ ^ ( τ ^ c + η ^ + θ ^ ) + τ ^ 2 ( τ ^ c + η ^ + θ ^ ) ( 1 + τ ^ 2 ) ( τ ^ c + η ^ + θ ^ ) ,
where:
η ^ = η τ 1 ,
τ ^ 2 = τ 2 τ 1 ,
θ ^ = θ τ 1 ,
s ^ = τ 1 s .
This can be interpreted as scaling in time or frequency domains. The typical values for the ratios between the parameters can be found in literature and are given by [9,49]
0.1 τ 2 τ 1 0.9 ,
0.1 η τ 1 4 ,
0.01 θ τ 1 1 .
A central composite experimental design (uniform and circumscribed for rotatability) was designed in order to provide appropriated values of τ 2 τ 1 , η τ 1 , and θ τ 1 for each simulation run. This type of experimental design is selected since it can take account of curvature in a response [55], i.e., a quadratic surface can be adjusted to the data provided. Gutierrez and de la Vara [56] stated that in order to get accurate predictions, values of R 2 70 % are expected; since the selection of parameters out of ranges provided in expressions (22)–(24) cannot guarantee such R 2 value, we developed the tuning method for the given ranges, which were selected as in [9,49].
Castellanos and Castrillón [57] presented an expression that allows one to compute the limit value that can be assigned to the controller’s parameter in order to get a fast response, without compromising stability. Additionally, they reported a typical polynomial-like correlation that allows one to obtain the value of the tuning parameter that minimizes only the IAE. Such expressions are given by [57]
τ ^ c u l t = 0.148557 + 0.903364 τ ^ 2 + 0.331659 η ^ + 0.390943 τ ^ 2 η ^ 0.19992 τ ^ 2 θ ^ + 0.384281 η ^ θ ^ 0.305025 τ ^ 2 2 0.0157256 η ^ 2 0.207827 θ ^ 2 ,
τ ^ c I A E = 0.540626 + 2.11424 τ ^ 2 + 0.735044 η ^ + 1.6421 θ ^ + 0.640022 τ ^ 2 η ^ + 0.341155 η ^ θ ^ 1.66075 τ ^ 2 2 0.0294597 η ^ 2 0.962638 θ ^ 2 ,
where τ ^ c u l t is the minimum allowable value of the tuning parameter; i.e., lower values of τ ^ c u l t make the system exhibit unstable behavior; and τ ^ c I A E is the value of the tuning parameter that minimizes the IAE. In the present work we develop the equations for γ > 0 which allow one to use the combined index.

3.4. Tuning Parameter Computation

It is desired to obtain a new expression in order to relate the controller’s tuning parameter that minimizes the objective function and the ultimate value that can be chosen in order to obtain a stable response:
τ ^ c O F = f ( τ ^ c u l t , γ ) .
A simulation environment was developed using MATLAB®/Simulink®. This computational tool allows one to find the value of the objective function for each data set of parameters of the process’ transfer function and γ . Since we used a central composite experimental design for rotatability, the optimization tool correspond to the steepest-descent gradient method [58].
The starting value of τ ^ c for each simulation was obtained from (25); the minimum assigned value for this parameter matched the limit value to obtain a stable system. The simulations considered unit-step changes in the disturbance variable (disturbance rejection). At the end of the simulation process, we obtained data shown in Table A1 (Appendix A) that contains the value of τ ^ c that minimizes O F for each data set of the process’ transfer function (from the experimental design) and values of 0 γ 8 . We found that no significant changes in τ ^ c O F were obtained for γ > 4 ; therefore, the range 0 γ 4 was selected and Figure 2 shows τ ^ c O F for different values of τ ^ c u l t considering such range for γ .
Using the information provided in Figure 2, data were fitted using a linear regression, and the polynomial represents a straight line passing through the origin. The correlations obtained are given by
τ ^ c F O | 0 = 1.9044 τ ^ c u l t ,
τ ^ c F O | 1 = 2.2745 τ ^ c u l t ,
τ ^ c F O | 2 = 2.6513 τ ^ c u l t ,
τ ^ c F O | 3 = 2.8867 τ ^ c u l t ,
τ ^ c F O | 4 = 3.0550 τ ^ c u l t .
Equations (28)–(32) are of the form
τ ^ c O F = m O F τ ^ c u l t ,
where m O F is the slope of the line that relates τ ^ c O F and τ ^ c u l t ; m O F addtionally represents a stability margin for the system.
When γ increases, the value of the slope increases, and τ ^ c O F increases, which make the system more robust. This characteristic allows getting a safety factor for the closed-loop system with respect to an ultimate value τ ^ c u l t ; if this value is reached, the time response would acquire sustained oscillations (marginal stability).
In order to measure the goodness of fit, some statistics need to be computed: the correlation coefficient (R), that measures the linear correlation between two variables; the coefficient of determination ( R 2 ), that indicates the proportion of the variance that can be explained from the obtained model; and Durbin-Watson, that is used to check if there is a linear autocorrelation among the residuals of the model. Table 1 shows the statistics results; it can be noticed that values greater than 0.98 were obtained for R, and values greater than 97 % were obtained for R 2 ; this shows a strong goodness of fit. Values between 2 and 2.5 were obtained for Durbin-Watson, which shows that there is no linear autocorrelation among the model’s residuals.
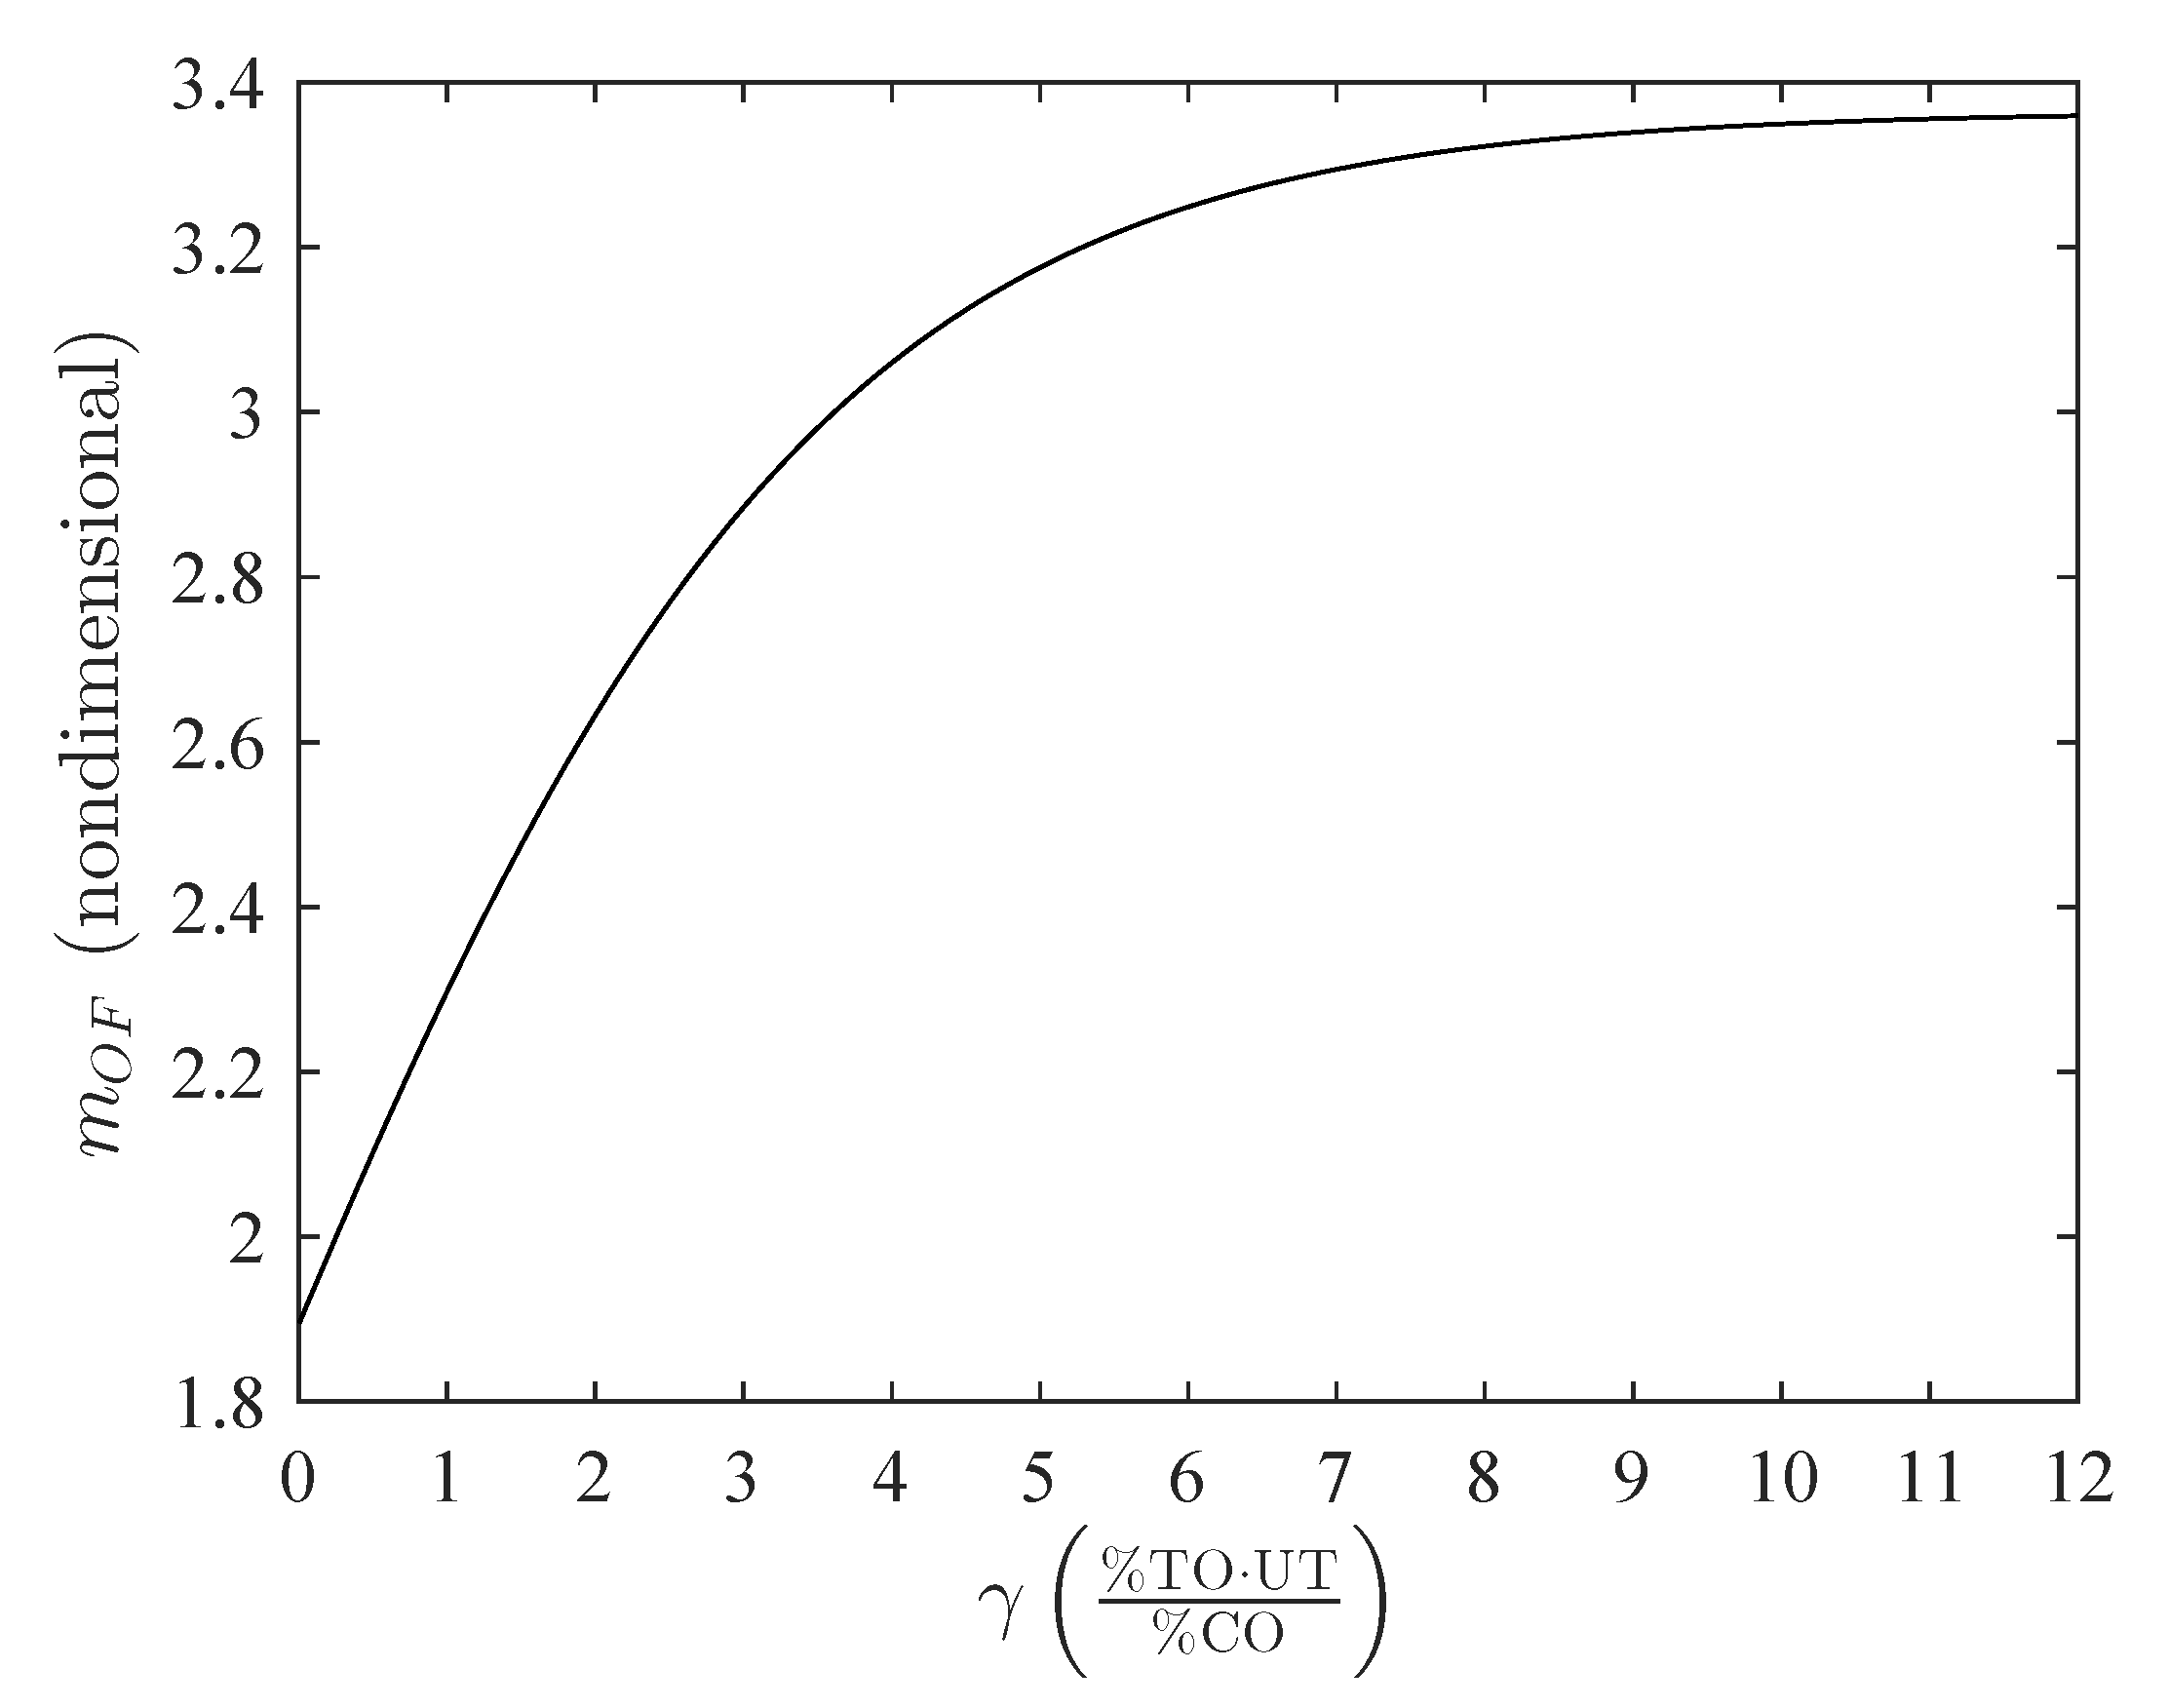
It is necessary to obtain an expression that relates the value of m O F with γ . This is done using the value m O F i found in the linear Equations (28)–(32) for different values of γ . So, for 0 γ 4 we get the plot shown in Figure 3.
Using a nonlinear regression for the plot in Figure 3 we get the expression m O F = f ( γ ) , as follows
m O F = 3.3650 1 + e γ 0.4956 1.9491 .
The best fit was given by a sigmoid function; the goodness-of-fit is measured again by using R and R 2 , both with values greater than 0.99 and 99%, respectively, as shown in Table 2.
Equation (34) shows the relation between the stability margin m O F and the suppression factor γ . Then, an expression that allows computing the nondimensional optimal value of the controller’s tuning parameter in a direct way is given by
τ ^ c O F = m O F τ ^ c u l t .
Finally, Equations (10)–(12) are used to compute the PID controller’s parameters using τ c O F , with units of time, that is computed as
τ c O F = τ ^ c O F τ 1 .

4. Application Methodology

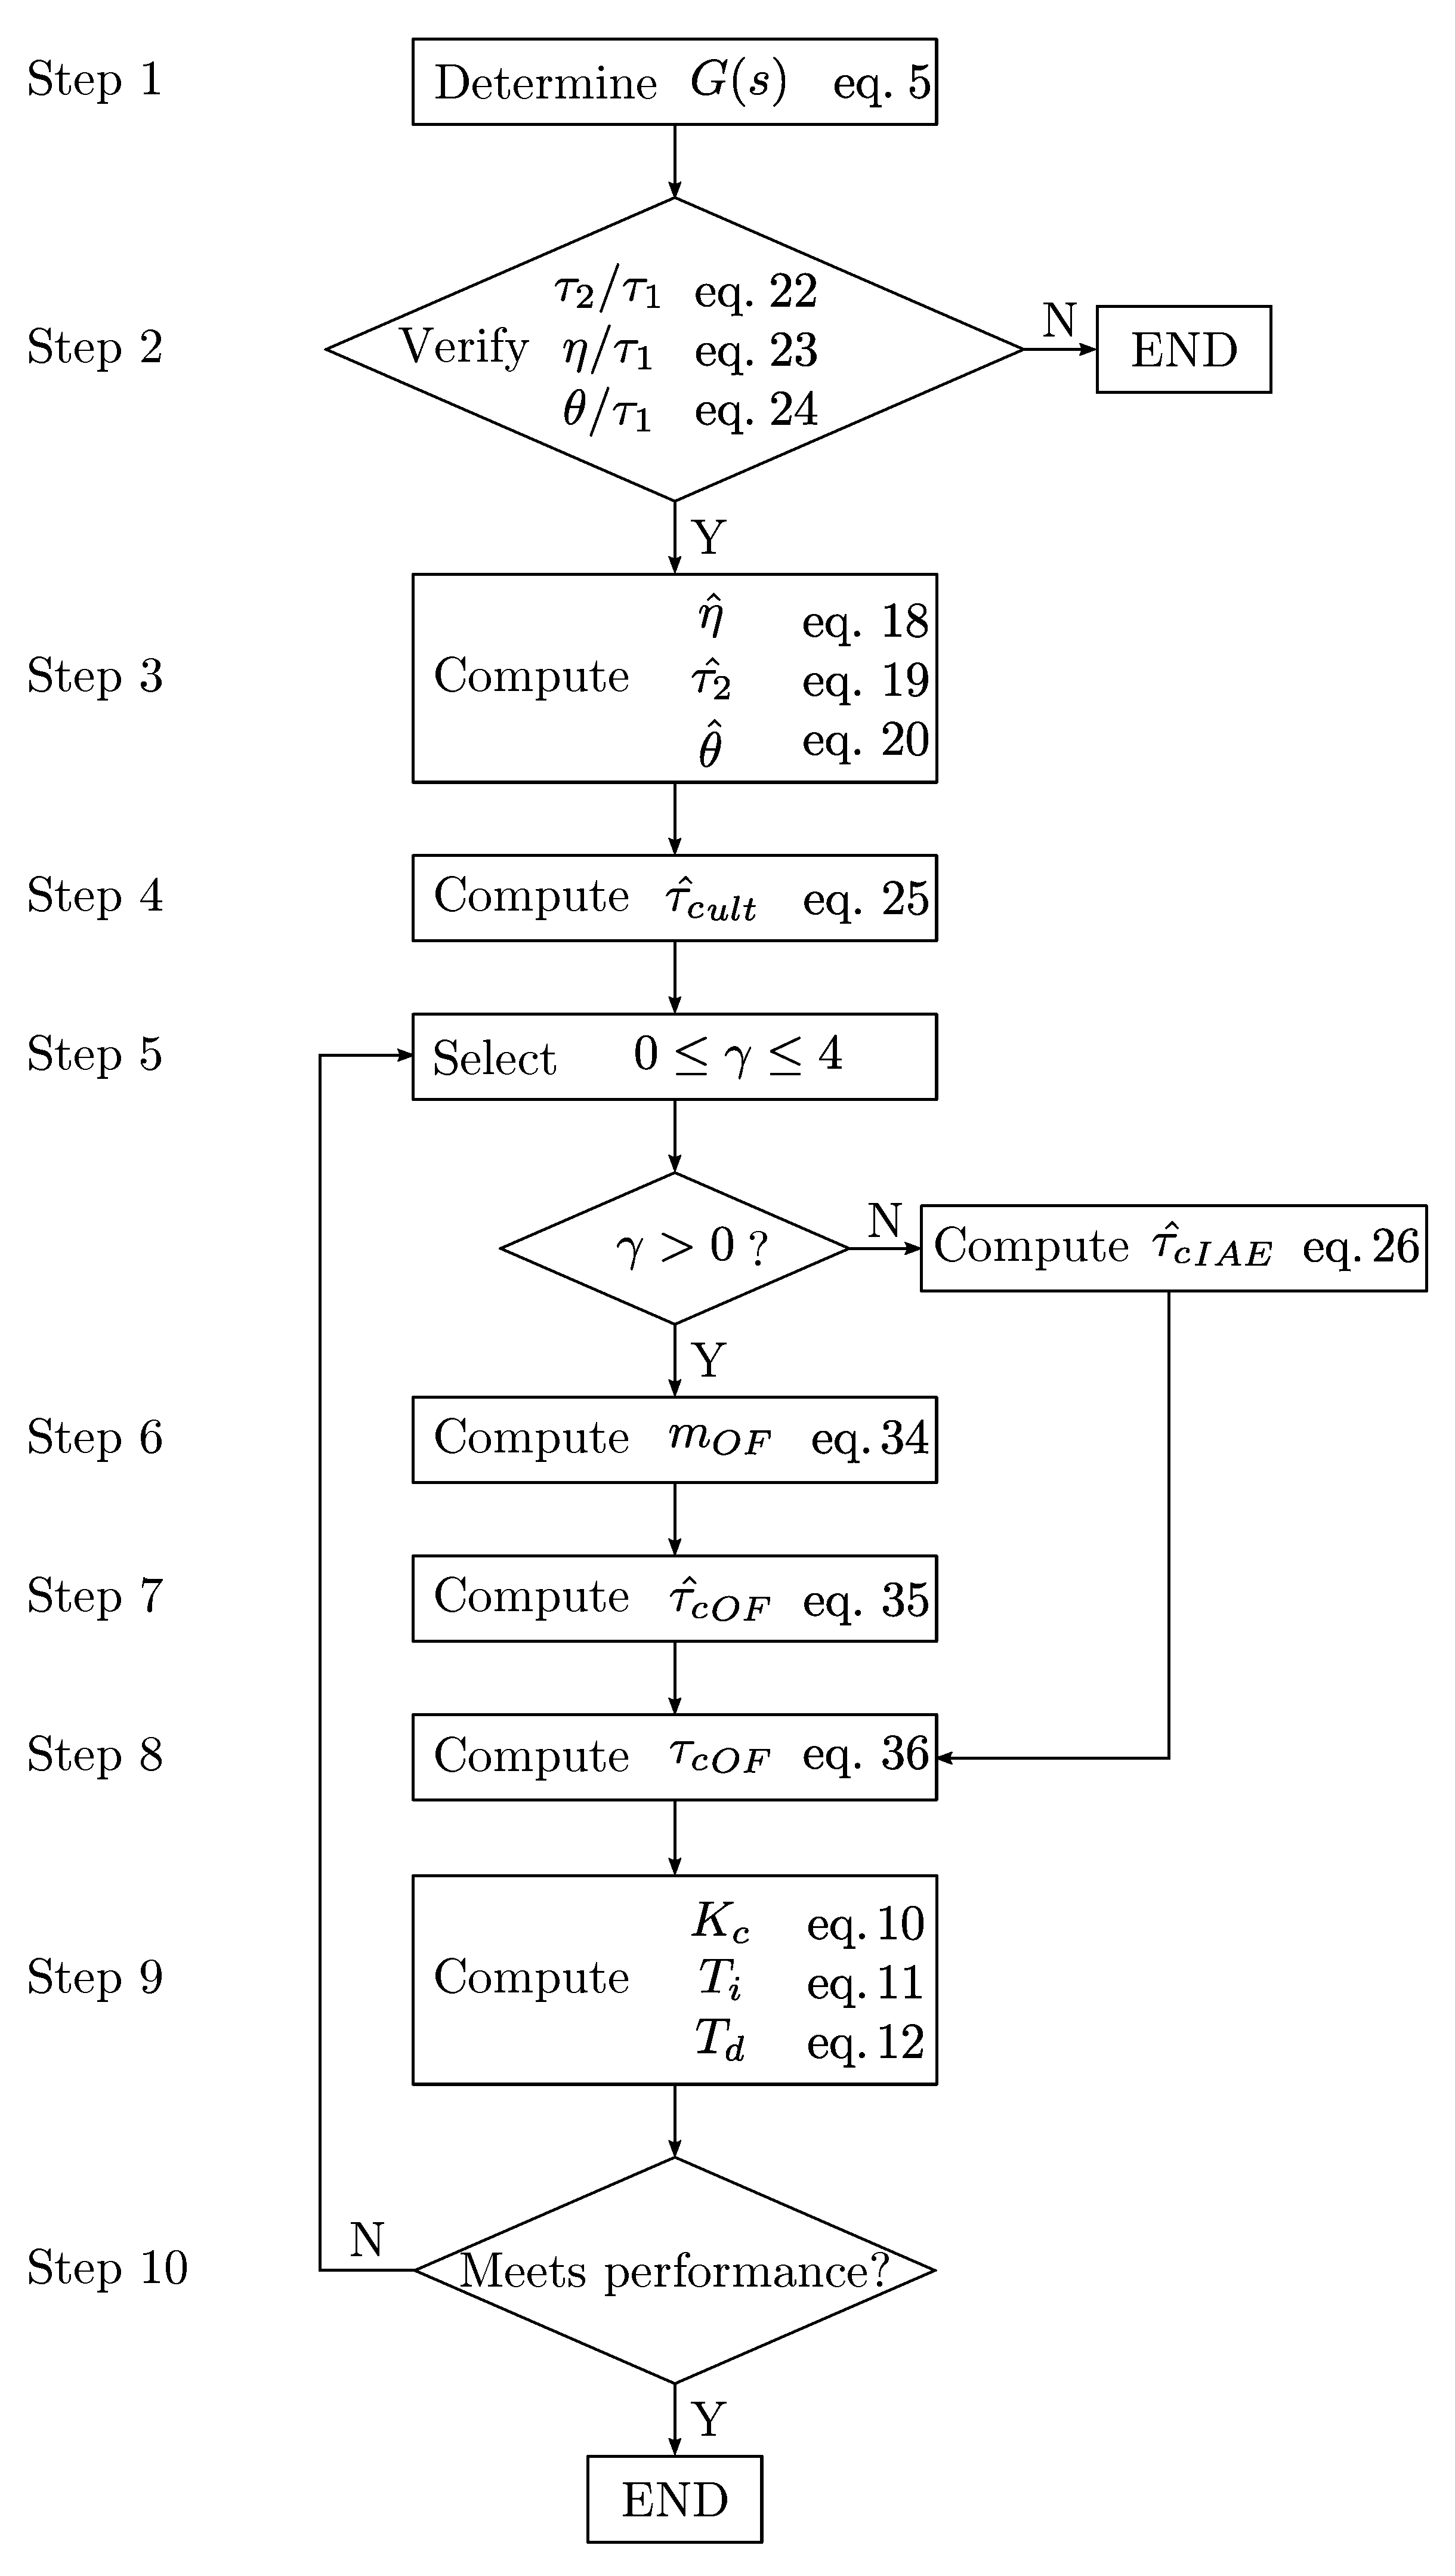
The application of the Castellanos-Castrillón-Vásquez (CCV) PID tuning method for inverse-response second-order plus dead time systems can be summarized in the following ten steps; Figure 4 shows the methodology in the algorithm form.
  • Determine the transfer function of the inverse response second order plus dead time system and write it in the form of (5).
  • Verify that the transfer function’s parameters are within the specified ranges, established in (22)–(24); this method is valid only for such ranges.
  • Compute the nondimensional parameters of the process by using Equations (18)–(20).
  • Compute τ ^ c u l t by using (25).
  • Select the value of γ , depending on the user’s needs. If γ = 0 , O F = I A E .
  • To compute m O F by using (34), if γ 0 .
  • Compute τ ^ c O F by using (35).
  • Compute τ c O F by using (36).
  • Compute the controller’s parameters with τ c O F using (10)–(12).
  • Check if the controller meets the desired performance.
If the desired performance is not met, the user can go back to Step 5 and change the value of γ adjusting the index in (13), which accounts for performance of the controlled variable and behaviour of the manipulated variable; high values γ are useful to protect the actuators, providing more conservative responses.

5. Discussion on Performance Analysis

This section contains a comparison for the performance of a controller tuned with the new proposed CCV method and three other well-known techniques. There are several PI/PID controller tuning techniques [59], which are used for processes with specific dynamics characteristics. Regarding, inverse response processes, one can find that even recent literature still uses classical methods for comparison purposes or reference them as still valid and used for adjusting controller parameters. One can find recent literature in which new tuning methods, developed by Waller and Nygardas (WN) [13] and Chien, Chung, Chen, and Chuang (CCCC) [17] for inverse response systems, are compared to traditional methods; see for instance [60,61]. Additionally, one can find several works that compare the performance with one of the most traditional tuning methods developed by Ziegler and Nichols (ZN) [14] during the 1940s, see for instance [62,63,64]. The performance indexes are given by
  • I A E = 0 e ( t ) d t , [ = ] %TO·UT;
  • I S E = 0 e 2 ( t ) d t , [ = ] (%TO) 2 ·UT;
  • I M V = 0 d M V ( t ) d t d t , [ = ] %CO;
  • M P (maximum peak), [ = ] %TO;
where %TO: percentage of transmitter output, %CO: percentage of controller output, UT: units of time.
A central composite experimental design, as explained in the scaling section, was implemented in order to select a set of parameters of the process’ transfer function to test the performance and robustness of the closed-loop, for each controller, over a wide range of values. These values are within the defined ranges of the ratios given by (22)–(24). A tag P i was assigned to each set, and their values are shown in Table 3; these parameters are a subset extracted from the experimental region.
For each simulation, the system was excited with a unit-step input for changes in the disturbance and changes in the set-point. A value of γ = 4 was assigned for all the simulations in order to penalize the behavior of the manipulated variable, considered in the second term of the optimization objective function (13). Table 4 contains the nondimensional controller parameters computed for each simulation set.
In order to assess the general performance of the control system (disturbance rejection and set-point tracking), with a PID controller tuned with the new and the traditional selected methods, a scoring system was established. For each performance index, a score between 0 and 4 was given to each tuning method; the controller with the best performance received 4 points, the next received 3 points, and so forth. When a tuning method generated a marginally stable or unstable response, it received 0 points in all indexes.
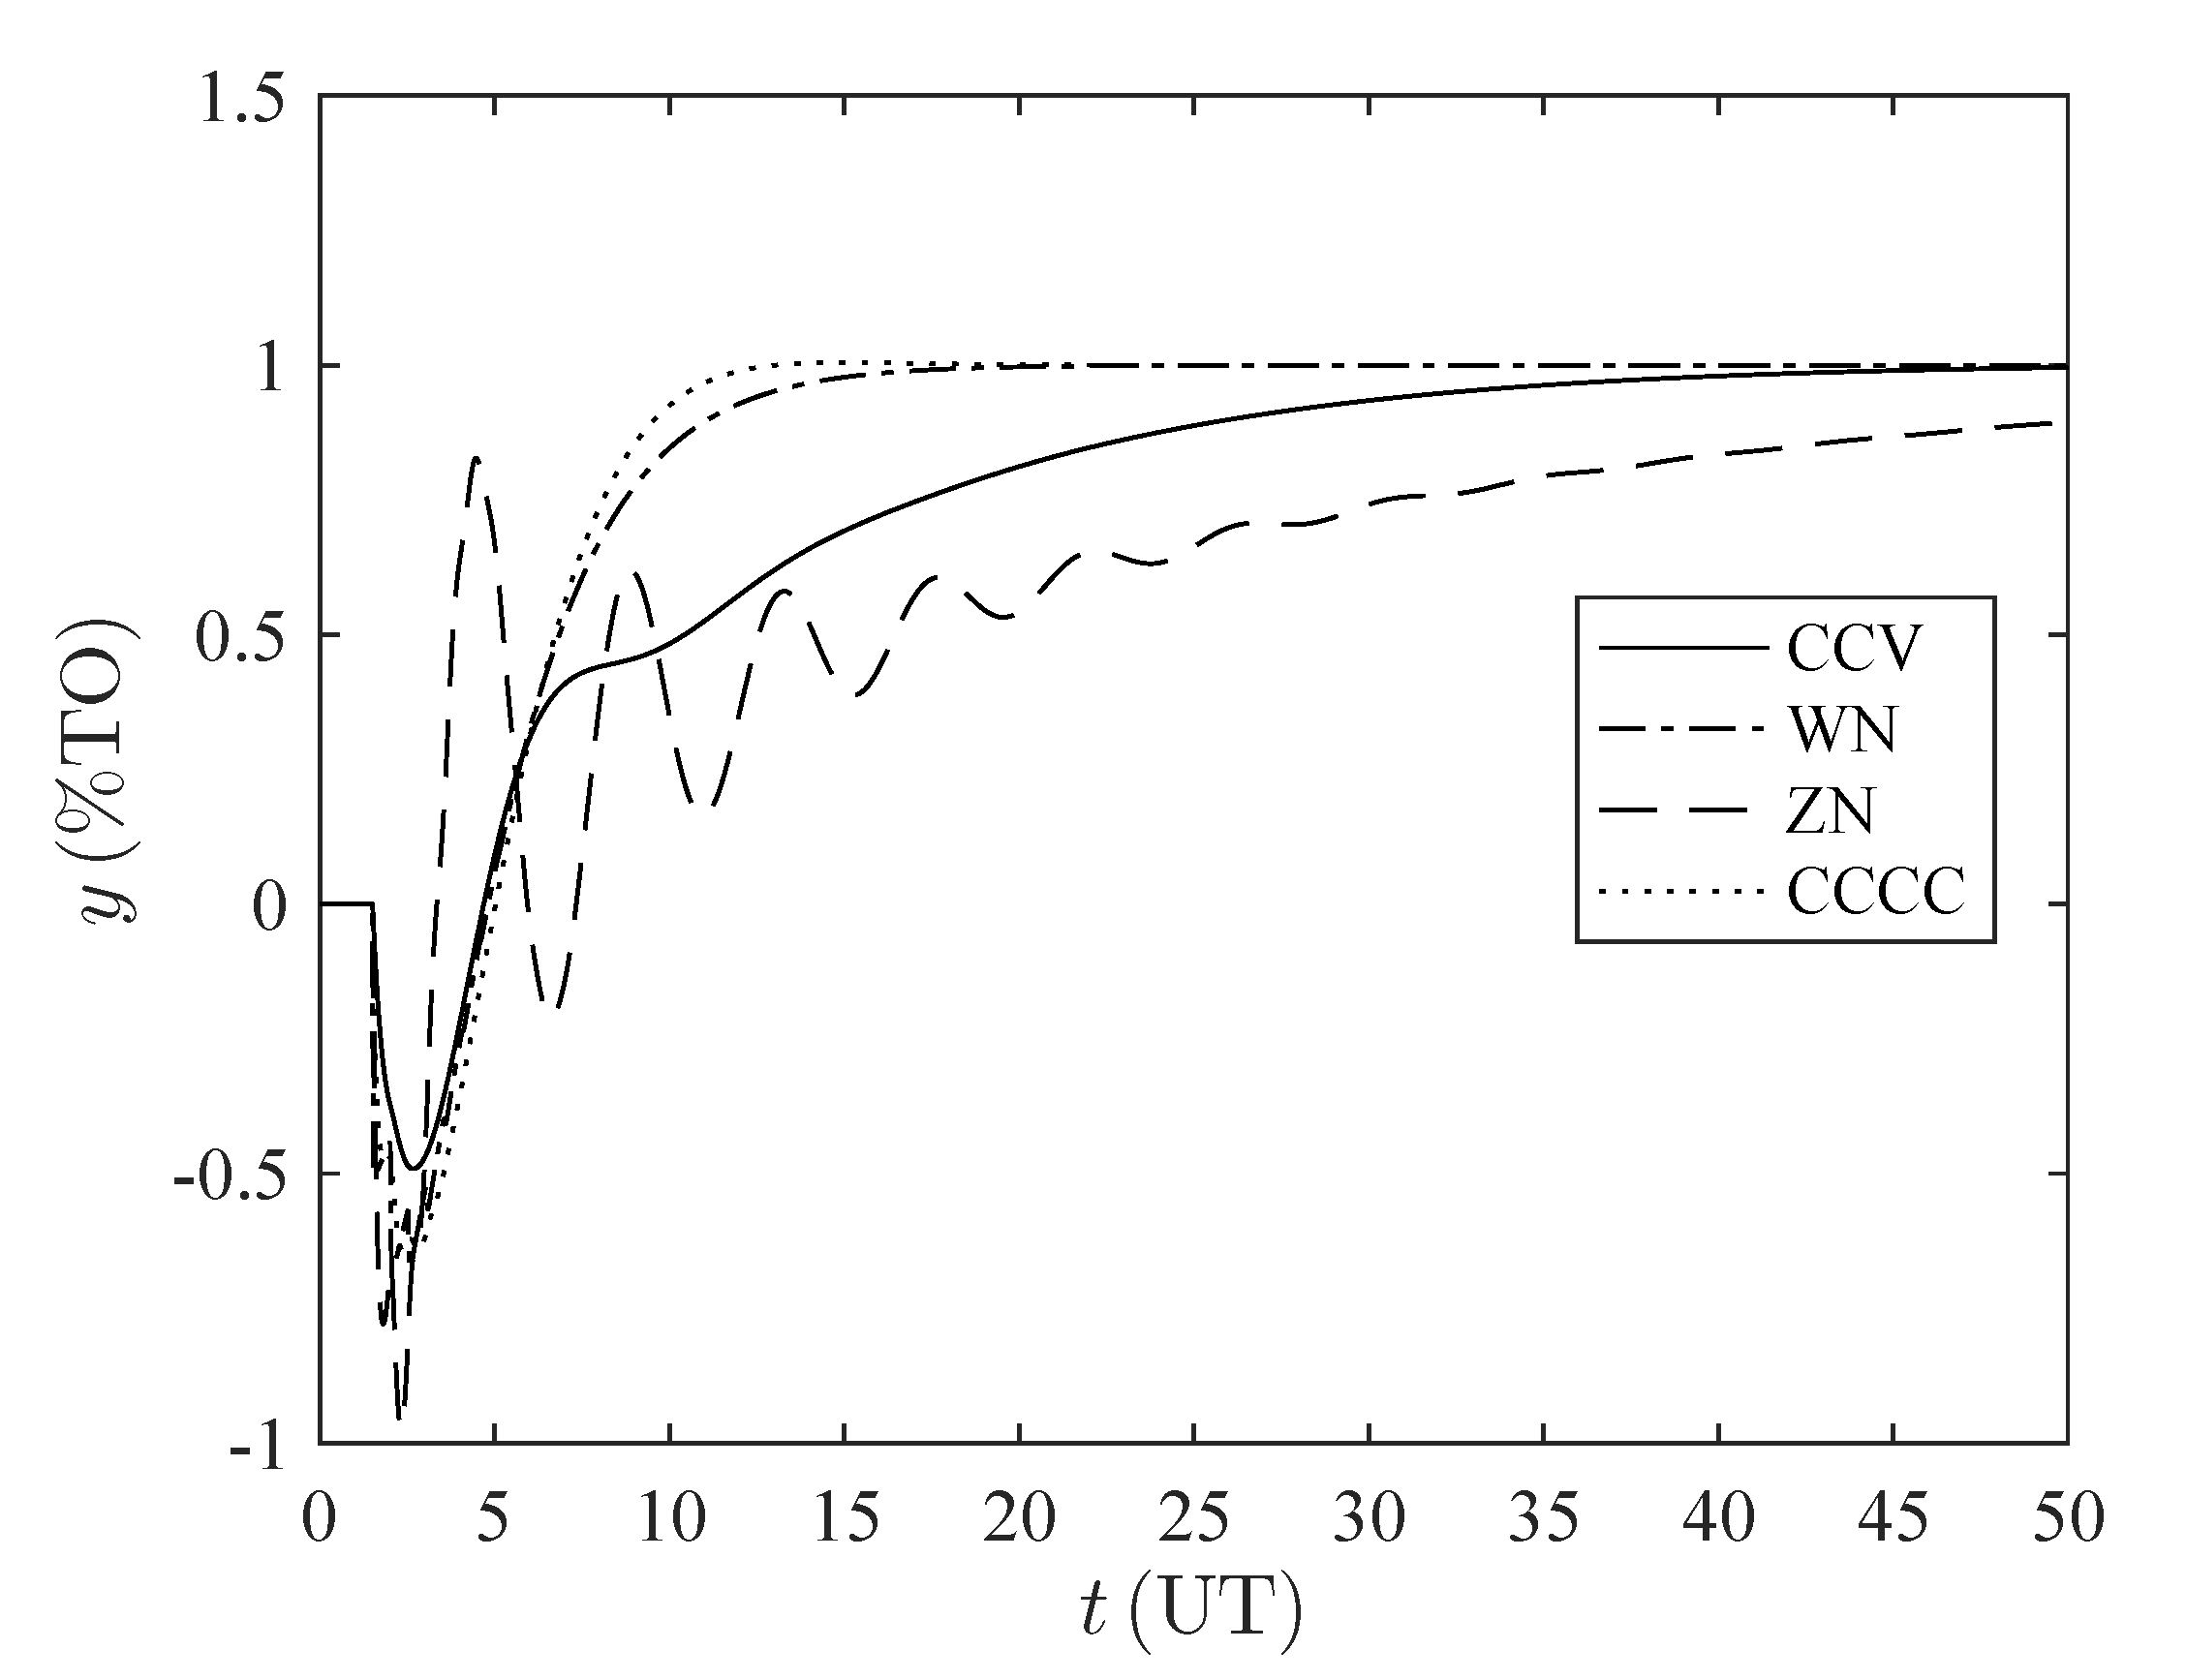
Table 5 contains the results of the performance indexes for each tuning method, when considering disturbance rejection for the set P 4 of parameters of the process’ transfer function. Then, scores were assigned for each controller, when analyzing each performance index; Table 6 contains the disturbance rejection scores for the set P 4 .
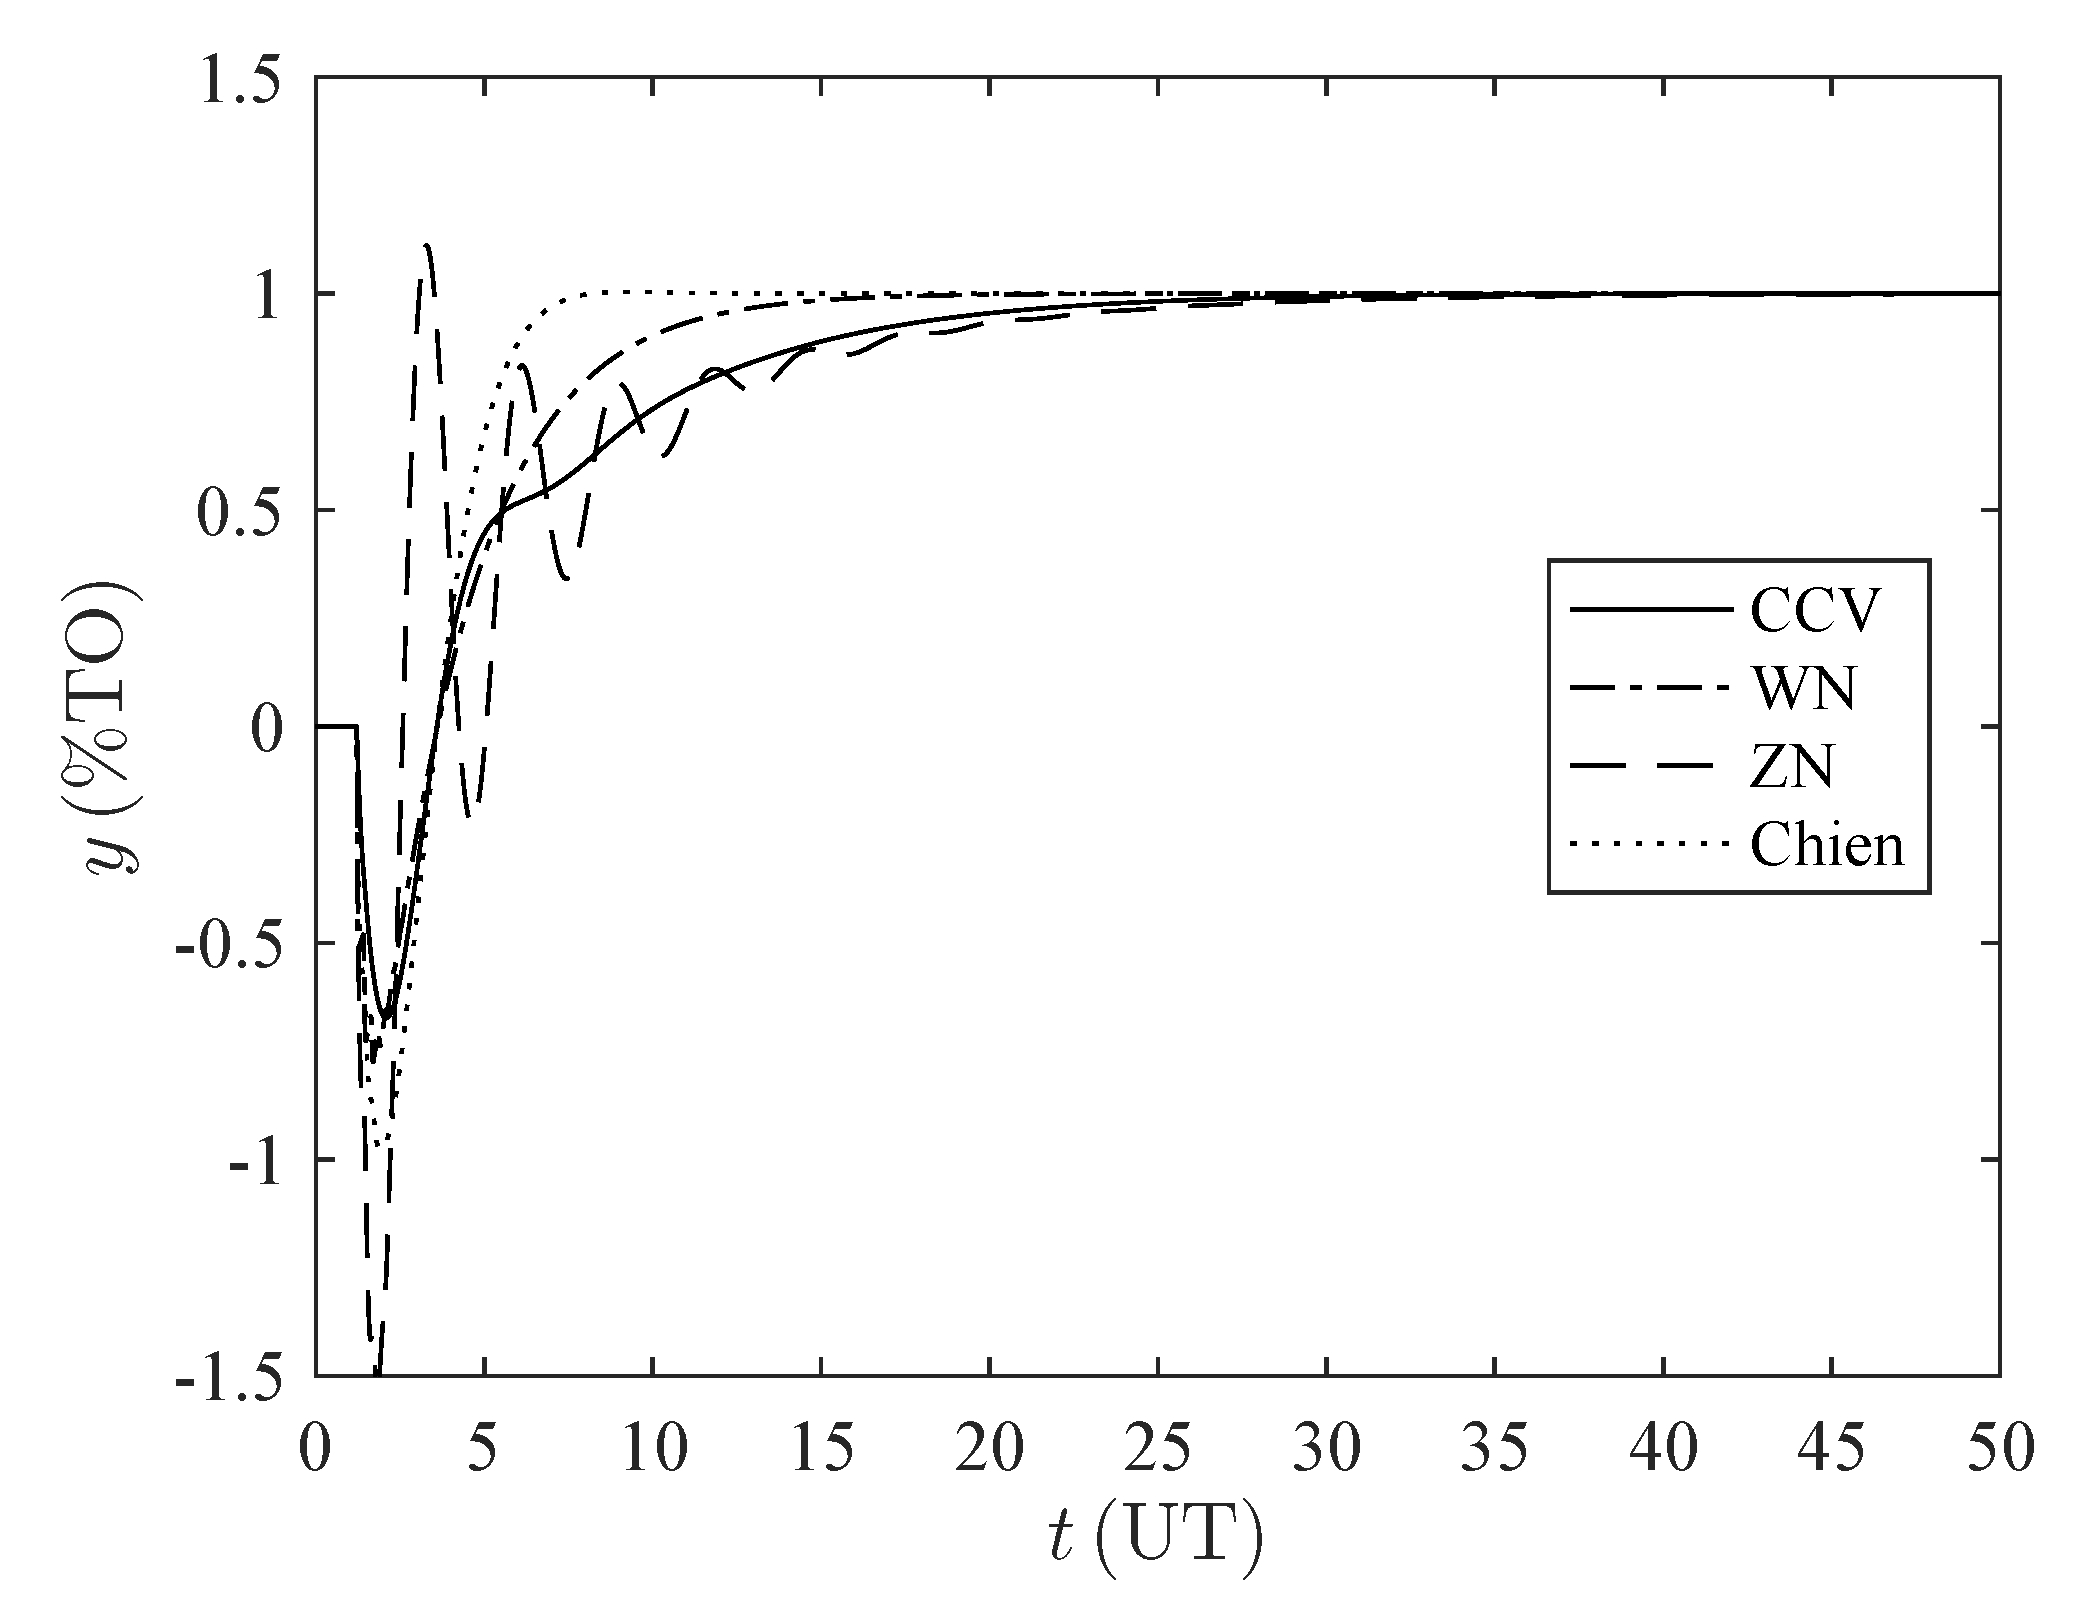
Although the controllers were adjusted for disturbance rejection, the set-point tracking capabilities were also tested. Table 7 shows the results of the performance indexes for each tuning method, when considering set-point tracking for the set P 4 of parameters of the process’ transfer function. Then, scores were assigned for each controller when analyzing each performance index; Table 8 contains the set-point tracking scores for the set P 4 .
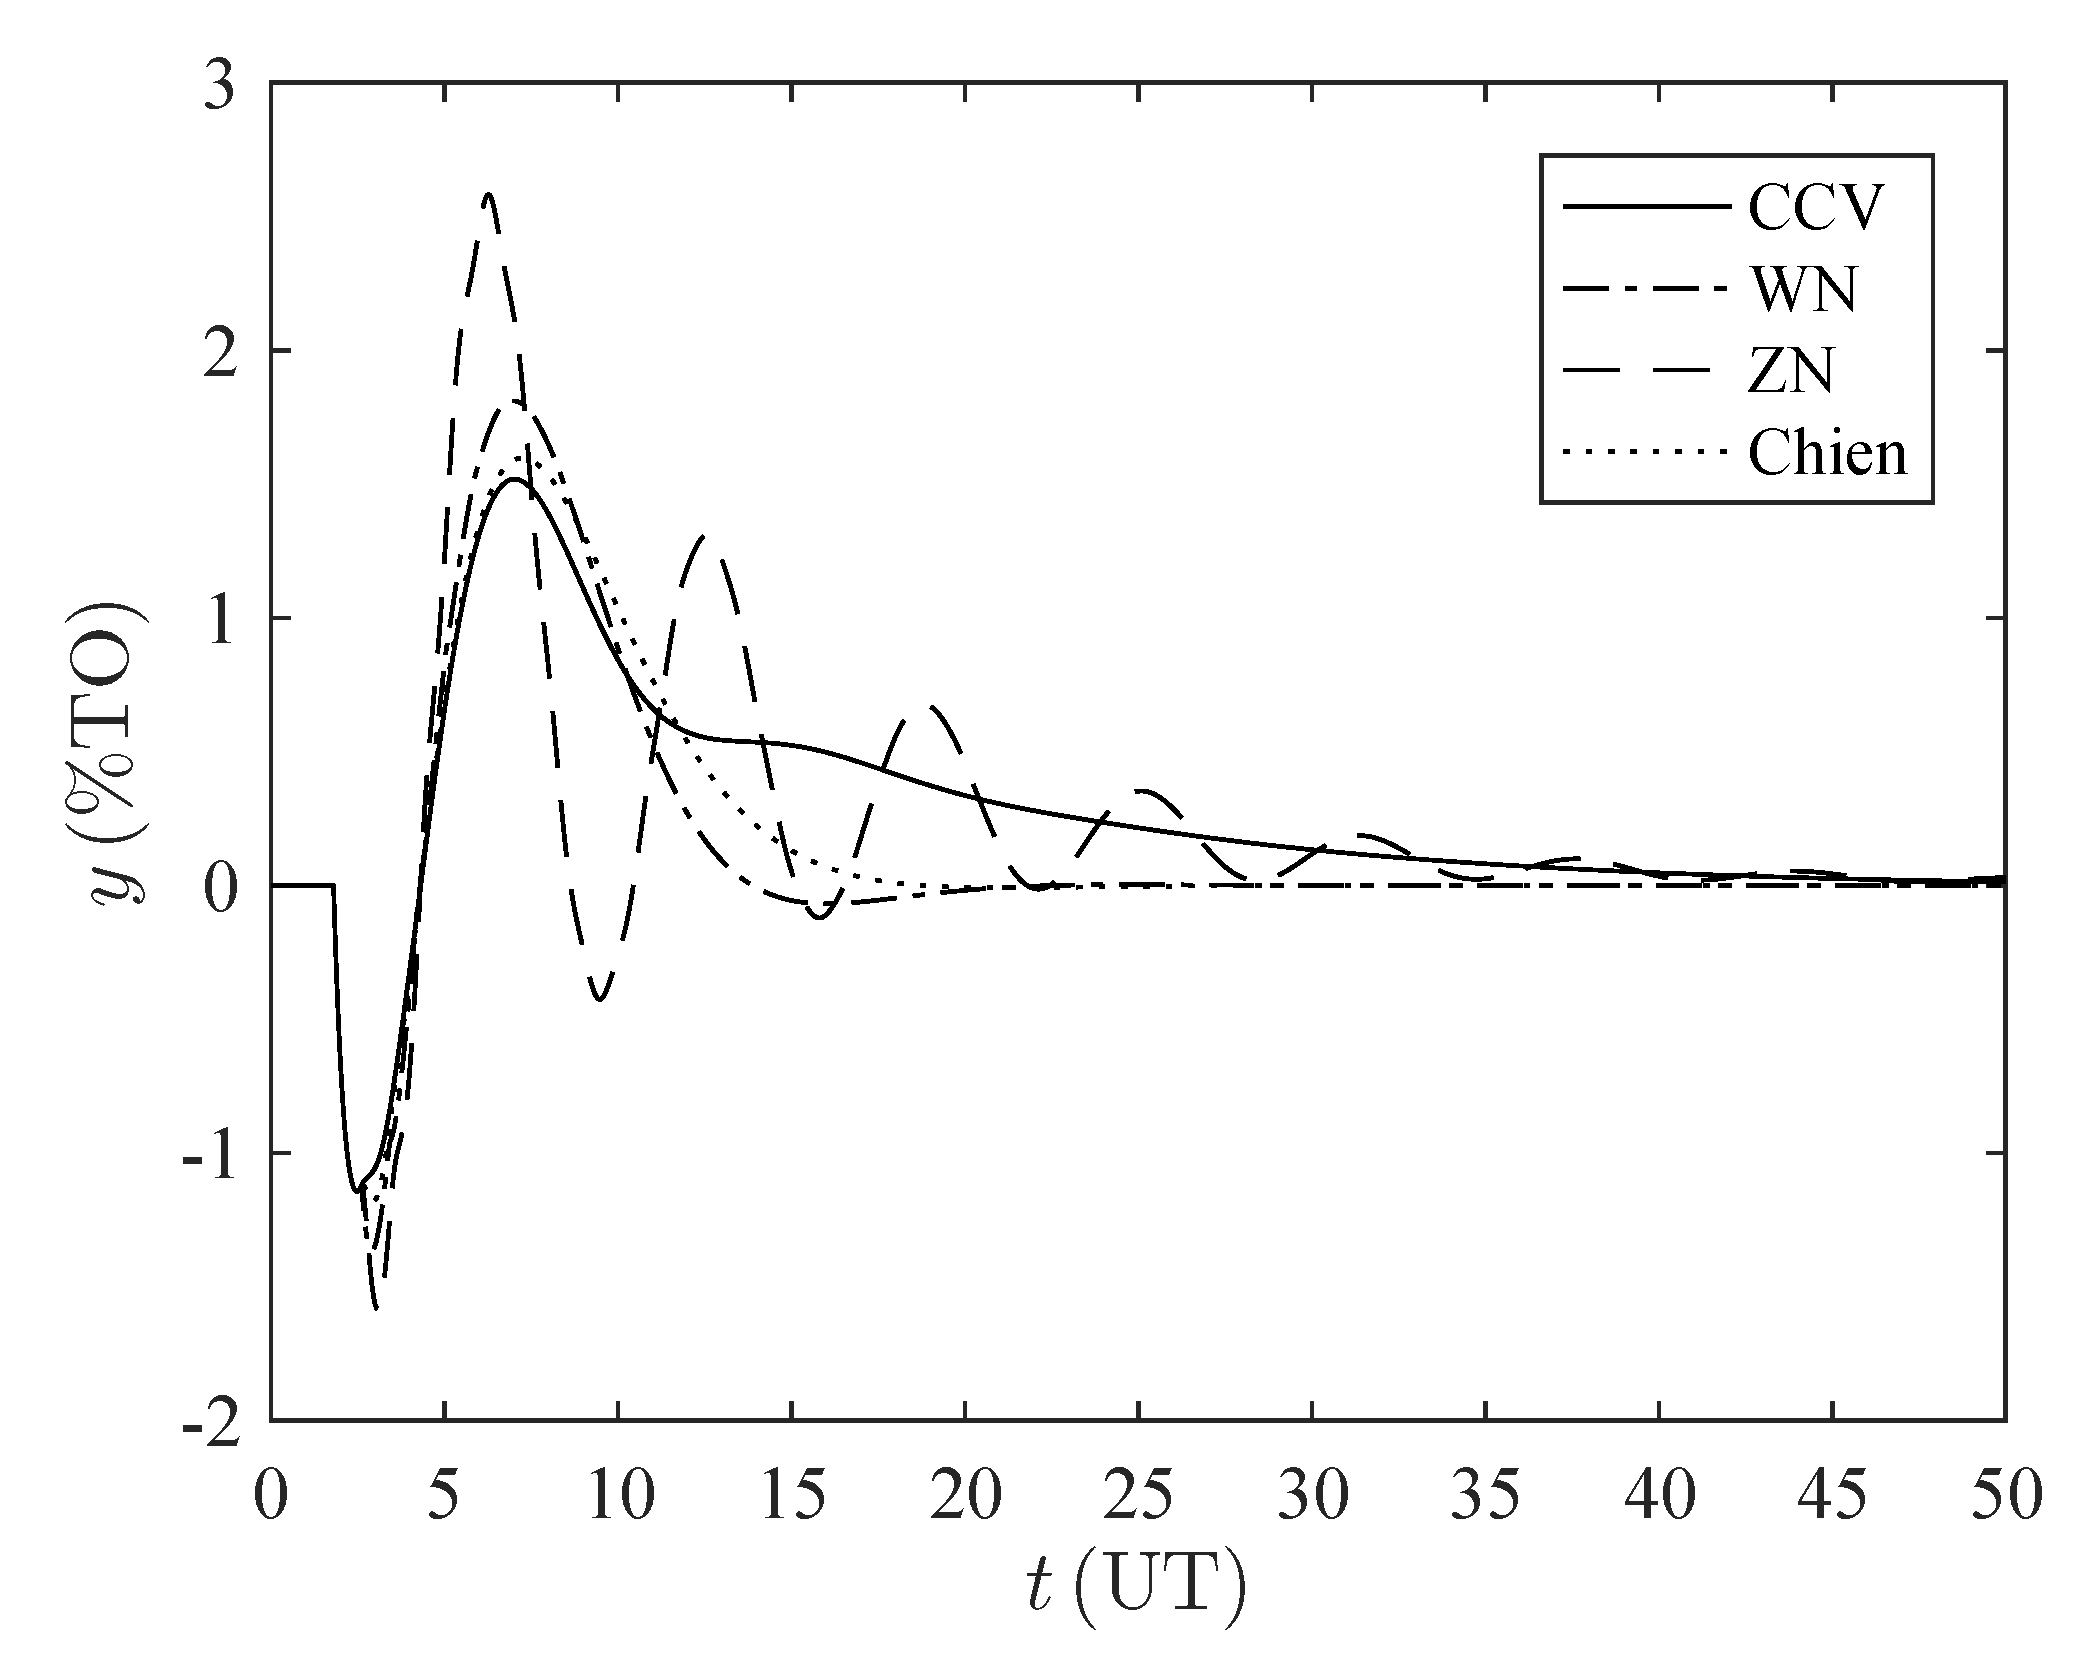
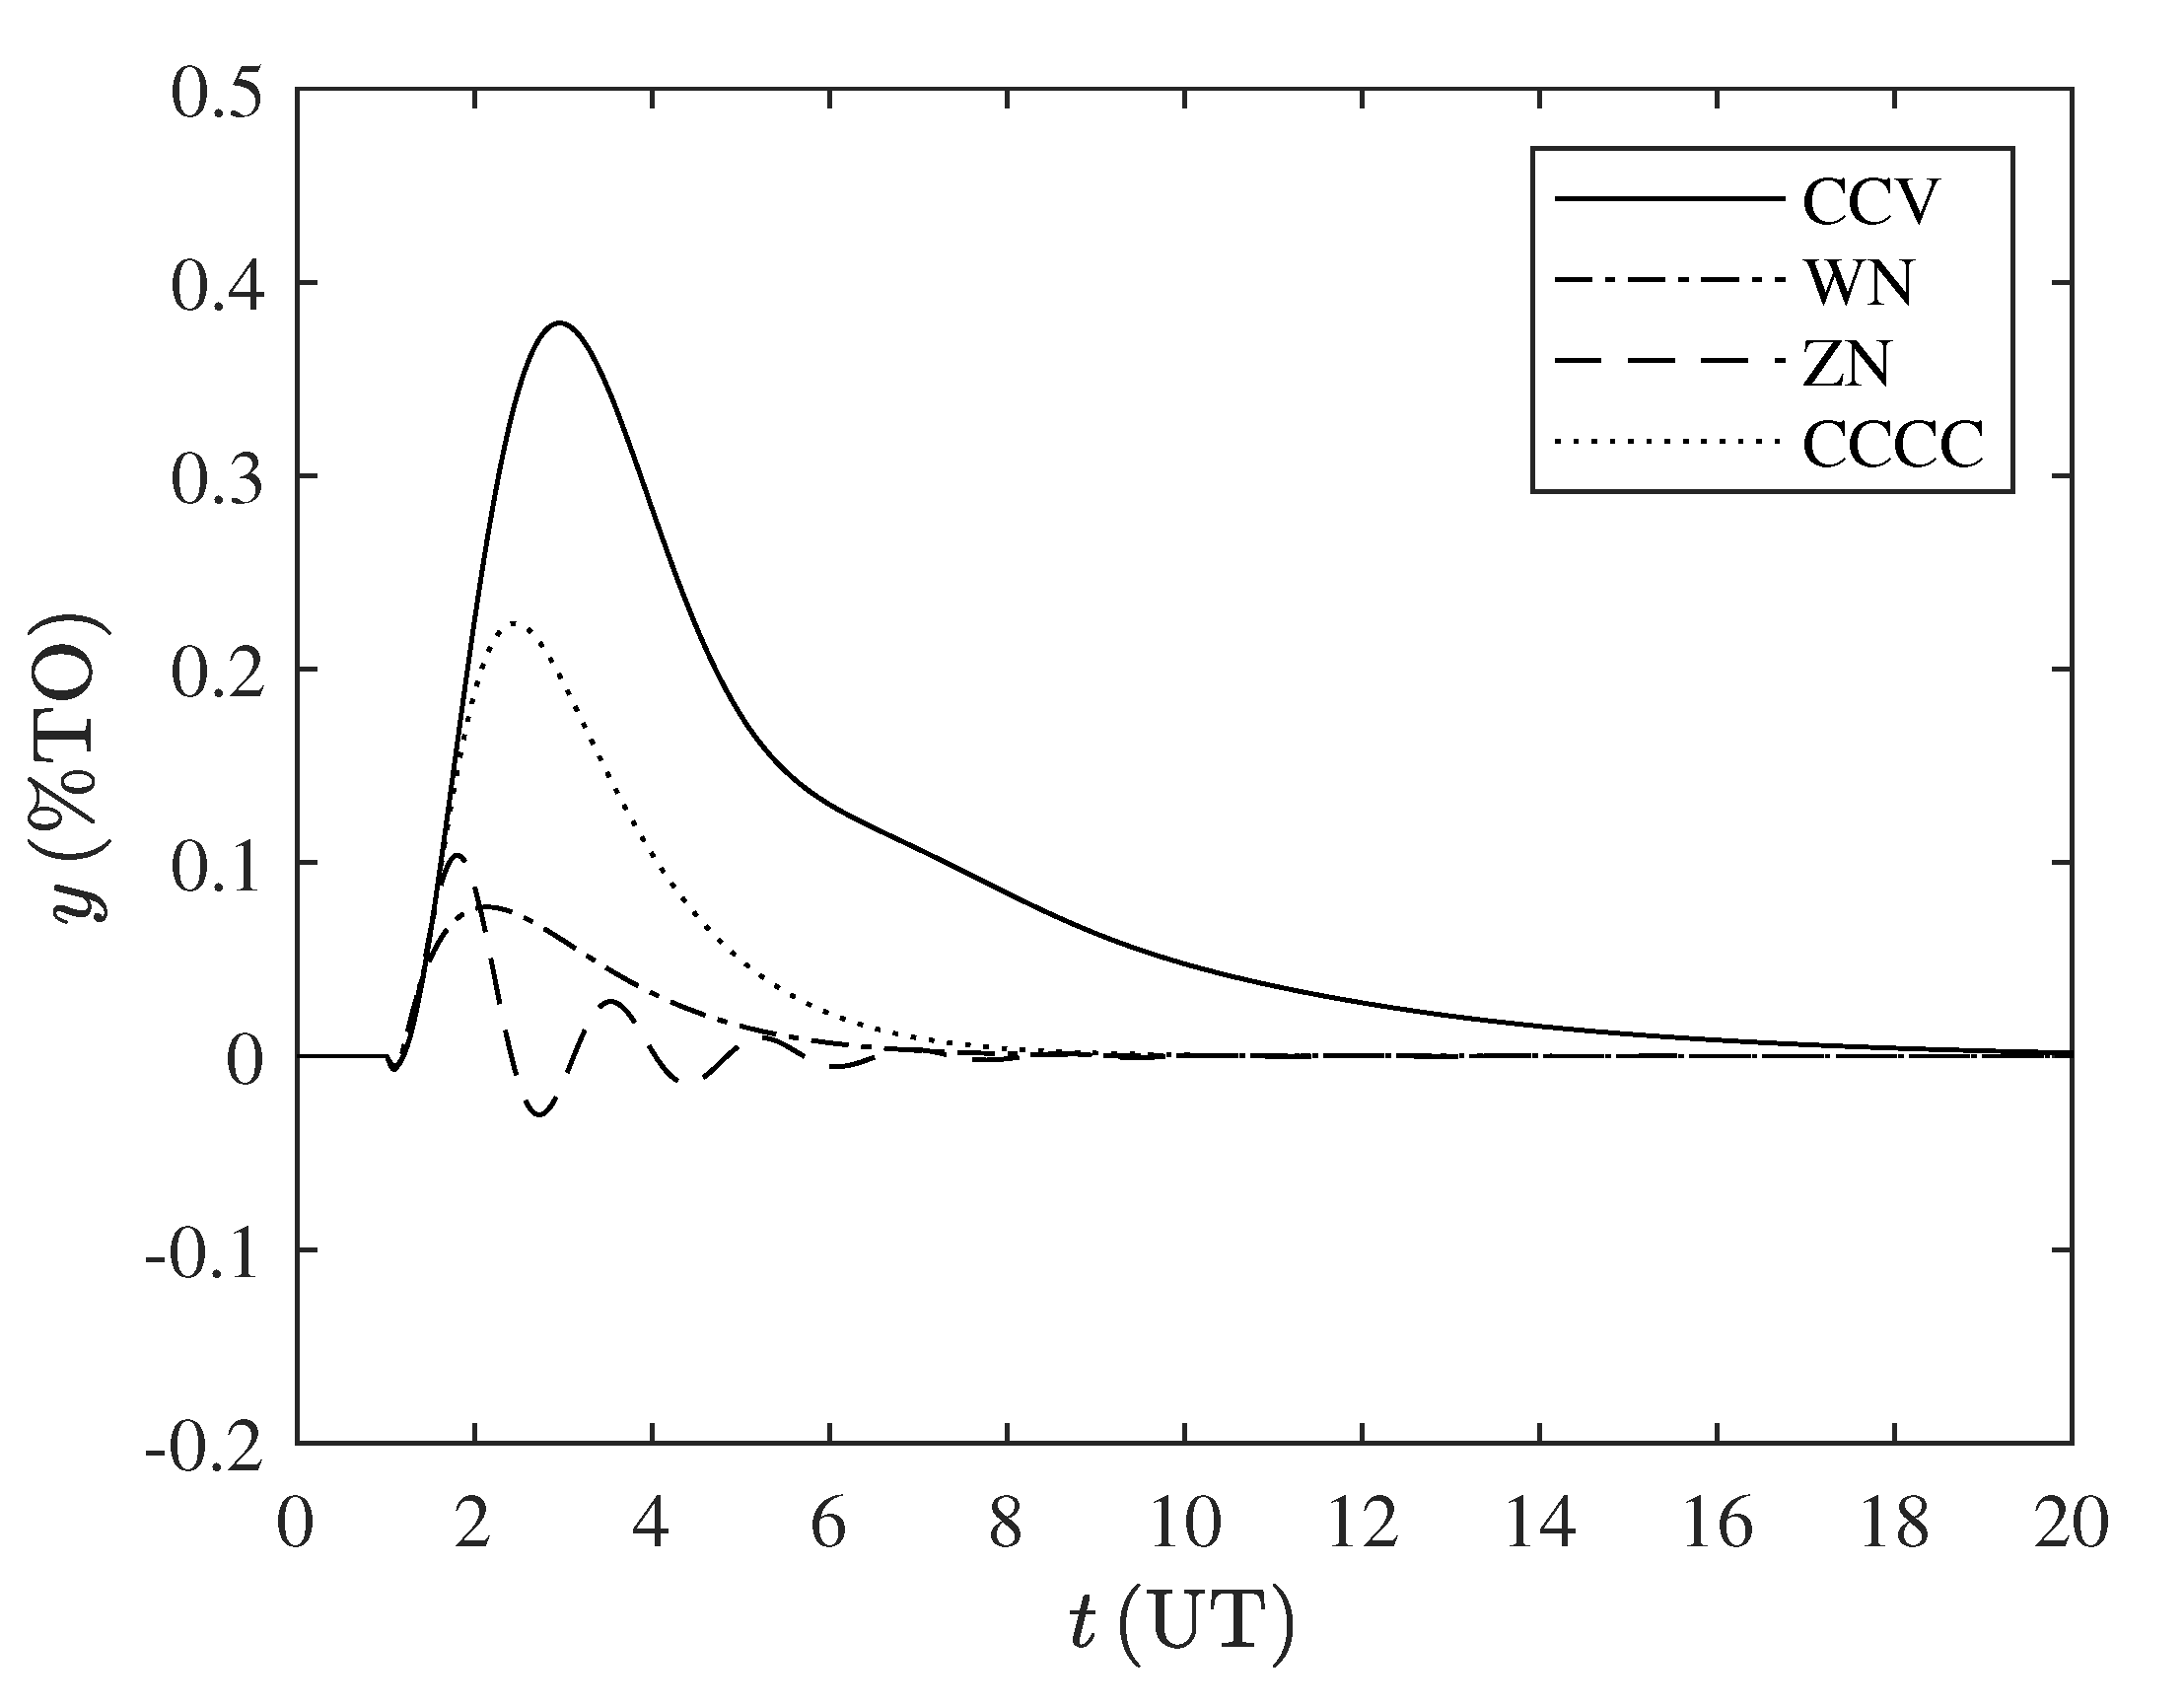
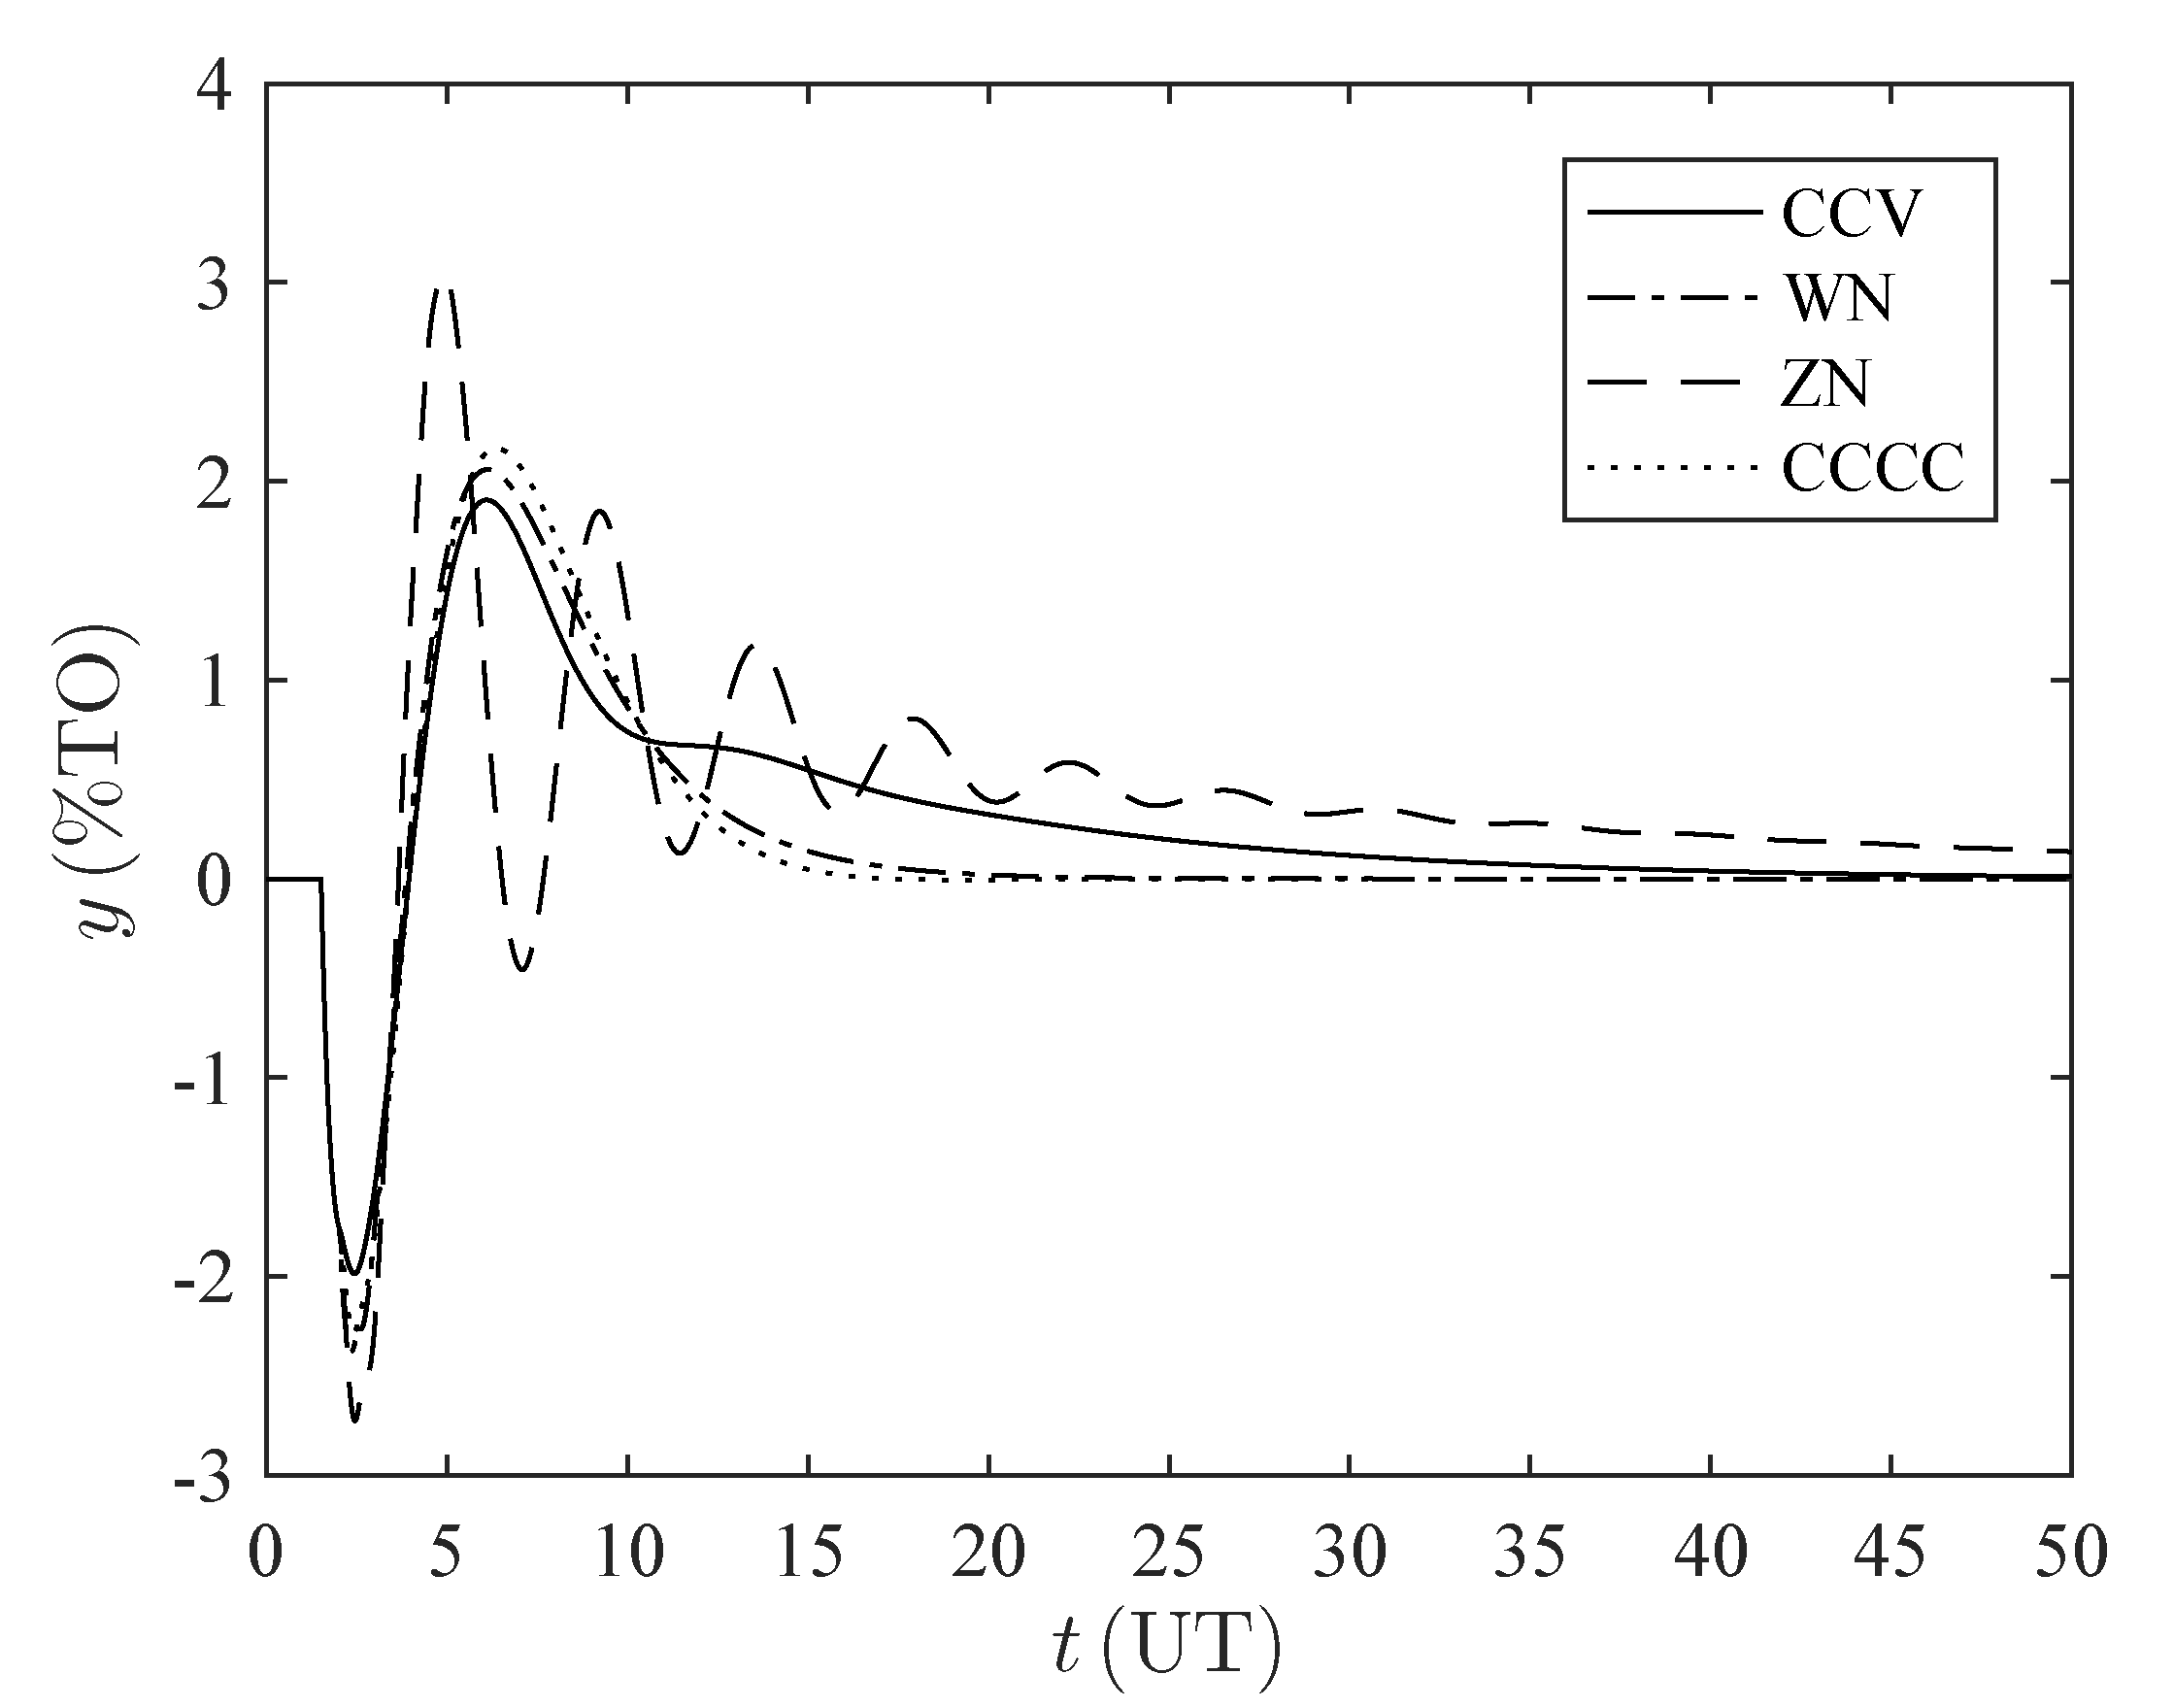
Figure 5 and Figure 6 show the time response for the parameter set P 4 , for both disturbance rejection and set-point tracking, respectively.
It can be noticed that the CCV controller has a high settling time; this occurs because of the high value assigned to the suppression factor ( γ = 4 ), in order to penalize the manipulated variable and increase the robustness, smooths the actuator’s behavior. Additionally, it can be noticed how the CCV controller decreases the inverse response effect.
This procedure was followed for the other parameter sets. In Appendix B, Table A2, Table A3, Table A4, Table A5, Table A6, Table A7, Table A8 and Table A9 contain the performance indexes for disturbance rejection and set-point tracking for the remaining sets of the parameters P 1 , P 2 , P 3 , and P 5 . In Appendix C, Figure A1, Figure A2, Figure A3, Figure A4, Figure A5, Figure A6, Figure A7 and Figure A8 show the time response for the remaining sets of parameters: P 1 , P 2 , P 3 , and P 5 .
All the points obtained by each tuning method using the scoring system were added, by considering each performance index. Table 9 shows the total scores for disturbance rejection and Table 10 shows the total scores for set-point tracking.
As it can be noticed, the proposed CCV method shows the best over-all results for disturbance rejection, when considering a wide range of parameters of the process’ transfer function. Although the controller was tuned for disturbance rejection, it still offers a very good performance for set-point tracking, when considering the same wide range of parameters of the process’ transfer function. In both operations (servo and regulatory), the CCV method achieves the best performance in both the M P and I M V indexes, which indicates that this tuning method benefits the durability of the actuator.
Although IMC is based on a pole-zero cancellation, which can lead to poor performance in the load regulation operation [65] for lag-dominant processes [66], in Appendix D we provide another simulation for a set of parameters with small dead time and high time constant ( η = 0.1 , θ = 0.01 , τ 2 = 0.9 , τ 1 = 1 ) that shows the wide application of the CCV method; this set is in the limits of the experimental region, but that was not given within the sets selected by the experimental design.

6. Discussion on Robustness Analysis

Romagnoli and Palazoglu [6] stated that there are different techniques to evaluate uncertainties in a control system. One of them consists in the selection of a range of the parameters of the process’ transfer function, as in [67], in which Arbogast et al. proposed a robust stability factor metric to examine the effect of plant-model mismatch in the process gain, dead time, and time constant for self-regulating processes. Such method uses the relation of the values of parameters that bring the system’s response to marginally stable conditions and the values of the parameters used for tuning.
Following such technique, in this work the robustness analysis consists on the study of the variability of parameters η ^ and θ ^ from Table 3 by considering a value for the suppression factor γ = 4 . The analysis was done using a Simulink scenario in which small increments for the parameter of interest were done while keeping constant all the other parameters in the plant and the controller. Simulations stopped when the output reached a sustained-oscillation response (marginal stability conditions), hence, the ultimate value was found for each parameter. Results are found in Table 11. The table indicates the value of the parameter that leads the response to reach sustained oscillations for each controller and for a particular set of parameters. Therefore, the higher the ultimate value the more robust is the technique with respect to changes in the parameter that is being analyzed.
The CCV controller is more robust with respect to variations in θ ^ , specially in the case when the dominant time constant and dead time are almost equal, or even equal. The ratio between dead time and the dominant time constant θ ^ = θ τ 1 , is known as the uncontrollability parameter and when it is near 1, it is more difficult to control the process [68]. Therefore, the CCV tuning method becomes a technique suitable for high values of such parameter. On the contrary, for low values of θ ^ , the CCV controller does not achieve the better results. With respect to η ^ , the CCV and CCCC controllers are more robust; both with similar results. However, the latter gets better results for low values of θ ^ .

7. Conclusions

In this work, we proposed an IMC-based PID tuning method for inverse-response second-order plus dead time systems. The tuning rules are based on the optimization of an objective function that combines performance and robustness. The tuning method has been presented by using an easy-to-follow ten-step methodology with equations that are mathematically simple.
A correlation that allows one to compute the value of the tuning parameter τ c that minimizes the objective function has been found. The tuning parameter τ c , affects the stability of the closed-loop control system. Small values of τ c increase the speed response of the system, but also produce an oscillatory response, to the point that the system can become unstable. Nondimensionalization reduced the number of parameters, which allows the reduction of simulations runs, saving computation time. The central composite experimental design allowed the authors to determine the appropriate number of simulations, and obtain goodness of fit for the proposed model.
The performance of a PID controller, tuned with the proposed CCV and other literature-existing tuning rules, was evaluated. The performance achieved with the proposed CCV method was excellent, not only for disturbance rejection but for set-point tracking, when considering a wide-range of parameters of the process’ transfer function. For both operations (servo and regulatory), the CCV method achieves the best performance in both the MP and IMV indexes, which indicates that this tuning method benefits the durability of the actuator. This is a very important result regarding continuous plant operation in industrial processes, since it can help avoiding unexpected plant stops caused by actuator failures.

Author Contributions

Conceptualization, D.C.-C., F.C., R.E.V. and C.S.; methodology, F.C.; software, D.C.-C.; validation, D.C.-C., F.C., R.E.V. and C.S.; formal analysis, D.C.-C. and F.C.; investigation, D.C.-C., F.C. and R.E.V.; writing—original draft preparation, D.C.-C. and R.E.V.; writing—review and editing, R.E.V.; supervision, C.S. All authors have read and agreed to the published version of the manuscript.

Funding

This research was funded by Universidad Pontificia Bolivariana and Universidad de Medellín.

Conflicts of Interest

The authors declare no conflict of interest.

Appendix A. Experimental Design Results

Table A1 contains data results from experimental design.
Table A1. Experimental design results.
τ ^ 2 η ^ θ ^ τ ^ cult τ ^ cFO | 0 τ ^ cFO | 1 τ ^ cFO | 2 τ ^ cFO | 3 τ ^ cFO | 4 τ ^ cFO | 5 τ ^ cFO | 6 τ ^ cFO | 7 τ ^ cFO | 8
0.260.890.210.491.101.701.942.102.102.102.572.573.44
0.260.890.800.551.662.092.392.632.632.752.882.882.88
0.263.210.211.502.964.254.695.335.876.597.228.058.05
0.263.210.802.114.074.645.355.705.926.046.906.907.41
0.740.890.210.891.562.282.653.223.223.413.413.553.55
0.740.890.800.932.172.543.013.383.553.874.194.194.19
0.743.210.212.384.225.325.946.466.886.887.817.817.81
0.743.210.802.875.205.576.407.027.347.758.138.398.70
0.102.050.500.972.092.742.993.543.784.404.895.365.82
0.902.050.502.043.514.094.755.275.755.996.136.136.35
0.500.100.500.190.711.231.621.851.962.002.002.002.10
0.504.000.502.805.215.947.087.327.607.968.249.608.68
0.502.050.011.282.163.105.395.805.805.865.865.805.86
0.502.050.011.713.503.104.484.885.255.595.595.595.59
0.502.050.501.543.083.714.234.634.974.974.975.355.35

Appendix B. Performance Results for Remaining Sets of Parameters

Table A2, Table A3, Table A4, Table A5, Table A6, Table A7, Table A8 and Table A9 contain performance results for remaining sets of parameters.
Table A2. Performance indexes. Disturbance rejection for the set P 1 .
Method ISE a IAE b IMV c MP d
CCV16.720013.65002.35602.0500
WN17.220011.98002.91701.8622
ZN30.950016.18008.24303.9959
CCCC22.420011.62002.98202.5230
a ( % TO ) 2 · UT ; b % TO · UT ; c % CO ; d % TO .
Table A3. Performance indexes. Set-point tracking for the set P 1 .
Method ISE a IAE b IMV c MP d
CCV6.99808.16800.79021.0007
WN6.71406.41907.23901.0000
ZN8.74908.56404.14301.3683
CCCC7.33705.24403.60101.0039
a ( % TO ) 2 · UT ; b % TO · UT ; c % CO ; d % TO .
Table A4. Performance indexes. Disturbance rejection for the set P 2 .
Method ISE a IAE b IMV c MP d
CCV6.30408.21201.98401.3950
WN5.69306.40802.86201.2494
ZN6.91807.06204.32501.7070
CCCC8.55105.97704.02702.0238
a ( % TO ) 2 · UT ; b % TO · UT ; c % CO ; d % TO .
Table A5. Performance indexes. Set-point tracking for the set P 2 .
Method ISE a IAE b IMV c MP d
CCV4.56705.90500.74661.0010
WN4.12404.100012.81001.0001
ZN4.80904.17601.94001.0000
CCCC5.24803.08100.89661.0822
a ( % TO ) 2 · UT ; b % TO · UT ; c % CO ; d % TO .
Table A6. Performance indexes. Disturbance rejection for the set P 3 .
Method ISE a IAE b IMV c MP d
CCV7.512010.28001.64501.3635
WN8.40308.80603.81601.5593
ZN10.880013.160038.06002.0353
CCCC7.21708.11501.66101.2914
a ( % TO ) 2 · UT ; b % TO · UT ; c % CO ; d % TO .
Table A7. Performance indexes. Set-point tracking for the set P 3 .
Method ISE a IAE b IMV c MP d
CCV6.01108.42600.72201.0031
WN5.88306.550021.09001.3184
ZN8.059012.270058.06001.3625
CCCC5.67406.24001.24701.0119
a ( % TO ) 2 · UT ; b % TO · UT ; c % CO ; d % TO .
Table A8. Performance indexes. Disturbance rejection for the set P 5 .
Method ISE a IAE b IMV c MP d
CCV13.130016.77001.66101.5205
WN14.260011.40003.20501.8102
ZN20.930017.69007.83832.5812
CCCC12.500013.54001.44701.5975
a ( % TO ) 2 · UT ; b % TO · UT ; c % CO ; d % TO .
Table A9. Performance indexes. Set-point tracking for the set P 5 .
Method ISE a IAE b IMV c MP d
CCV8.917013.01000.76300.9951
WN7.64306.976019.30001.0624
ZN9.882011.72007.16501.1496
CCCC7.67407.63102.52301.0080
a ( % TO ) 2 · UT ; b % TO · UT ; c % CO ; d % TO .

Appendix C. Plots for the Remaining Sets of Parameters

Figure A1, Figure A2, Figure A3, Figure A4, Figure A5, Figure A6, Figure A7 and Figure A8 contain plots for the remaining sets of parameters.
Figure A1. Time response disturbance rejection for the set P 1 . %TO: percentage of transmitter output, UT: units of time.
Processes 08 01183 g0a1
Figure A2. Time response set-point tracking for the set P 1 . %TO: percentage of transmitter output, UT: units of time.
Processes 08 01183 g0a2
Figure A3. Time response disturbance rejection for the set P 2 . %TO: percentage of transmitter output, UT: units of time.
Processes 08 01183 g0a3
Figure A4. Time response set-point tracking for the set P 2 . %TO: percentage of transmitter output, UT: units of time.
Processes 08 01183 g0a4
Figure A5. Time response disturbance rejection for the set P 3 . %TO: percentage of transmitter output, UT: units of time.
Processes 08 01183 g0a5
Figure A6. Time response set-point tracking for the set P 3 . %TO: percentage of transmitter output, UT: units of time.
Processes 08 01183 g0a6
Figure A7. Time response disturbance rejection for the set P 5 . %TO: percentage of transmitter output, UT: units of time.
Processes 08 01183 g0a7
Figure A8. Time response set-point tracking for the set P 5 . %TO: percentage of transmitter output, UT: units of time.
Processes 08 01183 g0a8

Appendix D. Additional Simulation in the Limits of the Experimental Region

We provide another simulation for a set of parameters with small dead time and high time constant that shows the wide application of the CCV method, see Table A10; this set is in the limits of the experimental region, but that was not given within the sets selected by the experimental design.
Table A10. Simulation parameters set for lag-dominant simulation (with τ 1 = 1 ).
Parameters τ ^ 2 η ^ θ ^
P 6 0.9000.1000.01
The system was excited with a unit-step input for changes in the disturbance and changes in the set-point. A value of γ = 4 was assigned the simulation in order to penalize the behavior of the manipulated variable (as in all previous simulations), considered in the second term of the optimization objective function (13). Table A11 contains the nondimensional controller parameters computed for this simulation set.
Table A11. Controller parameters for set P 6 .
SetCCVWNZNCCCC
K c k T ^ i T ^ d K c k T ^ i T ^ d K c k T ^ i T ^ d K c k T ^ i T d
P 6 1.1941.9010.4749.5001.9000.4739.8470.7100.1771.7681.0000.900
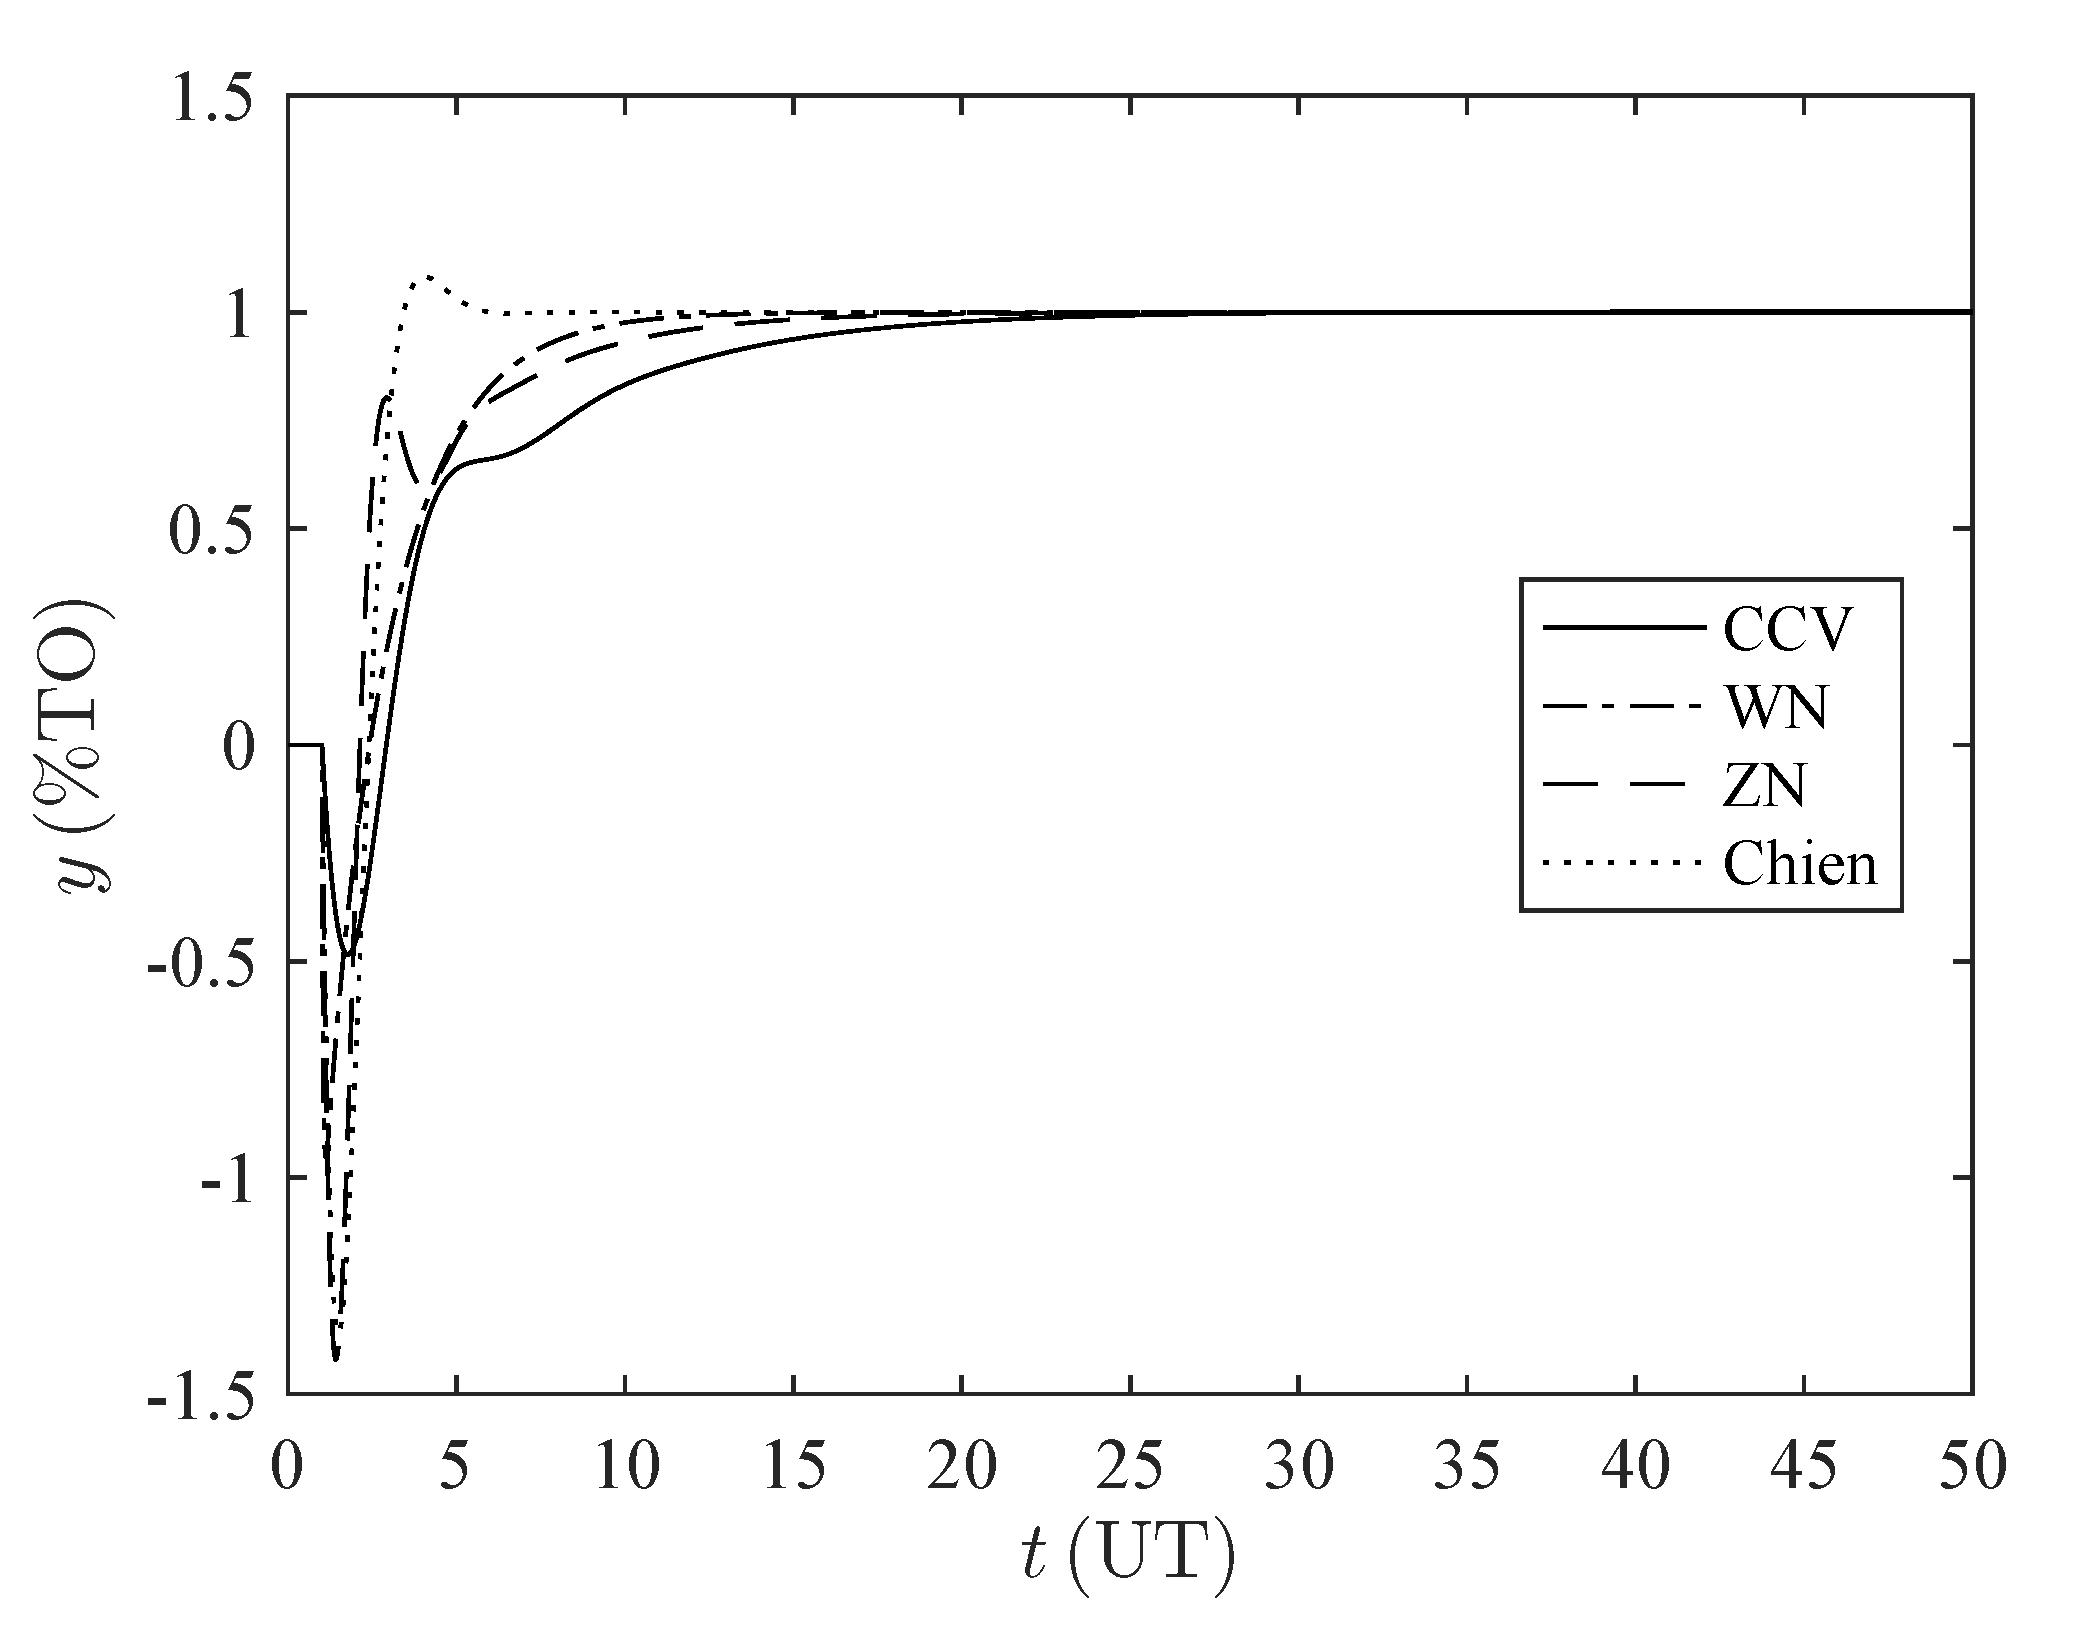
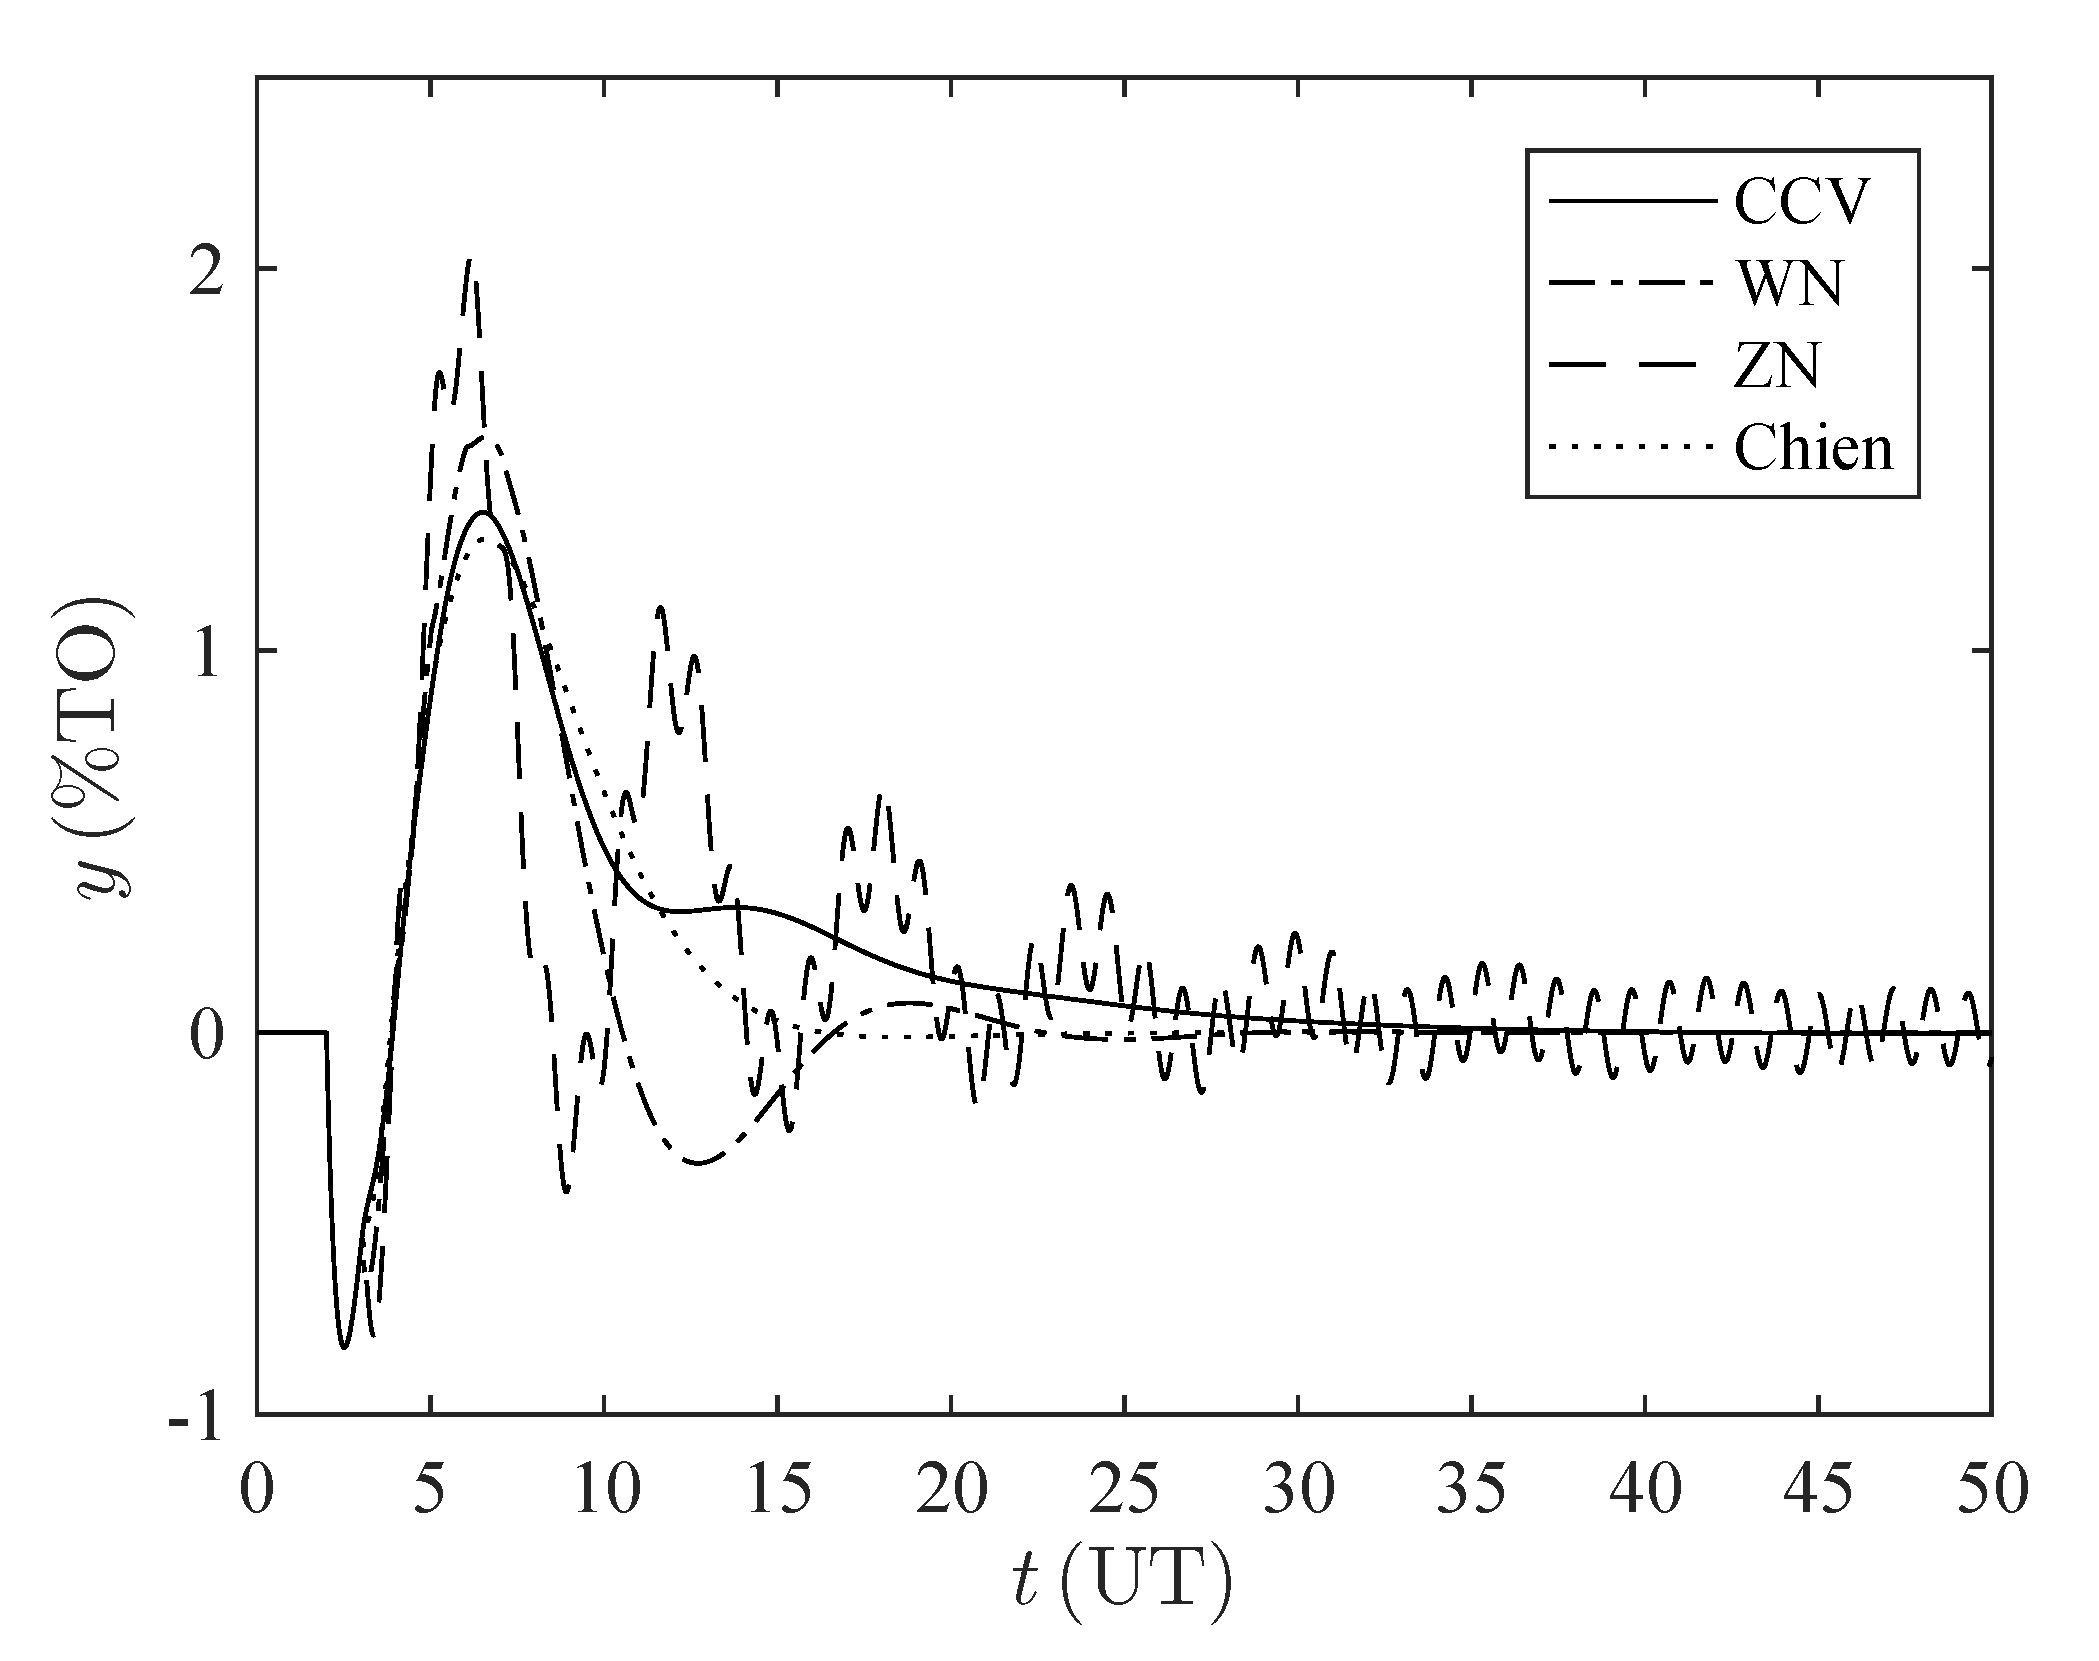
Table A12 and Table A13 contain the performance indexes for the set of parameters P 6 . It can be noticed that the CCV controller offers the lower index for the work of the manipulated value, since we chose the suppression factor ( γ = 4 ), to smooth the actuator’s behavior and increase the robustness. Additionally, the CCV controller response do not exhibit overshoot and show the smallest inverse-response effect, see Figure A9 and Figure A10. This proves the wide application of the CCV tuning method.
Table A12. Performance indexes. Disturbance rejection for the set P 6 .
Method ISE a IAE b IMV c MP d
CCV0.3491.6471.1600.379
WN0.0100.2012.2870.077
ZN0.0070.1245.1810.104
CCCC0.0840.5671.1670.224
a ( % TO ) 2 · UT ; b % TO · UT ; c % CO ; d % TO .
Table A13. Performance indexes. Set-point tracking for the set P 6 .
Method ISE a IAE b IMV c MP d
CCV0.8701.6471.5381.001
WN0.2270.206569.11.026
ZN0.6861.37093.131.769
CCCC0.4620.6309.1521.043
a ( % TO ) 2 · UT ; b % TO · UT ; c % CO ; d % TO .
Figure A9. Time response disturbance rejection for the set P 6 . %TO: percentage of transmitter output, UT: units of time.
Processes 08 01183 g0a9
Figure A10. Time response set-point tracking for the set P 6 . %TO: percentage of transmitter output, UT: units of time.
Processes 08 01183 g0a10

References

  1. Camacho, O.; Rojas, R.; García, W. Variable structure control applied to chemical processes with inverse response. ISA Trans. 1999, 38, 55–72. [Google Scholar] [CrossRef]
  2. Zhang, W.; Xu, X.; Sun, Y. Quantitative Performance Design for Inverse-Response Processes. Ind. Eng. Chem. Res. 2000, 39, 2056–2061. [Google Scholar] [CrossRef]
  3. Stephanopoulos, G. Chemical Process Control. An Introduction to Theory and Practice; Prentice Hall: New York, NY, USA, 1984. [Google Scholar]
  4. Ogunnaike, B.A.; Ray, W.H. Process Dynamics Modeling and Control; Topics in Chemical Engineering; Oxford University Press: Don Mills, ON, Canada, 1994; p. 1260. [Google Scholar]
  5. De Castro, P.; Fernández, E. Control e Instrumentación de Procesos Químicos; Editorial Síntesis: Madrid, Spain, 2006. [Google Scholar]
  6. Romagnoli, J.A.; Palazoglu, A. Introduction to Process Control, 2nd ed.; CRC Press: Boca Raton, FL, USA, 2012. [Google Scholar]
  7. Joshi, M.; Uniyal, J.; Juneja, P.K. Design of inverse response compensator for complex process. In Proceedings of the 2016 International Conference on Advances in Computing, Communication, Automation (ICACCA), Dehradun, India, 29–30 April 2016; pp. 1–6. [Google Scholar]
  8. Muresan, C.I.; Ionescu, C.M. Generalization of the FOPDT Model for Identification and Control Purposes. Processes 2020, 8, 682. [Google Scholar] [CrossRef]
  9. Pai, N.; Chang, S.; Huangb, C. Tuning PI/PID controllers for integrating processes with deadtime and inverse response by simple calculations. J. Process. Control. 2010, 20, 726–733. [Google Scholar] [CrossRef]
  10. Jeng, J.; Lin, S. PID controller tuning based on Smith-type compensator for second-order process with inverse response and time delay. In Proceedings of the 2011 8th Asian Control Conference (ASCC), Kaohsiung, Taiwan, 15–18 May 2011. [Google Scholar]
  11. Castellanos, D.; Castrillón, F. Controladores PI/PID en procesos con respuesta inversa evaluación de la robustez. Ing. QuÍMica 2012, 502, 48–52. [Google Scholar]
  12. Ocampo, J.E.; Castrillón, F. Control de sistemas con respuesta inversa. Ing. QuÍMica 2010, 42, 76–85. [Google Scholar]
  13. Waller, K.V.; Nygardas, C. On inverse response in process control. Ind. Eng. Chem. Fundam. 1975, 14, 221–223. [Google Scholar] [CrossRef]
  14. Ziegler, J.; Nichols, N. Optimum Settings for Automatic Controllers. J. Dyn. Syst. Meas. Control. 1993, 115, 220–222. [Google Scholar] [CrossRef]
  15. Scali, C.; Rachid, A. Analytical design of Proportional-Integral-Derivative controllers for inverse response process. Ind. Eng. Chem. Res. 1998, 37, 1372–1379. [Google Scholar] [CrossRef]
  16. Luyben, W.L. Tuning Proportional-Integral controllers for processes with both inverse response and deadtime. Ind. Eng. Chem. Res. 2000, 39, 973–976. [Google Scholar] [CrossRef]
  17. Chien, I.L.; Chung, Y.C.; Chen, B.S.; Chuang, C.Y. Simple PID controller tuning method for processes with inverse response plus dead time or large overshoot response plus dead time. Ind. Eng. Chem. Res. 2003, 42, 4461–4477. [Google Scholar] [CrossRef]
  18. Sree, R.P.; Chidambaram, M. Simple method of tuning PI controller for stable inverse response systems. J. Indian Inst. Sci. 2003, 83, 73–85. [Google Scholar]
  19. Chen, D.; Seborg, D.E. PI/PID Controller design based on direct synthesis and disturbance rejection. Ind. Eng. Chem. Res. 2002, 41, 4807–4822. [Google Scholar] [CrossRef]
  20. Shamsuzzoha, M.; Lee, M. PID controller design for integrating processes with time delay. Korean J. Chem. Eng. 2008, 25, 637–645. [Google Scholar] [CrossRef]
  21. Begum, K.G.; Rao, A.S.; Radhakrishnan, T. Enhanced IMC based PID controller design for non-minimum phase (NMP) integrating processes with time delays. ISA Trans. 2017, 68, 223–234. [Google Scholar] [CrossRef]
  22. Irshad, M.; Ali, A. Optimal tuning rules for PI/PID controllers for inverse response processes. IFAC PapersOnLine 2018, 51, 413–418. [Google Scholar] [CrossRef]
  23. Patil, P.; Rao, C.S. Enhanced PID Controller for Non-Minimum Phase Second Order Plus Time Delay System. Chem. Prod. Process. Model. 2019, 14. [Google Scholar] [CrossRef]
  24. Xu, G.; Wu, T.; Zhang, J.; Yue, G. The two-degree-of-freedom parallel control for inverse response plus time delay. Syst. Sci. Control. Eng. 2019, 7, 90–95. [Google Scholar] [CrossRef]
  25. Kaya, I. Integral-Proportional Derivative tuning for optimal closed loop responses to control integrating processes with inverse response. Trans. Inst. Meas. Control. 2020, 1–12. [Google Scholar] [CrossRef]
  26. Siddiqui, M.A.; Anwar, M.N.; Laskar, S.H. Tuning of PIDF Controller in Parallel Control Structure for Integrating Process with Time Delay and Inverse Response Characteristic. J. Control. Autom. Electr. Syst. 2020, 31, 829–841. [Google Scholar] [CrossRef]
  27. Nagarsheth, S.H.; Sharma, S.N. Control of non-minimum phase systems with dead time: A fractional system viewpoint. Int. J. Syst. Sci. 2020, 51, 1905–1928. [Google Scholar] [CrossRef]
  28. Herrera, M.; Camacho, O.; Leiva, H.; Smith, C. An approach of dynamic sliding mode control for chemical processes. J. Process. Control. 2020, 85, 112–120. [Google Scholar] [CrossRef]
  29. Luyben, W.L. Identification and tuning of integrating processes with deadtime and inverse response. Ind. Eng. Chem. Res. 2003, 42, 3030–3035. [Google Scholar] [CrossRef]
  30. Rivera, D.E.; Morari, M.; Skogestad, S. Internal model control: PID controller design. Ind. Eng. Chem. Process. Des. Dev. 1986, 25, 252–265. [Google Scholar] [CrossRef]
  31. Alfaro, V.M.; Balaguer, P.; Arrieta, O. Robustness Considerations on PID Tuning for Regulatory Control of Inverse Response Processes. IFAC Proc. Vol. 2012, 45, 193–198. [Google Scholar] [CrossRef] [Green Version]
  32. Ionescu, C.; Alfredo Cajo Diaz, R.; Zhao, S.; Ghita, M.; Ghita, M.; Copot, D. A Low Computational Cost, Prioritized, Multi-Objective Optimization Procedure for Predictive Control Towards Cyber Physical Systems. IEEE Access 2020, 8, 128152–128166. [Google Scholar] [CrossRef]
  33. Shamsuzzoha, M.; Lee, M. IMC-PID Controller Design for Improved Disturbance Rejection of Time-Delayed Processes. Ind. Eng. Chem. Res. 2007, 46, 2077–2091. [Google Scholar] [CrossRef]
  34. Lee, H.; Na, G.; Eun, Y. Extension of simplified internal model control for systems with double integrators. In Proceedings of the 2017 17th International Conference on Control, Automation and Systems (ICCAS), Jeju, Korea, 18–21 October 2017; pp. 1212–1217. [Google Scholar]
  35. Paulusová, J.; Paulus, M. Internal model control of thermo-optical plant. In Proceedings of the 2017 21st International Conference on Process Control (PC), Štrbské Pleso, Slovakia, 6–9 June 2017; pp. 179–184. [Google Scholar]
  36. Tran, C.D.; Ibrahim, R.; Asirvadam, V.S.; Saad, N.; Miya, H.S. Internal model control for industrial wireless plant using WirelessHART hardware-in-the-loop simulator. ISA Trans. 2018, 75, 236–246. [Google Scholar] [CrossRef] [PubMed]
  37. Leva, A.; Papadopoulos, A.V.; Seva, S.; Cimino, C. Explicit Model-Based Real PID Tuning for Efficient Load Disturbance Rejection. Ind. Eng. Chem. Res. 2019, 58, 23211–23224. [Google Scholar] [CrossRef]
  38. Tasoujian, S.; Salavati, S.; Franchek, M.; Grigoriadis, K. Robust IMC-PID and Parameter-varying Control Strategies for Automated Blood Pressure Regulation. Int. J. Control. Autom. Syst. 2019, 17, 1803–1813. [Google Scholar] [CrossRef]
  39. Vasu, G.; Sivakumar, M.; Ramalingaraju, M. Optimal IMC-PID controller design for large-scale power systems via EDE algorithm-based model approximation method. Trans. Inst. Meas. Control. 2020, 1–19. [Google Scholar] [CrossRef]
  40. Ranganayakulu, R.; Rao, A.S.; Babu, G.U.B. Analytical design of fractional IMC filter-PID control strategy for performance enhancement of cascade control systems. Int. J. Syst. Sci. 2020, 51, 1699–1713. [Google Scholar] [CrossRef]
  41. Jain, S.; Hote, Y.V. Weighted Internal Model Control-Proportional Integral Derivative Control Scheme Via Fractional Gradient Descent Algorithm. J. Dyn. Syst. Meas. Control. 2020, 142. [Google Scholar] [CrossRef]
  42. Zeng, W.; Zhu, W.; Hui, T.; Chen, L.; Xie, J.; Yu, T. An IMC-PID controller with Particle Swarm Optimization algorithm for MSBR core power control. Nucl. Eng. Des. 2020, 360, 1–7. [Google Scholar] [CrossRef]
  43. Wang, P.; Chen, Z.; Liao, L.; Wan, J.; Wu, S. A multiple-model based internal model control method for power control of small pressurized water reactors. Energy 2020, 210, 1–15. [Google Scholar] [CrossRef]
  44. Cirtoaje, V. A Practical Unified Algorithm of P-IMC Type. Processes 2020, 8, 165. [Google Scholar] [CrossRef] [Green Version]
  45. Chien, I.; Fruehauf, P. Consider IMC tuning to improve controller performance. Chem. Eng. Prog. 1990, 86, 33–41. [Google Scholar]
  46. Irshad, M.; Ali, A. A review on PID tuning rules for SOPTD inverse response processes. In Proceedings of the 2017 International Conference on Intelligent Computing, Instrumentation and Control Technologies (ICICICT), Manipal, India, 13–16 September 2017; pp. 17–22. [Google Scholar]
  47. Roffel, B.; Bettlem, B. Process Dynamics and Control. Modeling for Control and Prediction; Wiley: West Sussex, UK, 2006. [Google Scholar]
  48. Alcántara, S.; Pedret, C.; Vilanova, R.; Zhang, W. Analytical Hinf design for a Smith-type inverse-response compensator. In Proceedings of the 2009 American Control Conference, Saint Louis, MO, USA, 10–12 June 2009. [Google Scholar]
  49. Balaguer, P.; Alfaro, V.; Arrieta, O. Second order inverse response process identification from transient step response. ISA Trans. 2011, 50, 231–238. [Google Scholar] [CrossRef]
  50. Sánchez, H.S.; Visioli, A.; Vilanova, R. Optimal Nash tuning rules for robust PID controllers. J. Frankl. Inst. 2017, 354, 3945–3970. [Google Scholar] [CrossRef]
  51. Mehta, U.; Rojas, R. Smith predictor based sliding mode control for a class of unstable processes. Trans. Inst. Meas. Control. 2017, 39, 706–714. [Google Scholar] [CrossRef] [Green Version]
  52. López, R.; Sanjuán, M.E. Tuning equations for cascaded control systems based on the first order plus dead time approach. Symp. Ser. Mechatronics 2004, 1, 223–232. [Google Scholar]
  53. Iglesias, E.J. Using Fuzzy Logic to Enhance Control Performance of Sliding Mode Control and Dynamic Matrix Control. Ph.D. Thesis, University of South Florida, Tampa, FL, USA, 2006. [Google Scholar]
  54. Astrom, K.; Hagglund, T. PID Controllers: Theory, Design and Tuning, 2nd ed.; The Instrumentation, Systems, and Automation Society (ISA): Research Triangle Park, NC, USA, 1995. [Google Scholar]
  55. Box, G.E.; Hunter, J.S.; Hunter, W.G. Statistics for Experimenters. Design, Innovation and Discovery, 2nd ed.; Wiley-Interscience: New York, NY, USA, 2005. [Google Scholar]
  56. Gutiérrez, H.; de la Vara, R. Análisis y Diseño de Experimentos, 3rd ed.; McGraw Hill: New York, NY, USA, 2012. [Google Scholar]
  57. Castellanos, D.; Castrillón, F. New tuning rules for PID controllers based on IMC with minimum IAE for inverse response processes. Dyna 2015, 82, 111–118. [Google Scholar] [CrossRef]
  58. Montgomery, D.C.; Runger, G.C.; Hubele, N.F. Engineering Statistics, 5th ed.; Wiley: New York, NY, USA, 2011. [Google Scholar]
  59. O’Dwyer, A. Handbook of PI and PID Controller Tuning Rules, 2nd ed.; Imperial College Press: London, UK, 2006. [Google Scholar]
  60. Pedret, C.; Alcántara, S.; Vilanova, R.; Ibeas, A. Observer-Controller Design for a Class of Stable/Unstable Inverse Response Processes. Ind. Eng. Chem. Res. 2009, 48, 10986–10993. [Google Scholar] [CrossRef]
  61. Kaya, I. PI-PD controllers for controlling stable processes with inverse response and dead time. Electr. Eng. 2016, 98, 55–65. [Google Scholar] [CrossRef]
  62. Amoura, K.; Mansouri, R.; Bettayeb, M.; Al-Saggaf, U.M. Closed-loop step response for tuning PID-fractional-order-filter controllers. ISA Trans. 2016, 64, 247–257. [Google Scholar] [CrossRef]
  63. Díaz-Rodríguez, I.D.; Han, S.; Keel, L.; Bhattacharyya, S. Advanced Tuning for Ziegler-Nichols Plants. IFAC PapersOnLine 2017, 50, 1805–1810. [Google Scholar] [CrossRef]
  64. Dincel, E.; Soylemez, M.T. Digital PI-PD controller design for arbitrary order systems: Dominant pole placement approach. ISA Trans. 2018, 79, 189–201. [Google Scholar] [CrossRef]
  65. Visioli, A. Improving the load disturbance rejection performances of IMC-tuned PID controllers. IFAC Proc. Vol. 2002, 35, 295–300. [Google Scholar] [CrossRef] [Green Version]
  66. Shinskey, F. PID-Deadtime Control of Distributed Processes. IFAC Proc. Vol. 2000, 33, 13–17. [Google Scholar] [CrossRef]
  67. Arbogast, J.E.; Beauregard, B.M.; Cooper, D.J. Intuitive robust stability metric for PID control of self-regulating processes. ISA Trans. 2008, 47, 420–428. [Google Scholar] [CrossRef]
  68. Corripio, A.B.; Newell, M. Tuning of Industrial Control Systems, 3rd ed.; ISA: Research Triangle Park, NC, USA, 2015. [Google Scholar]
Figure 1. Internal Model Control.
Processes 08 01183 g001
Figure 2. Behavior of τ ^ c O F for different values of τ ^ c u l t , using different values of γ . The range of τ ^ c u l t was selected arbitrarily for illustration purposes.
Processes 08 01183 g002
Figure 3. Behavior of m O F with respect to variations in γ . %TO: percentage of transmitter output, %CO: percentage of controller output, UT: units of time.
Processes 08 01183 g003
Figure 4. CCV PID tuning methodology.
Processes 08 01183 g004
Figure 5. Time response disturbance rejection for the set P 4 . %TO: percentage of transmitter output, UT: units of time.
Processes 08 01183 g005
Figure 6. Time response set-point tracking for the set P 4 . %TO: percentage of transmitter output, UT: units of time.
Processes 08 01183 g006
Table 1. Statistics for the objective function O F γ | i (linear regressions in Figure 2).
OF γ | i R (Fraction) R 2 (%) Durbin-Watson (Nondimensional)
O F γ | 0 0.996599.312.16
O F γ | 1 0.991898.362.02
O F γ | 2 0.987297.462.19
O F γ | 3 0.985797.152.42
O F γ | 4 0.986597.332.47
Table 2. Statistics for m O F ( γ ) (nonlinear regression of Figure 3).
R (Fraction) R 2 (%)
m O F ( γ ) 0.999499.89
Table 3. Simulation parameters sets for performance and robustness analysis.
Parameters τ ^ 2 η ^ θ ^
P 1 0.26223.20950.2107
P 2 0.50002.05000.0100
P 3 0.50002.05001.0000
P 4 0.50004.00000.5050
P 5 0.73783.20950.7993
Table 4. Controller parameters for sets P 1 , P 2 , P 3 , P 4 , P 5 .
SetCCVWNZNCCCC
K c k T ^ i T ^ d K c k T ^ i T ^ d K c k T ^ i T ^ d K c k T ^ i T d
P 1 0.1661.3450.2780.1971.2620.2080.2301.9560.4890.1911.0000.262
P 2 0.2561.5030.3360.3661.5000.3330.4171.7390.4350.3481.0000.500
P 3 0.2101.7470.5330.3661.5000.3330.4103.5000.8740.1631.0000.500
P 4 0.1281.6560.4580.1881.5000.3330.2252.9730.7430.1311.0000.500
P 5 0.1501.9360.5800.2711.7380.4250.3153.6950.9240.1331.0000.738
Table 5. Performance indexes. Disturbance rejection for the set P 4 .
Method ISE a IAE b IMV c MP d
CCV19.970019.34001.97801.9049
WN22.450015.01003.04502.0593
ZN38.960023.10007.84903.6781
CCCC23.400014.70002.35702.1652
a ( % TO ) 2 · UT ; b % TO · UT ; c % CO ; d % TO .
Table 6. Scores. Disturbance rejection for the set P 4 .
Method ISE IAE IMV MP Total
CCV424414
WN332311
ZN11114
CCCC243211
All units are points.
Table 7. Performance indexes. Set-point tracking for the set P 4 .
Method ISE a IAE b IMV c MP d
CCV9.650013.00000.81400.9957
WN8,72308.000010.75001.0000
ZN11,460013.08004.69601.0581
CCCC8.96007.64901.20301.0048
a ( % TO ) 2 · UT ; b % TO · UT ; c % CO ; d % TO .
Table 8. Scores. Set-point tracking for the set P 4 .
Method ISE IAE IMV MP Total
CCV224412
WN43119
ZN11226
CCCC343313
All units are points.
Table 9. Total scores for disturbance rejection for the set P 4 .
Method ISE IAE IMV MP Total
CCV179191762
WN1416121557
ZN665623
CCCC1319141258
All units are points.
Table 10. Total scores for set-point tracking for the set P 4 .
Method ISE IAE IMV MP Total
CCV128201757
WN191661455
ZN679830
CCCC1319151158
All units are points.
Table 11. Robustness for sets P 1 , P 2 , P 3 , P 4 , P 5 .
MethodSet P 1 Set P 2 Set P 3 Set P 4 Set P 5
η ^ θ ^ η ^ θ ^ η ^ θ ^ η ^ θ ^ η ^ θ ^
CCV5.97109.03103.89506.83005.314011.66508.789016.60508.295018.0600
WN6.30605.80404.00003.69003.58603.69007.75207.23506.01805.8100
ZN3.80500.74002.75603.80002.09301.04604.86401.15304.05501.7000
CCCC5.09503.67205.56507.00005.55907.00007.30406.44807.06507.5700