Preparation and Characterization of New Electrically Conductive Composites Based on Expanded Graphite with Potential Use as Remote Environmental Detectors


Abstract
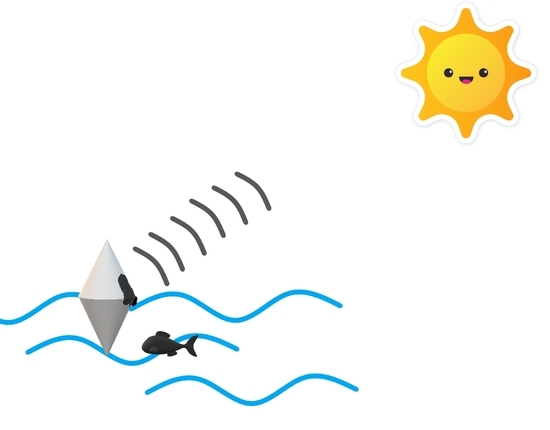
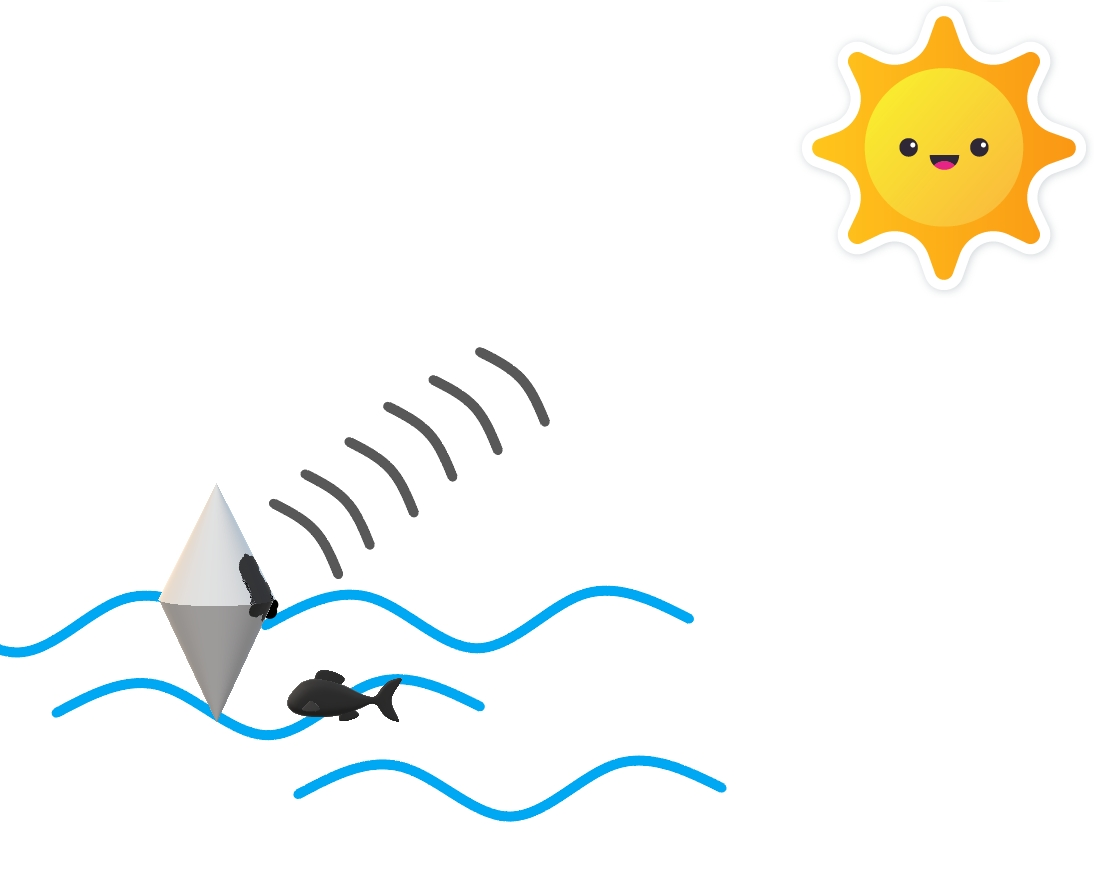
1. Introduction
2. Materials and Methods
2.1. Materials
2.2. Methods
2.2.1. Polymer Composite Preparation
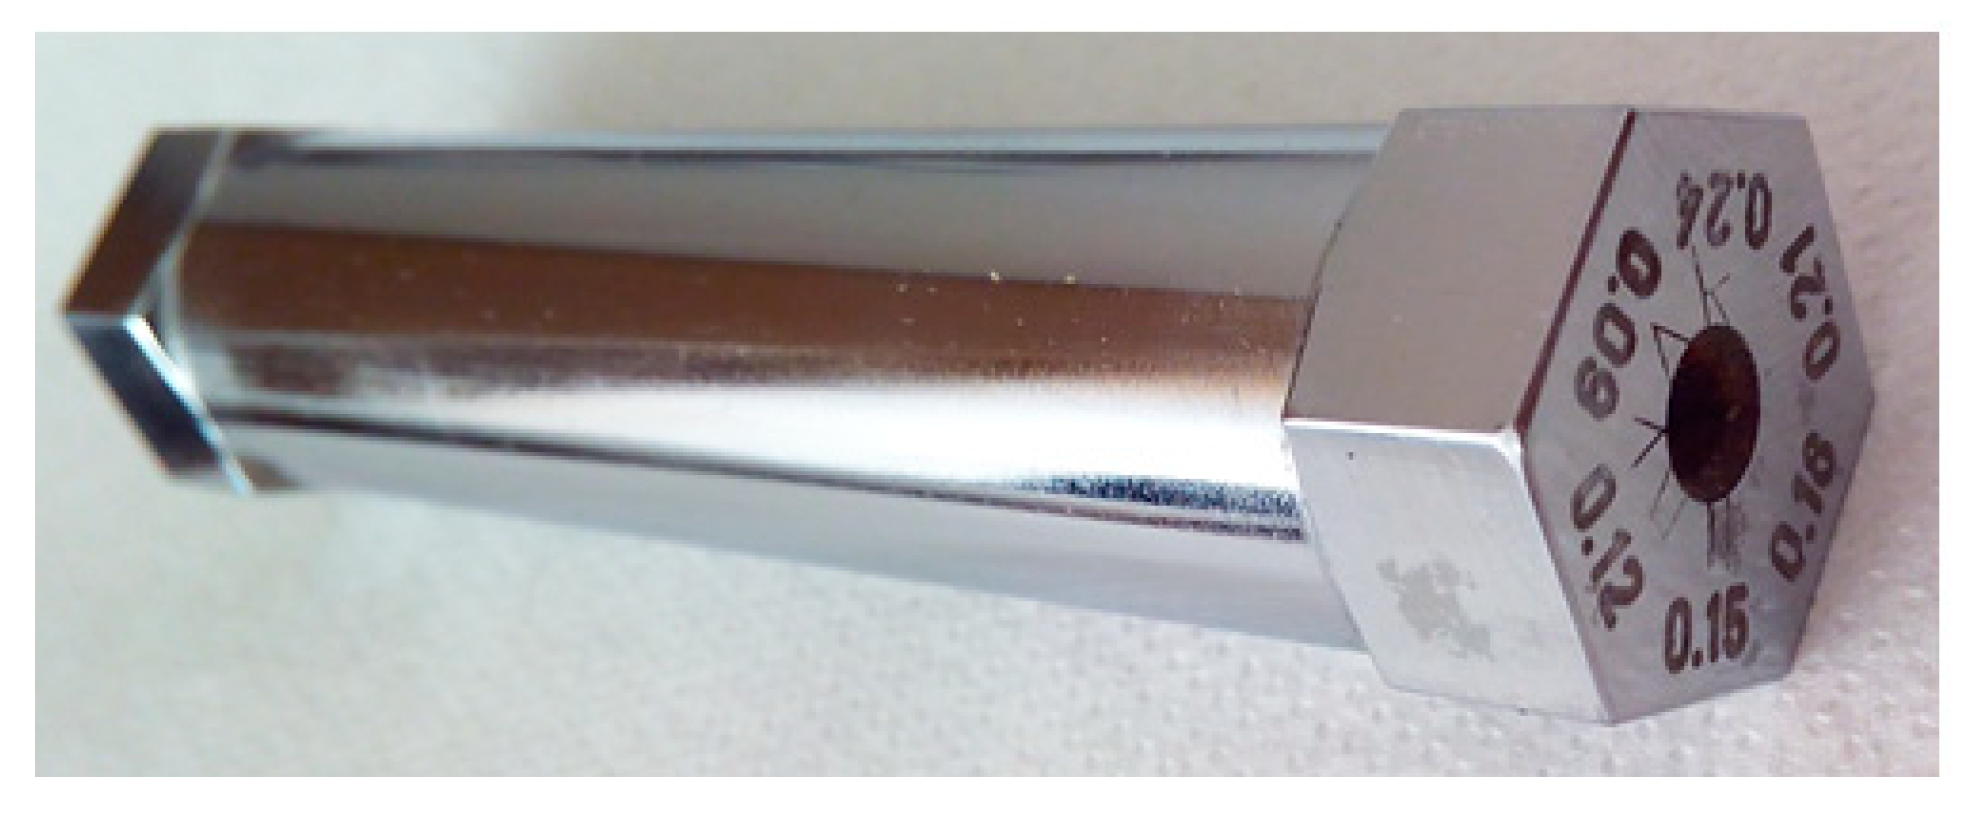
2.2.2. Composite Film Thickness Measurements
2.2.3. Detector Response Measurements
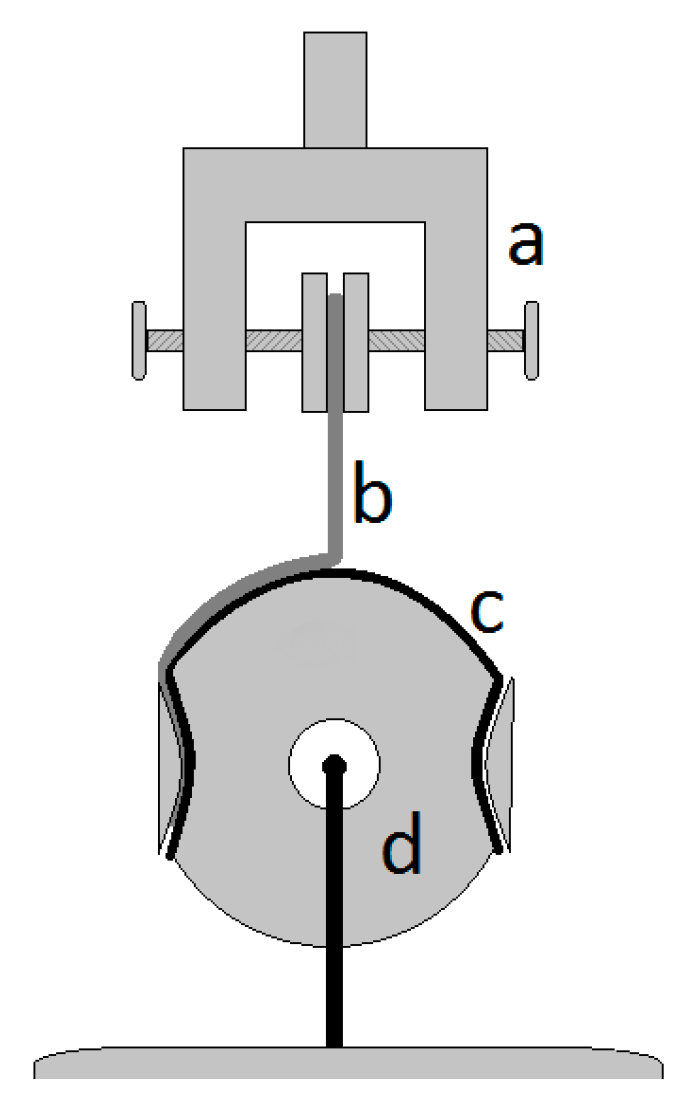
2.2.4. Peel Test Sample Preparation
2.2.5. Peel Tests
3. Results and Discussion
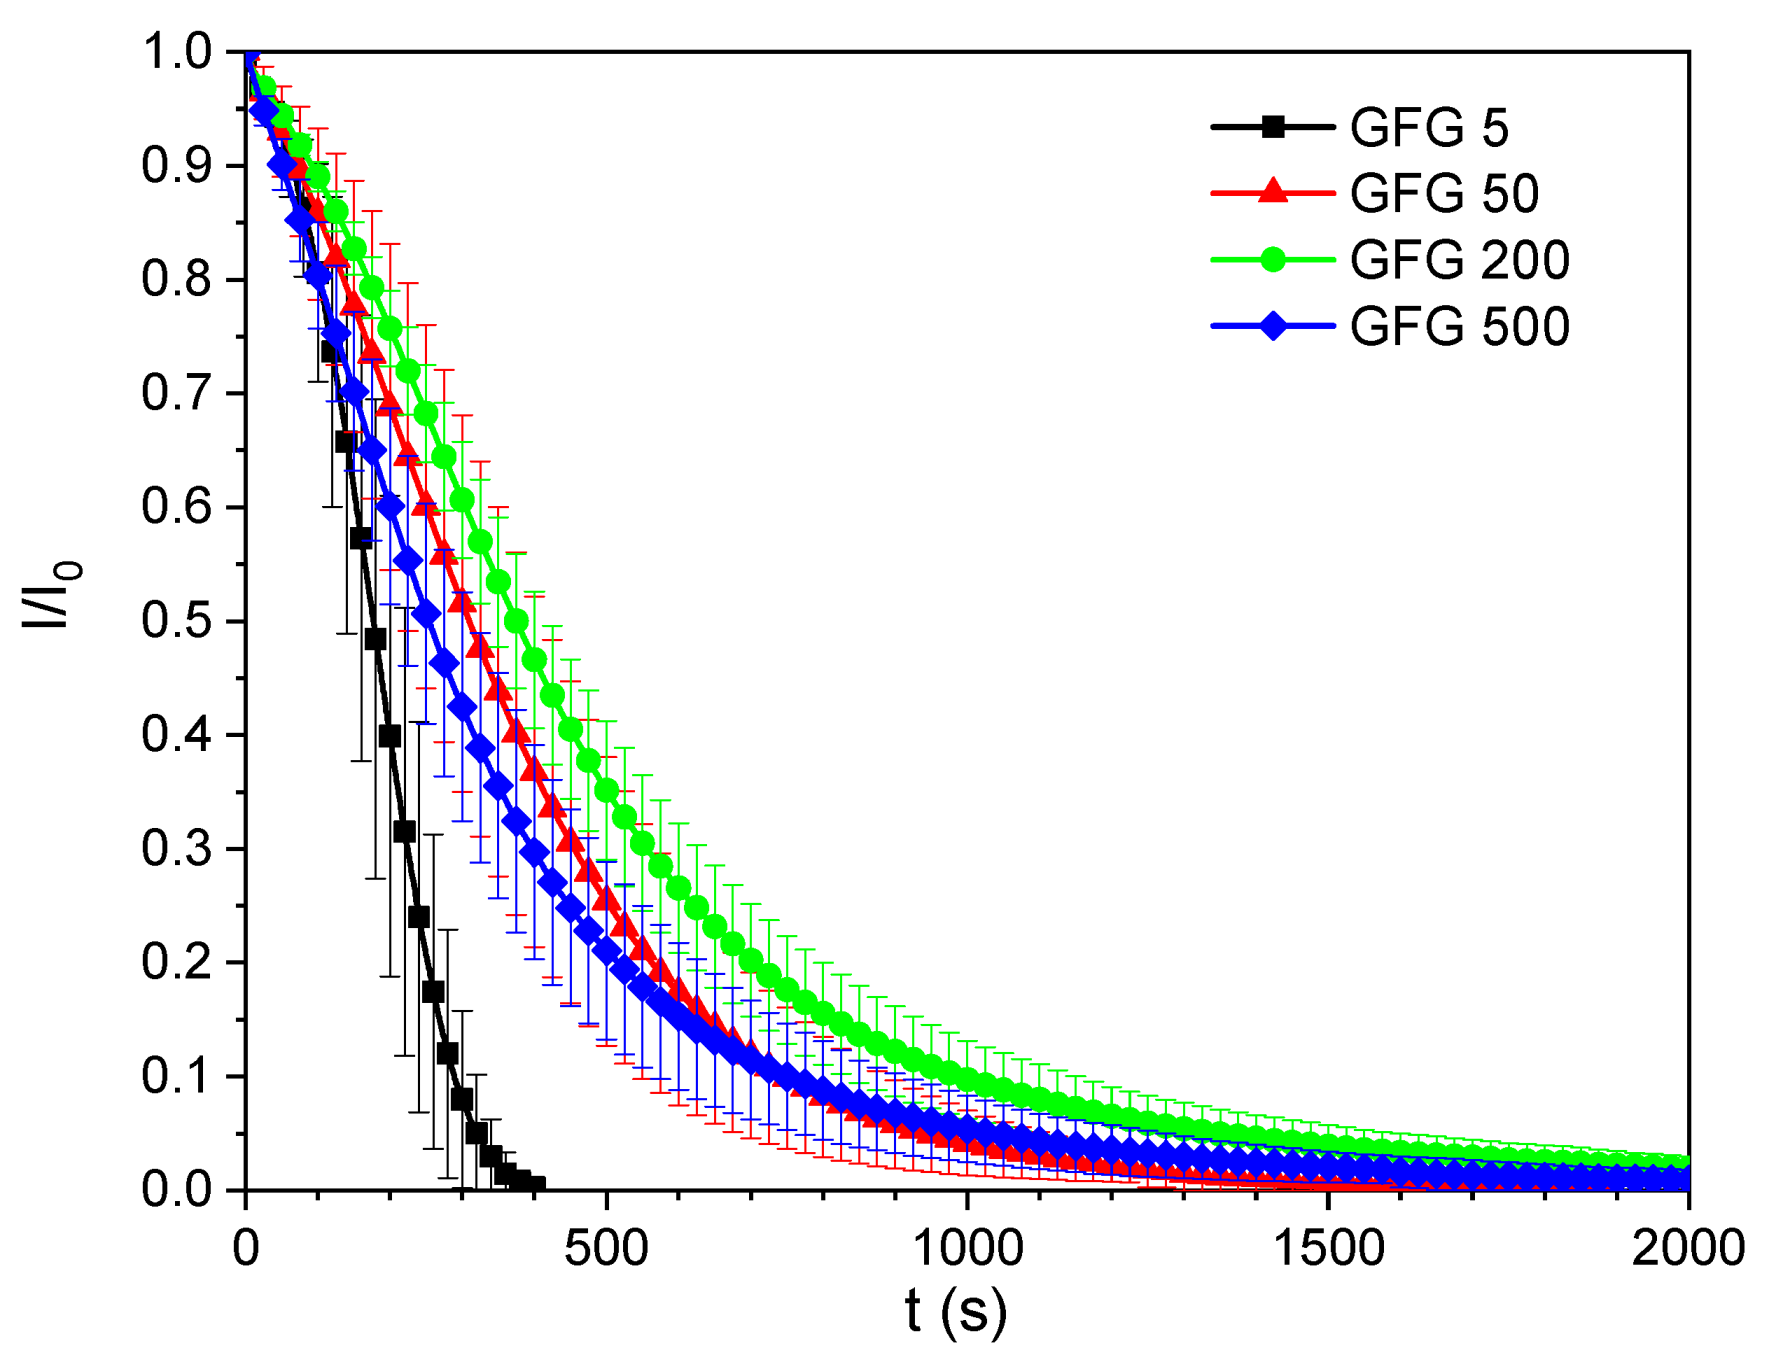
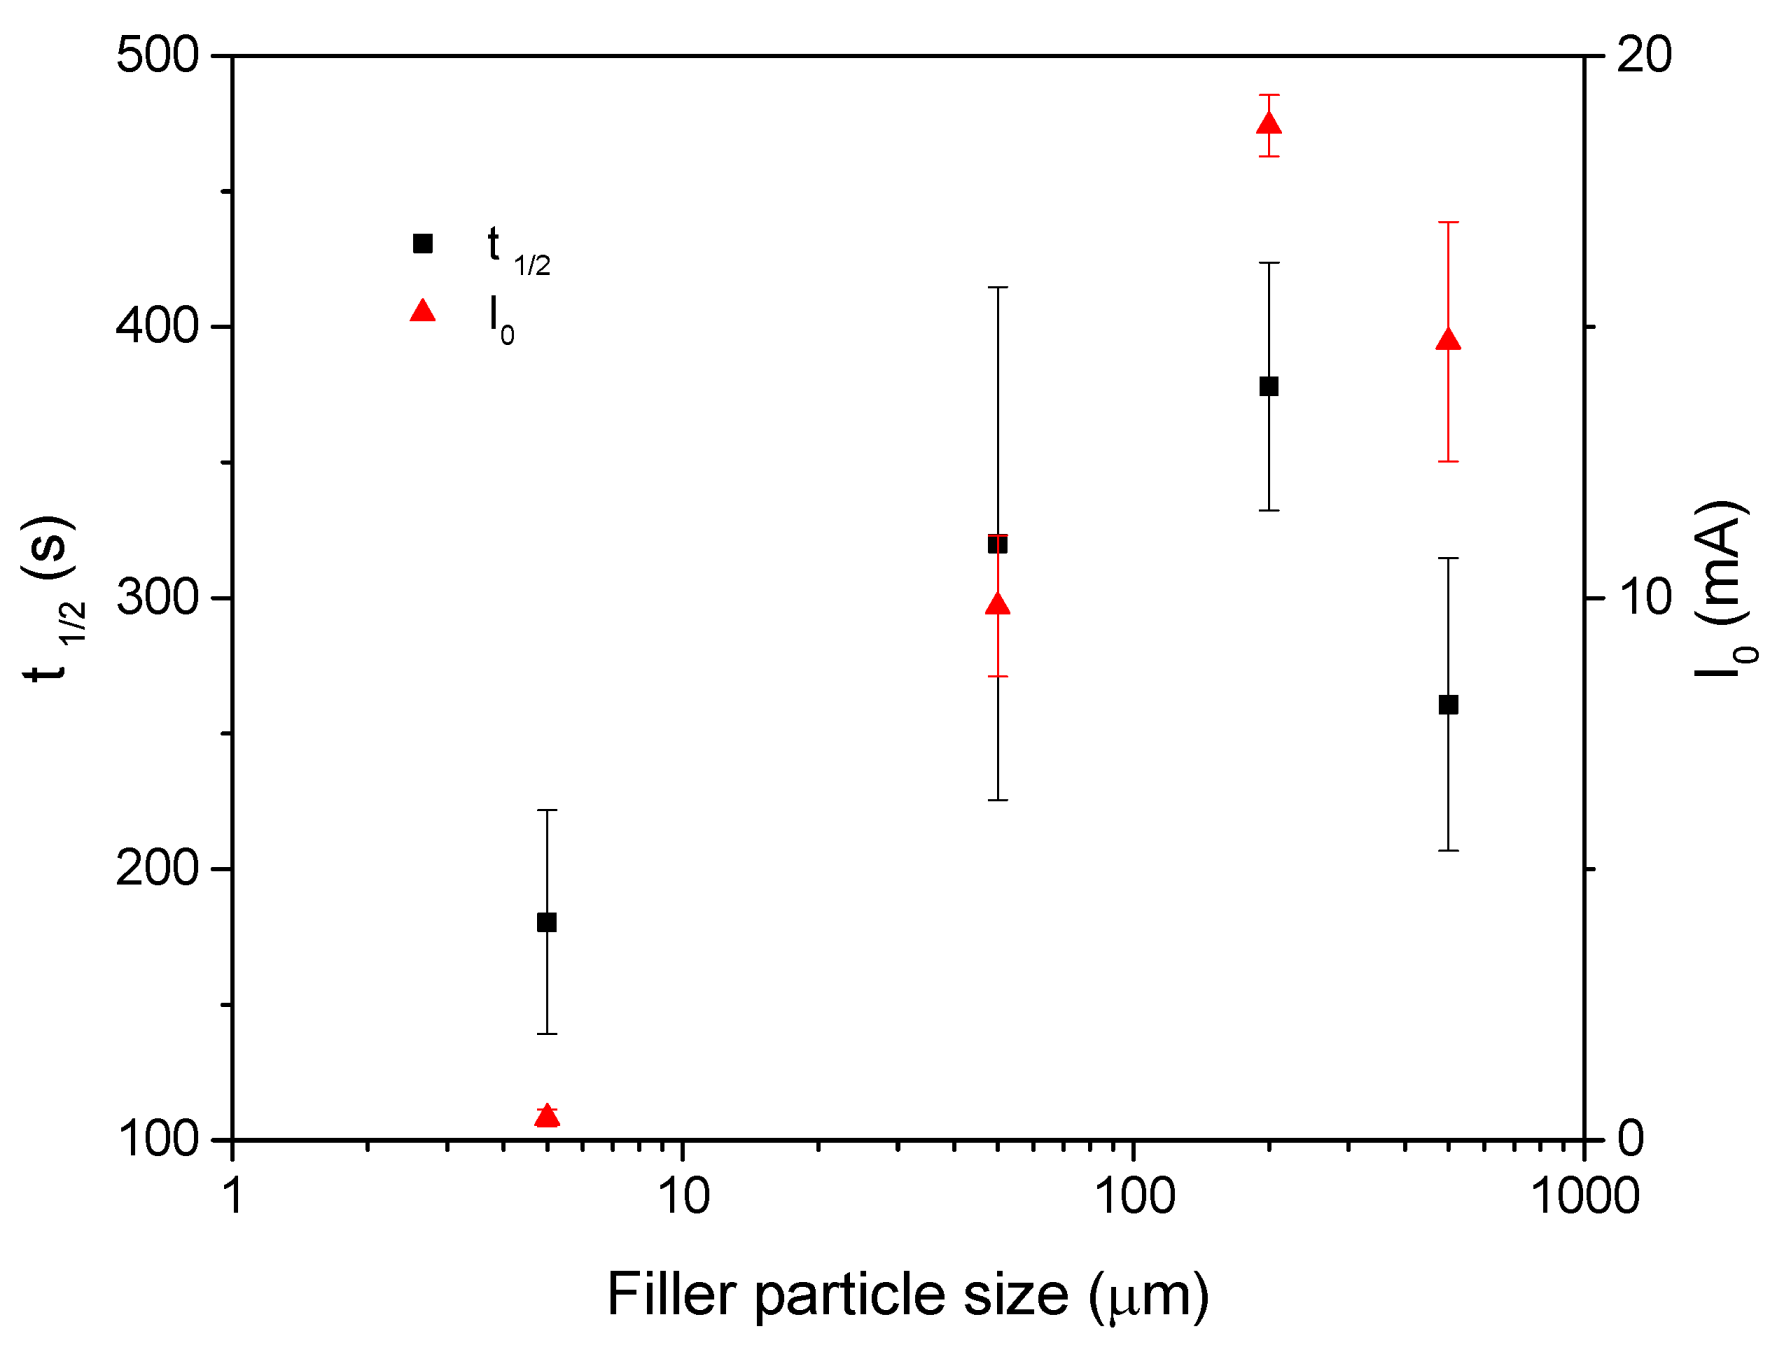
3.1. Particle Size
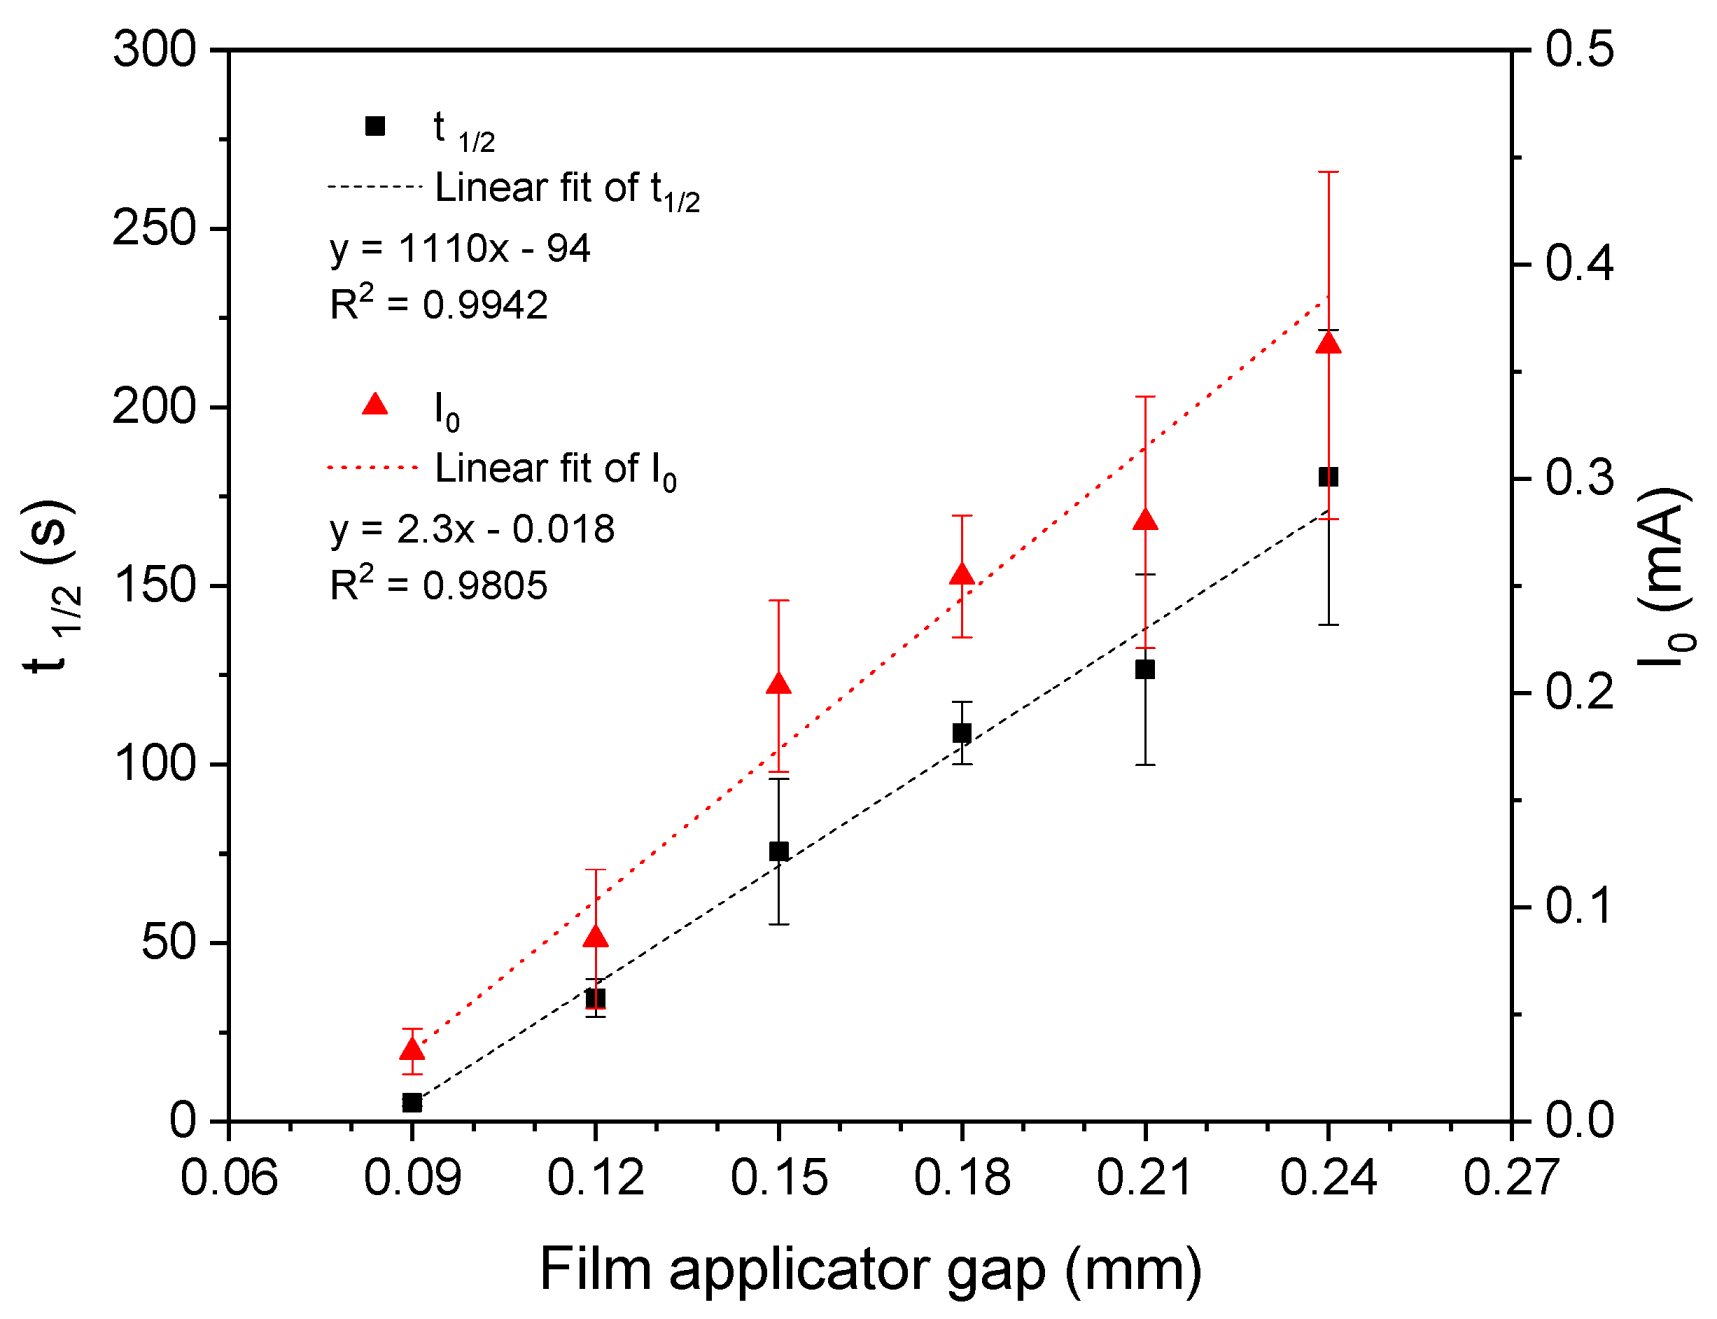
3.2. Film Thickness
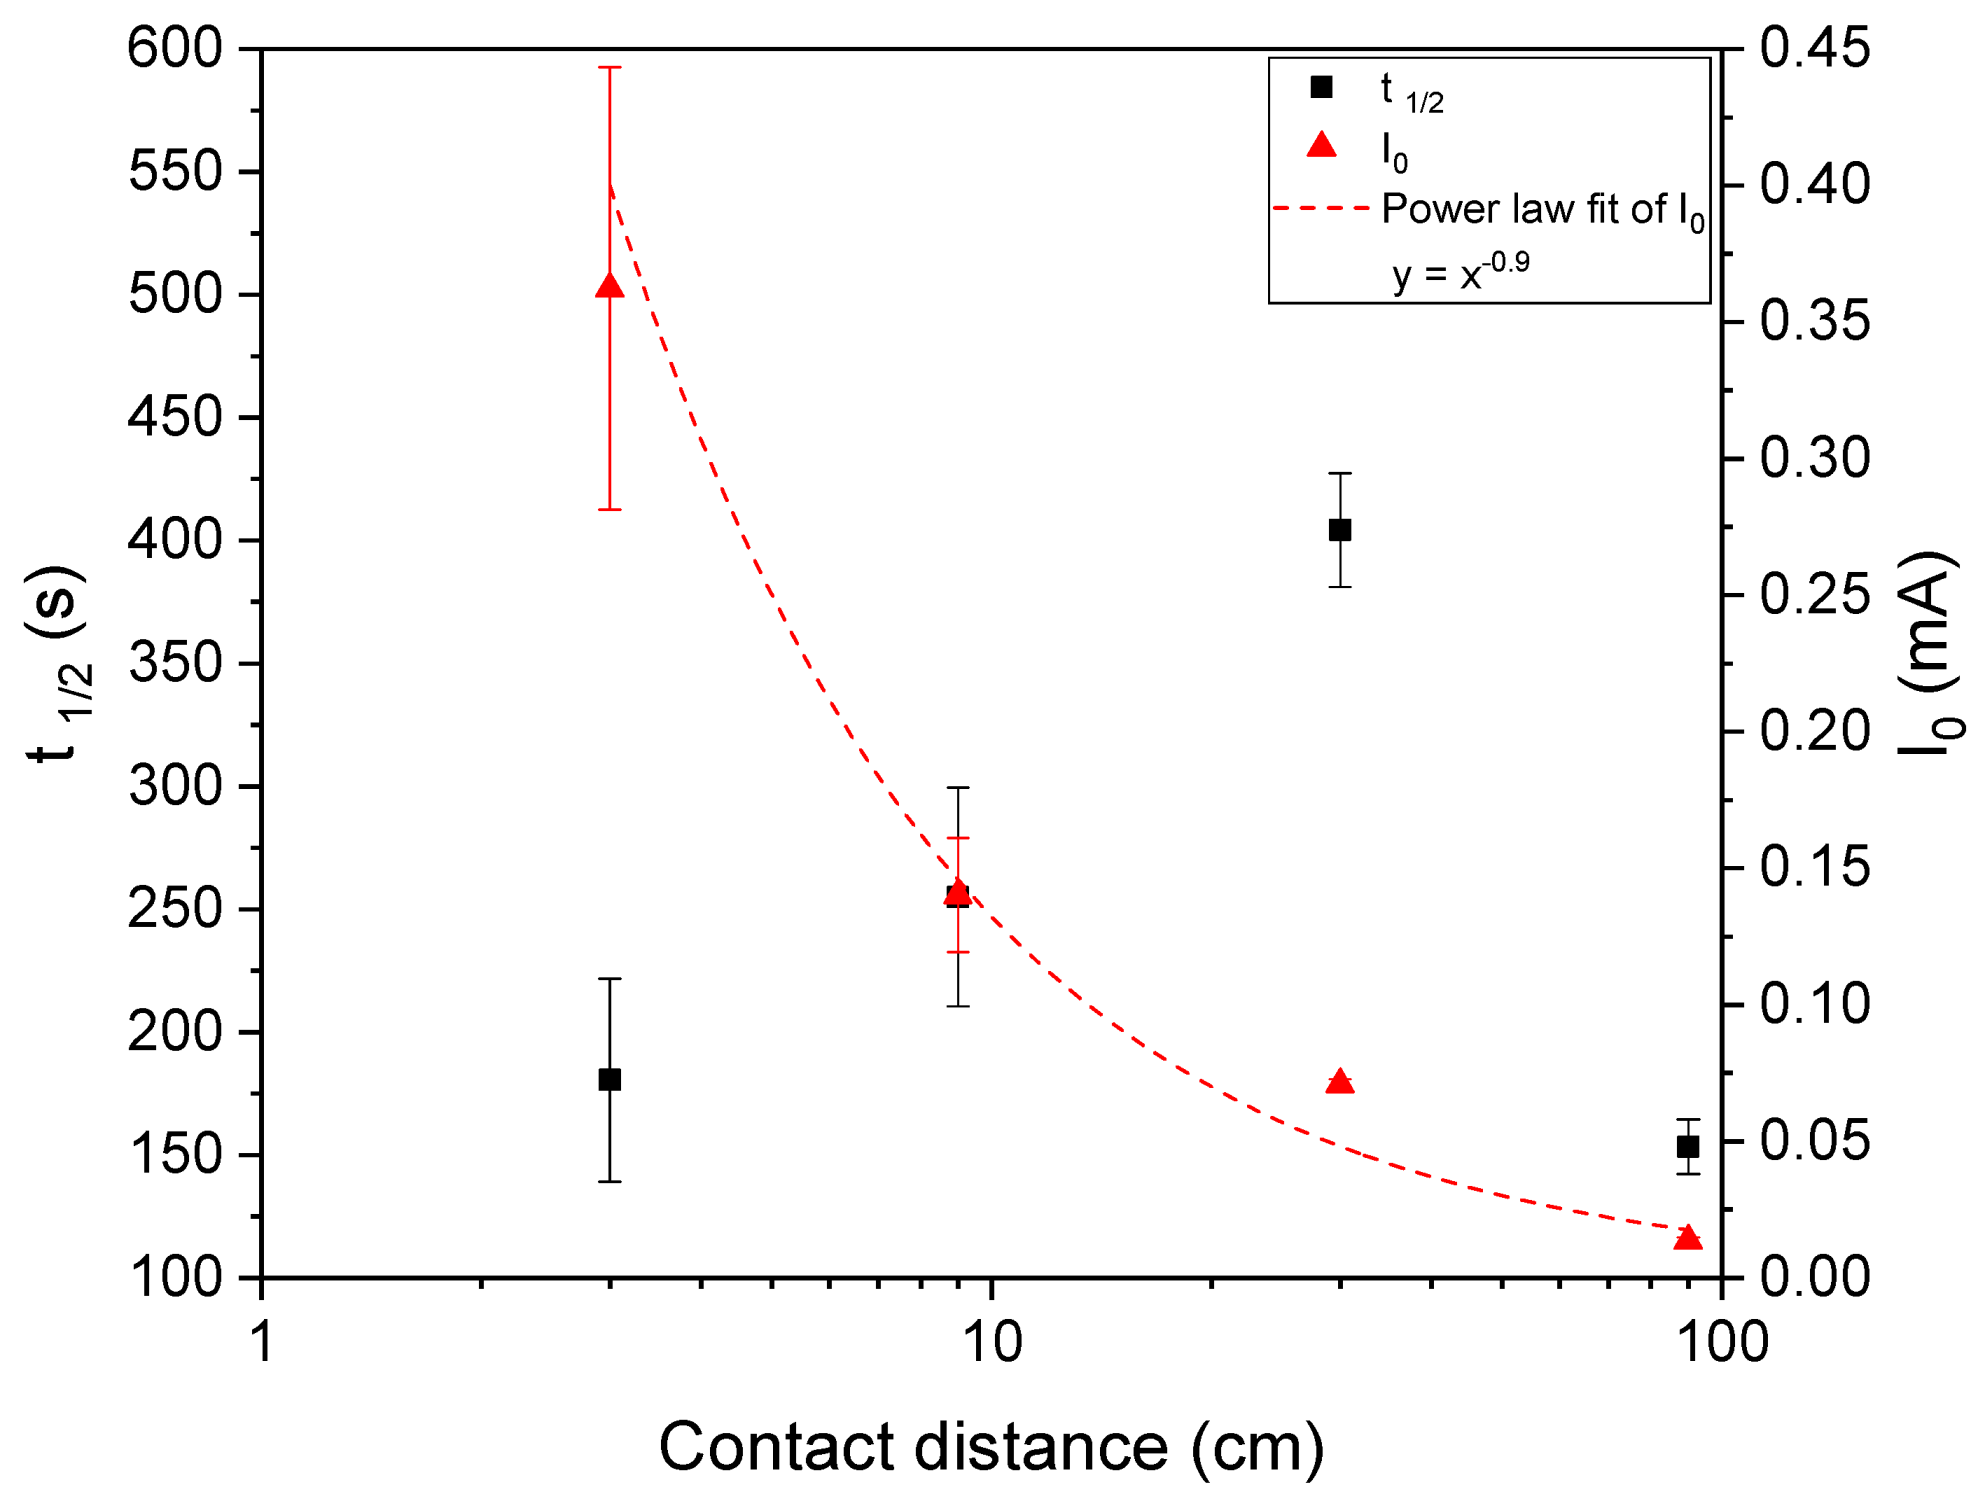
3.3. Detector Length
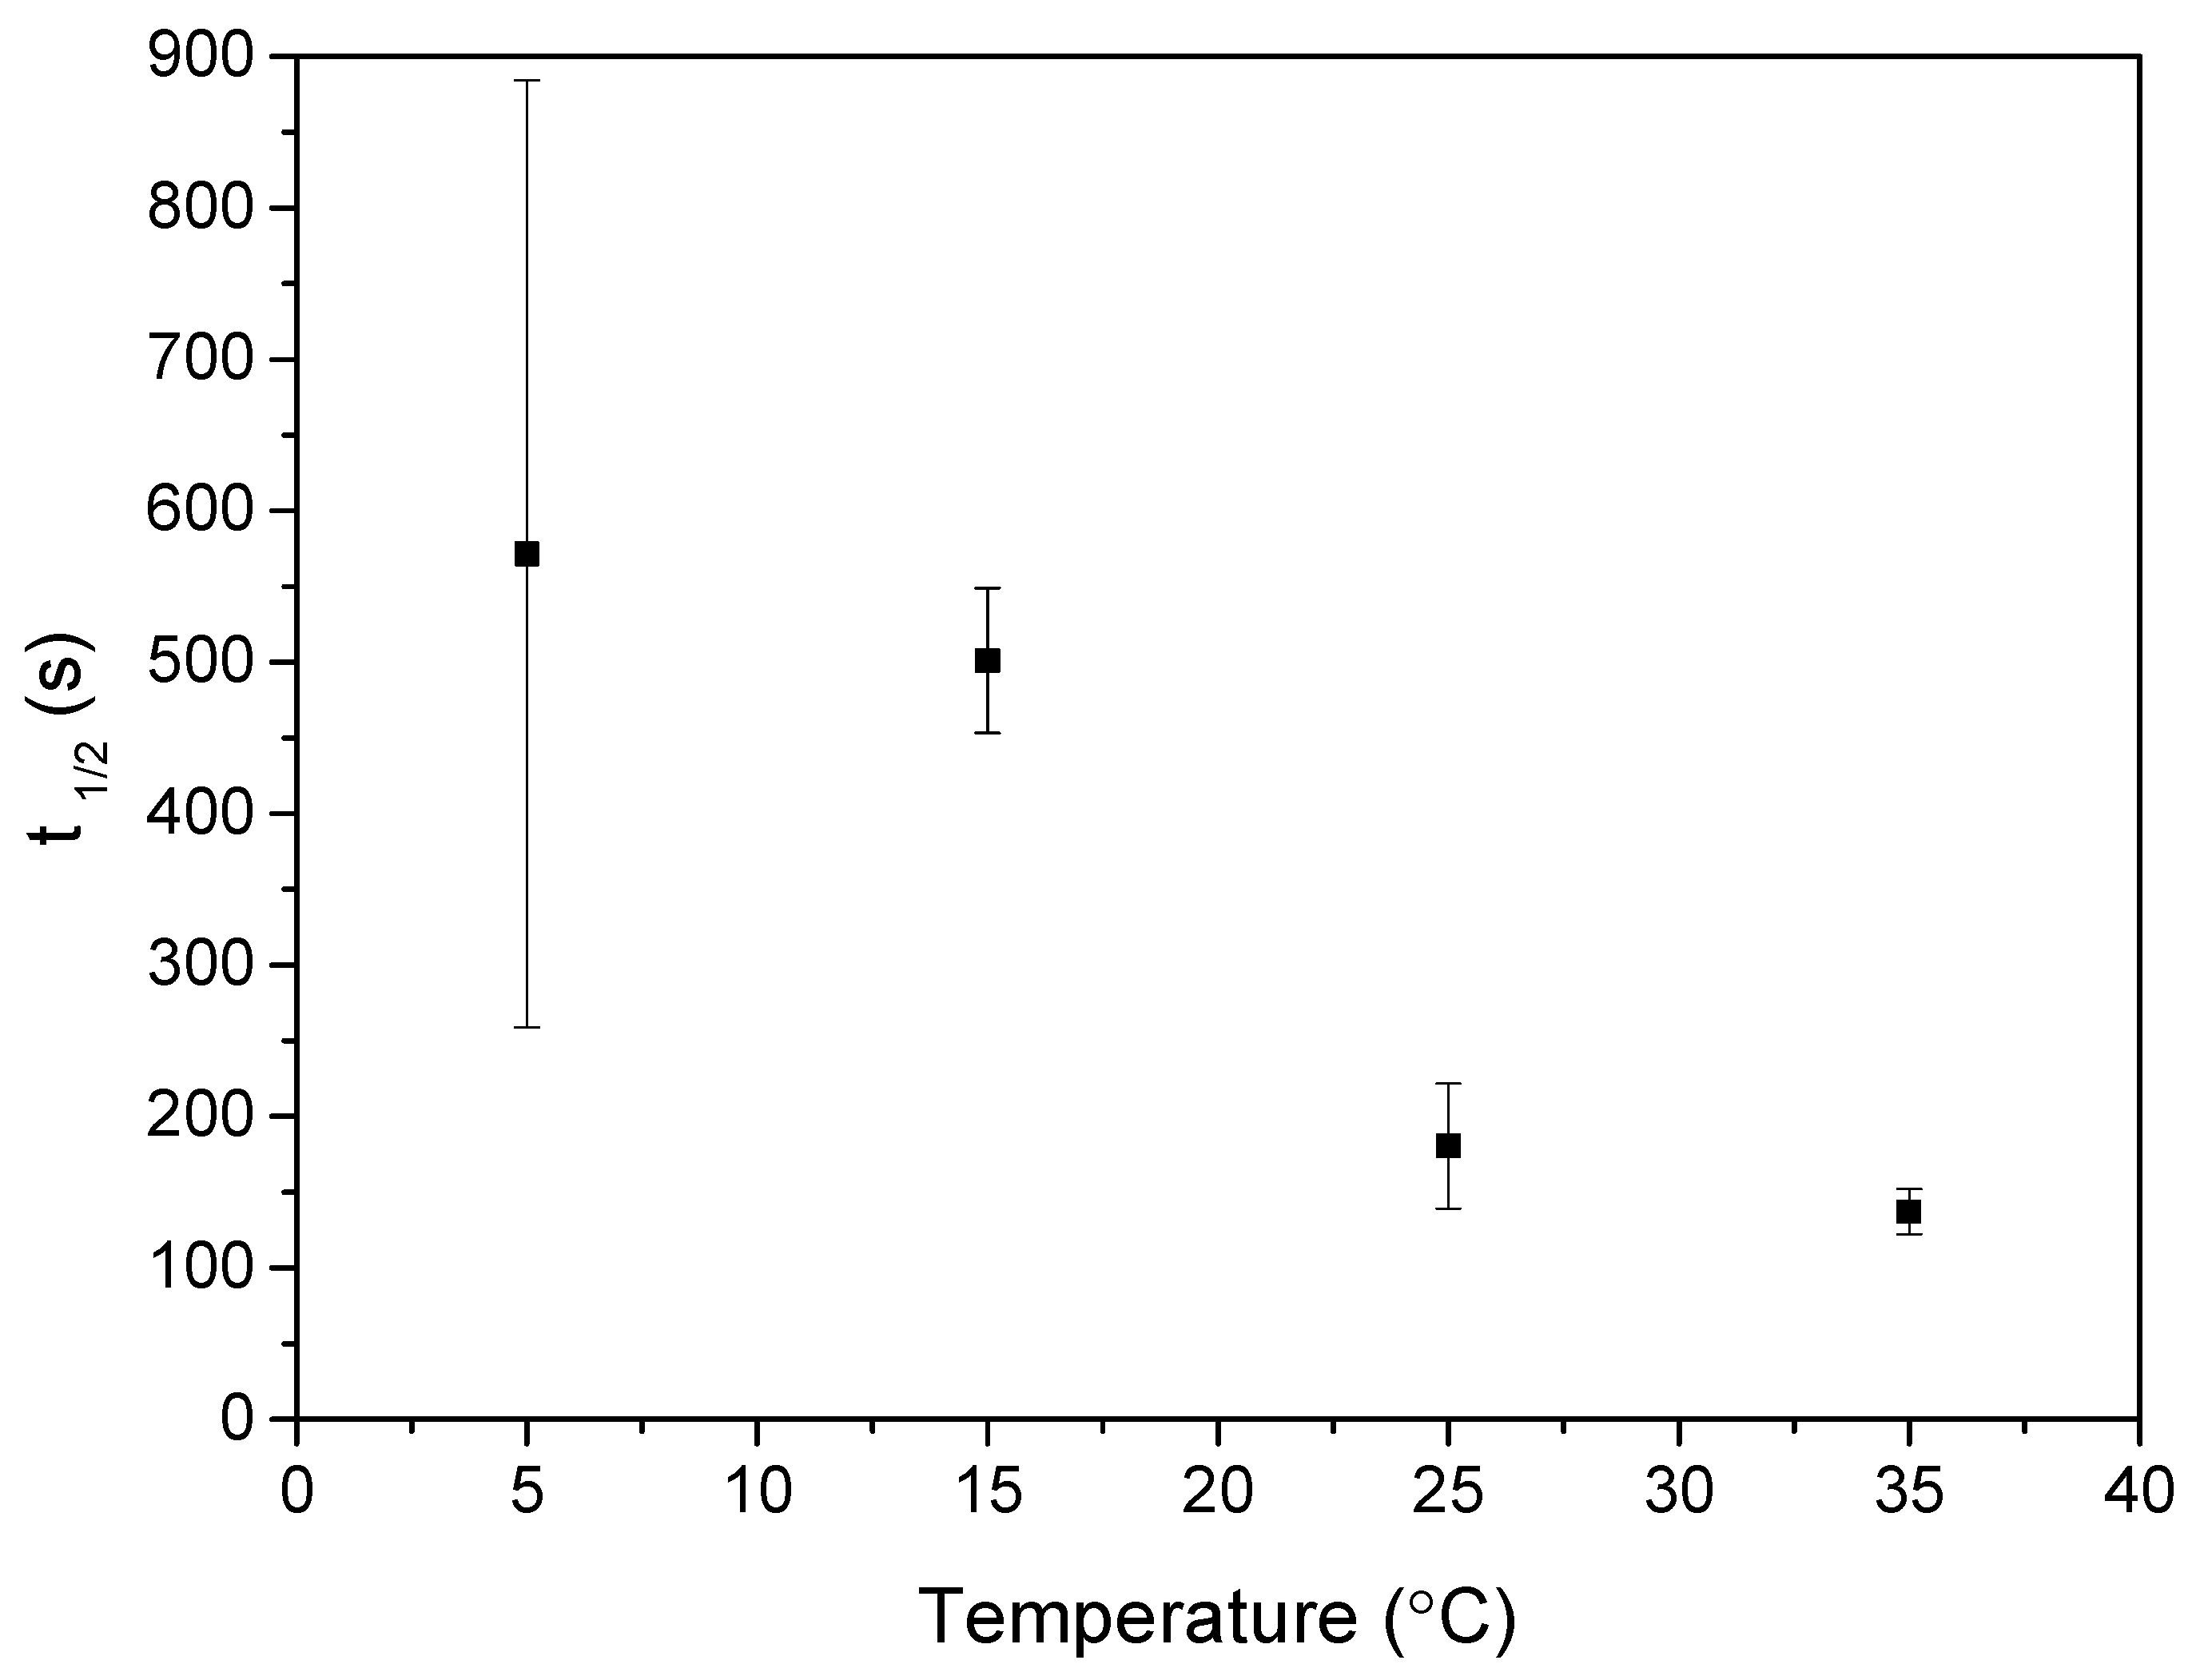
3.4. Temperature
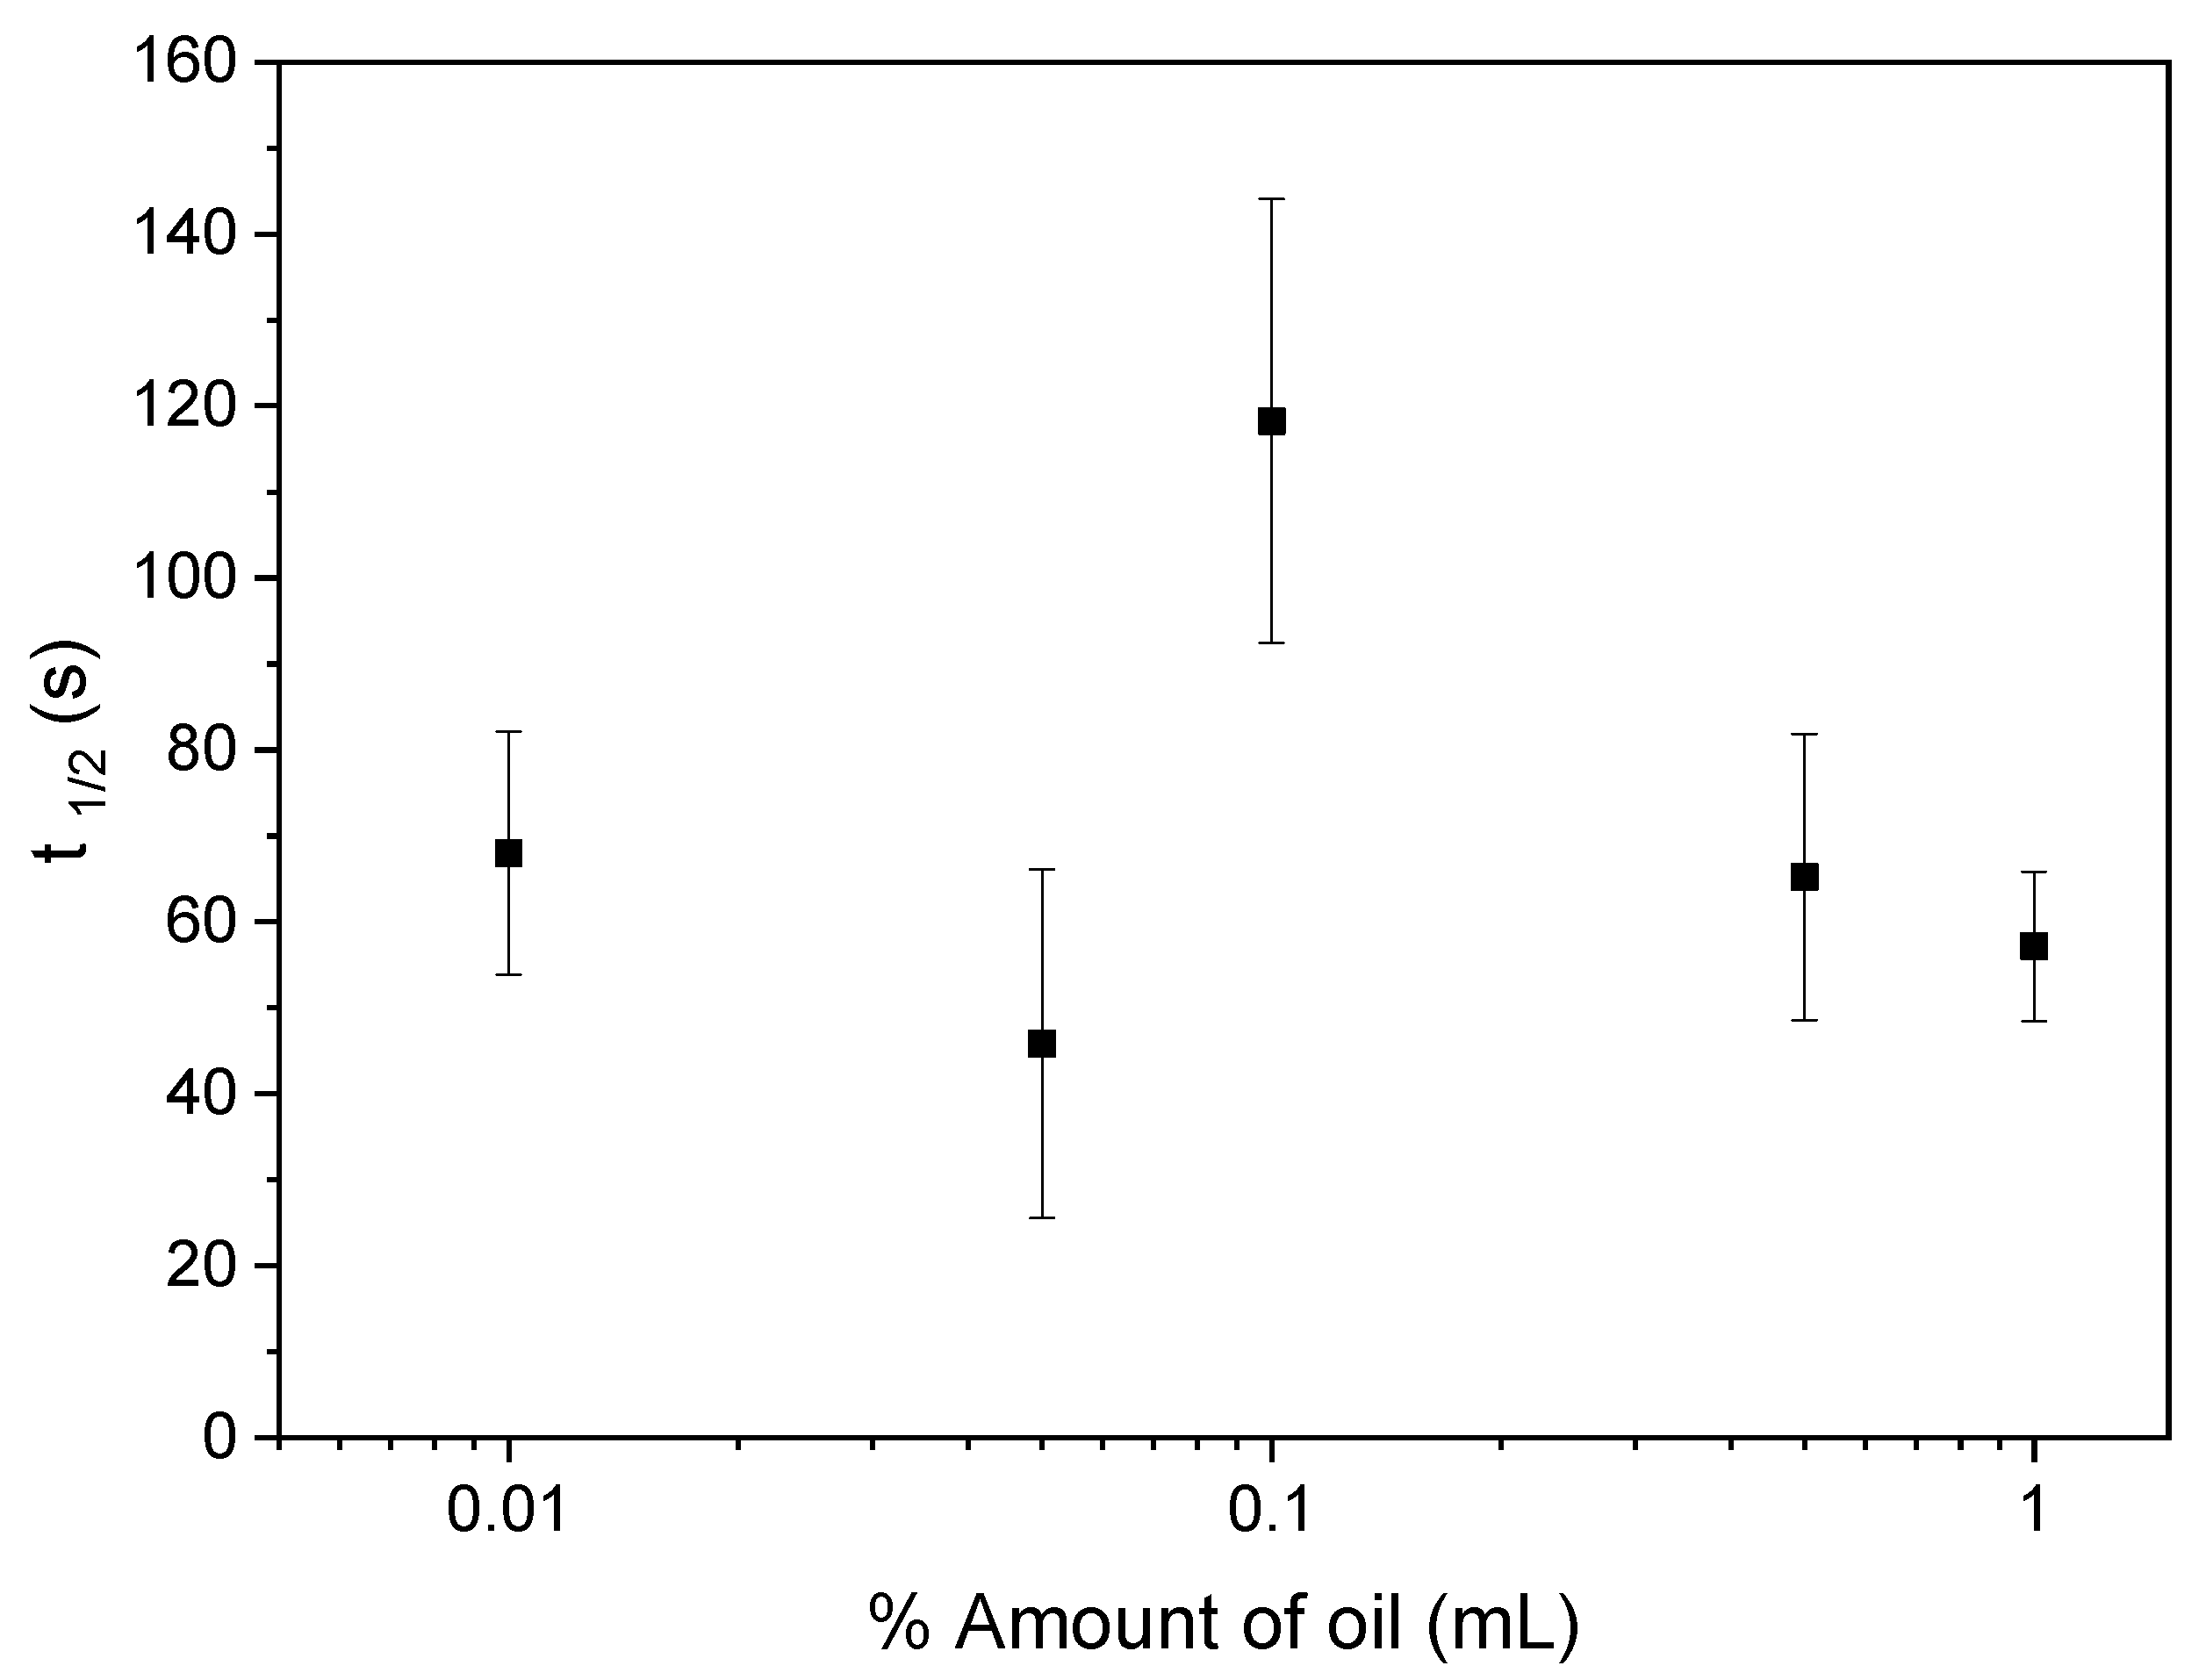
3.5. Amount of Oil
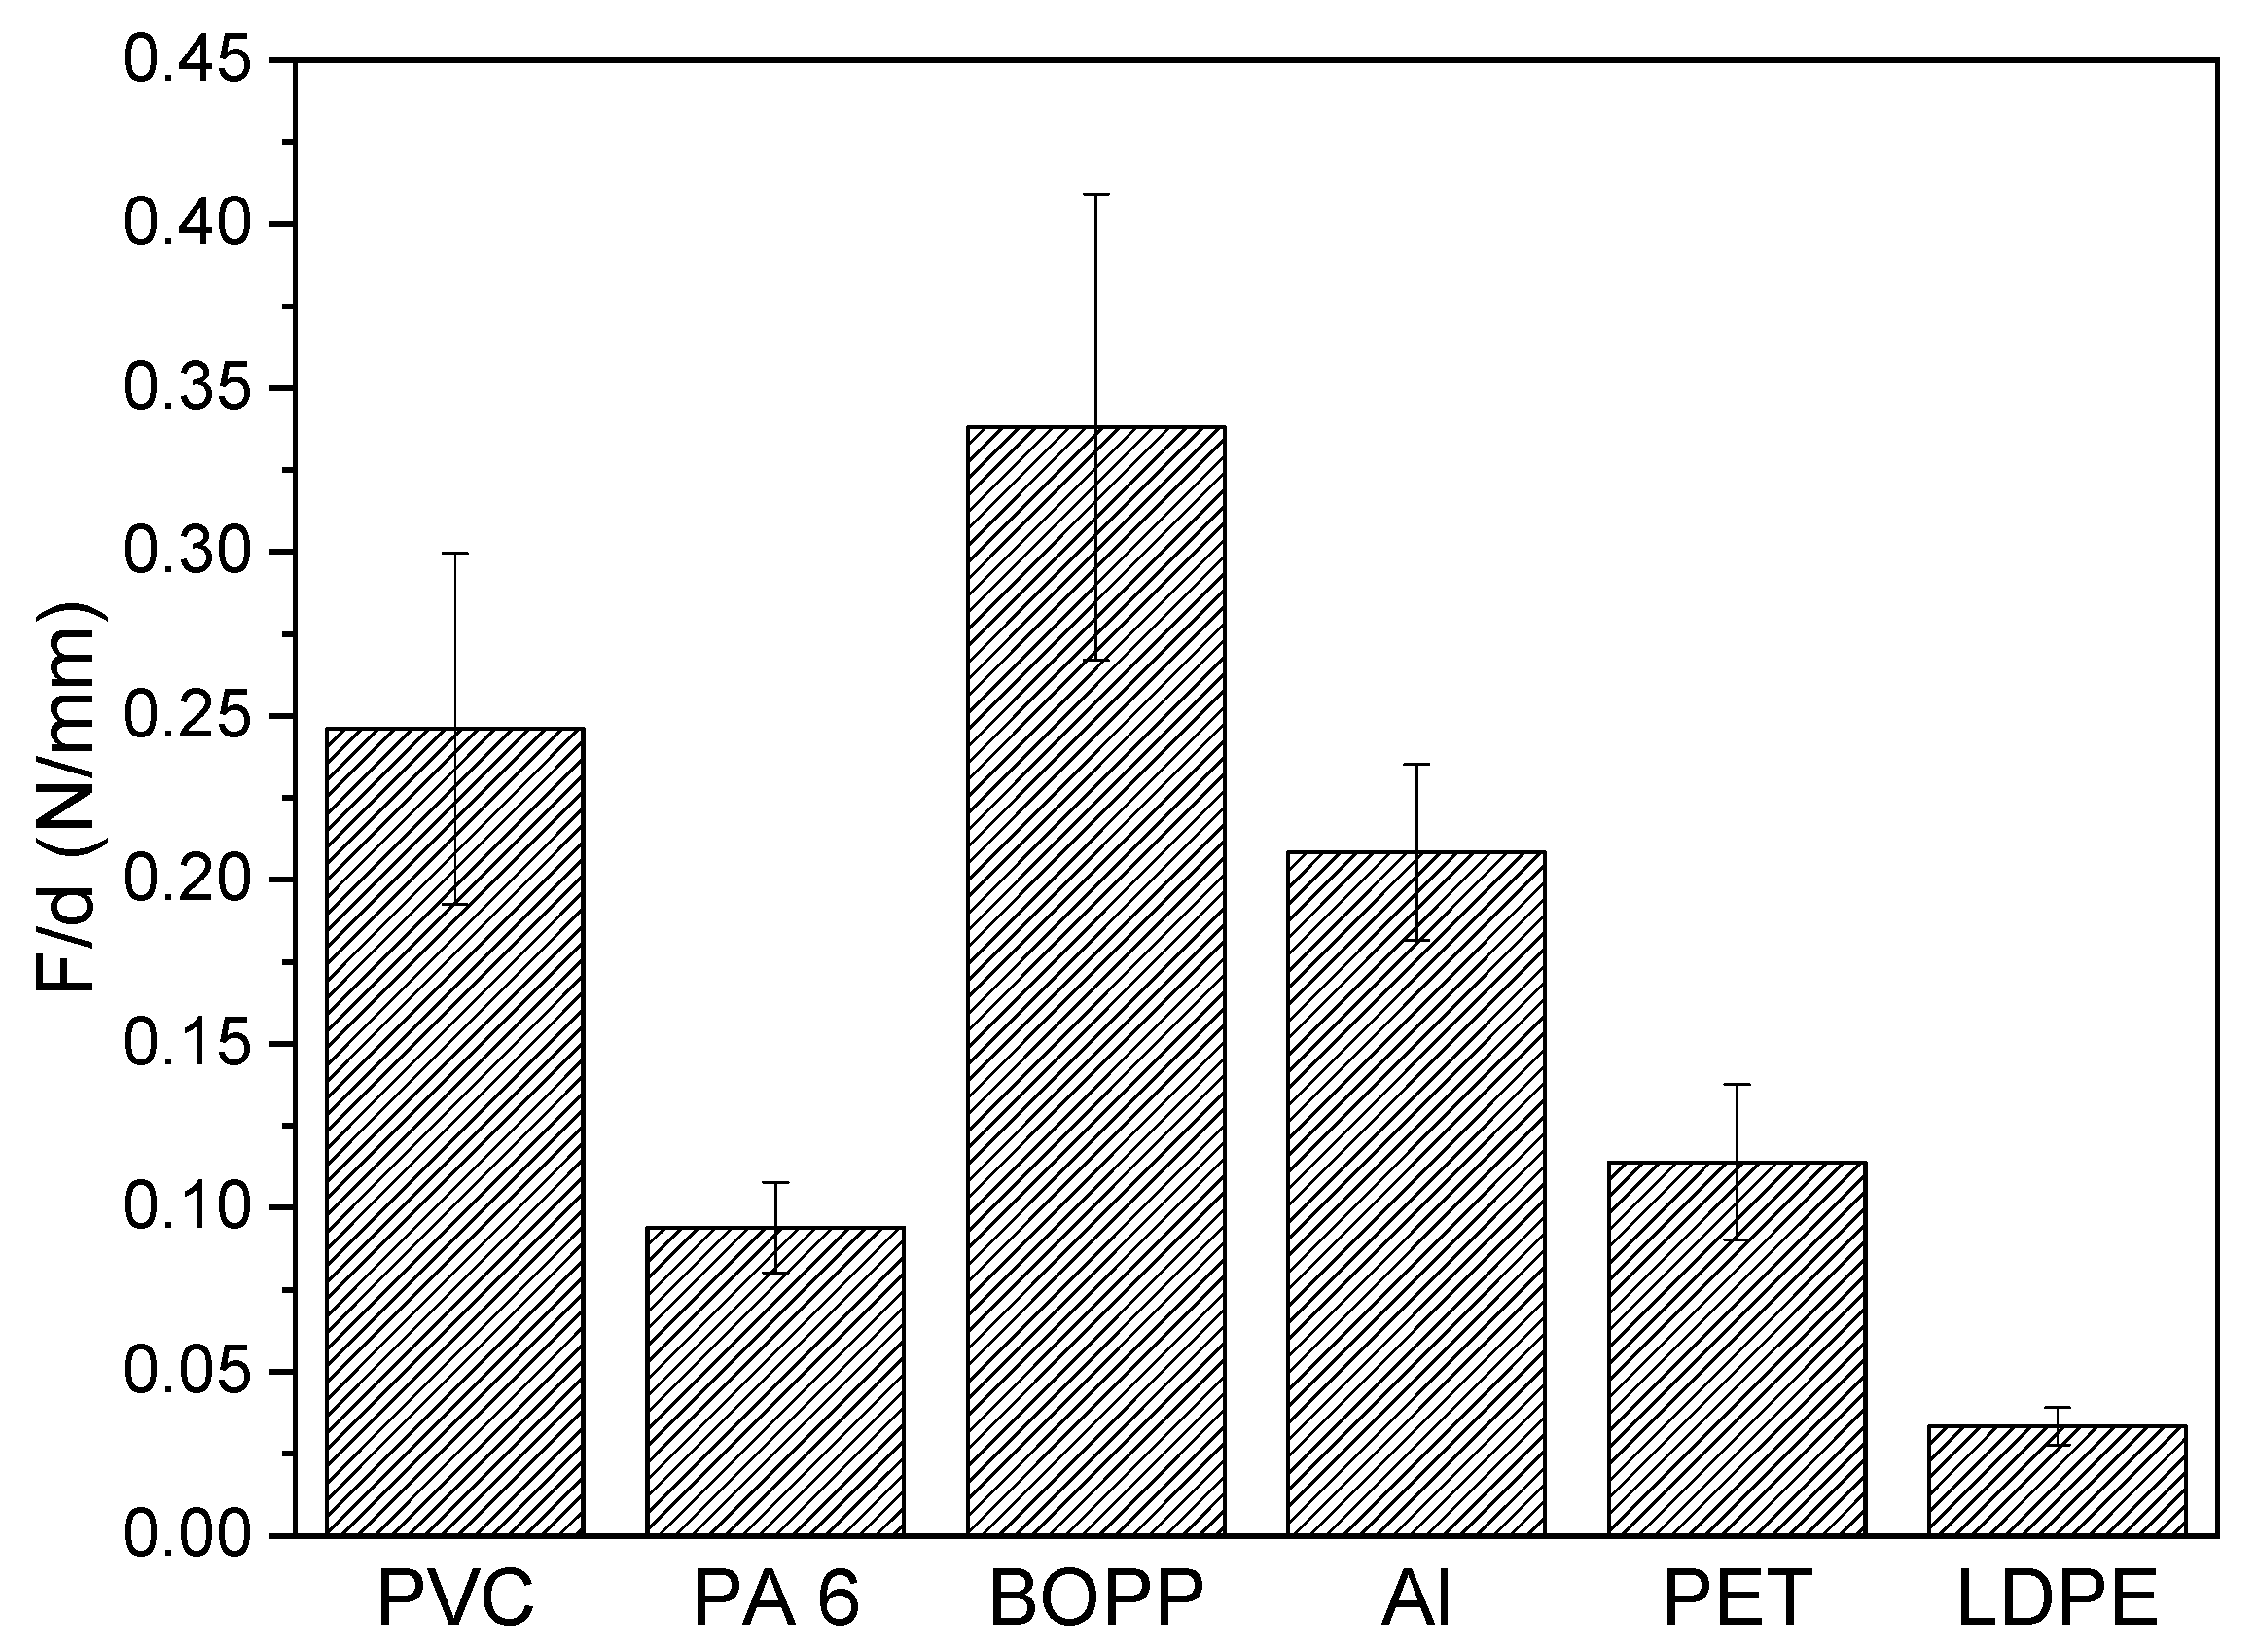
3.6. Peel Tests
4. Conclusions
- The influence of the filler particle size was studied with the best performance observed for the detector system with the smallest particle size.
- Investigating samples with different film thickness, ranging from 16 to 39 μm, showed that increasing the layer thickness led to a decrease in the detector response rate. However, the electric current drops with decreasing detector thickness, and for thinner samples, the electric current was significantly influenced by the presence of noise. Therefore, it is necessary, for practical applications, to find an optimal balance between the value of the electric current and the detector response rate.
- For real life applications, longer detectors, comparable to water waves, might be required. Hence, detectors with different lengths were prepared and tested. It was observed that increasing the detector length until 30 cm caused the response rate to decrease. The longest sample exhibited the fastest response; however, this was caused by the lowest electric conductivity of this sample. So, for the use of longer detectors, some other parameter would have to be adjusted in order for the detector to work as desired. This could be done by e.g., increasing the filler content or increasing the layer thickness.
- The influence of temperature on the detector performance was also investigated. It was found that the response time of the detector linearly decreased with increasing temperature. The time required for the electric current to drop to half of its initial value ranged from 2 min at 35 °C up to 10 min at 5 °C. We conclude that the proposed detector is suitable for the whole measured temperature range. However, at lower temperatures, a slower response has to be considered.
- Unfortunately, the tested polymer composite was not sensitive to different oil amounts and so it is suitable only for detecting the presence of contamination, not its scale. The lowest detected amount of oil was as low as 0.01 mL droplet on the surface of water.
- It was shown that the detector layer adheres to all selected surfaces with sufficient strength, allowing potential application to various surfaces, depending on the actual use.
Author Contributions
Funding
Acknowledgments
Conflicts of Interest
References
- Hayakawa, K.; Nomura, M.; Nakagawa, T.; Oguri, S.; Kawanishi, T.; Toriba, A.; Kizu, R.; Sakaguchi, T.; Tamiya, E. Damage to and recovery of coastlines polluted with C-heavy oil spilled from the Nakhodka. Water Res. 2006, 40, 981–989. [Google Scholar] [CrossRef] [PubMed]
- Lassalle, G.; Fabre, S.; Credoz, A.; Dubucq, D.; Elger, A. Monitoring oil contamination in vegetated areas with optical remote sensing: A comprehensive review. J. Hazard. Mater. 2020, 393, 122427. [Google Scholar] [CrossRef] [PubMed]
- Amin Al Manmi, D.A.M.; Abdullah, T.O.; Al-Jaf, P.M.; Al-Ansari, N. Soil and Groundwater Pollution Assessment and Delineation of Intensity Risk Map in Sulaymaniyah City, NE of Iraq. Water 2019, 11, 2158. [Google Scholar] [CrossRef]
- Page, C.A.; Bonner, J.S.; McDonald, T.J.; Autenrieth, R.L. Behavior of a chemically dispersed oil in a wetland environment. Water Res. 2002, 36, 3821–3833. [Google Scholar] [CrossRef]
- Page, C.A.; Bonner, J.S.; Sumner, P.L.; McDonald, T.J.; Autenrieth, R.L.; Fuller, C.B. Behavior of a chemically-dispersed oil and a whole oil on a near-shore environment. Water Res. 2000, 34, 2507–2516. [Google Scholar] [CrossRef]
- Brekke, C.; Solberg, A.H.S. Oil spill detection by satellite remote sensing. Remote Sens. Environ. 2005, 95, 1–13. [Google Scholar] [CrossRef]
- Fingas, M.; Brown, C. Review of oil spill remote sensing. Mar. Pollut. Bull. 2014, 83, 9–23. [Google Scholar] [CrossRef]
- Lee, M.-S.; Park, K.-A.; Lee, H.-R.; Park, J.-J.; Kang, C.-K.; Lee, M. Detection and Dispersion of Thick and Film-Like Oil Spills in a Coastal Bay Using Satellite Optical Images. IEEE J. Sel. Top. Appl. Earth Obs. Remote Sens. 2016, 9, 5139–5150. [Google Scholar] [CrossRef]
- Demori, M.; Ferrari, V.; Strazza, D.; Poesio, P. A capacitive sensor system for the analysis of two-phase flows of oil and conductive water. Sens. Actuators A Phys. 2010, 163, 172–179. [Google Scholar] [CrossRef]
- Jung, K.K.; Choi, D.H.; Jung, I.D.; Lee, J.M.; Ko, J.S. Capacitive micro-oil detector with a nanotextured superhydrophobic/superoleophilic surface. Sens. Actuators B Chem. 2016, 237, 974–983. [Google Scholar] [CrossRef]
- Strazza, D.; Demori, M.; Ferrari, V.; Poesio, P. Capacitance sensor for hold-up measurement in high-viscous-oil/conductive-water core-annular flows. Flow Meas. Instrum. 2011, 22, 360–369. [Google Scholar] [CrossRef]
- Tonacci, A.; Corda, D.; Tartarisco, G.; Pioggia, G.; Domenici, C. A Smart Sensor System for Detecting Hydrocarbon Volatile Organic Compounds in Sea Water. CLEAN—Soil Air Water 2015, 43, 147–152. [Google Scholar] [CrossRef]
- Fant, J.W.; Hansen, K.A. U.S. Coast Guard laser fluorosensor testing. In Proceedings of the 29th Arctic and Marine Oilspill Program (AMOP) Technical Seminar, Vancouver, BC, Canada, 6–8 June 2006. [Google Scholar]
- Zhou, Z.; Guo, L.; Shiller, A.M.; Lohrenz, S.E.; Asper, V.L.; Osburn, C.L. Characterization of oil components from the Deepwater Horizon oil spill in the Gulf of Mexico using fluorescence EEM and PARAFAC techniques. Mar. Chem. 2013, 148, 10–21. [Google Scholar] [CrossRef]
- Senga, H.; Kato, N.; Suzuki, H.; Akamatsu, T.; Yu, L.; Yoshie, M.; Tanaka, T. Field experiments and new design of a spilled oil tracking autonomous buoy. J. Mar. Sci. Technol. 2014, 19, 90–102. [Google Scholar] [CrossRef]
- Tabačiarová, J.; Krajči, J.; Pionteck, J.; Reuter, U.; Omastová, M.; Mičušík, M. Styrene Butadiene Rubber/Carbon Filler-Based Vapor Sensors. Macromol. Chem. Phys. 2016, 217, 1149–1160. [Google Scholar] [CrossRef]
- Yoon, H.; Xie, J.; Abraham, J.K.; Varadan, V.K.; Ruffin, P.B. Passive wireless sensors using electrical transition of carbon nanotube junctions in polymer matrix. Smart Mater. Struct. 2005, 15, S14–S20. [Google Scholar] [CrossRef][Green Version]
- Zhang, B.; Fu, R.W.; Zhang, M.Q.; Dong, X.M.; Lan, P.L.; Qiu, J.S. Preparation and characterization of gas-sensitive composites from multi-walled carbon nanotubes/polystyrene. Sens. Actuators B Chem. 2005, 109, 323–328. [Google Scholar] [CrossRef]
- Daňová, R.; Olejnik, R.; Slobodian, P.; Matyas, J. The Piezoresistive Highly Elastic Sensor Based on Carbon Nanotubes for the Detection of Breath. Polymers 2020, 12, 713. [Google Scholar] [CrossRef] [PubMed]
- Adhikari, P.; Bender, F.; Josse, F.; Ricco, A.J. Polymer-plasticizer coatings for shear horizontal-surface acoustic wave sensors for long-term monitoring of BTEX analytes in liquid-phase. In Proceedings of the 2016 IEEE International Frequency Control Symposium (IFCS), New Orleans, LA, USA, 9–12 May 2016; pp. 1–2. [Google Scholar]
- Allouch, A.; Le Calvé, S.; Serra, C.A. Portable, miniature, fast and high sensitive real-time analyzers: BTEX detection. Sens. Actuators B Chem. 2013, 182, 446–452. [Google Scholar] [CrossRef]
- Moghaddasi, A.; Sobolčiak, P.; Popelka, A.; Sadasivuni, K.K.; Spitalsky, Z.; Krupa, I. Electrically Conductive Electrospun Polymeric Mats for Sensing Dispersed Vegetable Oil Impurities in Wastewater. Processes 2019, 7, 906. [Google Scholar] [CrossRef]
- Krupa, I.; Prostredný, M.; Špitalský, Z.; Krajči, J.; AlMaadeed, M.A.S. Electrically conductive composites based on an elastomeric matrix filled with expanded graphite as a potential oil sensing material. Smart Mater. Struct. 2014, 23, 125020. [Google Scholar] [CrossRef]
- Nagata, K.; Iwabuki, H.; Nigo, H. Effect of particle size of graphites on electrical conductivity of graphite/polymer composite. Compos. Interfaces 1998, 6, 483–495. [Google Scholar] [CrossRef]
- Panda, J.N.; Bijwe, J.; Pandey, R.K. Variation in size of graphite particles and its cascading effect on the performance properties of PAEK composites. Compos. Part B Eng. 2020, 182, 107641. [Google Scholar] [CrossRef]
- Evgin, T.; Turgut, A.; Hamaoui, G.; Spitalsky, Z.; Horny, N.; Micusik, M.; Chirtoc, M.; Sarikanat, M.; Omastova, M. Size effects of graphene nanoplatelets on the properties of high-density polyethylene nanocomposites: Morphological, thermal, electrical, and mechanical characterization. Beilstein J. Nanotechnol. 2020, 11, 167–179. [Google Scholar] [CrossRef]
- Kratochvíla, J.; Boudenne, A.; Krupa, I. Effect of filler size on thermophysical and electrical behavior of nanocomposites based on expanded graphite nanoparticles filled in low-density polyethylene matrix. Polymer Compos. 2013, 34, 149–155. [Google Scholar] [CrossRef]
- Boudenne, A.; Ibos, L.; Fois, M.; Majesté, J.C.; Géhin, E. Electrical and thermal behavior of polypropylene filled with copper particles. Compos. Part A Appl. Sci. Manuf. 2005, 36, 1545–1554. [Google Scholar] [CrossRef]
- Boudenne, A.; Ibos, L.; Candau, Y. Thermophysical Properties of Multiphase Polymer Systems. In Handbook of Multiphase Polymer Systems; John Wiley & Sons, Ltd.: Hoboken, NJ, USA, 2011; pp. 387–423. ISBN 978-1-119-97202-0. [Google Scholar]
- Mamunya, Y.; Boudenne, A.; Lebovka, N.; Ibos, L.; Candau, Y.; Lisunova, M. Electrical and thermophysical behaviour of PVC-MWCNT nanocomposites. Compos. Sci. Technol. 2008, 68, 1981–1988. [Google Scholar] [CrossRef]
- Wei, C.; Dai, L.; Roy, A.; Tolle, T.B. Multifunctional Chemical Vapor Sensors of Aligned Carbon Nanotube and Polymer Composites. J. Am. Chem. Soc. 2006, 128, 1412–1413. [Google Scholar] [CrossRef]
- Kim, J.; Kim, K.S.; Kim, Y.H. Mechanical effects in peel adhesion test. J. Adhes. Sci. Technol. 1989, 3, 175–187. [Google Scholar] [CrossRef]
- Kinloch, A.J.; Lau, C.C.; Williams, J.G. The peeling of flexible laminates. Int. J. Fract. 1994, 66, 45–70. [Google Scholar] [CrossRef]
- Poh, B.T.; Lee, P.G.; Chuah, S.C. Adhesion property of epoxidized natural rubber (ENR)-based adhesives containing calcium carbonate. Express Polym. Lett. 2008, 2, 398–403. [Google Scholar] [CrossRef]
- Khan, I.; Poh, B.T. Effect of molecular weight and testing rate on adhesion property of pressure-sensitive adhesives prepared from epoxidized natural rubber. Mater. Des. 2011, 32, 2513–2519. [Google Scholar] [CrossRef]


| Film Applicator Gap [mm] | Film Thickness [mm] | Standard Deviation of Film Thickness [mm] |
|---|---|---|
| 0.09 | 0.016 | 0.002 |
| 0.12 | 0.022 | 0.003 |
| 0.15 | 0.028 | 0.004 |
| 0.18 | 0.030 | 0.003 |
| 0.21 | 0.037 | 0.002 |
| 0.24 | 0.039 | 0.004 |
© 2020 by the authors. Licensee MDPI, Basel, Switzerland. This article is an open access article distributed under the terms and conditions of the Creative Commons Attribution (CC BY) license (http://creativecommons.org/licenses/by/4.0/).
Share and Cite
Prostredný, M.; Krupa, I.; Špitalský, Z. Preparation and Characterization of New Electrically Conductive Composites Based on Expanded Graphite with Potential Use as Remote Environmental Detectors. Processes 2020, 8, 1176. https://doi.org/10.3390/pr8091176
Prostredný M, Krupa I, Špitalský Z. Preparation and Characterization of New Electrically Conductive Composites Based on Expanded Graphite with Potential Use as Remote Environmental Detectors. Processes. 2020; 8(9):1176. https://doi.org/10.3390/pr8091176
Chicago/Turabian StyleProstredný, Martin, Igor Krupa, and Zdenko Špitalský. 2020. "Preparation and Characterization of New Electrically Conductive Composites Based on Expanded Graphite with Potential Use as Remote Environmental Detectors" Processes 8, no. 9: 1176. https://doi.org/10.3390/pr8091176
APA StyleProstredný, M., Krupa, I., & Špitalský, Z. (2020). Preparation and Characterization of New Electrically Conductive Composites Based on Expanded Graphite with Potential Use as Remote Environmental Detectors. Processes, 8(9), 1176. https://doi.org/10.3390/pr8091176