Article

Improvement of Fast Kurtogram Combined with PCA for Multiple Weak Fault Features Extraction

1
School of Thermal Engineering, Shandong Jianzhu University, Jinan 250101, China
2
Key Laboratory of High-efficiency and Clean Mechanical Manufacture, National Demonstration Center for Experimental Mechanical Engineering Education, School of Mechanical Engineering, Shandong University, Jinan 250061, China
3
State Key Laboratory of Fluid Power and Mechatronic Systems, Institute of Process Equipment, College of Energy Engineering, Zhejiang University, Hangzhou 310027, China
*
Author to whom correspondence should be addressed.
Processes 2020, 8(9), 1059; https://doi.org/10.3390/pr8091059
Submission received: 22 July 2020 / Revised: 25 August 2020 / Accepted: 27 August 2020 / Published: 31 August 2020
(This article belongs to the Section Process Control and Monitoring)

Abstract

:
Demodulation plays an important role in fault feature extraction for rotating machinery. The fast kurtogram method was proved to be effective for rotating machinery demodulation. However, the demodulation effectiveness of fast kurtogram was poor for multiple fault features extraction under low signal-to-noise ratio. In this paper, an improved method of fast kurtogram, called P-kurtogram, is presented. The proposed method extracted the multiple weak fault features from multiple envelope signals-based principal component analysis. Compared with extracting features from one envelope signal of fast kurtogram, P-kurtogram showed a better demodulation performance for multiple faults. Combined with principal component analysis method, the proposed method also showed a good performance under low signal-to-noise ratio(SNR). By simulation analysis, the P-kurtogram method showed good performance for multiple modulation features extraction and robust performance in demodulation under low SNR. Then, the proposed method was demonstrated by applications of bearing faults detection and propeller detection. The results verified that the P-kurtogram has a better demodulation performance than fast kurtogram for multiple weak fault features extraction, especially under low signal-to-noise ratio. The proposed method provides a reliable basis for multiple weak fault features extraction of rotating machinery.

1. Introduction

Condition-based maintenance [1] is an effective maintenance policy in industrial enterprises. Robust fault diagnosis technique is a growing necessity in condition-based maintenance [2]. Fault features extraction methods are the key techniques for fault diagnosis of rotating machinery [3]. According to the mechanism of rotating machinery, amplitude modulation is the main modulation type. Demodulation is the best way to extract fault features in monitoring signals of rotating machinery. Various methods have been proposed for demodulation of rotating machinery, such as envelope demodulation [4], resonance demodulation [5], cyclostationary analysis [6,7], and spectrum kurtosis [8]. Among these demodulation techniques, spectral kurtosis is an effective and usual method for rotating machinery.
Spectra kurtosis method was originally proposed by Dwyer to indicate the existence of transients in signals [9]. The core idea of spectral kurtosis is to select the narrow modulated band by calculating the kurtosis [10]. Antoni presented a formal definition of the spectral kurtosis in term of the Wold-Cramer representation, called kurtogram [11]. For the sake of on-line industrial applications, Antoni further developed a fast algorithm to enhance the computational efficiency, called fast kurtogram, which optimized the band-filter [12]. Spectral kurtosis has been widely applied to extract fault features of rotating machinery. Combining spectral kurtosis and squared envelope spectral analysis, Leite et al. presented an approach for bearing condition-based maintenance [13]. Mohamed et al. applied spectral kurtosis to wind turbines condition monitoring [14]. Lee et al. used spectral kurtosis to detect the signal arisen by the tip vortex cavitation [15]. Han et al. used the kurtosis of envelope spectrum to determine the cavitation inception speed quantitatively [16].
The early fault characteristics of rotating machinery carried by vibration signals are quite weak. Due to the low signal-to-noise ratio (SNR) and complex interferences, it is difficult to identify the weak fault features. Some researchers have proposed noise reduction methods to improve the SNR, such as Blind deconvolution [17], variational mode decomposition [18], Wavelet transform [19,20], sparse stacked denoising autoencoder [21,22], and higher order coherent spectra [23]. Therefore, some researchers have taken measures to enhancing the performance of kurtogram for weak fault feature extraction. Lei et al. proposed an improved kurtogram method, which took wavelet packet transform as filter instead of original filter [24]. Wang et al. proposed a meshing frequency modulation index, which is combined with kurtogram to identify the bearing fault features in significant interrupts [25]. Wang et al. presented an improved kurtogram for bearing fault feature extraction, which applied manifold learning method to signal denoise [26]. Maximum correlated kurtosis deconvolution was developed for enhancing the periodic impulses of fault signals, which was taken as a signal preprocessing method [27]. Xiang et al. applied probabilistic principal component analysis as denoise method for rolling element bearing fault signals [28]. Tomasz et al. presented a protrugram which had a better detection ability of modulating signals than fast kurtogram under low SNR, but a priori knowledge was required [29]. Antoni put forward an infogram method to capture the transient components in both domain, including time and frequency domain [30]. Miao proposed a gini index to improve the kurtogram for bearing faults detection [31]. Ali et al. presented an autogram which calculated the kurtosis of unbiased autocorrelation of the squared envelope of filtered signal instead of the envelope signal of filtered signal [32]. However, only one envelope signal of filtered signal is selected in spectral kurtosis, which is not conductive to enhance the performance for multiple weak fault features extraction.
In the present study, a novel demodulation method for multiple weak fault features extraction is proposed. The proposed method is an improvement of kurtogram, which combined kurtogram and principal component analysis (PCA). Comparing with fast kurtogram, the proposed method extracted features form multiple envelope signals, which shows a better performance for multiple weak fault features extraction under low SNR. The multiple weak fault signals are extracted by PCA, which is a classical method of multivariate statistical analysis for dimension reduction. PCA have been successfully applied in many applications [33,34].
This paper is organized as follows. In Section 2, an overview of fast kurtogram and the P-kurtogram method is presented. The proposed method is verified by simulations analysis in Section 3. Section 4 shows the application of the proposed method in bearing fault feature extraction and propeller features detection. In addition, the results were compared with the fast kurtogram to examine the performance of P-kurtogram method. Finally, the conclusions are drawn in Section 5.

2. Methodology

2.1. The Overview of Fast Kurtogram

A brief overview of spectral kurtosis and fast kurtogram is presented in this subsection. Kurtosis is a statistical indicator which is used to detect faults impulsive component in signals [11]. For time series signals, kurtosis is defined as Equation (1).
  K u r t o s i s = i = 1 N ( x ( t i ) μ x ) 4 [ i = 1 N ( x ( t i ) μ x ) 2 ] 2
where   x ( t ) denotes time series signal, μ x is the mean value of   x ( t ) , t i and N denotes instant time and the length of   x ( t ) . Comparing with kurtosis for time series signal, spectrum kurtosis applied it to time-frequency domain. Therefore, K x ( f ) was used as an indicator to find the modulation component of filtered signal based on time-frequency analysis, which is defined as Equation (2) [12].
K x ( f ) = | X 4 ( t , f ) | | X 2 ( t , f ) | 2
where < · > represents the time-frequency averaging operator, X ( t , f ) is the time-frequency envelope of the band-pass filtered signal of x ( t ) around f.
Based on kurtosis values of filtered signals, the subband that includes impulsive component can be identified by kurtogram. The filter-bank structure is the core of kurtogram algorithm. A 1/3-binary tree filter bank strategy was proposed in fast kurtogram, which improved the computing efficiency. Using this technique, the whole band can be calculated efficiently. However, fast kurtogram has worse performance for multiple features extraction and low SNR condition, which restricts its application range.

2.2. P-Kurtogram

To improve the performance of fast kurtogram for multiple features extraction and low SNR condition extraction, an improvement method of fast kurtogram was proposed. The proposed method P-kurtogram combined fast kurtogram and PCA for multiple weak fault features extraction, which also could enhance the extraction performance under low SNR condition. The detail technique routines of fast kurtogram and P-kurtogram are shown in Figure 1. As shown in Figure 1, the P-kurtogram chooses multiple envelope signals of filtered signal based on kurtosis. Multiband selection based on fast kurtogram, PCA and feature extraction are three key steps for P-kurtogram. The number of data samples needs to be higher than the highest frequency of the resonant band.

2.2.1. Multiband Selection Based on Kurtogram

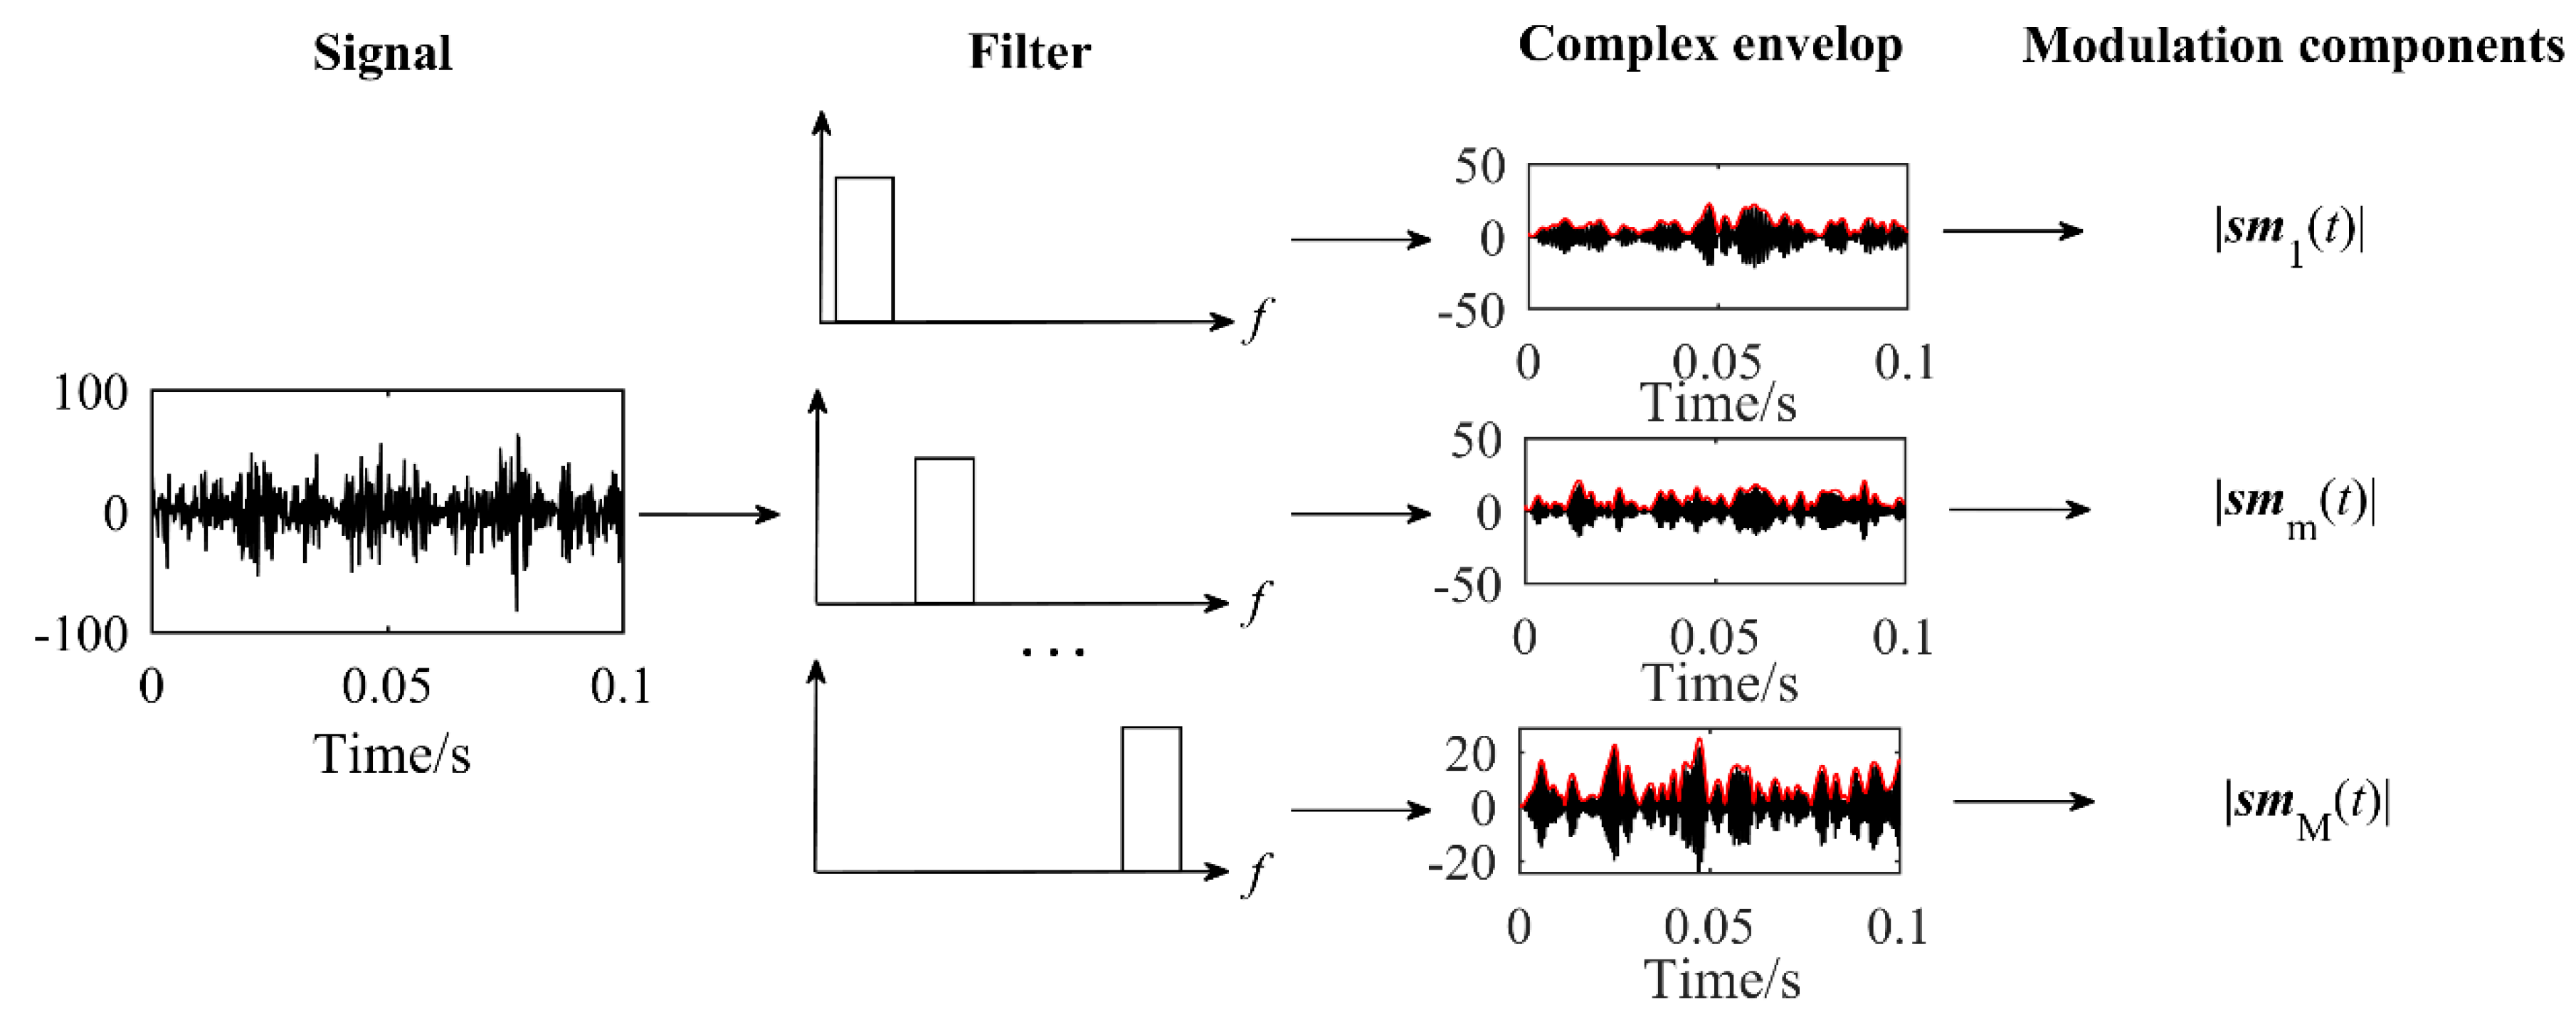
In this step, the reason for multiple filtered signals selection is put forward. Combined with fast kurtogram, the modulation components extraction process from multiple filtered signals is plotted in Figure 2.
According to the mechanism of rotating machinery, signal modulation model can be expressed as Equation (3).
s ( t ) = i = 1 P ( x m i ( t ) x c i ( t ) ) + j = 1 Q ( x n j ( t ) ) + n ( t )
where, s ( t ) denotes raw signal, P denotes the total number of frequency bands, x m i ( t ) denotes modulation signal, x c i denotes carrier wave, x n j ( t ) denotes the non-modulation signal and Q denotes its total number, n ( t ) denotes white noise.
According to the mechanism of rotating machinery, narrow band and broad band carrier signals exist all at once. The monitoring signal can be expressed as Equation (4), which are filtered into several bands equally. The modulation signal s m m ( t ) in frequency bands is correspond to modulation signal x m i ( t ) as expressed in Equation (5).
  s ( t ) = m = 1 M ( s m m ( t ) s c m ( t ) + s n m ( t ) + n m ( t ) )
where, M denotes the total number of frequency bands, m denotes the index of frequency band, s m m ( t ) denotes modulation signal in frequency band m, which include the modulation waves, s c m ( t ) denotes carrier wave in frequency band m, s n m ( t ) denotes the non-modulation signal in frequency band m, n m ( t ) denotes white noise in frequency band m.
m = 1 M s m m ( t ) i = 1 P x m i ( t )
The filtered signal s f m ( t ) is expressed as Equation (6), which include modulation signal, non-modulation signal and noise. For the filtered signal s f m ( t ) , the envelop signal E S m ( t ) is expressed as Equation(7), which can be approximate as | s m m ( t ) | .
s f m ( t ) = s m m ( t ) s c m ( t ) + s n m ( t ) + n m ( t )
E S m ( t ) = ( s f m ( t ) ) 2 ( Hilbert ( s f m ( t ) ) ) 2 | s m m ( t ) |
where Hilbert ( ) denotes the Hilbert transform operator.
From the signal modulation model of rotating machinery, weak fault modulated signal s m m ( t ) can be demodulated from multiple filtered signals including carrier waves s c m ( t ) . In order to increase the accuracy for multiple weak fault features extraction, first n filtered signals are both selected based on kurtosis value of kurtogram. In order to guarantee the performance of PCA, the total filtered signals’ number n should be satisfied with:   n > 3 . Based on multiple envelope signals selection, multiple components are extracted and weak fault signals are enhanced. Envelope signals matrix   E S M ( i , j ) is make up of multi envelope signals E S m ( t ) of filtered signal as shown in Equation (8).
E S M ( i , j ) = [ E S 1 ( 0 ) E S 1 ( j ) E S 1 ( t ) E S i ( 0 ) E S n ( 0 ) E S i ( j ) E S i ( t ) E S n ( j ) E S n ( t ) ]
where, i denotes ith envelope signal E S i ( t ) , j denotes the instant time of E S n ( j ) .

2.2.2. Principal Component Analysis

In this step, the modulation components is extracted from envelope signals matrix   E S M ( i , j ) by PCA as shown in Figure 3. PCA is statistical procedure, which is used as a dimensional reduction tool. For envelope signals matrix E S M ( i , j ) , it is two-dimensional including sequence number i and instant time j. Based on Equation (8), the weak fault modulation signals can be seen as the principal components of E S i ( t ) . We adopted PCA to reduce sequence number dimension of   E S M ( i , j ) to multiple extract weak fault signals   W F S ( t ) of envelope signal as shown in Figure 3.
E S M C c o v represents the covariance matrix with the corresponding column variances along the diagonal, which is expressed as Equation (9).
E S M C c o v = c o v ( E S M ( i , j ) )
where c o v ( · ) represents the covariance operator. Covariance matrix E S M C c o v can be converted into a canonical form by eigendecomposition, whereby the matrix is represented in terms of its eigenvalues and eigenvectors as Equation (10).
[ V , U ] = eig ( E S M C c o v )
where eig ( · ) represents the eigendecomposition operator. V denotes diagonal matrix of eigenvalues λ i as Equation (11). U denotes eigenvectors matrix whose columns are the corresponding eigenvectors μ i as Equation (12). The criterion for choosing principal components is expressed as Equation (13).
  V = diag ( λ 1 , λ 2 , , λ n )
U = [ μ 1 , μ 2 , , μ m ] R m × n
where μ i R m × 1 .
i = 1 k λ i i = 1 n λ i 80 %
where k represents the total number of selected principal components. And the weak fault signals W F S i ( t ) can be reconstruct as Equation (14).
W F S i ( t ) = E S M x ( i , j ) T μ i

2.2.3. Feature Extraction

From reconstructed principal component signals W F S i ( t ) , characteristic frequency can be extracted by Fourier transform as in Equation (15). In order to achieve the accurate extraction of fault features, the spectral resolution needs to be greater than 0.2 Hz.
W F S i ( f ) = W F S ( t ) i e j 2 π f t d t
In conclusion, the proposed P-Kurtogram method is an improvement of Kurtogram. Based on PCA of envelope signals of filtered signals, the multiple modulation components are extracted and the weak fault features are enhanced under low SNR, which is verified by simulation analysis and applications in follow Sections.

3. Simulations

In this section, the effectiveness of proposed P-kurtogram method for multiple modulation features extraction was verified by simulations analysis. Due to line-spectrum, narrow band and broad band modulation signals exist simultaneously for rotating machinery, an amplitude modulation simulated signal is built as Equation (16) [35].
x ( t ) = i = 1 2 cos ( 2 π f m , i t ) ( cos ( 2 π f c , i t ) + n c i ( t ) + w c i ( t ) ) + i = 1 2 cos ( 2 π f i t )
where i denotes the index of signal components, f m , 1 , f m , 2 = 15   Hz , 25   Hz denote the modulation wave frequencies, f c , 1 , f c , 2 = 900   Hz , 2300   Hz denote the carrier wave frequencies, f 1 , f 2 = 30 Hz, 500 Hz denote the frequencies of cosine signal, n c 1 ( t ) : 1100   Hz 1600   Hz and n c 2 ( t ) : 2400   Hz 2900   Hz denote the narrow band carrier waves. w c i ( t ) denotes the wide band carrier wave in form of white Gaussian noise.
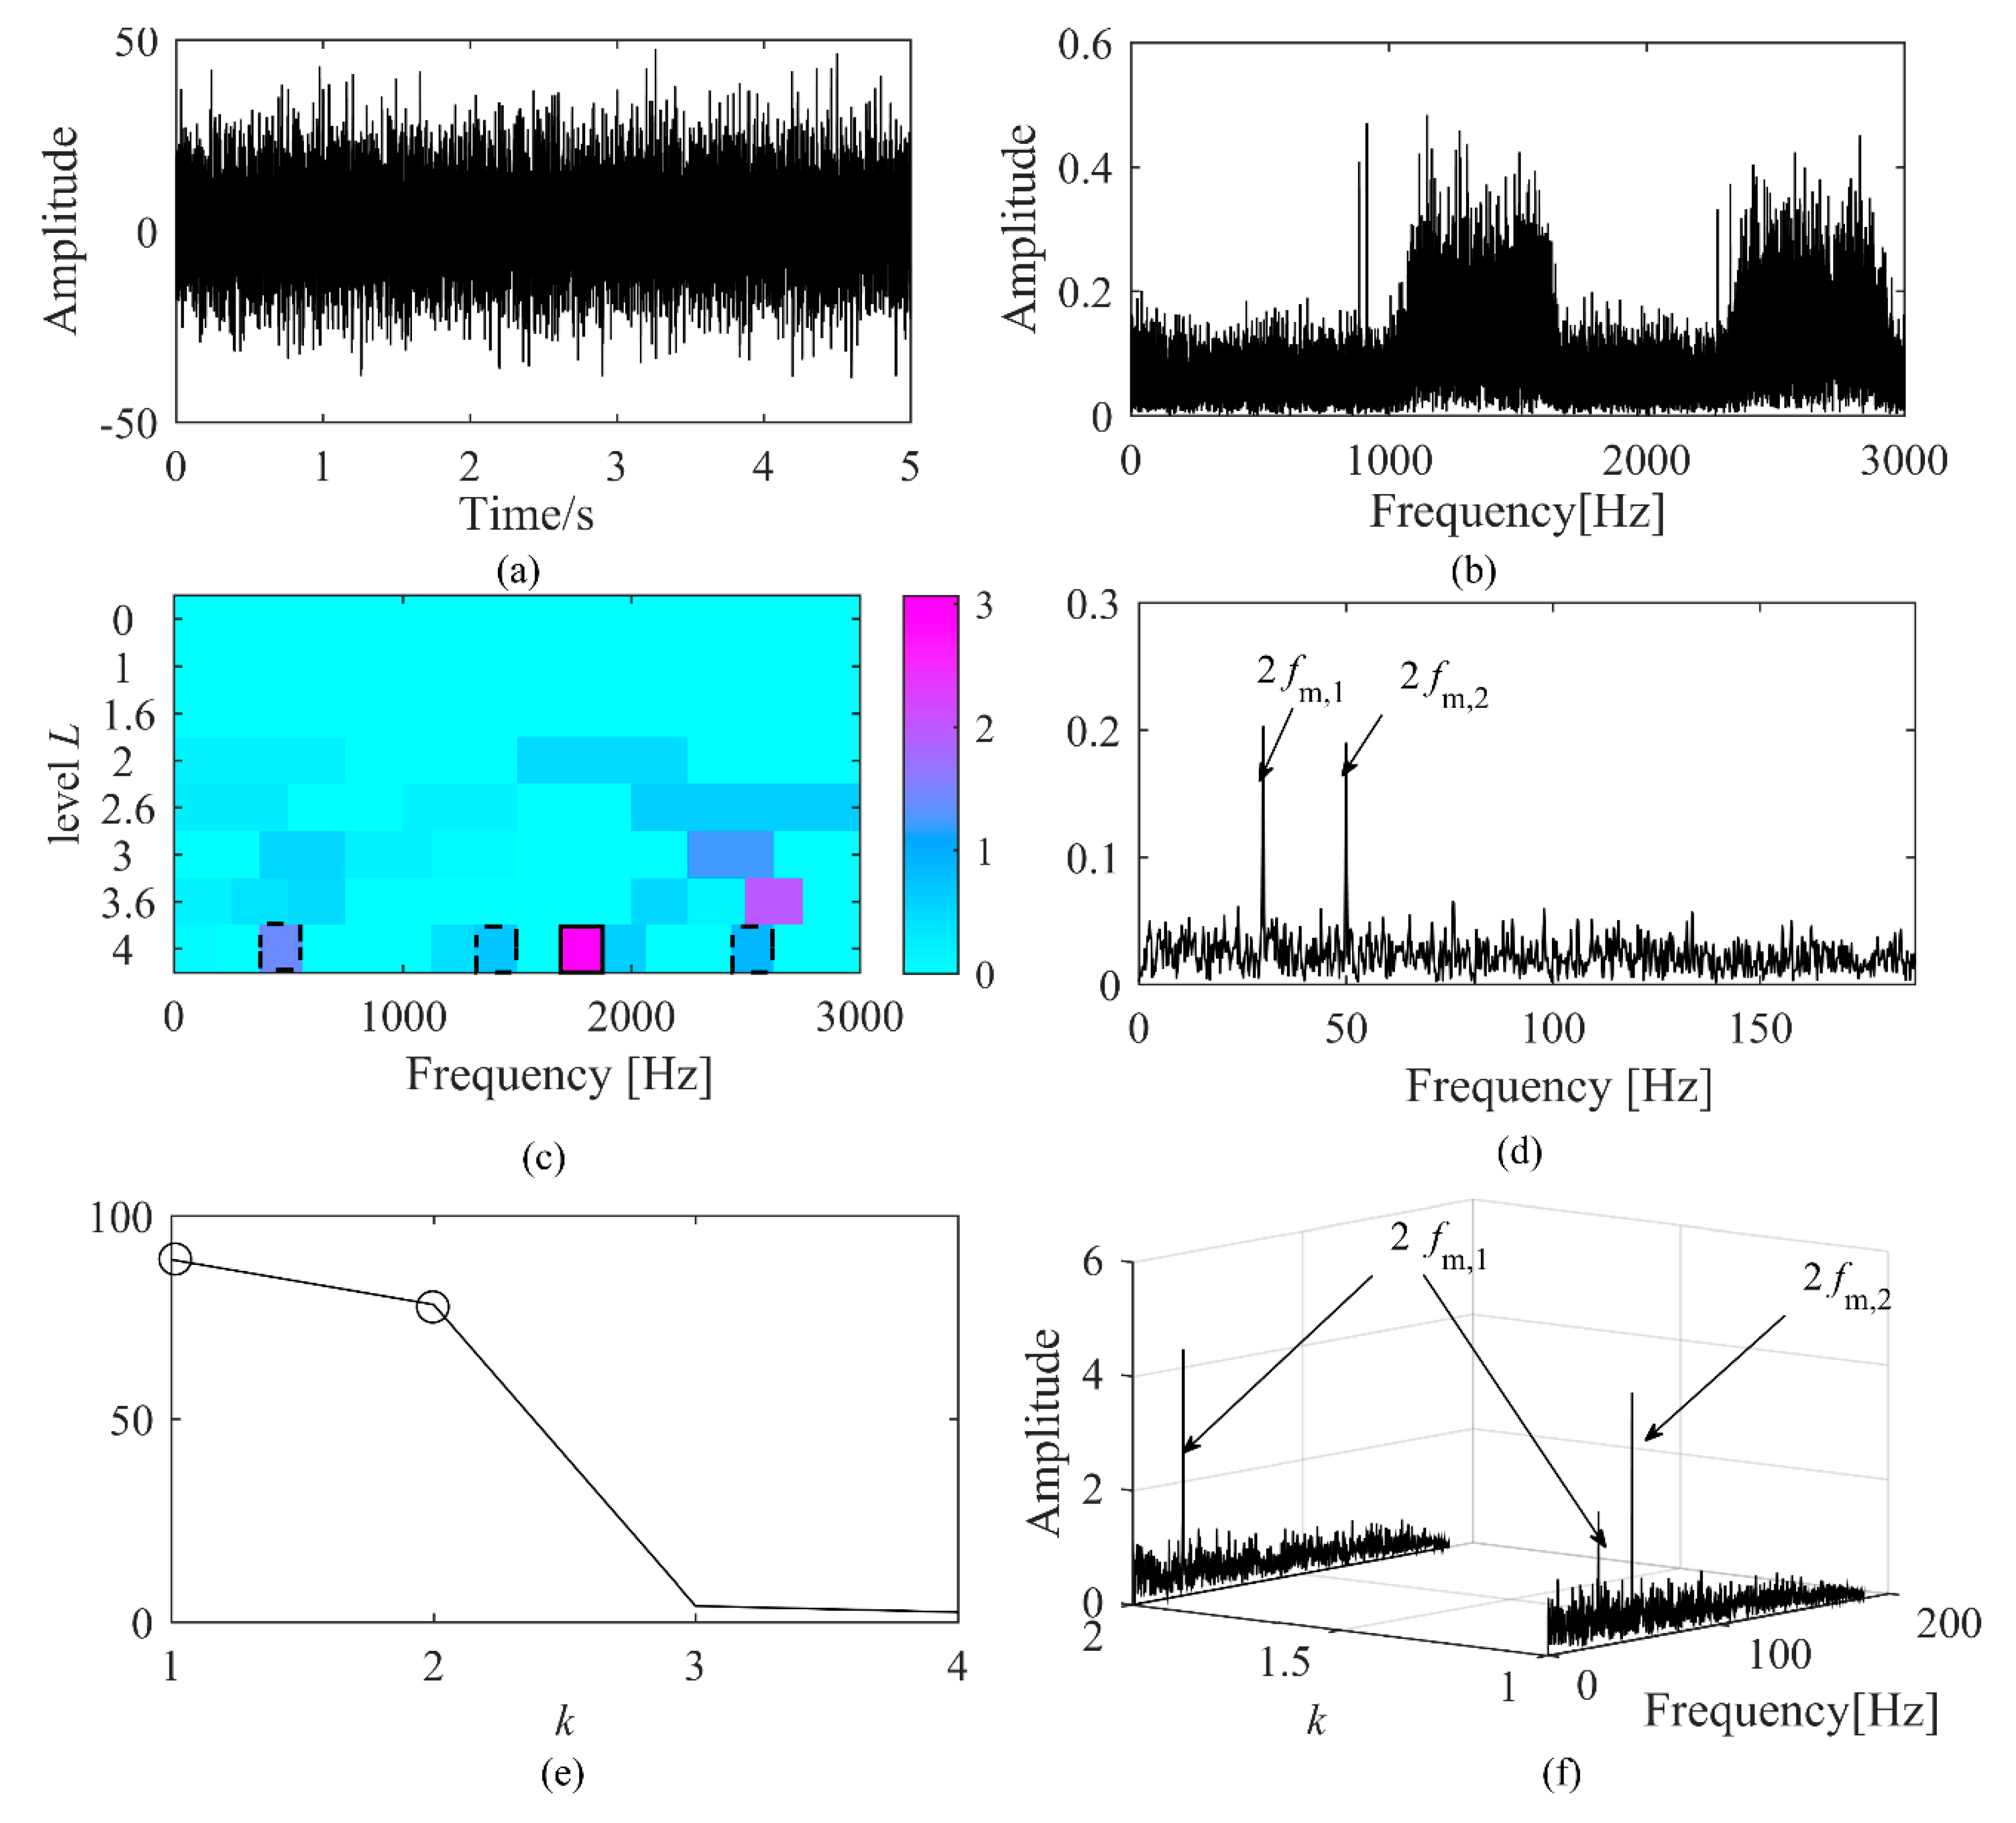
In order to study the performance of proposed P-kurtogram method for multiple modulation features extraction under low SNR condition, different white noise levels were added to signal   x ( t ) . The SNR levels of   x ( t ) are −5 dB, −10 dB, −15 dB, respectively. The simulated signals were analyzed using fast kurtogram [11,12] and proposed method P-kurtogram simultaneously. The results are shown in Figure 4, Figure 5 and Figure 6.
As SNR = −5 dB, the kurtogram and proposed P-kurtogram method were preferable for feature detection. The raw signal and its amplitude spectrum is shown in the Figure 4a,b. Modulation wave frequencies 2 f m , 1 , 2 f m , 2 can be detected exactly in both method. The resonance band was detected by fast kurtogram as shown in Figure 4c, which is marked by solid line box. Amplitude spectrum of kurtogram is plotted in Figure 4d. For P-kurtogram, four envelope signals of filtered signals were selected for PCA as shown in Figure 4c. Two principal components were selected according to Equation (13) as shown in Figure 4e. P-kurtogram extracted the modulation frequency exactly as shown in Figure 4f.
Given SNR = −10 dB, the raw signal and its amplitude spectrum is shown in the Figure 5a,b. The resonance band is marked by solid line box as shown in Figure 5c. The fast kurtogram method was unable to extract the modulation wave frequency 2 f m , 1 which was buried in the spectrum of kurtogram as shown in Figure 5d. By contrast, the proposed P-kurtogram had a better extraction performance. Three envelope signals of filtered signals were selected as shown in Figure 5c, which are marked by line box. Two principal components were selected as shown in Figure 5e. The modulation wave frequencies 2 f m , 1   ,   2 f m , 2 can be clearly observed in Figure 5f.
Given SNR = −15 dB, the SNR is relatively low. The raw signal and its amplitude spectrum is shown in the Figure 6a,b. The fast kurtogram method was unable to extract the modulation wave frequency 2 f m , 1 , 2 f m , 2 which were buried in the spectrum of fast kurtogram as shown in Figure 6d. By contrast, the modulation wave frequencies 2 f m , 1 , 2 f m , 2 can be clearly observed in Figure 6f. Three envelope signals of filtered signals were selected as shown in Figure 6c. Two principal components were selected as shown in Figure 6e.
In conclusion, the proposed method P-kurtogram shows two advantages than fast kurtogram. The first advantages is that the proposed P-kurtogram has a good performance for multiple modulation components extraction. Secondly, the proposed P-kurtogram method has a better performance than fast kurtogram for weak feature extraction under low SNR.

4. Experiment and Analysis

4.1. Application of P-Kurtogram for Bearing Fault Signals

In this subsection, the proposed P-kurtogram was validated via bearing data. The bearing fault data in this study is provided by the Case Western Reserve University (CWRU) laboratory [36]. The vibration data were collected using accelerometers and sampling frequency is 12 KHz. Fan end bearing outer race fault and inner race fault data were adopted in this study. The main characteristic frequency of bearings consist of Ball Pass Frequency Outer f BPFO , Ball Pass Frequency inner f BPFI and Ball Spin Frequency f BSF , which can be calculated by Equation (17) [35]. Under bearing fault condition, these characteristic frequency can be detected by signal processing.
f BPFO = n 2 f ( 1 d b d p cos ( θ ) ) f BPFI = n 2 f ( 1 + d b d p cos ( θ ) ) f BSF = d p 2 d b f ( 1 d b 2 d p 2 cos ( θ ) )
where, n denotes number of rollers, f denotes rotor speed, θ denotes contact angle, d p denotes pitch diameter and d b denotes the ball number.

4.1.1. Case 1: Fan End Bearing Inner Race Fault

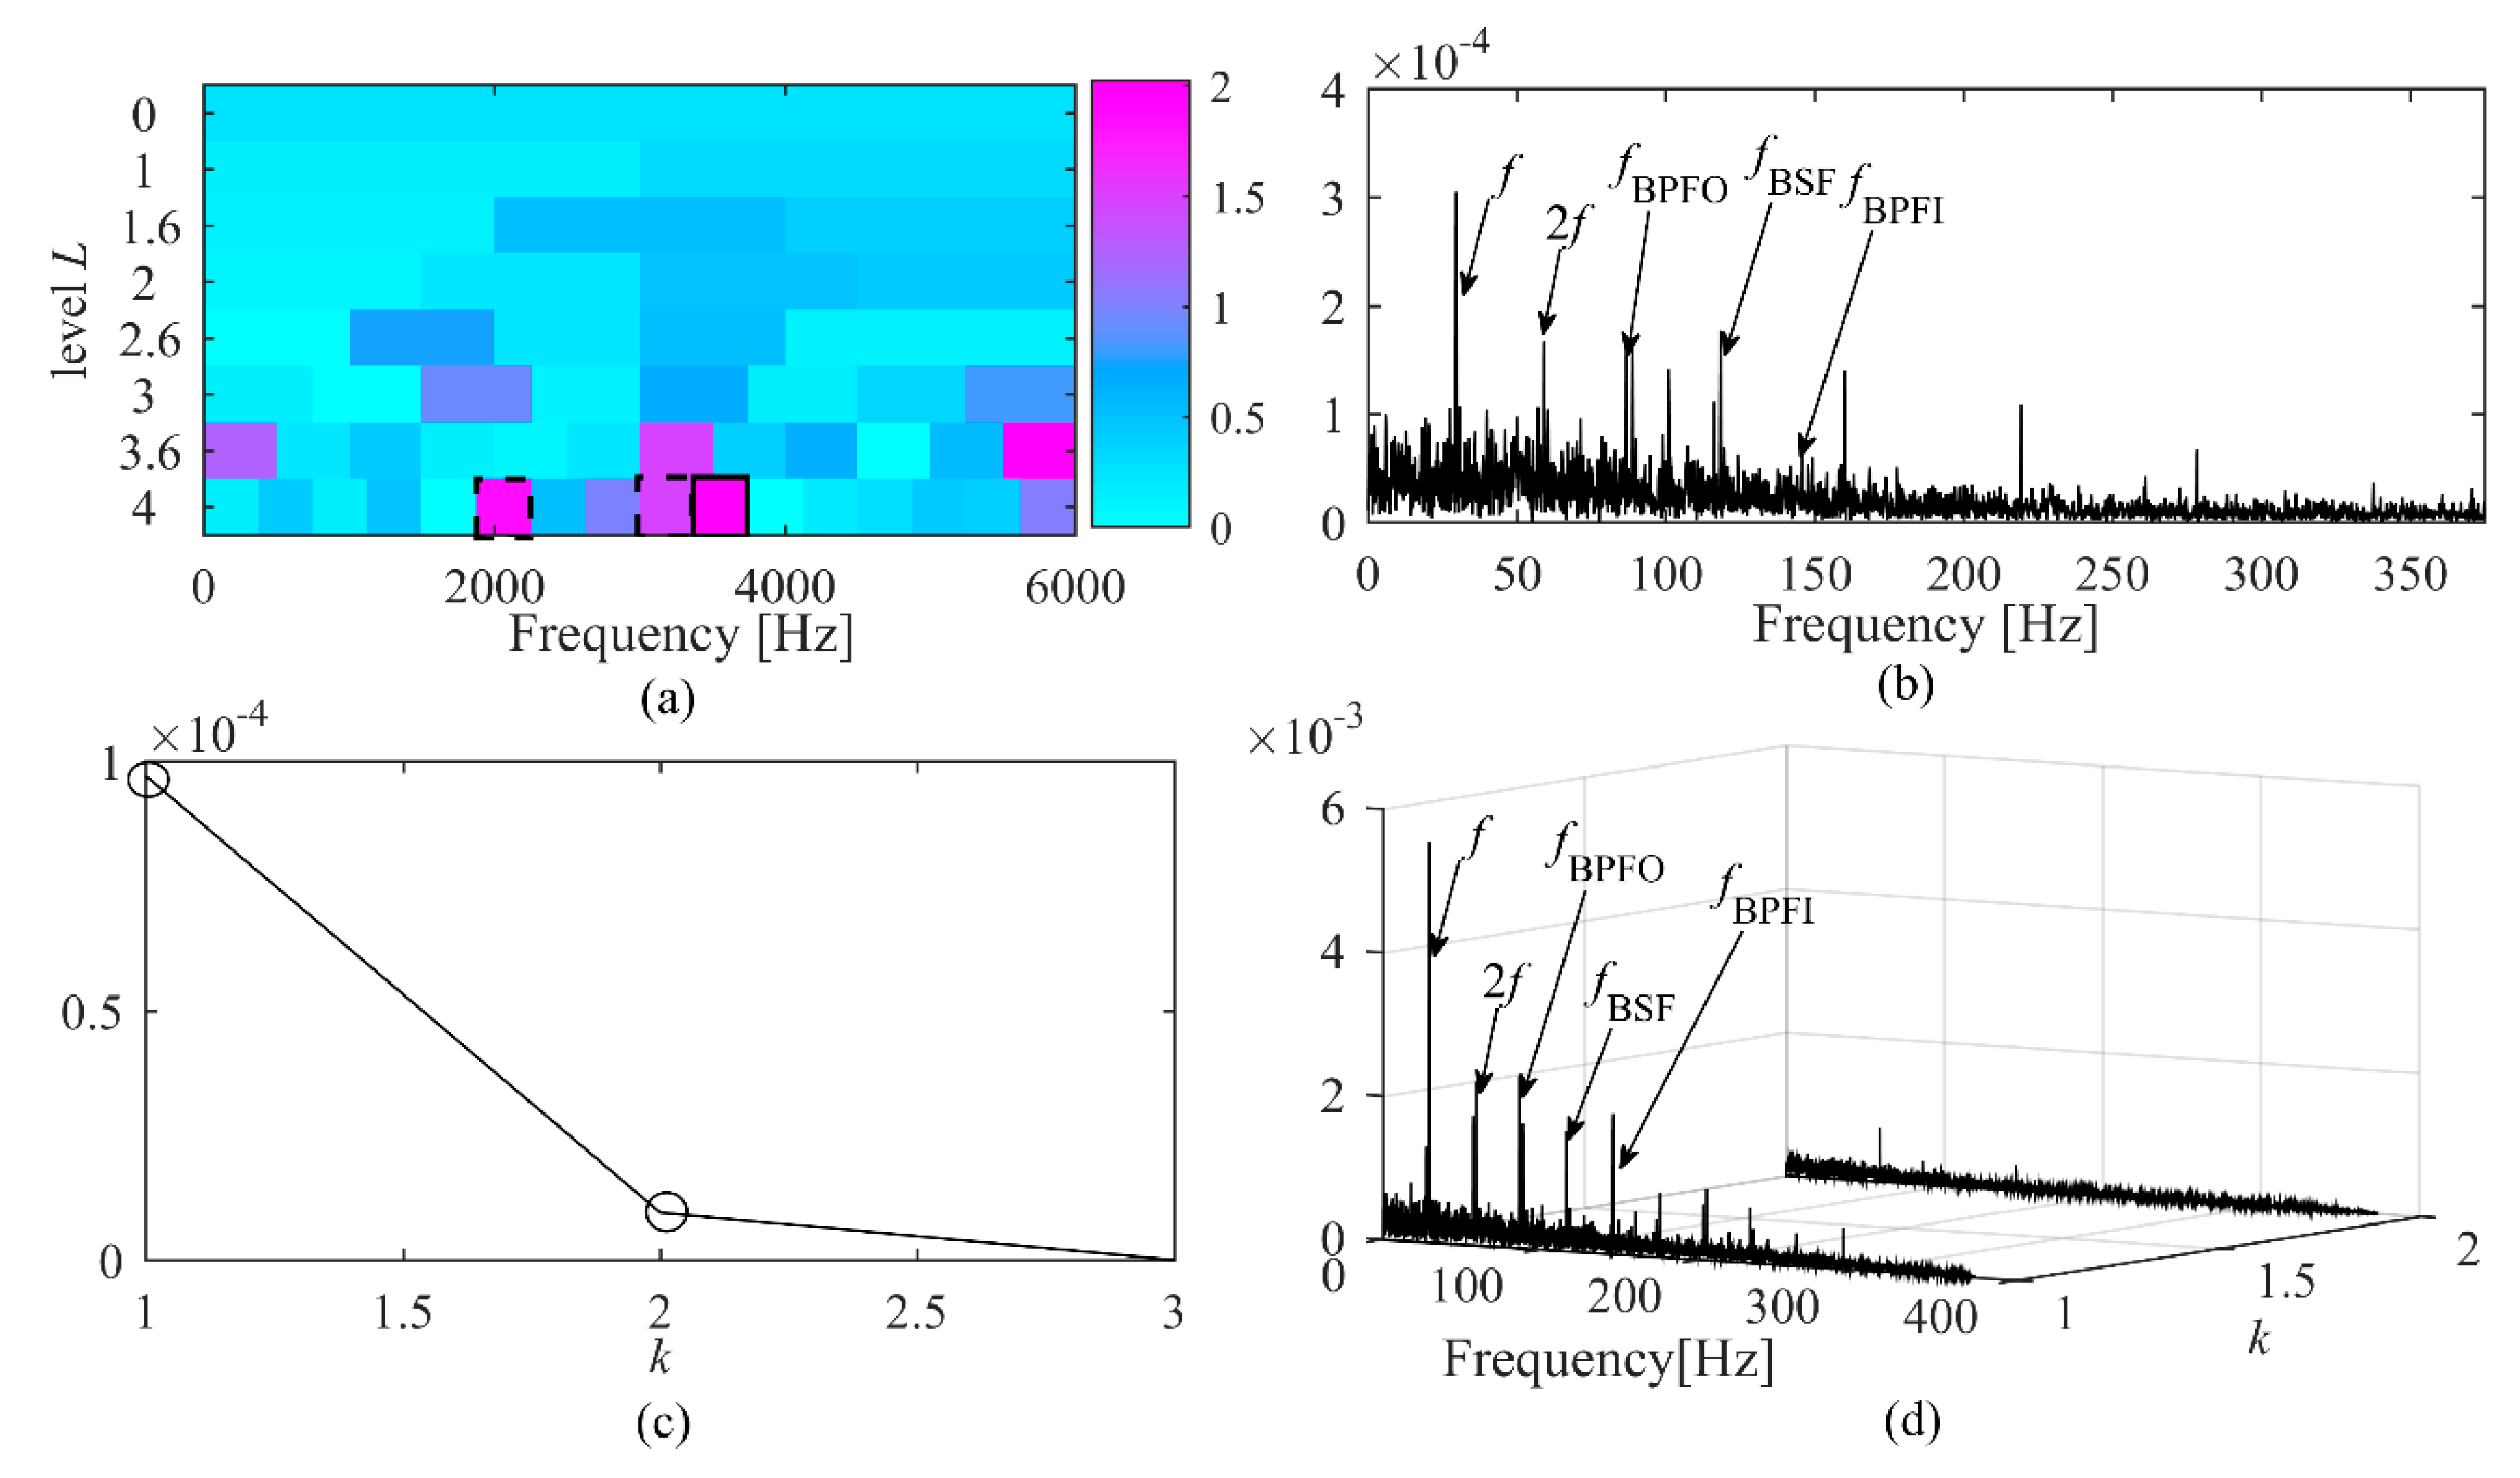
Under fan end bearing inner race fault condition, the speed is 1772 rpm, fault diameter is 0.014 inches and motor load is 1 HP. The vibration signals of drive end were analyzed using fast kurtogram and proposed method P-kurtogram. The results are shown in Figure 7.
The resonance frequency band using fast kurtogram method is marked by solid line box as shown in Figure 7a. The bearing inner race fault frequency f BPFI was extracted, but other inferences frequency occur in the spectrum of the kurtogram as shown in Figure 7b. In this study, three filtered signals were selected for PCA and two principal components were selected as shown in Figure 7c. The bearing inner race fault frequency f BPFI was exactly extracted by P-kurtogram as shown in Figure 7d. The results indicate the proposed P-kurtogram method has a better performance than fast kurtogram for multiple features extraction.

4.1.2. Case 2: Fan End Bearing Outer Race Fault

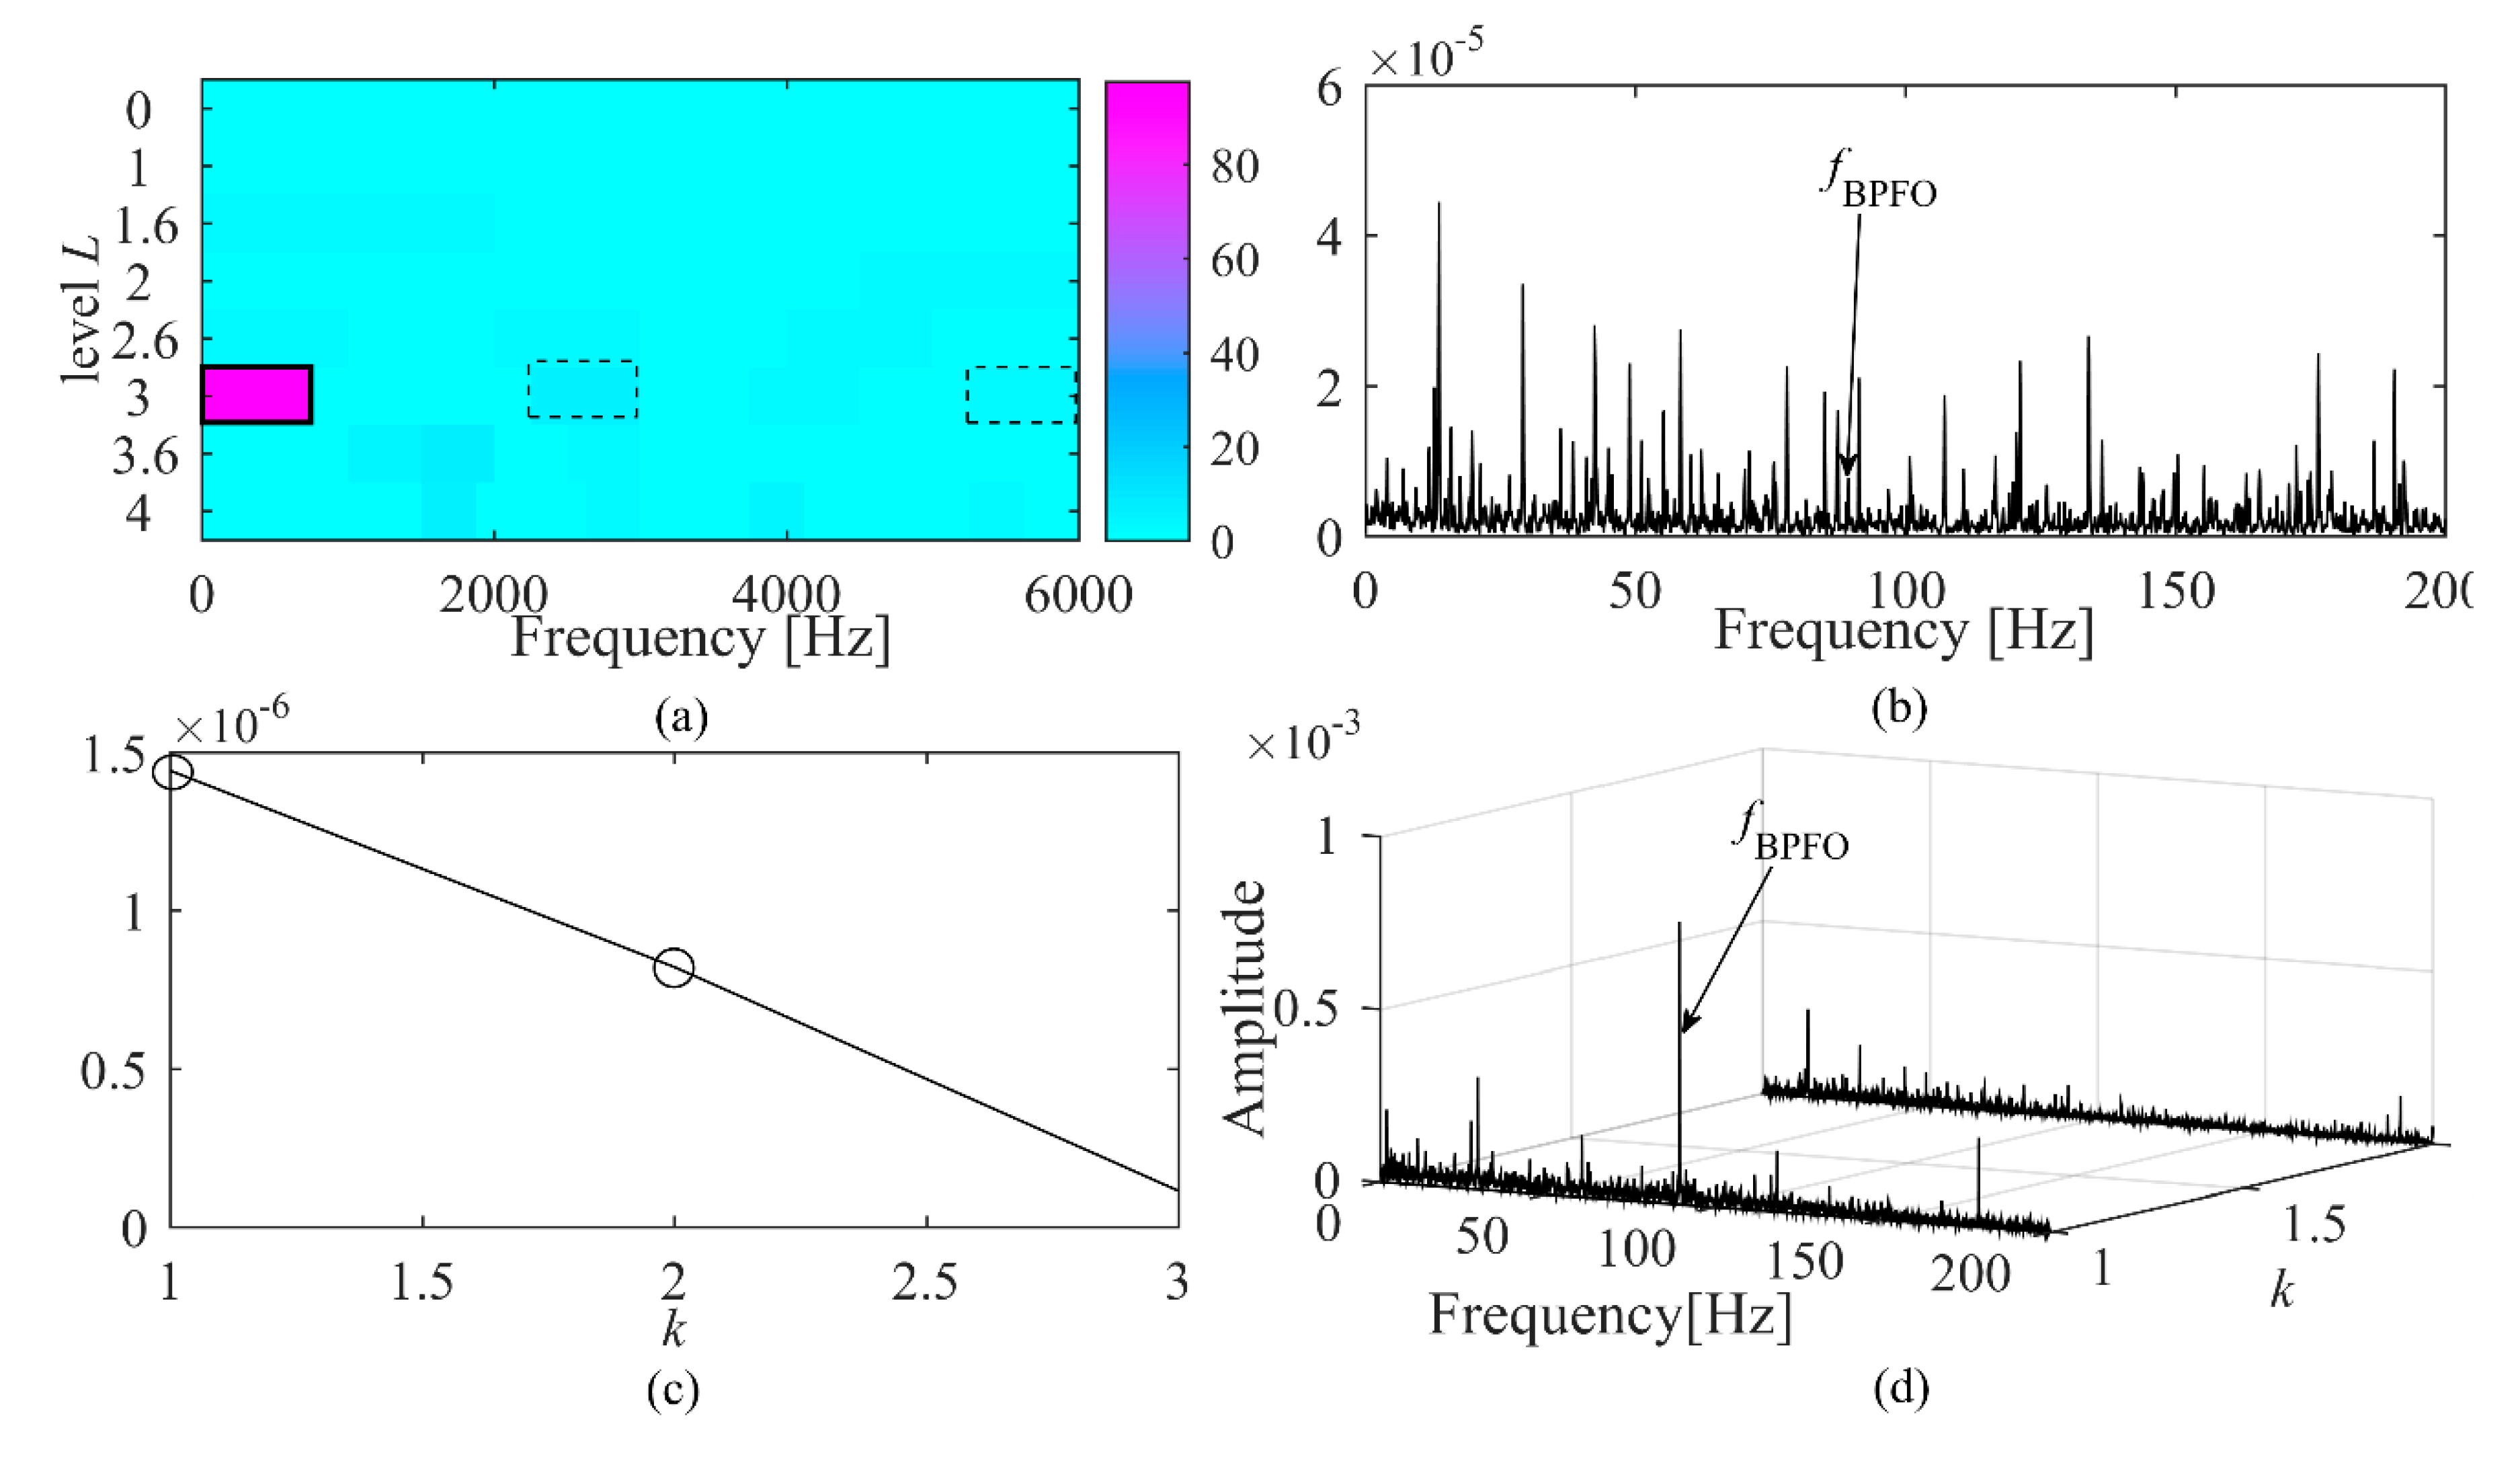
Under fan end bearing outer race fault condition, the speed is 1750 rpm, fault diameter is 0.021 inches and motor load is 2 HP. The vibration signals of fan end were analyzed using fast kurtogram and proposed method P-kurtogram. The results are shown in Figure 8.
The resonance frequency band using fast kurtogram method is marked by solid line box as shown in Figure 8a, but the bearing outer race fault frequency f BPFO is buried in the amplitude spectrum of the squared envelop as shown in Figure 8b. Three filtered signals were selected for PCA and two principal components were selected as shown in Figure 8c. The bearing outer race fault frequency f BPFO was exactly extracted by P-kurtogram in Figure 8d. The results indicate the proposed P-kurtogram method has a better performance than fast kurtogram for weak feature extraction.

4.2. Application of P-Kurtogram for Acoustic Signals of Propeller

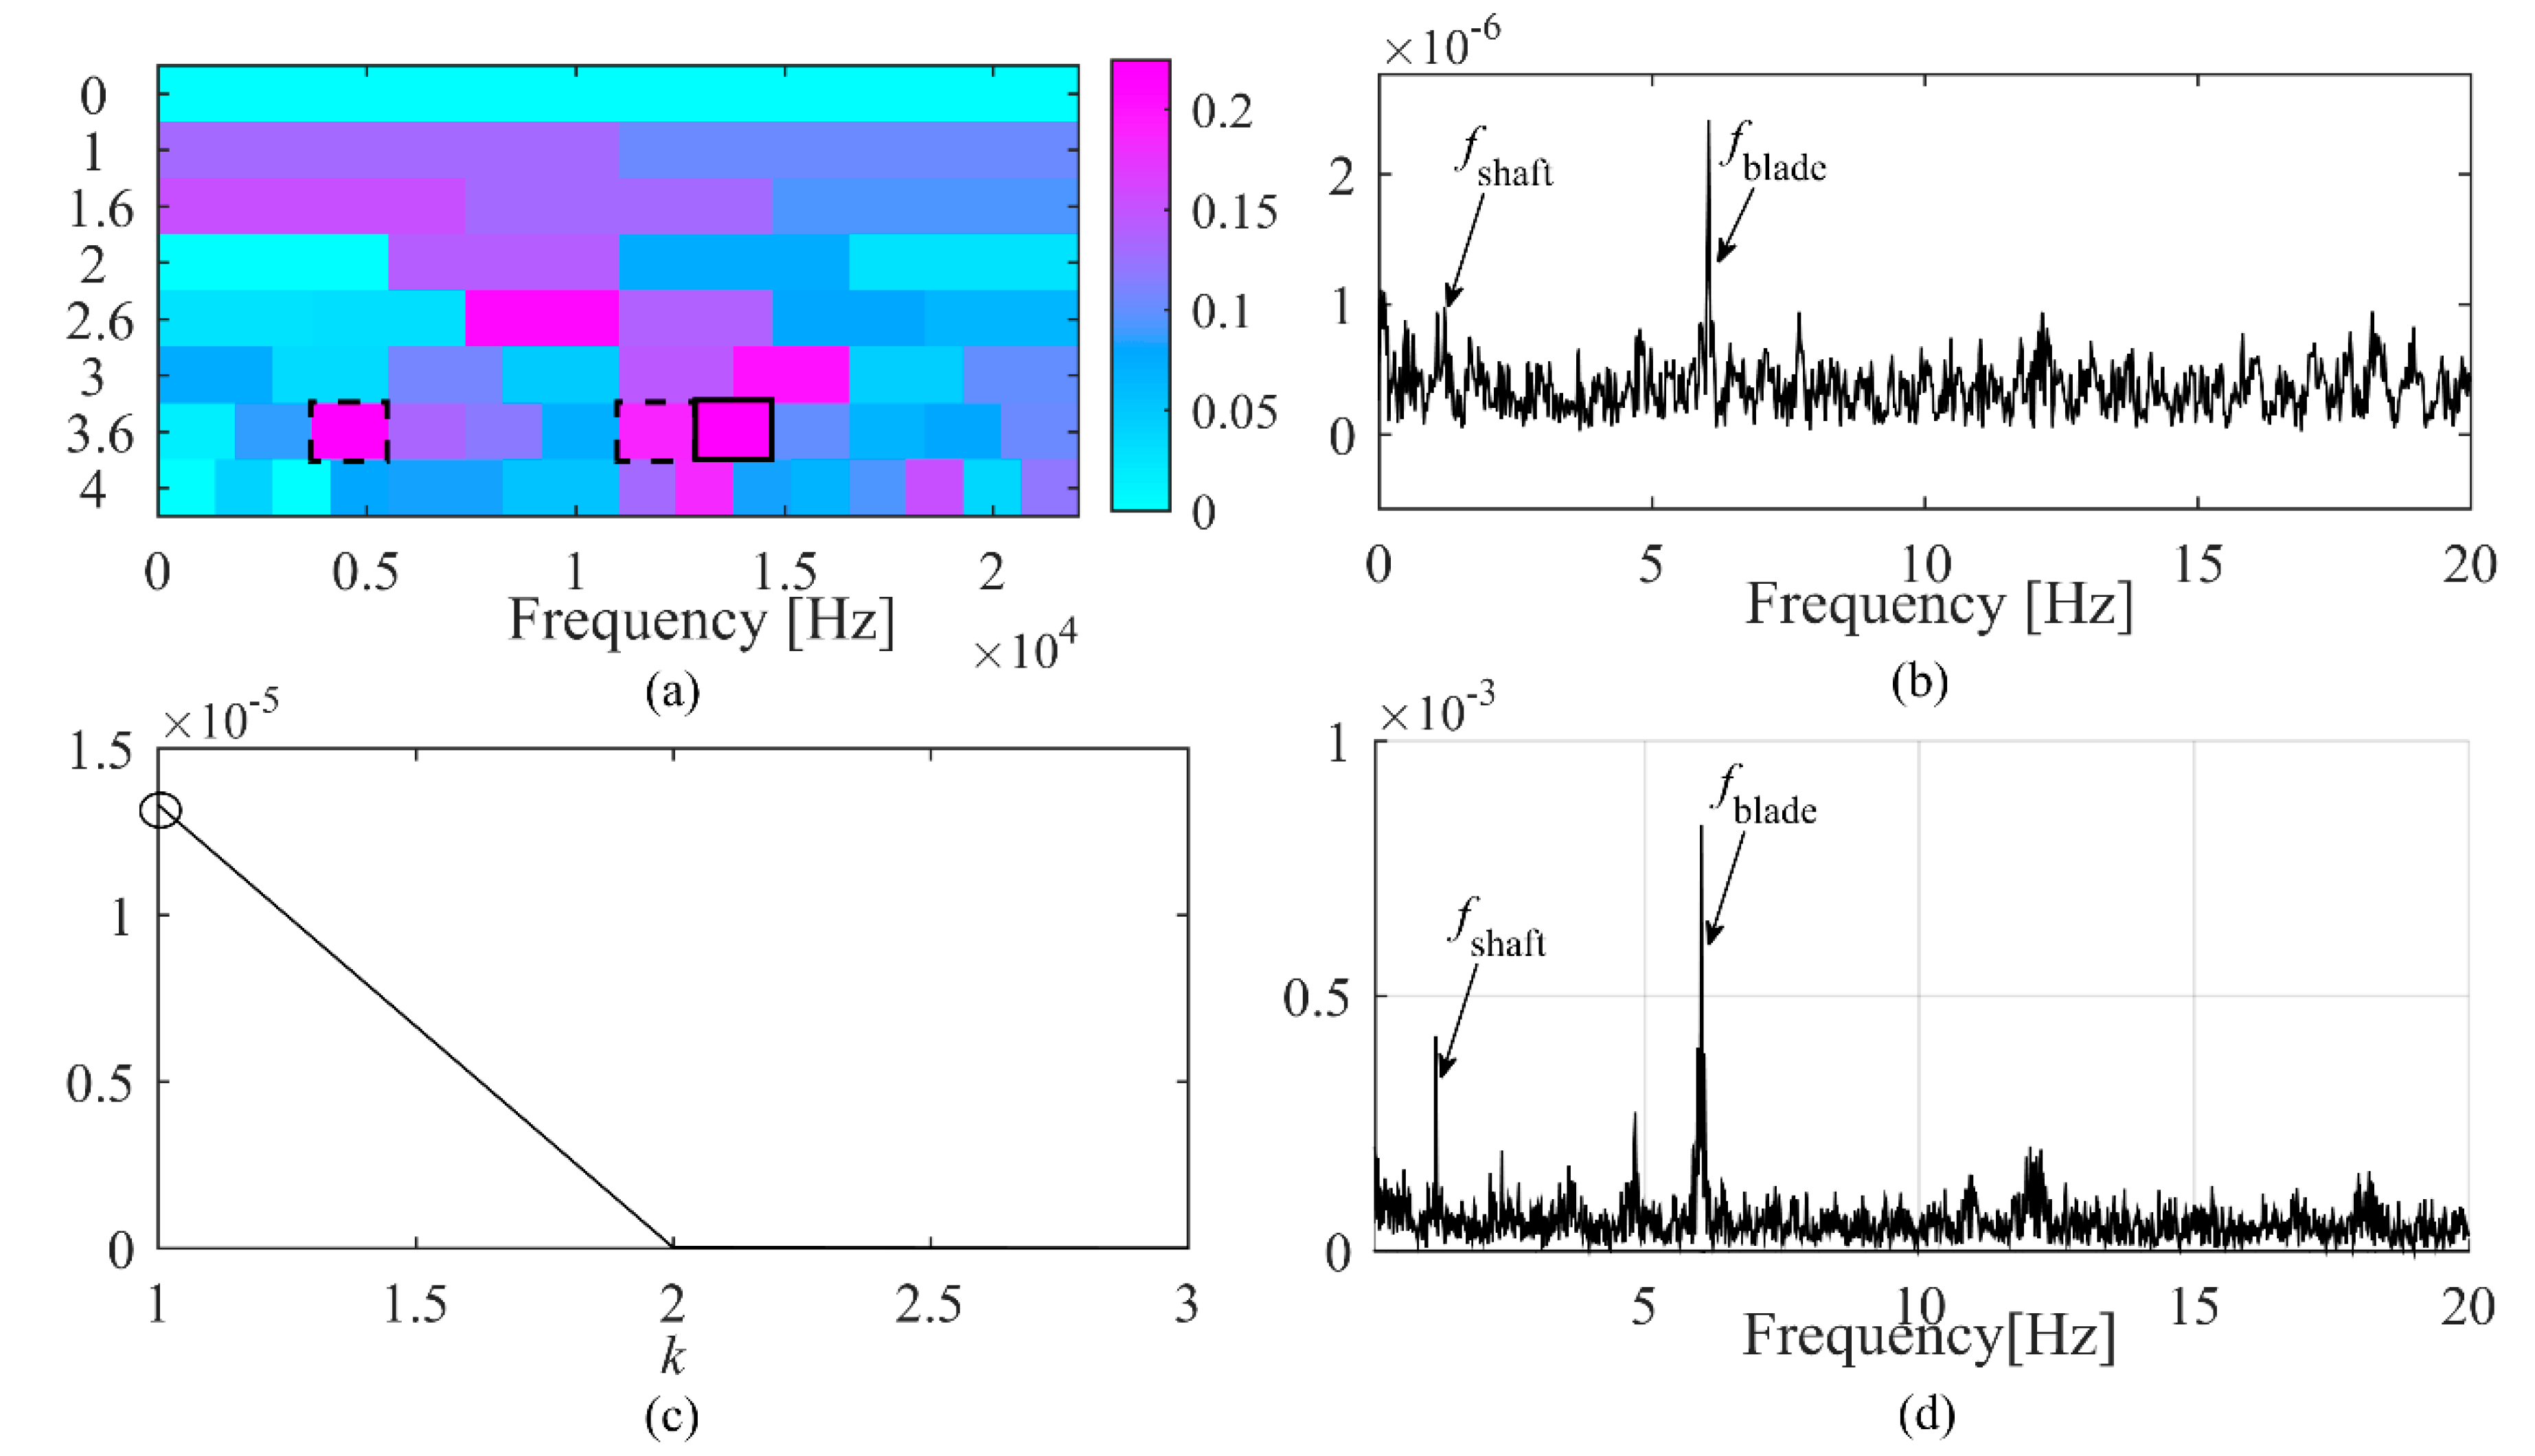
In this subsection, the proposed P-kurtogram was validated via acoustic signal of merchant ship propeller. The acoustic signals was collected by hydrophones. The hydrophone sensitivity is 39.7 mv/pa and its sampling frequency is set as 44,100 Hz. The shaft speed of propeller is 72 r/min and the propeller has six blades. Therefore, the characteristic shaft frequency f shaft is 1.2 Hz and blades frequency f blade is 6 Hz. The acoustic signals of propeller was analyzed by fast kurtogram and proposed method P-kurtogram. The results are shown in Figure 9.
The resonance frequency band using fast kurtogram method is marked by solid line box as shown in Figure 9a. The blade frequency f blade is detected exactly, but the shaft frequency f shaft is buried in the amplitude spectrum of the squared envelop as shown in Figure 9b. Three filtered signals is selected for PCA and one principal component is selected as shown in Figure 9c. The blade frequency f blade and shaft frequency f shaft are exactly extracted by P-kurtogram in Figure 9d. The results indicate the proposed P-kurtogram method has a better extraction performance than fast kurtogram for multiple components extraction, especially under weak feature extraction.

5. Conclusions

This paper proposed an improvement method of kurtogram for multiple modulation components extraction, called P-kurtogram. P-kurtogram extracted the impulsive and non-stationary signals from multi envelope signals of filtered signals based on principal component analysis, rather than one envelope signal of fast kurtogram. Combined with principal component analysis, the proposed method has a well ability for multiple fault features and weak fault signals extraction. By simulation analysis, the P-kurtogram method shows good performance for multiple modulation features extraction and robust performance in demodulation under low SNR. Then, the proposed method was demonstrated by applications of bearing faults detection and propeller detection. Results indicated that the proposed method provides a better multiple features extraction and weak characteristic fault frequencies identification than fast kurtogram. Therefore, the proposed method provides a reliable basis for multiple weak fault features extraction of rotating machinery.

Author Contributions

Conceptualization, Y.S. and D.W.; methodology, Y.S.; software, J.L.; validation, Y.S., J.L. and L.Z.; formal analysis, Y.S.; investigation, J.L.; resources, L.Z.; data curation, J.L.; writing—original draft preparation, Y.S.; writing—review and editing, Y.S.; visualization, J.L.; supervision, Y.S.; project administration, D.W.; funding acquisition, D.W. All authors have read and agreed to the published version of the manuscript.

Funding

This research was funded by National Key R&D Plan of China, grant number 2016YFF0203300 and Doctoral Foundation of Shandong Jianzhu University, grant number X19057Z0101.

Acknowledgments

Authors would like to thank Jéróme Antoni for sharing the Fast Kurtogram codes publicly and Case Western Reserve University for sharing bearing data.

Conflicts of Interest

The authors declare no conflict of interest.

References

  1. Kumar, S.; Goyal, D.; Dang, R.K.; Dhami, S.S.; Pabla, B.S. Condition based maintenance of bearings and gears for fault detection-A review. Mater. Today Proc. 2018, 5, 6128–6137. [Google Scholar]
  2. Yunusa-Kaltungo, A.; Cao, R. Towards Developing an Automated Faults Characterisation Framework for Rotating Machines. Part 1: Rotor-Related Faults. Energies 2020, 13, 1394. [Google Scholar] [CrossRef] [Green Version]
  3. Yunusa-Kaltungo, A.; Sinha, J.K.; Elbhbah, K. HOS analysis of measured vibration data on rotating machines with different simulated faults. In Advances in Condition Monitoring of Machinery in Non-Stationary Operations; Springer: Berlin/Heidelberg, Germany, 2014; pp. 81–89. [Google Scholar]
  4. Shahriar, R.; Borghesani, P.; Randall, R.B.; Tan, A.C.C. An assessment of envelope-based demodulation in case of proximity of carrier and modulation frequencies. Mech. Syst. Signal Process. 2017, 96, 176–200. [Google Scholar] [CrossRef]
  5. Wang, T.; Chu, F.; Han, Q.; Kong, Y. Compound faults detection in gearbox via meshing resonance and spectral kurtosis methods. J. Sound Vib. 2017, 392, 367–381. [Google Scholar] [CrossRef]
  6. Antoni, J. Fast computation of the spectral correlation. Mech. Syst. Signal Process. 2017, 92, 248–277. [Google Scholar] [CrossRef]
  7. Li, S.; Chu, N.; Yan, P.; Wu, D.; Antoni, J. Cyclostationary approach to detect flow-induced effects on vibration signals from centrifugal pumps. Mech. Syst. Signal Process. 2019, 114, 275–289. [Google Scholar] [CrossRef]
  8. Gu, X.; Yang, S.; Liu, Y.; Rujiang, H. Rolling element bearing faults diagnosis based on kurtogram and frequency domain correlated kurtosis. Meas. Sci. Technol. 2016, 27, 125019. [Google Scholar] [CrossRef]
  9. Dwyer, R.F. A technique for improving detection and estimation of signals contaminated by under ice noise a. J. Acoust. Soc. Am. 1990, 124, 124–130. [Google Scholar]
  10. Systems, M.; Maintenance, S.; Vibration, D.; Supe, E.N.; Cedex, L.; January, R. Crest factor and kurtosis contributions. Mech. Syst. Signal Process. 1997, 11, 903–916. [Google Scholar]
  11. Antoni, J. The spectral kurtosis: A useful tool for characterising non-stationary signals. Mech. Syst. Signal Process. 2006, 20, 282–307. [Google Scholar] [CrossRef]
  12. Antoni, J. Fast computation of the kurtogram for the detection of transient faults. Mech. Syst. Signal Process. 2007, 21, 108–124. [Google Scholar] [CrossRef]
  13. Leite, V.C.M.N.; Borges, J.G.; Eduardo, L.; Veloso, G.F.C.; Lambert-torres, G.; Bonaldi, E.L.; De, L.E.L.; Bonaldi, E.L. Oliveira Experimental Bearing Fault Detection, Identification, and Prognosis through Spectral Kurtosis and Envelope Spectral Analysis. Electr. Power Compon. Syst. 2016, 44, 2121–2132. [Google Scholar] [CrossRef]
  14. Elforjani, M.; Bechhoefer, E. Analysis of extremely modulated faulty wind turbine data using spectral kurtosis and signal intensity estimator. Renew. Energy 2018, 127, 258–268. [Google Scholar] [CrossRef]
  15. Lee, J.; Kim, D.; Shin, Y. Hyperbolic localization of incipient tip vortex cavitation in marine propeller using spectral kurtosis. Mech. Syst. Signal Process. 2018, 110, 442–457. [Google Scholar] [CrossRef]
  16. Han, H.S.; Lee, C.N.; Jeon, S.H.; Lee, K.H.; Park, S.H. Development of an evaluation method to determine cavitation inception speed with aft hull vibration using kurtosis of the DEMON spectrum. Ocean Eng. 2018, 152, 167–180. [Google Scholar] [CrossRef]
  17. Zhang, B.; Khawaja, T.; Patrick, R.; Vachtsevanos, G. Blind deconvolution denoising for helicopter vibration signals. IEEE/ASME Trans. Mechatron. 2008, 13, 558–565. [Google Scholar] [CrossRef]
  18. An, X.; Yang, J. Denoising of hydropower unit vibration signal based on variational mode decomposition and approximate entropy. Trans. Inst. Meas. Control 2016, 38, 282–292. [Google Scholar] [CrossRef]
  19. Wang, Y.; He, Z.; Zi, Y. Enhancement of signal denoising and multiple fault signatures detecting in rotating machinery using dual-tree complex wavelet transform. Mech. Syst. Signal Process. 2010, 1, 119–137. [Google Scholar] [CrossRef]
  20. Qin, Z.; Chen, L.; Bao, X. Wavelet denoising method for improving detection performance of distributed vibration sensor. IEEE Photonics Technol. Lett. 2012, 3, 542–544. [Google Scholar] [CrossRef]
  21. Sun, M.; Wang, H.; Liu, P.; Huang, S.; Fan, P. A sparse stacked denoising autoencoder with optimized transfer learning applied to the fault diagnosis of rolling bearings. Measurement 2019, 1, 305–314. [Google Scholar] [CrossRef]
  22. Jiang, G.; He, H.; Xie, P.; Tang, Y. Stacked multilevel-denoising autoencoders: A new representation learning approach for wind turbine gearbox fault diagnosis. IEEE Trans. Instrum. Meas. 2017, 23, 2391–2402. [Google Scholar] [CrossRef]
  23. Yunusa-Kaltungo, A.; Sinha, J.K. Sensitivity analysis of higher order coherent spectra in machine faults diagnosis. Struct. Health Monit. 2016, 15, 555–567. [Google Scholar] [CrossRef] [Green Version]
  24. Lei, Y.; Lin, J.; He, Z.; Zi, Y. Application of an improved kurtogram method for fault diagnosis of rolling element bearings. Mech. Syst. Signal Process. 2011, 25, 1738–1749. [Google Scholar] [CrossRef]
  25. Wang, T.; Chu, F.; Feng, Z. Meshing frequency modulation (MFM) index-based kurtogram for planet bearing fault detection. J. Sound Vib. 2018, 432, 437–453. [Google Scholar] [CrossRef]
  26. Wang, Y.; Tse, P.W.; Tang, B.; Qin, Y.; Deng, L.; Huang, T. Kurtogram manifold learning and its application to rolling bearing weak signal detection. Measurement 2018, 127, 533–545. [Google Scholar] [CrossRef]
  27. Miao, Y.; Zhao, M.; Lin, J.; Lei, Y. Application of an improved maximum correlated kurtosis deconvolution method for fault diagnosis of rolling element bearings. Mech. Syst. Signal Process. 2017, 92, 173–195. [Google Scholar] [CrossRef]
  28. Xiang, J.; Zhong, Y.; Gao, H. Rolling element bearing fault detection using PPCA and spectral kurtosis. Measurement 2015, 75, 180–191. [Google Scholar] [CrossRef]
  29. Barszcz, T.; JabŁoński, A. A novel method for the optimal band selection for vibration signal demodulation and comparison with the Kurtogram’ ski. Mech. Syst. Signal Process. 2011, 25, 431–451. [Google Scholar] [CrossRef]
  30. Antoni, J. The infogram: Entropic evidence of the signature of repetitive transients. Mech. Syst. Signal Process. 2016, 74, 73–94. [Google Scholar] [CrossRef]
  31. Miao, Y.; Zhao, M.; Lin, J. Improvement of kurtosis-guided-grams via Gini index for bearing fault feature identification. Meas. Sci. Technol. 2017, 28, 125001. [Google Scholar] [CrossRef]
  32. Ali Moshrefzadeh, A.F. The Autogram An effective approach for selecting the optimal demodulation band in rolling element bearings diagnosis.pdf. Mech. Syst. Signal Process. 2018, 105, 294–318. [Google Scholar] [CrossRef]
  33. Fuentes-garcía, M.; Maci, G. Evaluation of diagnosis methods in PCA-based Multivariate Statistical Process Control. Chemom. Intell. Lab. Syst. 2018, 172, 194–210. [Google Scholar] [CrossRef] [Green Version]
  34. Li, W.; Peng, M.; Liu, Y.; Jiang, N.; Wang, H.; Duan, Z. Fault detection, identification and reconstruction of sensors in nuclear power plant with optimized PCA method. Ann. Nucl. Energy 2018, 113, 105–117. [Google Scholar] [CrossRef]
  35. Wang, D. An extension of the infograms to novel Bayesian inference for bearing fault feature identification. Mech. Syst. Signal Process. 2016, 80, 19–30. [Google Scholar] [CrossRef]
  36. Case Western Reserve University Bearing Data Center. Available online: http://csegroups.case.edu/bearingdatacenter/home (accessed on 8 March 2019).
Figure 1. Technique routine of kurtogram and P-kurtogram.
Processes 08 01059 g001
Figure 2. Modulation components extraction process.
Processes 08 01059 g002
Figure 3. Weak fault signals extraction based on principal component analysis (PCA).
Processes 08 01059 g003
Figure 4. Results under SNR = −5 dB. (a) Signal. (b) Amplitude spectrum. (c) Kurtogram. (d) Results of fast kurtogram. (e) Eigenvalues. (f) Results of P-kurtogram.
Processes 08 01059 g004
Figure 5. Results under SNR = −10 dB. (a) Signal. (b)Amplitude spectrum. (c) Kurtogram. (d) Results of fast kurtogram. (e) Eigenvalues. (f) Results of P-kurtogram.
Processes 08 01059 g005
Figure 6. Results under signal-to-noise ratio (SNR) = −15 dB. (a) Signal. (b) Amplitude spectrum. (c) Kurtogram. (d) Results of fast kurtogram. (e) Eigenvalues. (f) Results of P-kurtogram.
Processes 08 01059 g006
Figure 7. Results of fast kurtogram and P-kurtogram for inner race fault. (a) Kurtogram. (b) Results of fast kurtogram analysis. (c) Eigenvalues. (d) Results of P-kurtogram.
Processes 08 01059 g007
Figure 8. Results of fast kurtogram and P-kurtogram for outer race fault. (a) Kurtogram. (b) Results of fast kurtogram analysis. (c) Eigenvalues. (d) Results of P-kurtogram.
Processes 08 01059 g008
Figure 9. Results of fast kurtogram and P-kurtogram for outer race fault. (a) Kurtogram. (b) Results of fast kurtogram analysis. (c) Eigenvalues. (d) Results of P-kurtogram.
Processes 08 01059 g009