Article

Mathematical Modeling of RNA Virus Sensing Pathways Reveals Paracrine Signaling as the Primary Factor Regulating Excessive Cytokine Production

by
Jordan J. A. Weaver
1 and
Jason E. Shoemaker
1,2,3,*
1
Department of Chemical & Petroleum Engineering, University of Pittsburgh, Pittsburgh, PA 15260, USA
2
McGowan Institute for Regenerative Medicine, University of Pittsburgh, Pittsburgh, PA 15260, USA
3
Department of Computational and Systems Biology, University of Pittsburgh, Pittsburgh, PA 15260, USA
*
Author to whom correspondence should be addressed.
Processes 2020, 8(6), 719; https://doi.org/10.3390/pr8060719
Submission received: 21 May 2020 / Revised: 12 June 2020 / Accepted: 17 June 2020 / Published: 20 June 2020
(This article belongs to the Section Biological Processes and Systems)

Abstract

:
RNA viruses, such as influenza and Severe Acute Respiratory Syndrome (SARS), invoke excessive immune responses; however, the kinetics that regulate inflammatory responses within infected cells remain unresolved. Here, we develop a mathematical model of the RNA virus sensing pathways, to determine the intracellular events that primarily regulate interferon, an important protein for the activation and management of inflammation. Within the ordinary differential equation (ODE) model, we incorporate viral replication, cell death, interferon stimulated genes’ antagonistic effects on viral replication, and virus sensor protein (TLR and RIG-I) kinetics. The model is parameterized to influenza infection data using Markov chain Monte Carlo and then validated against infection data from an NS1 knockout strain of influenza, demonstrating that RIG-I antagonism significantly alters cytokine signaling trajectory. Global sensitivity analysis suggests that paracrine signaling is responsible for the majority of cytokine production, suggesting that rapid cytokine production may be best managed by influencing extracellular cytokine levels. As most of the model kinetics are host cell specific and not virus specific, the model presented provides an important step to modeling the intracellular immune dynamics of many RNA viruses, including the viruses responsible for SARS, Middle East Respiratory Syndrome (MERS), and Coronavirus Disease (COVID-19).

1. Introduction

Respiratory infections are a constant threat to public health with deadly infections often characterized by cytokine storms, i.e., overly aggressive innate immune responses that result in severe, unnecessary lung tissue inflammation. Influenza causes an annual 3–5 million infections and 290,000–650,000 deaths [1]. The disease presents a significant pediatric burden, causing 374,000 annual hospitalizations of children under 1 year old, globally [2]. Currently, the new Severe Acute Respiratory Syndrome of the novel Coronavirus (SARS-COV2), responsible for the disease COVID-19, has emerged, resulting in over 113,000 deaths in the US to date. Both influenza and SARS-COV2 are RNA viruses, and the data to date suggests that cytokine storms are a common feature of both viruses during severe infections [3]. Immune responses can help or hinder an organism’s ability to overcome an infection, and excessively, inflammatory responses, like cytokine storms, can cause greater tissue damage, higher mortality, and slow recovery [4,5]. Vaccination is effective for protecting public health against seasonal influenza; however, when new strains unexpectedly emerge, such as the 2009 novel pandemic H1N1 virus or the 2019 SARS-COV2 virus, new treatment strategies that can be implemented rapidly, and preferably independently of the specific virus, are needed. Immunomodulatory treatments that aim to reduce inflammation while still managing virus growth are a promising approach to protecting against emergent disease, but several fundamental questions on how unnecessarily aggressive immune responses emerge remain unknown. Mathematical modeling can help quantify the kinetics of the interactions that define the immune system, revealing the interactions that are most likely to be responsible for unnecessarily aggressive responses and potential targets, to interfere with immunity to ensure healthy virus clearance.
The first step to occur during an immune response is the detection of the pathogens, leading to the early, localized, innate immune response [6]. This response to viral infection leads to the production of type I interferons (IFNs). Interferons serve to establish an antiviral state by activating and inducing Mx proteins, RNA-activated protein kinase, and the 2-5A system [7]; they also regulate other immune responses, by acting on natural killer cells, T cells, B cells, dendritic cells, and phagocytic cells [8]. The presence of influenza virus is primarily sensed by cytoplasmic retinoic acid-inducible gene 1 (RIG-I) and endosomal Toll-like receptors 7 and 9 (TLR) [9,10]. RIG-I senses viral RNA in the cytoplasm [11], but is antagonized by many influenza A viruses’ nonstructural protein I (NS1) to varying, strain-specific magnitudes [12,13]. TLR7 is free of this antagonism [14,15], and is activated after the influenza envelope has been degraded by endosomal proteases. SARS-CoV’s N protein has been implicated in the inhibition of Type-I interferon production via antagonism of RIG-I [16,17]. This suggests RIG-I as a common viral sensor protein and a common target of antagonism for RNA viruses. The activation of either sensor leads to the phosphorylation of interferon regulatory factor 7 (IRF7, IRF7P) and the production of interferons (IFN), to act as a signaling cytokine. IFN induces secondary messenger molecules, ultimately leading to the induction of immune modulation and antiviral genes [18]. IFN is secreted from the infected cell and sensed through the Janus kinase/signal transducer and activator of transcription pathway (JAK/STAT), in both an autocrine and paracrine manner. The JAK/STAT pathway leads to the induction of a broad family of IFN-stimulated antiviral genes [19], as well as the supplementary (autocrine) or novel (paracrine) production of IFN. These IFN-stimulated genes cause cell death through apoptosis, necroptosis and pyroptosis [20], slow viral replication within the cell [21], regulate the infiltration and activity of key innate immune cells to clear the infection, and help initiate the adaptive immune response [22].
The current models of innate immune response to RNA virus infection lack major intracellular components or lack important biological interactions, limiting their applicability to understanding how severe inflammation emerges. Extensive molecular pathway maps exist [6,23], but they currently lack mathematical description to support simulating the immune response. Some models of the intracellular innate immune response have incorporated RIG-I and TLR activity, but consider their effect to be constant, independent of the viral load, and the models are inherently unstable, complicating their use [24,25]. These models used ordinary differential equations (ODEs), a common approach in systems biology, after their demonstrable success in analyzing the robustness of biological signaling [26,27,28], the highly dynamic behaviors of NF-kB [29], and ultrasensitive cell fate binary responses [30]. ODEs allow for interpolation of the dynamics between a finite number of time points at which data has been measured, based on hypotheses of the mechanisms regulating the system’s components.
In this study, we construct a novel ODE model to simulate the intracellular innate immune response of human bronchial epithelial cells (HBECs) to influenza A infection and use the model to determine the interactions that most affect cytokine production. This model was constructed with computational expense for parameterization and eventual agent based model implementation in mind, with a minimum number of ODE’s and parameters that capture the dynamics of interest. The model is numerically stable under realistic conditions and non-stiff, enhancing its reproducibility and reducing computational cost. The model incorporates a viral growth model [31] and the proportionality of sensor protein activity to vRNA levels in the cytoplasm, the first such integration of cell dynamics and viral replication. The feedback of interferon production on viral replication through the interferon stimulated gene (ISG) family [32] is included. A literature search for data to perform parameterization produced viral titers [33,34] and the time-series of RNA data in HBECs [35]. RNA data originated from Shapira et al.’s 2009 work elucidating a network of viral-host interactions via genome wide expression profiling. Viral titers came from Ramos et al.’s 2013 work on the polyadenylation stimulating factor 30 (CPSF30) binding function of the NS1 protein. These consist of subsets, in which competing, parallel pathways were inhibited, allowing for improved identifiability of the model parameters; first, a wild-type A/Puerto Rico/8/1934 Influenza A (PR8) infection, in which RIG-I is assumed fully antagonized and TLR is fully active; and second, an NS1 knockout PR8 strain which has both TLR and RIG-I activity [35]. The antagonism of RIG-I in wild-type PR8 infection is shown to drastically alter infection outcomes. Additionally, some parameters were sourced from or bounded by their respective values in previous models. This work establishes the first cell-level model of interferon signaling induced by influenza infection that can be used to compare host responses between infections with different influenza viruses, antagonism motifs and different RNA viruses. Paracrine signaling is demonstrated to produce the majority of HBEC’s cytokine response to influenza infection, while the initial sensor protein pathways are shown to serve as an ignition for said paracrine signaling.

2. Materials and Methods

2.1. Model Construction

Upon initial viral entry to the cell, there is an eclipse phase, during which the virus enters the cell, traffics to the nucleus, and starts the replication process [36]. Analogously, a whole-organism infection with influenza A observes an eclipse phase before significant viral titers and immune response are seen [32,37]. As the virus replicates within the cell, the concentrations of single-stranded viral RNA (vRNA) and NS1 in the cytoplasm rise until cell death. Intuitively, the magnitude of action of the sensor protein TLR should increase proportionally to the vRNA levels. RIG-I’s activity level will also be proportional to the vRNA level, but inversely proportional to the NS1 concentration.
A model of IFN production, virus sensing, and JAK/STAT feedback was built to reflect these mechanisms. The initial model was unstable; such models fail to capture important aspects of the dynamics of shutdown and steady-state transitions. The complete model had degradation rates for environmental type-I interferons (IFNe), interferon regulatory factor 7 and its phosphorylated form (IRF7, IRF7P) added to assist in stability. For each modeled interaction, mass action was assumed if no other information was available on the reaction kinetics, unless an existing literature model had specific evidence for the representation of the step in some other form, in order to maintain a minimum number of parameters. The IFN Hill type kinetic was selected based on in vivo data from mice, which showed that IFN has an ultrasensitive response to viral load. Equations (7) and (8) were added to incorporate the classical model of virus kinetics [31,32], to model virus concentration within the cell, infected cell counts, and type-I interferons’ effects on viral replication. The use of viral counts, [V], in Equation (2), makes the sensor proteins’ actions proportional to virus level. RIG-I’s action is modeled as a mass-action kinetic, while TLR is modeled separately, as a Hill-type kinetic. All Type-I Interferons are considered indistinguishable in the complete model, as are the different STAT species. The transport of interferons from the cytoplasm to the extracellular space is now represented with a first-order mass transfer kinetic. Qiao et al. [24] implemented Michaelis–Menten (MM) for this transport step; this was rejected due to a lack of evidence for any specific MM-type mechanism, and the redundancy of limiting maximum IFN concentrations with the introduction of degradation rates. Finally, the binding of interferons and the activation of the JAK/STAT pathway [24,25] was reduced to constants in a form reminiscent of a Hill kinetic. The production of cellular species were made proportional to the living cell population, [P].

2.2. Data Sources

Three primary literature sources were used for data to estimate model parameters. First, micro array gene expression data [35] of two influenza strain (PR8 and an NS1-knockout PR8) time-course experiments in human bronchial epithelial cells (HBECs) were used to fit IFN, STATP, and IRF7 gene expression. Second, viral titers of wild-type PR8 influenza in human lung adenocarcinoma epithelial (A549) cells [34] and NS1-knockout PR8 [33] were used to fit viral titers. Viral titers would ideally be obtained with the same cell type, time points, and infection methodology as the micro-array data; however, the immune response similarity of A549 cells and HBECs [38] justifies this approach.

2.3. ODE Simulation and Sensitivity Analysis

Julia v1.3 was used to simulate the ODE model with the DifferentialEquations v6.11.0, ParameterizedFunctions v4.2.1, and DiffEqParamEstim v1.12.0 packages. The ODE system is solved with the non-stiff solver VERN7. A Sobol method global sensitivity analysis was conducted to determine the degree of control that each parameter exerted on the system. Julia’s DiffEqSensitivity v6.7.0 was used for this analysis.

2.4. Model Parameterization

Since the ODE system relies on 15 unknown parameters, simple regression methods are insufficient to successfully parameterize the model. Instead, a parallel temping Markov chain Monte Carlo method (PT MCMC) was implemented in Julia v1.3. To initialize the parameters, a literature search and manual fitting methods were conducted. The literature search provided estimated decay rates for STATP [39], IRF7 [40], and IRF7P [41]. A manual fitting gave estimates and stability-based bounds for cell death (k61), viral replication (k71), and nonspecific viral clearance (k73) rates. Estimates from the Qiao model [24] were used to initialize the remaining parameters. Since parallel tempering results in faster convergence than single-chain methodologies [42], PT MCMC was run with 1 million iterations with three parallel chains, for a total of three million samples per fitting attempt. The sum squared error minimized by the MCMC was:
S S E = i = 1 S m j = 1 T 1 ( O i j N i j ) 2 + n k = 1 T 2 ( E k V k ) 2 ,
The left-hand portion of the objective function determines the error of the system dynamics, where Oij is the experimentally observed log-fold change of Species i at Time j [35], relative to a control RNA level of the same species and time point. Two points from biological replicates are available for each i,j pair. Intracellular interferon and IRF7 were directly tracked by their RNA levels. Because phosphorylated STAT cannot be measured using microarray, the RNA levels of Interferon-induced GTP-binding Protein Mx1 (MX1), which is induced primarily by the action of STATP [6], were used as a proxy for STATP levels. Next, n is a weighting factor. Ek is the normalized literature viral titer estimate at Time k [33], and Vk is the normalized calculated viral titer at Time k.

2.5. Structural Identifiability

The structural identifiability of an ODE system is a prerequisite to parameter estimation and the subsequent application of the model. A common problem in ODE representations of biological systems is a lack of identifiable parameters, leading to non-unique parameter sets [43]. Structural identifiability analyses were carried out with structural identifiability taken as extended-generalized observability with lie derivatives and decomposition [44] (STRIKE-GOLLD) in MATLAB R2019a. These analyses were done under two sets of conditions—perfect identifiability and practical identifiability. Under perfect identifiability conditions, all seven species are assumed to be perfectly observed (i.e., measured directly by experiment). Under practical identifiability, only IFN, STATP, IRF7, Cells, and Virus were considered to be observable, which reflects the availability of data under which the model was trained. Structural identifiability results are available in Appendix A.

2.6. Interparameter Correlation

Parameter correlation in MCMC training results was tested using Pearson’s correlation coefficient from SciPy v1.4.1 in Python 3.6.8. Significant correlations were considered as those with a correlation coefficient > ±0.5 [45].

3. Results

3.1. ODE Model

The model consists of seven ordinary differential equations (states) with three fixed parameters and 15 unknown parameters. The complete model is given in Equations (2)–(8) and illustrated graphically in Figure 1.
d [ I F N ] d t = [ P ] ( k 11 [ R I G I ] [ V ] + [ T L R ] k 12 [ V ] n k 13 + [ V ] n + k 14 [ I R F 7 P ] ) k 21 [ I F N ] ,
d [ I F N e ] d t = k 21 [ I F N ] [ I F N e ] τ 2 ,
d [ S T A T P ] d t = k 31 [ P ] [ I F N e ] k 32 + k 33 [ I F N e ] [ S T A T P ] τ 3 ,
d [ I R F 7 ] d t = [ P ] ( k 41 [ S T A T P ] + k 42 [ I R F 7 P ] ) [ I R F 7 ] τ 4 ,
d [ I R F 7 P ] d t = k 51 [ P ] [ I R F 7 ] [ I R F 7 P ] τ 5 ,
d [ P ] d t = k 61 [ P ] [ V ] ,
d [ V ] d t = k 71 [ P ] [ V ] 1 + k 72 [ I F N e ] k 73 [ V ] ,
Equations (2)–(6) are measured in units of μM, thus, the right-hand side of each equation in in units of μM h−1. All species except [P] and [V] are in units of μM. [TLR] and [RIGI] are set to unity and represent the presence of the sensor proteins. [P] represents the number of productive, infected cells present divided by the initial count of said cells; [P] = (live cells)/(initial cells). Since a multiplicity of infection (MOI) of 5 [35] results in 99.3% of target cells becoming infected [46], it is assumed that the entire cell population is producing new viral particles at the start of the trial. [P] will thus vary from 1 to 0 and is unitless. State 7, [V], represents a virus concentration normalized to the maximum amount observed; [V] = (virus concentration)/(max virus concentration). These values can take on molarity, PFU, or similar matching units; [V] is unitless and can vary from 0 to 1. The viral titers [33,34] are in units of PFU mL−1, and the maximum measure was the 24-h observation of wild-type PR8. A [V] value > 1 is possible for viral strains with higher peak viral loads than wild-type PR8 and at model timespans greater than 24 h.

3.2. MCMC Parameterization

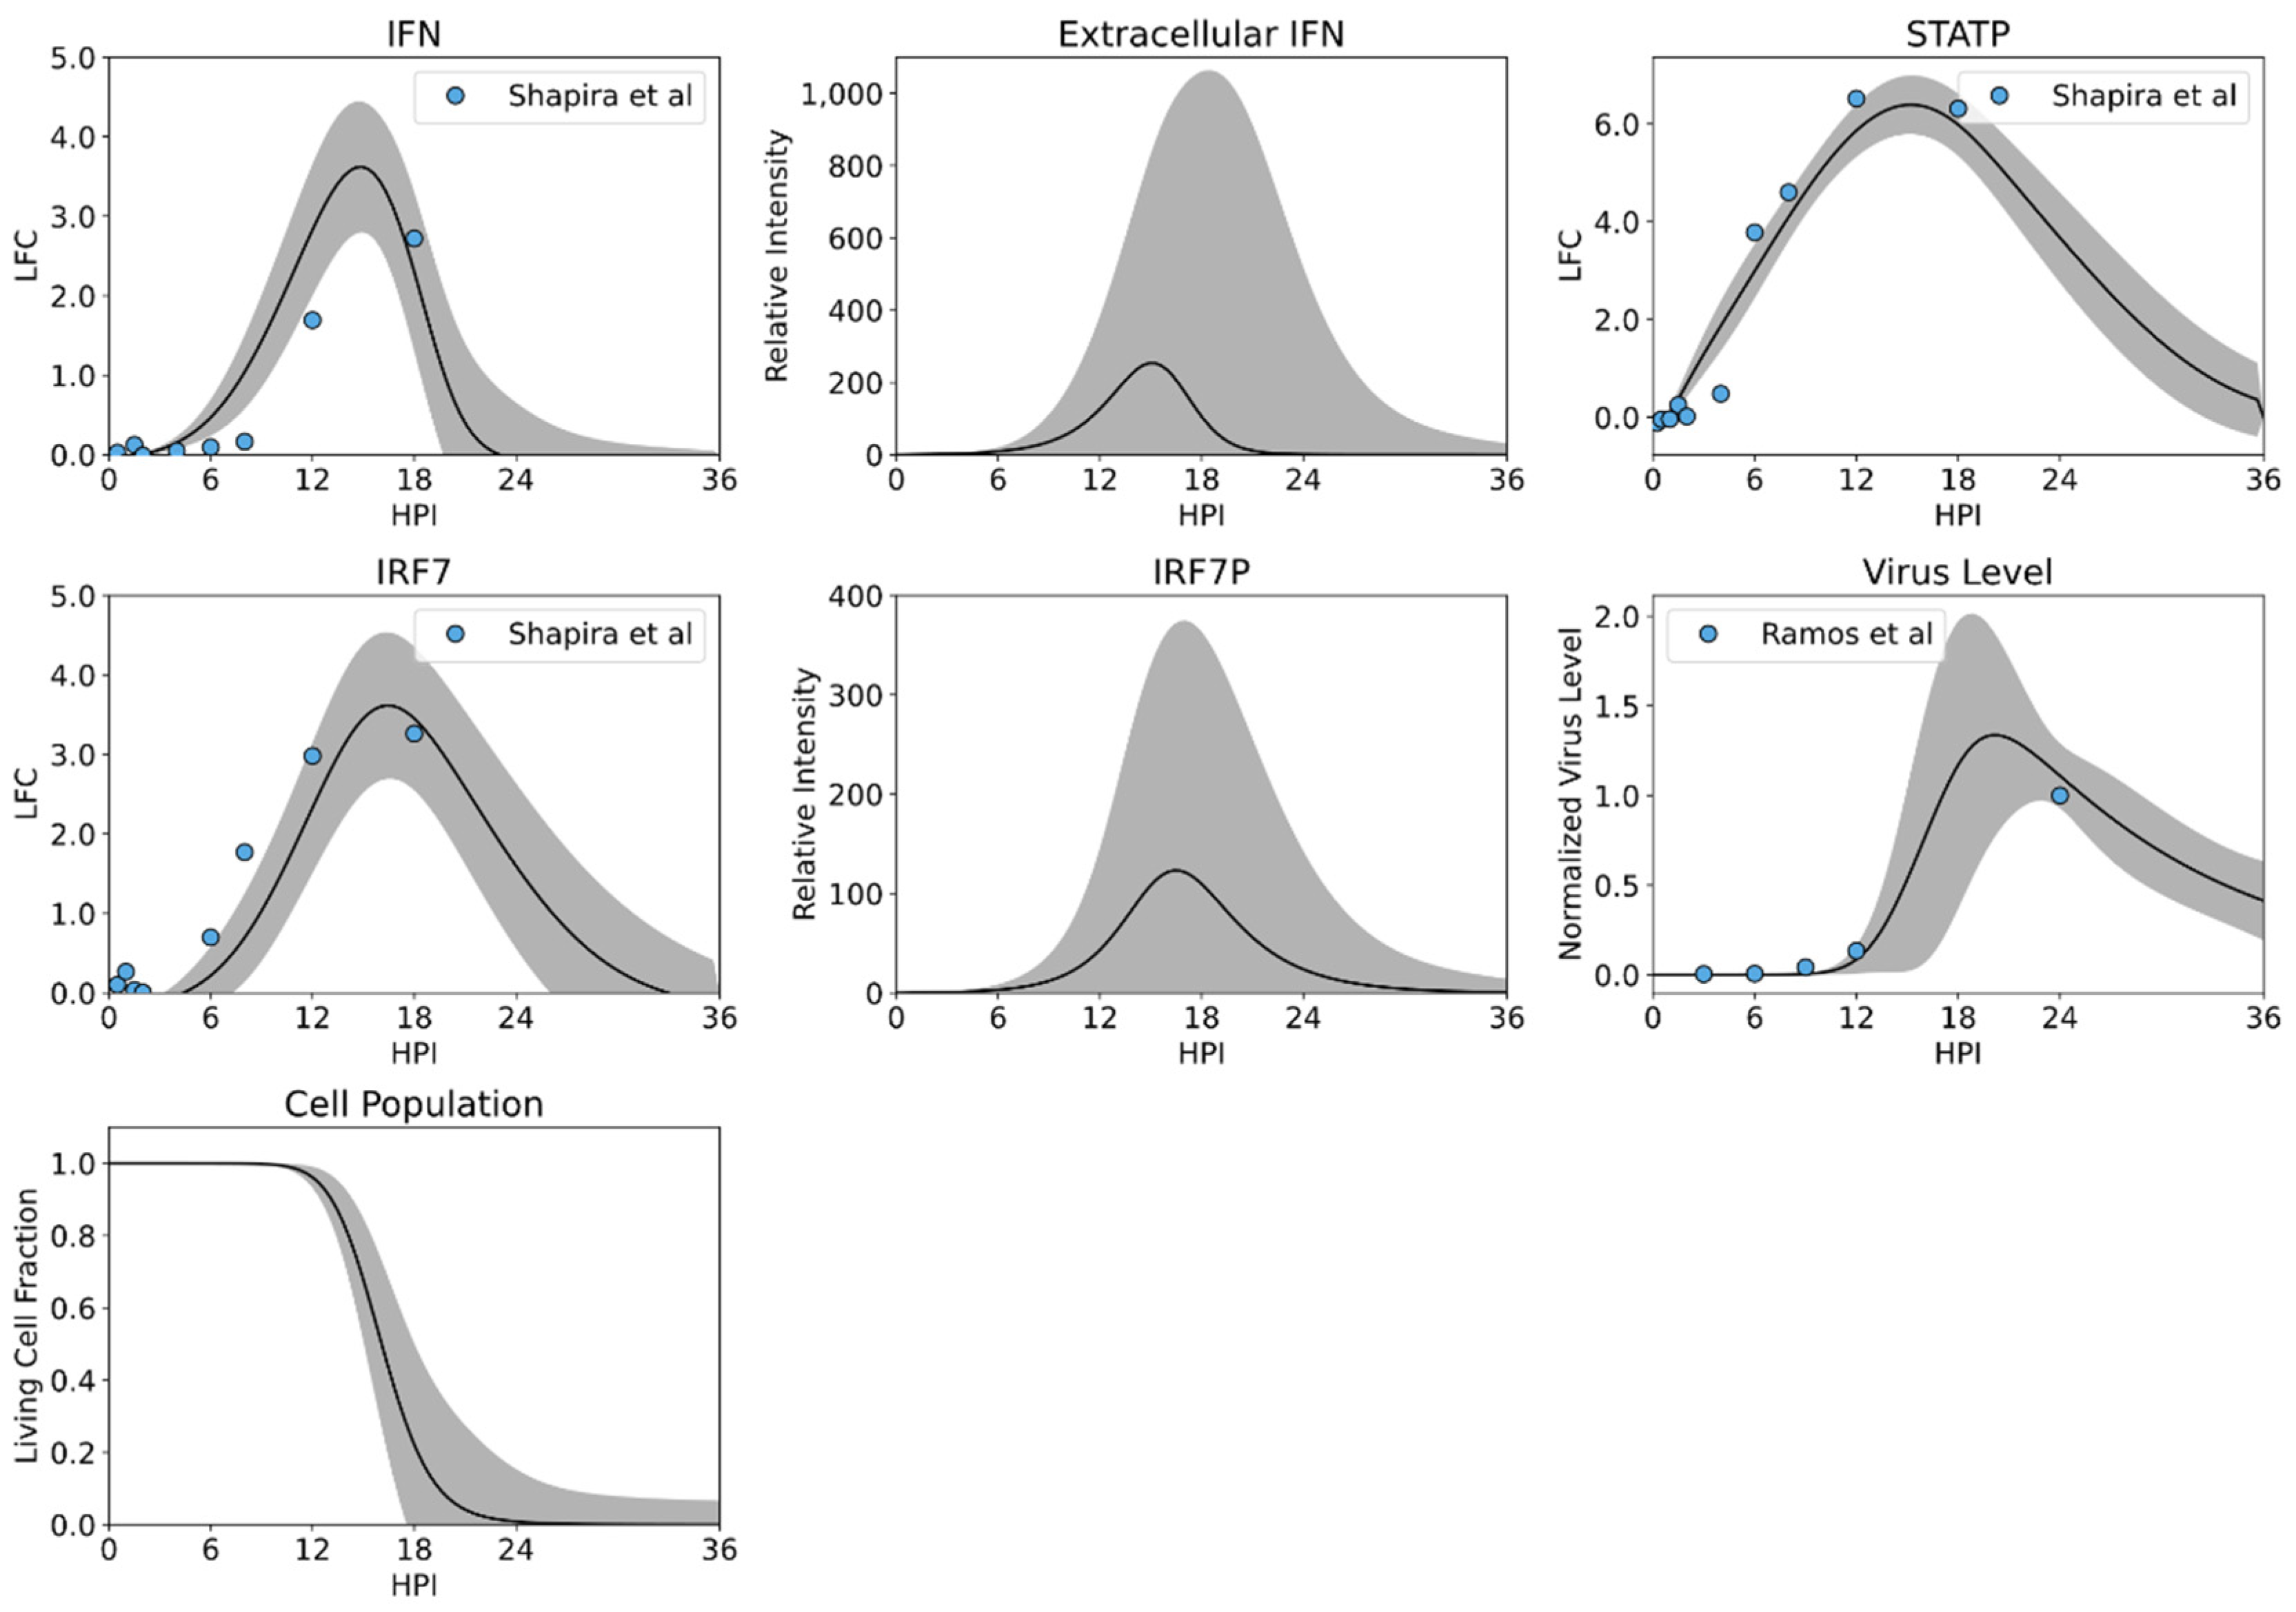
During parameterization, the system was simulated out to 48 h post infection (HPI); only the first 36 h are shown here for clarity. All accepted parameter fits require the system to be stable, returning to zero after the infection has run its course. In this system, the multiplicity of infection is 5 [35], leading to 99.3% of all cells being initially infected [46]. Shapira et al.’s [35] experiments were carried out in vitro, without any immune cell presence. Thus, the model does not incorporate immune cell presence or phagocytosis, and it was assumed that all cells will die solely because of viral effects. The steady state for the model is complete cell culture death and the eventual decay of all species. The parameter set with the lowest SSE is shown in Figure 2.
The parameterization of the ODE model was accomplished with a parallel tempering Markov chain Monte Carlo (MCMC). The first 103 iterations comprised burn-in, a period where the MCMC algorithm was searching parameter space for potential local minima. This can be seen in the acceptance ratio (Figure 3A) and sum squared error (Figure 3B).
The MCMC algorithm would ideally accept new parameters 23% of the time [47]; for this parameterization, the acceptance ratio of the primary chain was 19%. This was considered acceptable. Further hyperparameter tuning to obtain exactly 23% acceptance was possible, but not pursued. The overall fit of the model, as quantified by the sum squared error (SSE) (Section 2.4), is shown in Figure 3B. After burn-in, no trend towards fit improvement is observed, despite high-temperature chain exploration for other local minima, thus, the MCMC fitting algorithm is considered to be sufficiently converged. Two additional optimizations of the same length were run with randomized starting parameter values, which converged to parameterizations with the same SSE value and ranges as Run 1. The parameterization with the lowest SSE was used. The values for this parameterization are given in Table 1, along with their origin.
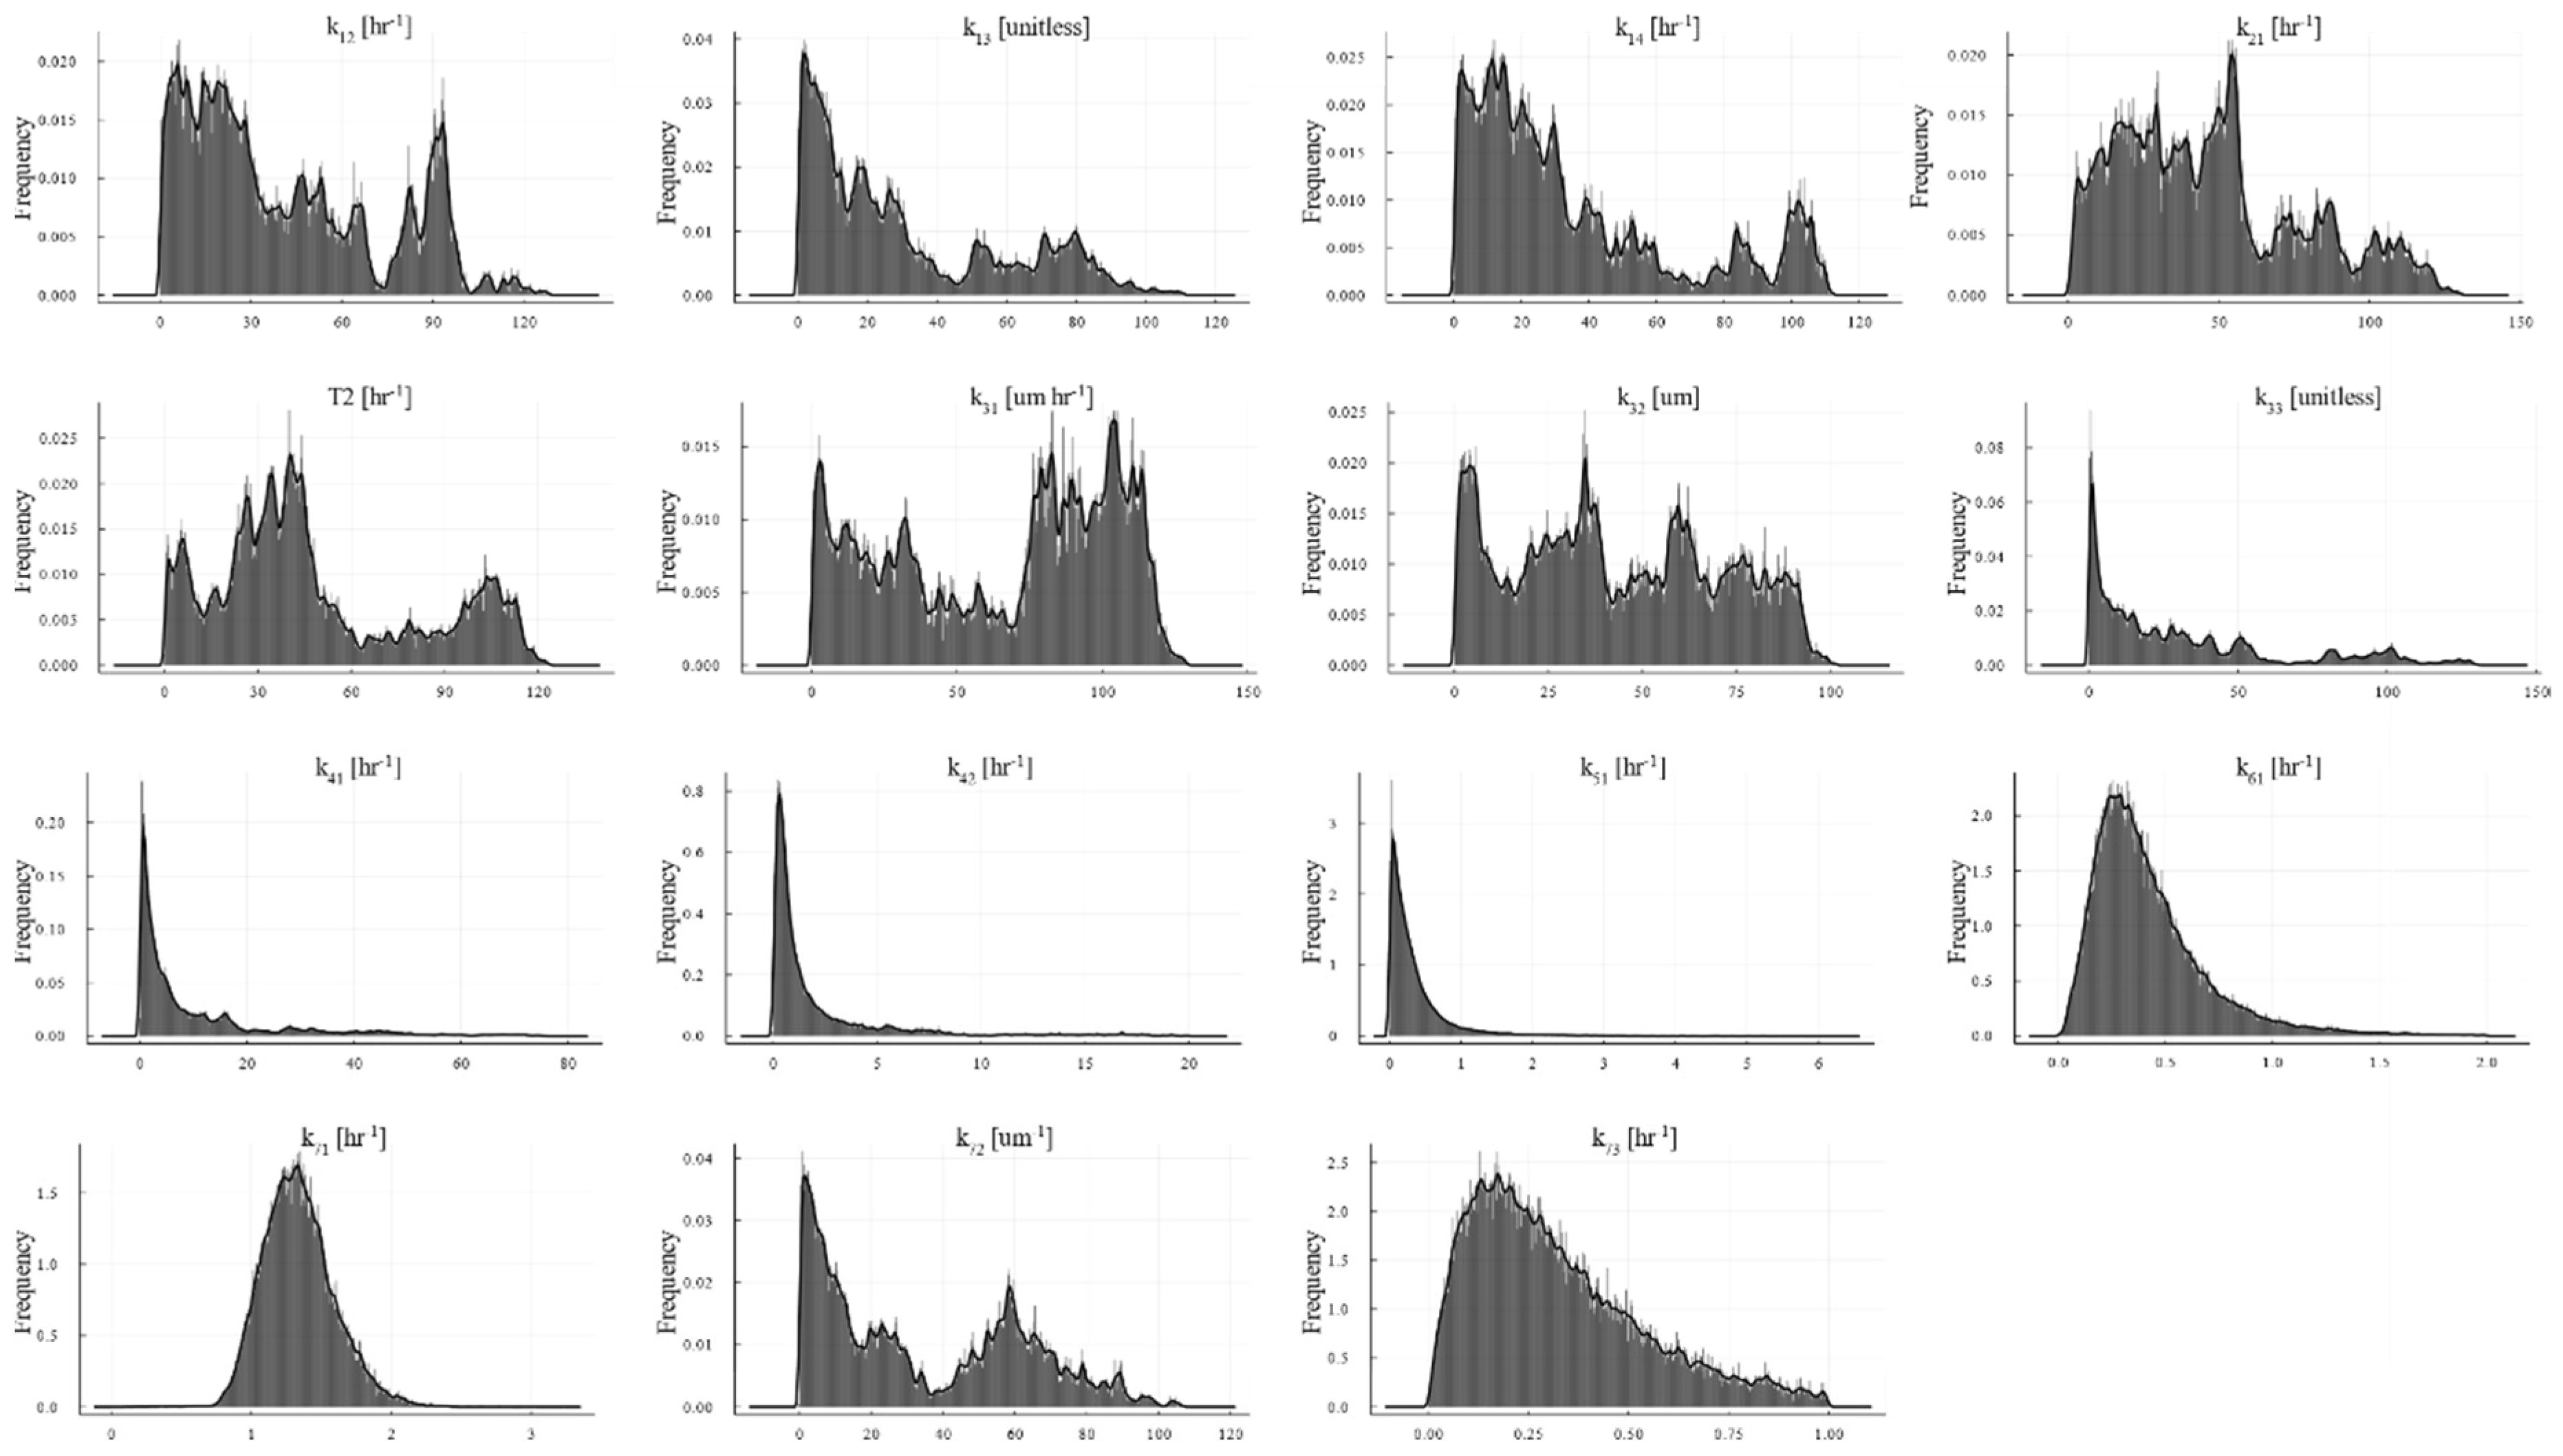
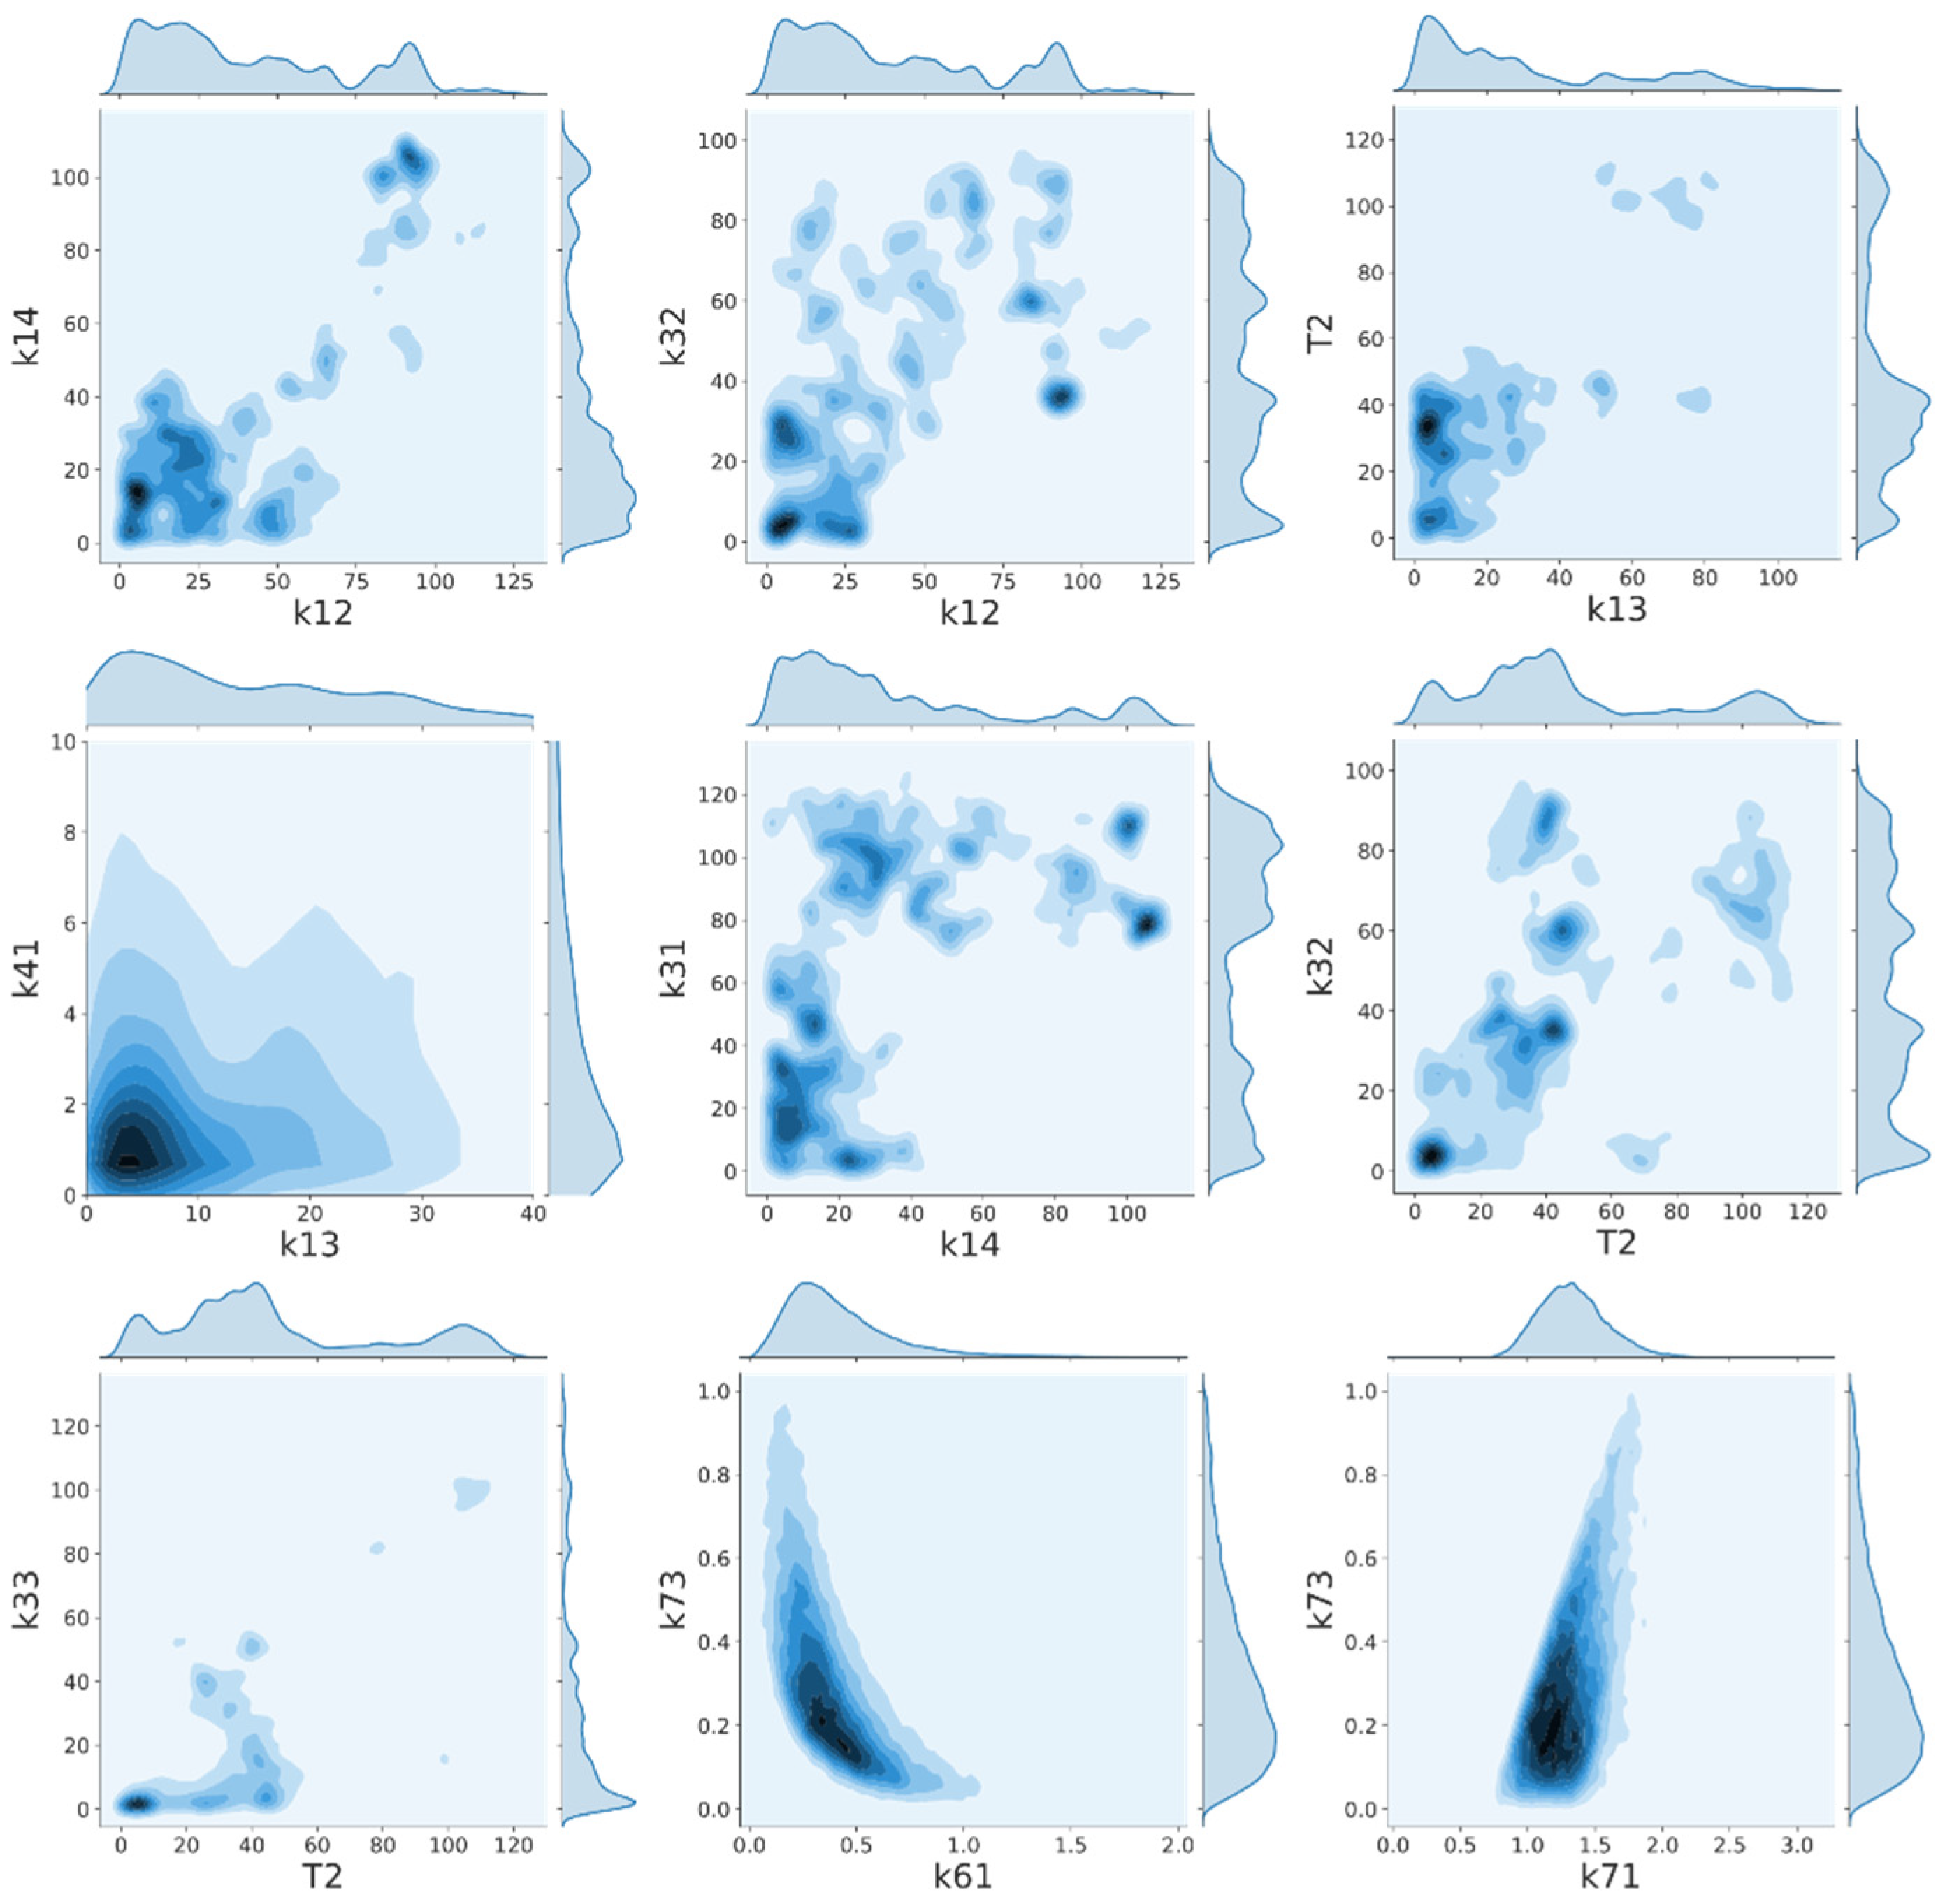
The parameter distributions are shown in Figure 4. The lack of normalcy was a possible indication of interparameter correlation. This correlation was tested using the Pearson correlation coefficient. Nine significant correlation pairs were identified, and are shown in Figure 5. The magnitude of correlations for all parameter combinations is summarized in Appendix B, Table A1.
High correlation and non-normal distributions were not unexpected, and are a frequent challenge in fitting nonlinear, biological signaling systems. Several model features, namely multiple parameters affecting the same species and the presence of feedback loops by nature, necessitate a correlated random walk to maintain or improve the model’s fit. This manifests as a lower than expected acceptance ratio, which can be overcome by hyperparameter tuning if undesirably slow parameter space exploration results.

3.3. Model Validation by Predicting Response to Infection Using a NSI Knockout Influenza Virus

Once the model was trained, a validation study on a nonstructural protein 1 (NS1) knockout strain of PR8 influenza (dNS1PR8) was conducted. Since NS1 was assumed to be fully antagonizing the action of the sensor protein RIG-I during the initial training, the kinetic parameter (k11) associated with RIG-I was unfit and assumed to be zero (unitless). It was manually estimated at 105 (unitless) for the dNS1PR8 simulation, based on the same SSE function as the MCMC parameterization. All other parameters maintained their values from the wild-type PR8 training. An ensemble of the top 1000 model parameterizations from the wild-type training were simulated with the nonzero k11 term and plotted against the NS1 knockout data [35]. The validation model simulation results are shown in Figure 6.
The validation case lends credence to the underlying model structure; a different combination of sensor proteins and a modified strain of influenza can be modeled only by introducing a new term for the previously antagonized RIG-I. The validation simulation shows several key differences. First, the interferon and extracellular interferon peaks are larger in magnitude and occur faster than in the wild type, in good agreeance with microarray data. Second, the viral load is 96% lower than the wild type, which agrees with the viral titer data [33]. Finally, the simulation predicts that only 20% of infected epithelial cells die, regardless of the simulation’s time frame. While this qualitatively agrees with the much lower lethality of the dNS1PR8 strain, it does not reflect the biological expectation of certain cell death after the infection of all epithelial cells, regardless of viral strain. Overall, the validation study suggests that the model structure is sound and is capable of novel predictions.

3.4. Sensitivity Analysis Reveals IRF7 Phosphorylation as Critical Step

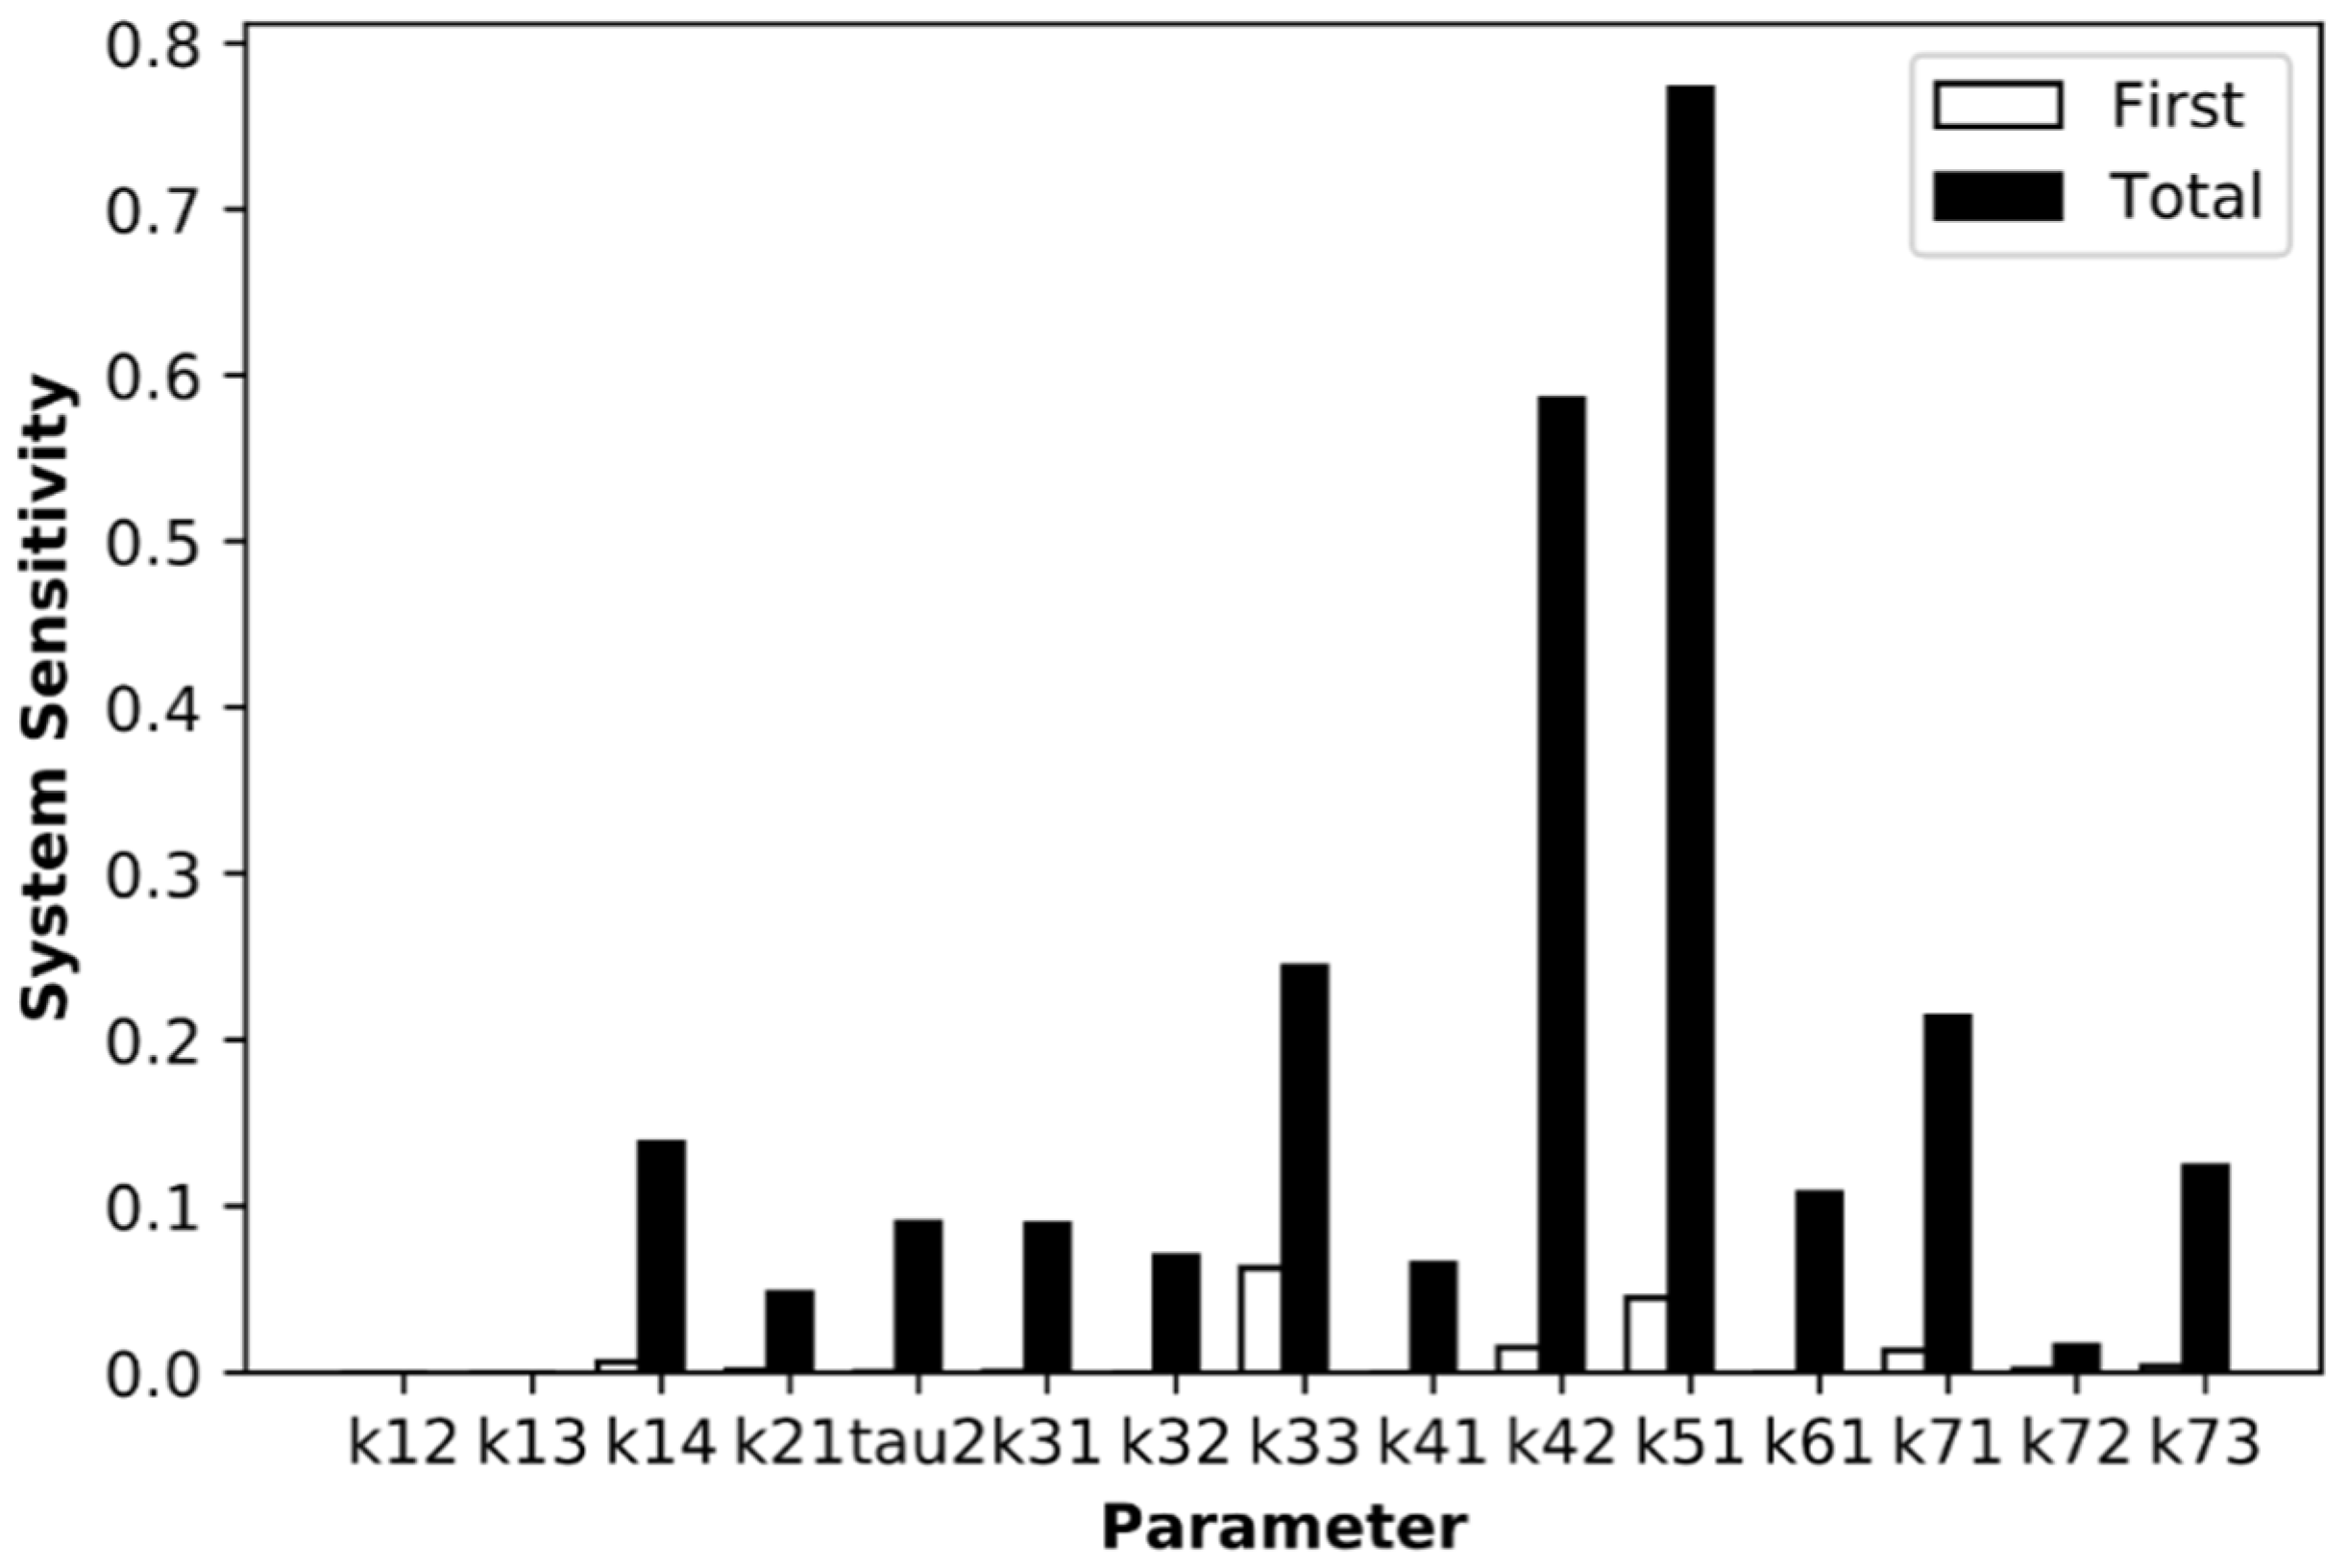
A Sobol global sensitivity analysis was conducted, allowing each parameter to vary over the same parameter space that the MCMC algorithm explored in the initial training. The resulting system sensitivities are shown in Figure 7.
The most sensitive parameters are those which exert the most control over the innate immune response. Notably, the initial sensing of the virus’ presence via TLR (k12) contributes a relatively small proportion of the overall system response; most of the immune response originates from the paracrine signaling pathway. Parameters k42 and k51 correlate to the phosphorylation of IRF7 to IRF7P, and the induction of additional IRF7 by the action of IRF7P, respectively, which dominate the paracrine signaling pathway. Thus, the sensitivity analysis suggests that the model’s outcomes are strongly controlled by these two interactions.

3.5. Simulating Varying Levels of RIG-I Antagonism Reveals Robust Sensor Protein Action

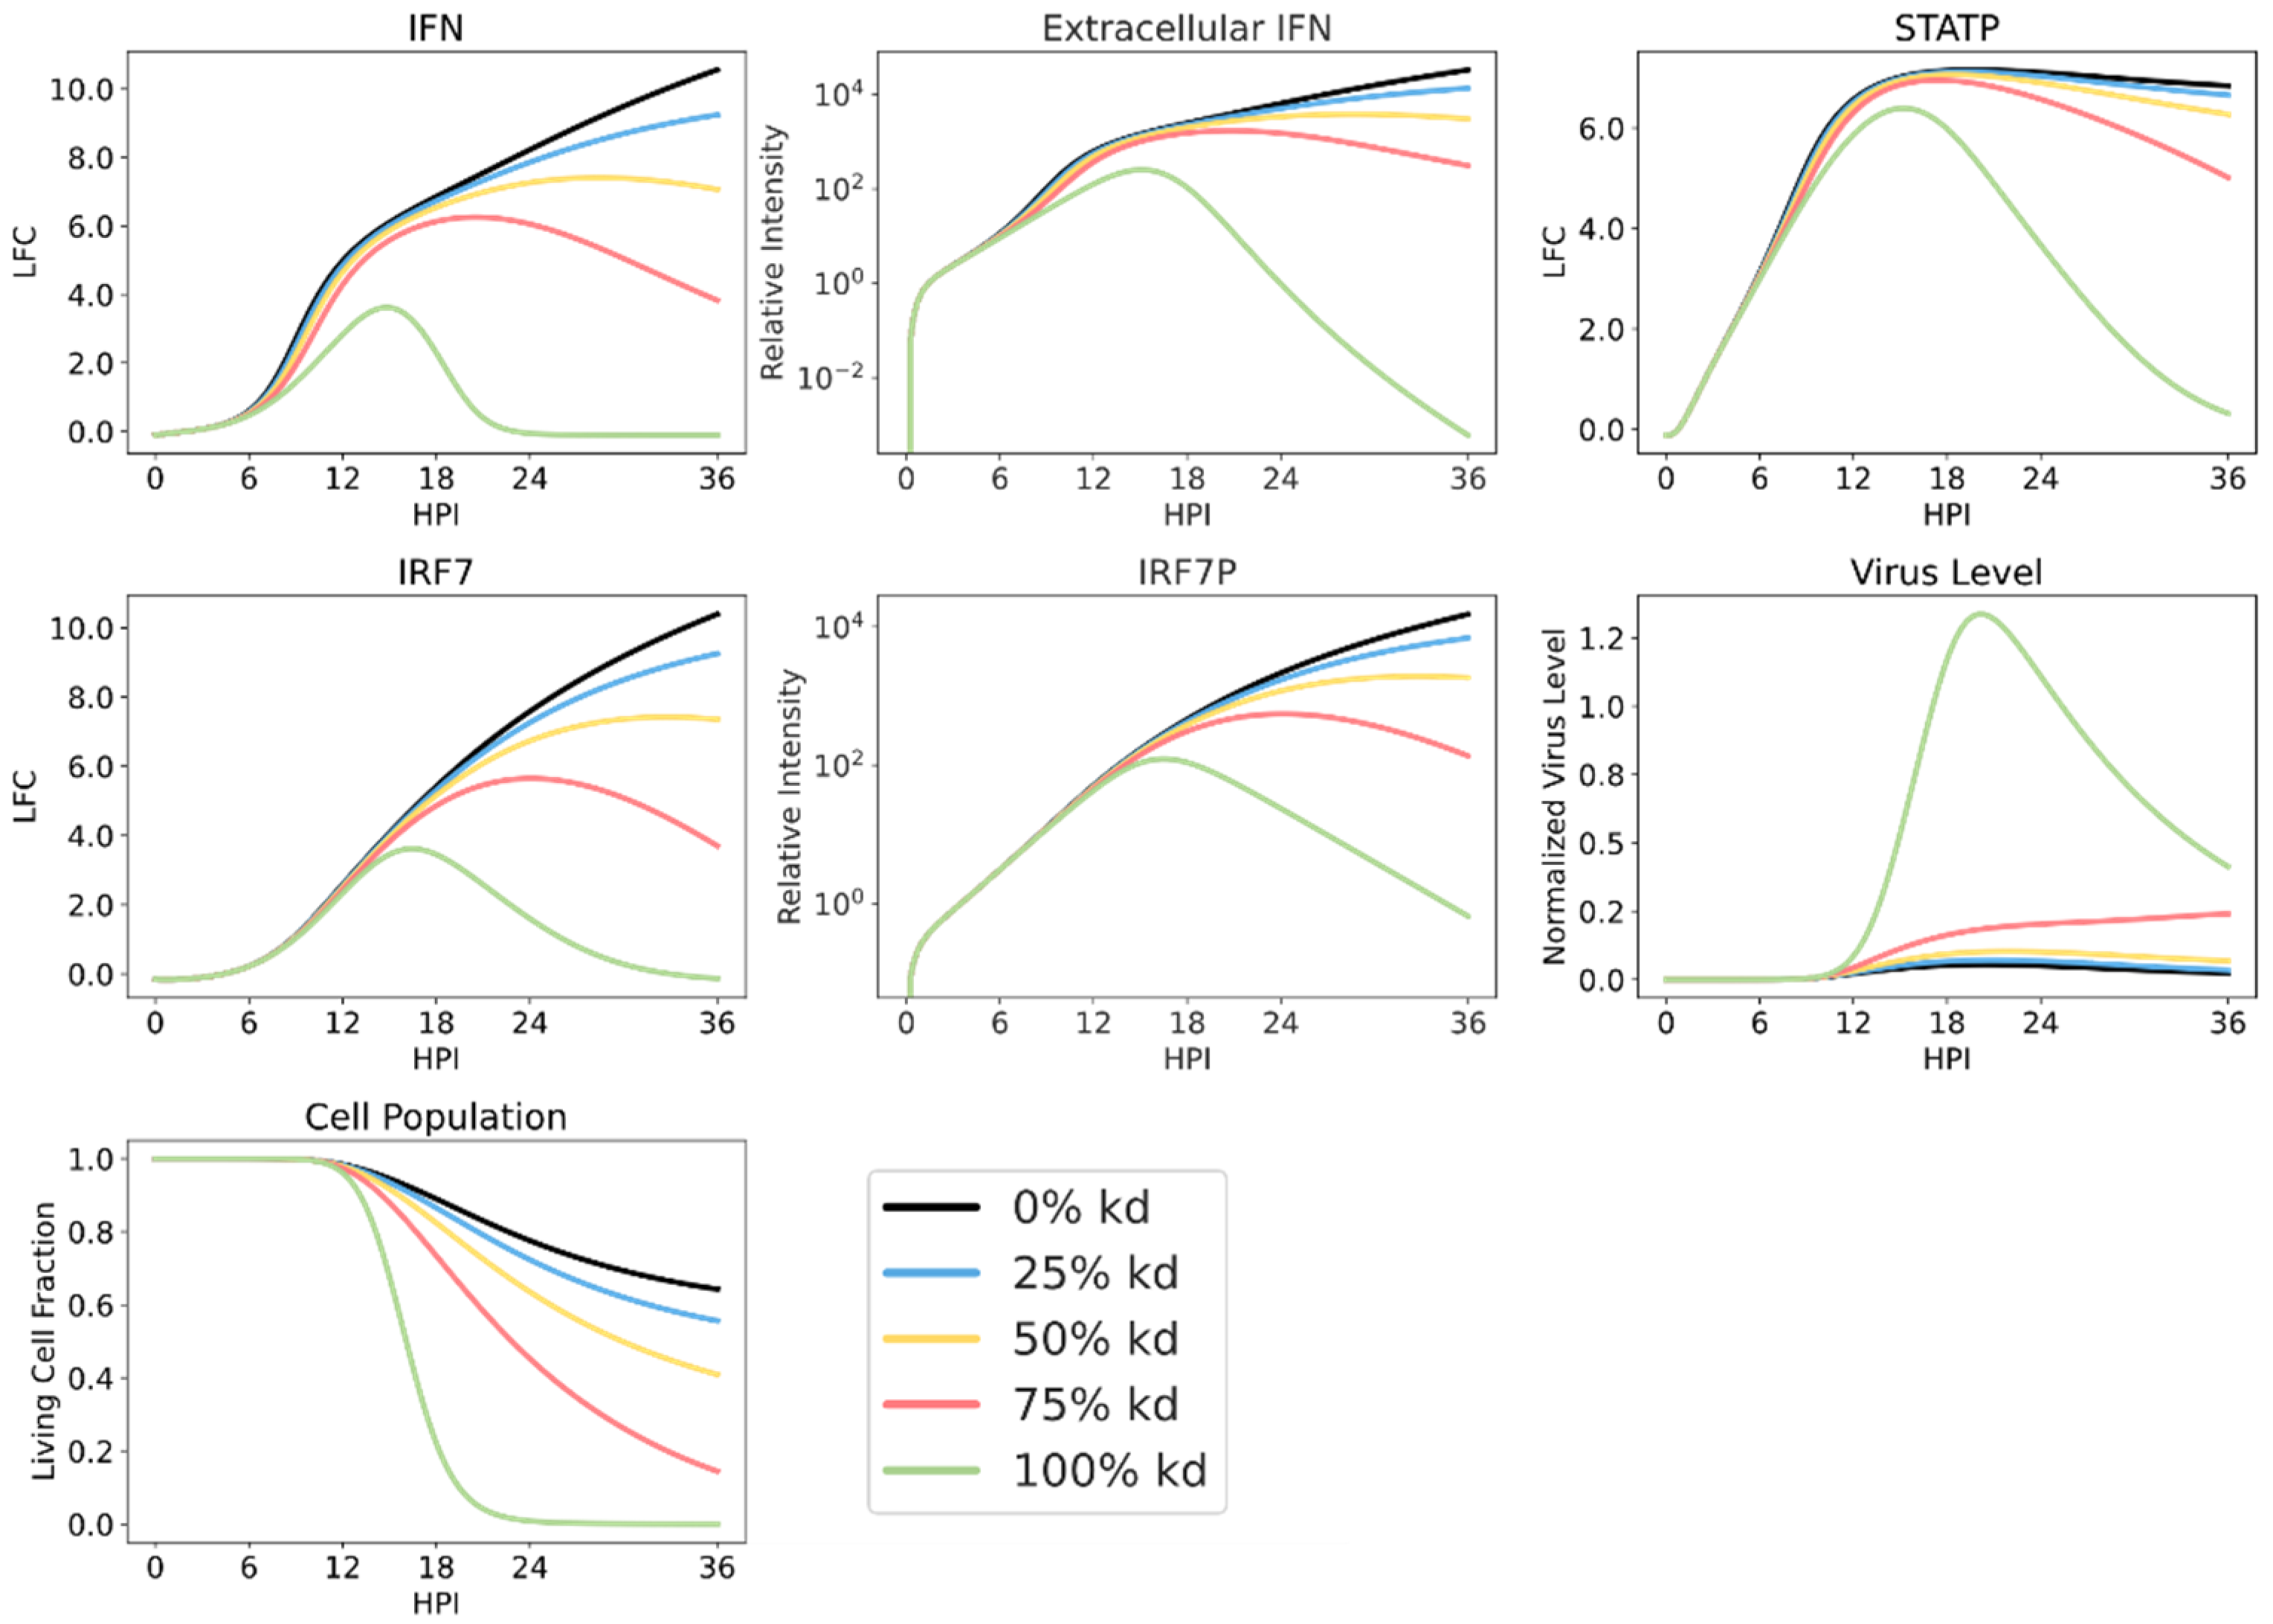
Next, an in silico knockdown study of RIG-I was performed. This study is comparable to varying the production and effectiveness of the NS1 protein across several influenza virus strains [12,13]. This was done by varying the k11 parameter in 25% increments from dNS1-PR8’s lack of antagonism (0% RIG-I knockdown, k11 = 105) to wild-type PR8’s total antagonism (100% RIG-I knockdown, k11 = 0). As shown in Figure 8, any RIG-I activity above zero (0% to 75% knockdown) showed significant reductions in viral load and target cell lethality. 0% knockdown yielded the largest magnitude immune response, as quantified by extracellular IFN, however, 25% through 75% knockdowns showed a robust immune response of near equal magnitude despite the reduction in RIG-I activity. This suggests that RIG-I is robust against viral antagonism and plays a vital role in initializing the host’s cytokine response to viral infections.

3.6. Sensor Protein and JAK/STAT Originated Interferon Production

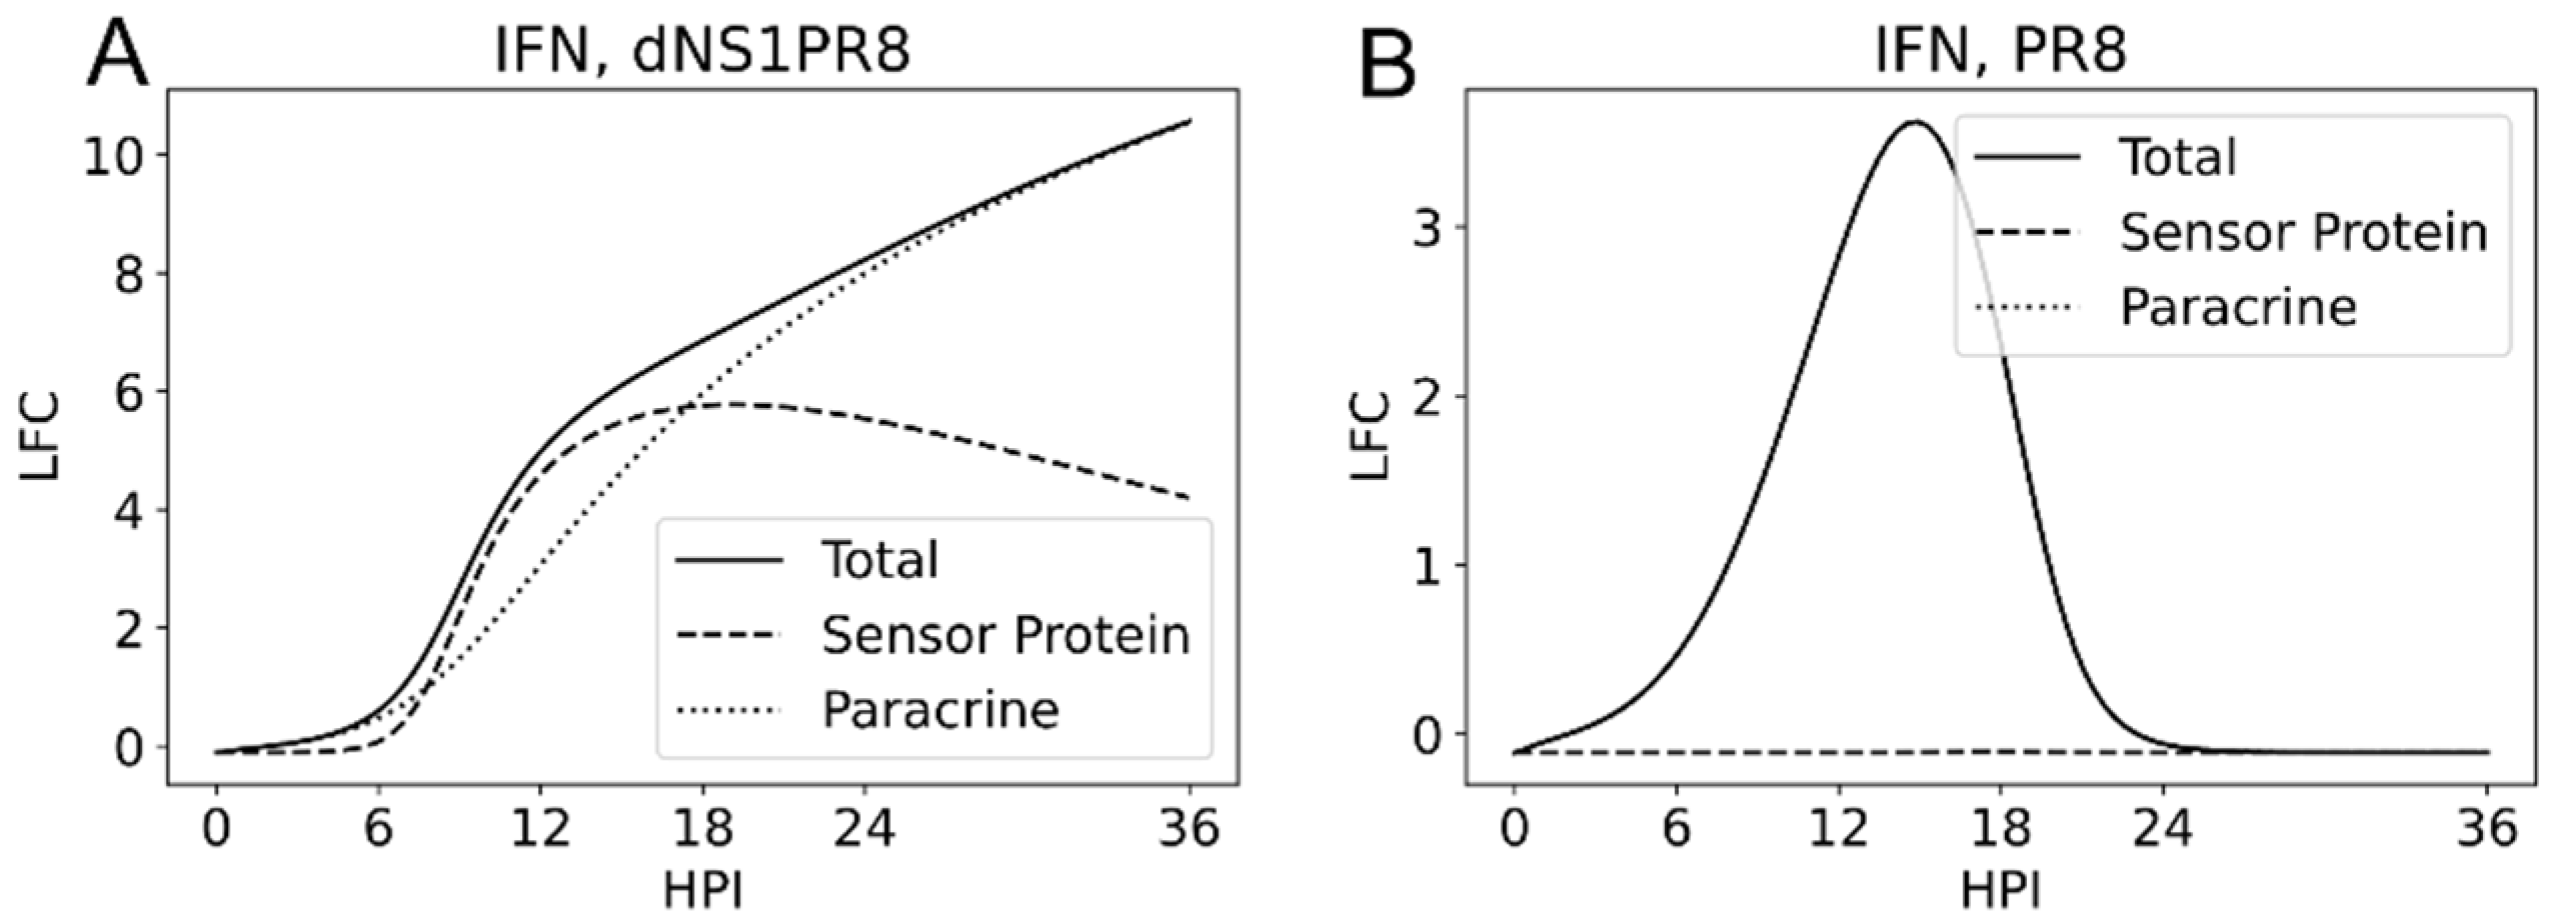
This model incorporates the production of IFN through both sensor protein action and the paracrine JAK/STAT pathway. These contributions to IFN production were isolated in silico, to determine the relative contribution of each pathway under different conditions. Figure 9 demonstrates these contributions for simulated wild-type PR8 and dNS1PR8 influenza infections. PR8 simulation showed almost complete antagonism of the sensor protein signaling, while dNS1PR8 simulation revealed a dynamic interplay between sensor proteins and paracrine IFN production, based on the infection stage. This analysis suggests that paracrine signaling is the major contributor to IFN production, especially in the presence of RIG-I antagonism, and that TLR activity alone is insufficient to trigger a strong immune response to infection.

4. Discussion

In this paper, an ODE model of the intracellular innate immune system’s response to influenza infection was developed and used to evaluate system properties associated with viral lethality and IFN production dynamics. This model considers signaling components not available in previous work, uses unique data for parametrization and validation that perturbs distinct aspects of the pathways, and is numerically stable and well suited for continued adaption in future multiscale modeling efforts. The data used to inform the model were collected from human bronchial epithelial cell infections, with two influenza strains in vitro. Both strains induce an innate immune response, but the sensor protein RIG-I’s activity is antagonized by only one strain, leading to vastly different interferon production and peak viral load. The model presented here provides estimates of the rates that regulate intracellular responses to RNA virus infection. The model can be used to assess how distinct RNA viruses impact IFN production, a key early step in activating the immune system, and is a valuable platform for determining how intracellular immune signaling may be distinctly regulated between influenza and coronaviruses.
A sensitivity analysis of the model revealed that IRF7 and IRF7P have significant control over the innate immune response. This strong single-protein control of the system suggests an area of further experimental investigation; viruses may try to impede these reactions as well as initial sensor protein action, to limit the innate immune response mounted against the invader. Moreover, pre-stimulation of the TLR4 pathway has been shown to lead to an earlier induction of IRF7P production and increased protection from deadly influenza infection [48]. The systems-level analysis here suggests that IRF7 is a potent target for the immune-targeted treatment of severe respiratory infection, both as a means of increasing host immune response and as a target for interference for the mitigation of cytokine storms.
By isolating paracrine and sensor protein originating production of IFN in silico, paracrine signaling is revealed to be responsible for most cytokine production and, thus, immune response. Early and strong sensor protein action serves to ignite this feedback loop in a dNS1PR8 strain. In both PR8 and dNS1PR8 strains, TLR’s activity is too slow and of insufficient magnitude to significantly alter infection trajectory. When active, RIG-I has a profound effect on the peak viral titer. Effects would be more profoundly distinguished in low multiplicity of infection or in vivo cases, where uninfected neighboring cells would produce IFNs solely because of paracrine signaling. RIG-I is robust against antagonism, with 25–100% activity all reducing viral titer by about 97%. Full antagonism via NS1 is necessary for the virus to reach maximal peak. This level of antagonism is not achieved immediately, leaving a window for RIG-I to act before enough NS1 is produced inside the cell and its antagonism sets in. An area of future work is the relaxation of this simplifying assumption and the incorporation of NS1 production, based on viral load and the exploration of different RNA viruses’ antagonism mechanisms.
Developing a minimal ODE model that minimized the computational expense of performing MCMC optimization in high dimensional space necessitated several simplifying assumptions. All type-I interferon species were grouped together in a single IFN equation. Several species’ decay rates were estimated from literature [39,40,41], rather than being included in the MCMC optimization. RIG-I was assumed to be completely antagonized by the wild-type PR8 strain, which is supported by investigations of the NS1 protein [12,13]. The wild type simulation is stable at all times, since all simulated cells die. A validation study was performed by predicting a dNS1PR8 strain of influenza, using the same parameter set from training in the wild-type infection. The predictions of the validation case lend support to the model’s capability to capture the interactions of interest without overfitting, and suggest that the model can predict responses outside of the training data. This validation case predicts only 20% cell lethality, despite total initial infection (Figure 6, Cell Population), which leads to a mathematically unstable chronic inflammation state. This places limits on model interpretation beyond 24 h for NS1 knockout, or other reduced severity strains, since an infection in vitro is expected to be fully lethal in the absence of immune response and cellular regeneration. However, simulated cell death proportion acts as an indicator for virus severity.
This model does not stand alone in literature, and indeed must serve as a basis of further advancements. The action of drugs can be simulated by modifying only the relevant term(s) which the drug is thought to affect. Similarly, other strains or species of viral infection can be modeled by changing only the viral replication and clearance parameters. Both possibilities would be significantly computationally cheaper than the reparameterization of the entire model for each new system. If other parameters must change to reasonably fit a new data source, this could indicate previously unknown effects of the drug or infection on the species modeled herein, like NS1’s well known antagonistic effects. The degree of this antagonism on RIG-I massively controls cytokine production trajectory and infection outcomes, as demonstrated here in silico by varying levels of RIG-I knockdown. This insight applies to all RNA viruses, with varying mechanisms of antagonism. Such predictions generated by the ODE model will provide insight into infection trajectory, disease outcome, and their manipulation by intervention.

Author Contributions

Conceptualization, J.J.A.W. and J.E.S.; methodology, J.E.S.; software, J.J.A.W.; validation, J.J.A.W., investigation, J.J.A.W.; resources, J.E.S.; data curation, J.J.A.W.; writing—original draft preparation, J.J.A.W.; writing—review and editing, J.J.A.W. and J.E.S.; visualization, J.J.A.W.; supervision, J.E.S.; project administration, J.E.S. All authors have read and agreed to the published version of the manuscript.

Funding

This research is funded by the National Science Foundation, Award #1943777 and the University of Pittsburgh’s Central Research Development Fund.

Acknowledgments

We would like to thank the University of Pittsburgh for providing funding and facilities.

Conflicts of Interest

The authors declare no conflict of interest.

Appendix A. Structural Identifiability

Only parameters k31, k32, and k33 were structurally unidentifiable under Perfect Identifiability. This was expected, since the complexity of the Michaelis–Menten kinetic form precludes a unique set of constants from being identified within this ODE system without additional information or a simplification of the kinetic term. Parameters from perfect identifiability, plus k14, k42, and k51, were practically unidentifiable. Reparametrizing the ODE model presented in this work with time-course data for environmental IFN, cell population and an IRF7P proxy may permit unique solutions. Additionally, as the number of observed points approach a continuous data set, these parameters would become identifiable. STATP’s Michaelis–Menten parameters could only be uniquely identified with a more complex experimental design, a restructuring of the kinetic term to reduce fitted constants, or additional studies isolating its kinetic behavior. Structural identifiability results are summarized below.
d [ I F N ] d t = [ P ] ( k 11 [ R I G ] [ V ] + [ T L R ] k 12 [ V ] n k 13 + [ V ] n + k 14 [ I R F 7 P ] ) k 21 [ I F N ] ,
d [ I F N e ] d t = k 21 [ I F N ] [ I F N e ] τ 2 ,
d [ S T A T P ] d t = k 31 [ P ] [ I F N e ] k 32 + k 33 [ I F N e ] [ S T A T P ] τ 3 ,
d [ I R F 7 ] d t = [ P ] ( k 41 [ S T A T P ] + k 42 [ I R F 7 P ] ) [ I R F 7 ] τ 4 ,
d [ I R F 7 P ] d t = k 51 [ P ] [ I R F 7 ] [ I R F 7 P ] τ 5 ,
d [ P ] d t = k 61 [ P ] [ V ] ,
d [ V ] d t = k 71 [ P ] [ V ] 1 + k 72 [ I F N e ] k 73 [ V ] ,
BOLD parameters are structurally unidentifiable under perfect observation. (All states directly observed). Grey boxed parameters are practically unidentifiable under the observation scheme available in the data [36] (Equations (A1), (A3), (A4), (A6) and (A7) observed).

Appendix B

Table A1. Pearson Correlation Coefficients for ODE parameters found via MCMC. Significant correlation pairs (Correlation coefficient > ±0.5) highlighted with Grey Box .
k13k14k21tau2k31k32k33k41k42k51k61k71k72k73
0.170.770.30.020.310.53−0.05−0.010.23−0.150.010.090.350k12
100.090.7−0.10.280.30.63−0.02−0.02−0.04−0.030.430k13
1−0.06−0.040.50.390.12−0.170.23−0.340.010.10.280k14
10.1600.36−0.20.090.010.23−0.01−0.010.060k21
10.130.50.660.45−0.010.03−0.05−0.130.10t2
10.480.44−0.470.14−0.180.030.080.090k31
10.47−0.050.3−0.06−0.0300.060k32
10.040.17−0.13−0.06−0.13−0.290.1k33
10.05−0.05−0.06−0.10.290k41
1−0.35−0.01−0.05−0.070k42
10.030.07−0.060k51
1−0.440.03−0.5k61
10.170.6k71
1−0.1k72
1k73

References

  1. Influenza (Seasonal). Available online: https://www.who.int/news-room/fact-sheets/detail/influenza-(seasonal) (accessed on 17 September 2019).
  2. Lafond, K.E.; Nair, H.; Rasooly, M.H.; Valente, F.; Booy, R.; Rahman, M.; Kitsutani, P.; Yu, H.; Guzman, G.; Coulibaly, D.; et al. Global Role and Burden of Influenza in Pediatric Respiratory Hospitalizations, 1982–2012: A Systematic Analysis. PLoS Med. 2016, 13, e1001977. [Google Scholar] [CrossRef] [PubMed] [Green Version]
  3. AbdelMassih, A.F.; Ramzy, D.; Nathan, L.; Aziz, S.; Ashraf, M.; Youssef, N.H.; Hafez, N.; Saeed, R.; Agha, H. Possible molecular and paracrine involvement underlying the pathogenesis of COVID-19 cardiovascular complications. Cardiovasc. Endocrinol. Metab. 2020. [Google Scholar] [CrossRef]
  4. Cilloniz, C.; Pantin-Jackwood, M.J.; Ni, C.; Goodman, A.G.; Peng, X.; Proll, S.C.; Carter, V.S.; Rosenzweig, E.R.; Szretter, K.J.; Katz, J.M.; et al. Lethal Dissemination of H5N1 Influenza Virus Is Associated with Dysregulation of Inflammation and Lipoxin Signaling in a Mouse Model of Infection. J. Virol. 2010, 84, 7613–7624. [Google Scholar] [CrossRef] [PubMed] [Green Version]
  5. Peiris, J.S.M.; Cheung, C.Y.; Leung, C.Y.H.; Nicholls, J.M. Innate immune responses to influenza A H5N1: Friend or foe? Trends Immunol. 2009, 30, 574–584. [Google Scholar] [CrossRef] [Green Version]
  6. Sun, L.; Liu, S.; Chen, Z.J. SnapShot: Pathways of Antiviral Innate Immunity. Cell 2010, 140, 436. [Google Scholar] [CrossRef] [Green Version]
  7. Trinchieri, G. Type I interferon: Friend or foe? J. Exp. Med. 2010, 207, 2053–2063. [Google Scholar] [CrossRef]
  8. Prchal, M.; Pilz, A.; Simma, O.; Lingnau, K.; Strobl, B.; Müller, M.; Decker, T. Type I interferons as mediators of immune adjuvants for T- and B cell-dependent acquired immunity. Vaccine 2009, 27, G17–G20. [Google Scholar] [CrossRef]
  9. Opitz, B.; Rejaibi, A.; Dauber, B.; Eckhard, J.; Vinzing, M.; Schmeck, B.; Hippenstiel, S.; Suttorp, N.; Wolff, T. IFN? induction by influenza A virus is mediated by RIG-I which is regulated by the viral NS1 protein. Cell. Microbiol. 2007, 9, 930–938. [Google Scholar] [CrossRef]
  10. Wu, W.; Zhang, W.; Duggan, E.S.; Booth, J.L.; Zou, M.H.; Metcalf, J.P. RIG-I and TLR3 are both required for maximum interferon induction by influenza virus in human lung alveolar epithelial cells. Virology 2015, 482, 181–188. [Google Scholar] [CrossRef] [Green Version]
  11. Fujita, T.; Onoguchi, K.; Onomoto, K.; Hirai, R.; Yoneyama, M. Triggering antiviral response by RIG-I-related RNA helicases. Biochimie 2007, 89, 754–760. [Google Scholar] [CrossRef]
  12. Gack, M.U.; Albrecht, R.A.; Urano, T.; Inn, K.-S.; Huang, I.-C.; Carnero, E.; Farzan, M.; Inoue, S.; Jung, J.U.; García-Sastre, A. Influenza A Virus NS1 Targets the Ubiquitin Ligase TRIM25 to Evade Recognition by the Host Viral RNA Sensor RIG-I. Cell Host Microbe 2009, 5, 439–449. [Google Scholar] [CrossRef] [PubMed] [Green Version]
  13. Rajsbaum, R.; Albrecht, R.A.; Wang, M.K.; Maharaj, N.P.; Versteeg, G.A.; Nistal-Villán, E.; García-Sastre, A.; Gack, M.U. Species-Specific Inhibition of RIG-I Ubiquitination and IFN Induction by the Influenza A Virus NS1 Protein. PLoS Pathog. 2012, 8, e1003059. [Google Scholar] [CrossRef] [PubMed]
  14. Diebold, S.S.; Kaisho, T.; Hemmi, H.; Akira, S.; Reis e Sousa, C. Innate antiviral responses by means of TLR7-mediated recognition of single-stranded RNA. Science 2004, 303, 1529–1531. [Google Scholar] [CrossRef]
  15. Takeda, K.; Kaisho, T.; Akira, S. TOLL-LIKERECEPTORS. Annu. Rev. Immunol. 2003, 21, 335–376. [Google Scholar] [CrossRef]
  16. Hu, Y.; Li, W.; Gao, T.; Cui, Y.; Jin, Y.; Li, P.; Ma, Q.; Liu, X.; Cao, C. The Severe Acute Respiratory Syndrome Coronavirus Nucleocapsid Inhibits Type I Interferon Production by Interfering with TRIM25-Mediated RIG-I Ubiquitination. J. Virol. 2017, 91. [Google Scholar] [CrossRef] [Green Version]
  17. Lu, X.; Pan, J.; Tao, J.; Guo, D. SARS-CoV nucleocapsid protein antagonizes IFN-β response by targeting initial step of IFN-β induction pathway, and its C-terminal region is critical for the antagonism. Virus Genes 2011, 42, 37–45. [Google Scholar] [CrossRef] [PubMed] [Green Version]
  18. Le Page, C.; Génin, P.; Baines, M.G.; Hiscott, J. Interferon activation and innate immunity. Rev. Immunogenet. 2000, 2, 374–386. [Google Scholar] [PubMed]
  19. De Veer, M.J.; Holko, M.; Frevel, M.; Walker, E.; Der, S.; Paranjape, J.M.; Silverman, R.H.; Williams, B.R.G. Functional classification of interferon-stimulated genes identified using microarrays. J. Leukoc. Biol. 2001, 69, 912–920. [Google Scholar]
  20. Atkin-Smith, G.K.; Duan, M.; Chen, W.; Poon, I.K.H. The induction and consequences of Influenza A virus-induced cell death. Cell Death Dis. 2018, 9, 1002. [Google Scholar] [CrossRef]
  21. Schneider, W.M.; Chevillotte, M.D.; Rice, C.M. Interferon-stimulated genes: A complex web of host defenses. Annu. Rev. Immunol. 2014, 32, 513–545. [Google Scholar] [CrossRef] [Green Version]
  22. Alberts, B.; Johnson, A.; Lewis, J.; Raff, M.; Roberts, K.; Walter, P. Molecular Biology of the Cell; Garland Science: New York, NY, USA, 2002; ISBN 0815332181. [Google Scholar]
  23. Matsuoka, Y.; Matsumae, H.; Katoh, M.; Eisfeld, A.J.; Neumann, G.; Hase, T.; Ghosh, S.; Shoemaker, J.E.; Lopes, T.J.S.; Watanabe, T.; et al. A comprehensive map of the influenza A virus replication cycle. BMC Syst. Biol. 2013, 7, 97. [Google Scholar] [CrossRef] [Green Version]
  24. Qiao, L.; Phipps-Yonas, H.; Hartmann, B.; Moran, T.M.; Sealfon, S.C.; Hayot, F. Immune response modeling of interferon beta-pretreated influenza virus-infected human dendritic cells. Biophys. J. 2010, 98, 505–514. [Google Scholar] [CrossRef] [PubMed] [Green Version]
  25. Fribourg, M.; Hartmann, B.; Schmolke, M.; Marjanovic, N.; Albrecht, R.A.; García-Sastre, A.; Sealfon, S.C.; Jayaprakash, C.; Hayot, F. Model of influenza A virus infection: Dynamics of viral antagonism and innate immune response. J. Theor. Biol. 2014, 351, 47–57. [Google Scholar] [CrossRef] [PubMed] [Green Version]
  26. Kitano, H. Biological robustness. Nat. Rev. Genet. 2004, 5, 826–837. [Google Scholar] [CrossRef] [PubMed]
  27. Schoeberl, B.; Eichler-Jonsson, C.; Gilles, E.D.; Müller, G. Computational modeling of the dynamics of the MAP kinase cascade activated by surface and internalized EGF receptors. Nat. Biotechnol. 2002, 20, 370–375. [Google Scholar] [CrossRef] [PubMed]
  28. Shoemaker, J.E.; Gayen, K.; Garcia-Reyero, N.; Perkins, E.J.; Villeneuve, D.L.; Liu, L.; Doyle, F.J. Fathead minnow steroidogenesis: In silico analyses reveals tradeoffs between nominal target efficacy and robustness to cross-talk. BMC Syst. Biol. 2010, 4, 89. [Google Scholar] [CrossRef] [PubMed] [Green Version]
  29. Hoffmann, A.; Levchenko, A.; Scott, M.L.; Baltimore, D. The IκB-NF-κB Signaling Module: Temporal Control and Selective Gene Activation. Science 2002, 298, 1241–1245. [Google Scholar] [CrossRef] [Green Version]
  30. Ferrell, J.E.; Machleder, E.M.; Ma, W.; Pomerening, J.R.; Tang, C.; Ferrell, J.E.; Ryan, S.; Spiller, D.G.; Unitt, J.F.; Broomhead, D.S.; et al. The biochemical basis of an all-or-none cell fate switch in Xenopus oocytes. Science 1998, 280, 895–898. [Google Scholar] [CrossRef] [Green Version]
  31. Ho, D.D.; Neumann, A.U.; Perelson, A.S.; Chen, W.; Leonard, J.M.; Markowitz, M. Rapid turnover of plasma virions and CD4 lymphocytes in HIV-1 infection. Nature 1995, 373, 123–126. [Google Scholar] [CrossRef]
  32. Baccam, P.; Beauchemin, C.; Macken, C.A.; Hayden, F.G.; Perelson, A.S. Kinetics of influenza A virus infection in humans. J. Virol. 2006, 80, 7590–7599. [Google Scholar] [CrossRef] [Green Version]
  33. Ramos, I.; Carnero, E.; Bernal-Rubio, D.; Seibert, C.W.; Westera, L.; García-Sastre, A.; Fernandez-Sesma, A. Contribution of double-stranded RNA and CPSF30 binding domains of influenza virus NS1 to the inhibition of type I interferon production and activation of human dendritic cells. J. Virol. 2013, 87, 2430–2440. [Google Scholar] [CrossRef] [PubMed] [Green Version]
  34. Yang, C.; Skiena, S.; Futcher, B.; Mueller, S.; Wimmer, E. Deliberate reduction of hemagglutinin and neuraminidase expression of influenza virus leads to an ultraprotective live vaccine in mice. Proc. Natl. Acad. Sci. USA 2013, 110, 9481–9486. [Google Scholar] [CrossRef] [Green Version]
  35. Shapira, S.D.; Gat-Viks, I.; Shum, B.O.V.; Dricot, A.; de Grace, M.M.; Wu, L.; Gupta, P.B.; Hao, T.; Silver, S.J.; Root, D.E.; et al. A Physical and Regulatory Map of Host-Influenza Interactions Reveals Pathways in H1N1 Infection. Cell 2009, 139, 1255–1267. [Google Scholar] [CrossRef] [PubMed] [Green Version]
  36. Dou, D.; Revol, R.; Östbye, H.; Wang, H.; Daniels, R. Influenza A Virus Cell Entry, Replication, Virion Assembly and Movement. Front. Immunol. 2018, 9, 1581. [Google Scholar] [CrossRef] [PubMed]
  37. White, D.O.; Cheyne, I.M. Early events in the eclipse phase of influenza and parainfluenza virus infection. Virology 1966, 29, 49–59. [Google Scholar] [CrossRef]
  38. Foster, K.A.; Oster, C.G.; Mayer, M.M.; Avery, M.L.; Audus, K.L. Characterization of the A549 cell line as a type II pulmonary epithelial cell model for drug metabolism. Exp. Cell Res. 1998, 243, 359–366. [Google Scholar] [CrossRef] [PubMed]
  39. Cambridge, S.B.; Gnad, F.; Nguyen, C.; Bermejo, J.L.; Krüger, M.; Mann, M. Systems-wide proteomic analysis in mammalian cells reveals conserved, functional protein turnover. J. Proteome Res. 2011, 10, 5275–5284. [Google Scholar] [CrossRef]
  40. Sharova, L.V.; Sharov, A.A.; Nedorezov, T.; Piao, Y.; Shaik, N.; Ko, M.S.H. Database for mRNA half-life of 19 977 genes obtained by DNA microarray analysis of pluripotent and differentiating mouse embryonic stem cells. DNA Res. 2009, 16, 45–58. [Google Scholar] [CrossRef] [Green Version]
  41. Prakash, A.; Levy, D.E. Regulation of IRF7 through cell type-specific protein stability. Biochem. Biophys. Res. Commun. 2006, 342, 50–56. [Google Scholar] [CrossRef] [Green Version]
  42. Geyer, C.J. Markov Chain Monte Carlo Maximum Likelihood, Computing Science and Statistics. Proc. 23rd Symp. Interface 1991, 1991, 156–163. [Google Scholar]
  43. Bellman, R.; Åström, K.J. On structural identifiability. Math. Biosci. 1970, 7, 329–339. [Google Scholar] [CrossRef]
  44. Villaverde, A.F.; Barreiro, A.; Papachristodoulou, A. Structural Identifiability of Dynamic Systems Biology Models. PLoS Comput. Biol. 2016, 12. [Google Scholar] [CrossRef] [PubMed] [Green Version]
  45. Schober, P.; Boer, C.; Schwarte, L.A. Correlation Coefficients. Anesth. Analg. 2018, 126, 1763–1768. [Google Scholar] [CrossRef] [PubMed]
  46. Mistry, B.A.; D’Orsogna, M.R.; Chou, T. The Effects of Statistical Multiplicity of Infection on Virus Quantification and Infectivity Assays. Biophys. J. 2018, 114, 2974–2985. [Google Scholar] [CrossRef] [Green Version]
  47. Roberts, G.O.; Gelman, A.; Gilks, W.R. Weak convergence and optimal scaling of random walk Metropolis algorithms. Ann. Appl. Probab. 1997, 7, 110–120. [Google Scholar] [CrossRef]
  48. Shinya, K.; Okamura, T.; Sueta, S.; Kasai, N.; Tanaka, M.; Ginting, T.E.; Makino, A.; Eisfeld, A.J.; Kawaoka, Y. Toll-like receptor pre-stimulation protects mice against lethal infection with highly pathogenic influenza viruses. Virol. J. 2011, 8, 97. [Google Scholar] [CrossRef] [Green Version]
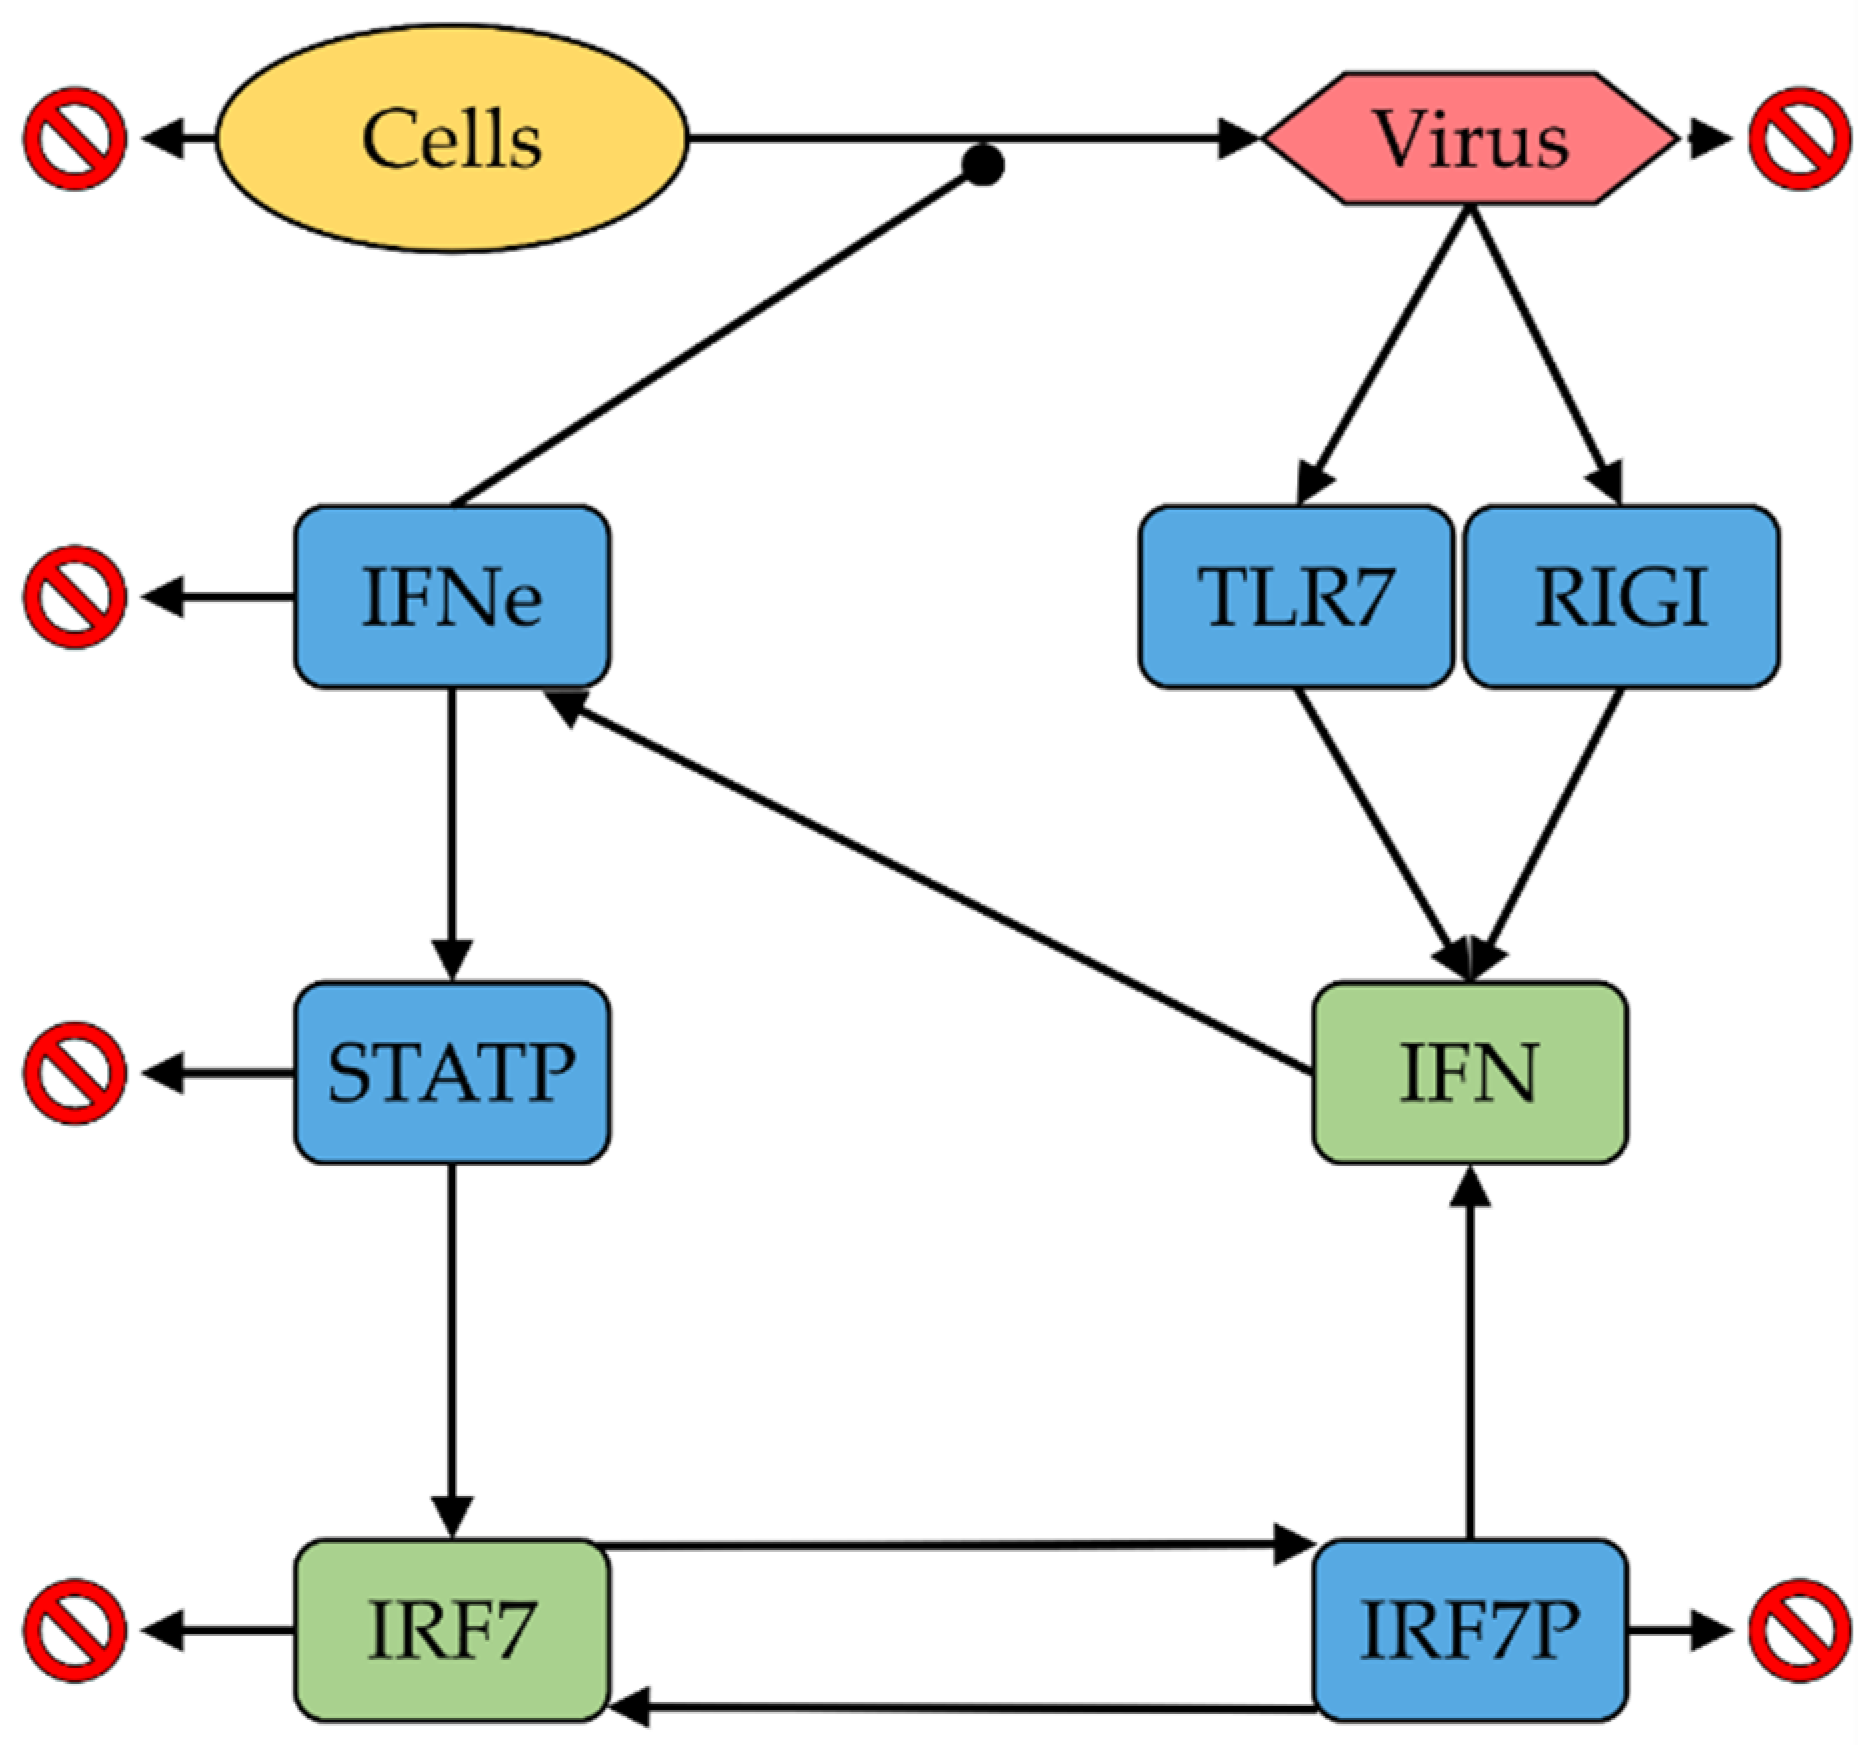
Figure 1. Schematic of intracellular immune signaling system. Crossed red circles represent decay or death, straight black arrows represent positive interactions and the circle-capped black arrow represents antagonism through Interferon Stimulated Genes (ISGs). Blue boxes are proteins (Environmental type-I Interferons (IFNe), Toll-Like Receptor 7 (TLR7), Retinoic Acid-Inducible Gene I (RIGI), phosphorylated Signal Transducer and Activator of Transcription (STATP) and Interferon Regulatory Factor 7 (IRF7P)). Green boxes are RNA species (Type-I Interferons (IFN) and Interferon Regulatory Factor 7 (IRF7)). The gold oval is the normalized Human Bronchial Epithelial Cell population. The red hexagon represents a normalized viral titer.
Processes 08 00719 g001
Figure 2. Model Simulations. The solid black lines are the trajectories that best fit the training data, as quantified by the SSE. The shaded area is ±1 standard deviation of the best 1000 parameter sets’ simulations. LFC = Log 2 Fold Change of gene expression versus control.
Processes 08 00719 g002
Figure 3. (A) Markov chain Monte Carlo method (MCMC) Acceptance Ratio. Burn-in consists of the first ~103 iterations. A 19% acceptance ratio is held after this point. (B) Sum Squared Error. Note log scale abscissa. (B), Inset: Linear abscissa scale zoom-in on the 1 million iterations post burn-in.
Processes 08 00719 g003
Figure 4. MCMC Parameter Histograms. Note: non-normal distributions for several parameters.
Processes 08 00719 g004
Figure 5. Correlation plots of MCMC parameter exploration. Nine parameter pairs were found to have a Pearson’s Correlation Coefficient > ±0.5. These significant pairs are plotted here.
Processes 08 00719 g005
Figure 6. NS1 Knockout Validation Simulation. Solid black lines are the best fitting parameter set. Shaded grey region is ±1 standard deviation of the best 1000 parameter sets’ simulations (Predicted). Dashed lines show wild-type PR8 best-fit from Figure 2 (Fit). LFC = Log 2-Fold Change of gene expression versus control.
Processes 08 00719 g006
Figure 7. System Sensitivity Analysis carried out on MCMC results. White bars represent First Order Sobol sensitivity indices. Black bars represent Total Order Sobol sensitivity indices. Retinoic acid-inducible gene 1 (RIG-I)’s sole parameter, k11, is not shown, as it was not fit via the Monte Carlo method.
Processes 08 00719 g007
Figure 8. Simulations at varying levels of RIG-I knockdown (% knockdown or % kd of the k11 parameter). Here, 0% knockdown means zero NS1 antagonism, matching the dNS1PR8 strain results. Moreover, 100% kd is equivalent to total antagonism via NS1, matching the wild-type PR8 results.
Processes 08 00719 g008
Figure 9. (A) Total, Sensor Protein, and Paracrine IFN production simulations in dNS1PR8 influenza. (B) Total, Sensor Protein, and Paracrine IFN production simulations in wild-type PR8 influenza. Note that Total and Paracrine IFN production in (B) are overlapping. Sensor Protein and Paracrine do not visually sum up to Total, since these plots have a Log-Fold Change space ordinate.
Processes 08 00719 g009
Table 1. Best-fit model parameters. All three MCMC runs converged to redundant parameter sets; these represent the minimum sum squared error (SSE) among all runs. Literature sourced values gave estimates for some species’ decay rates, which were not fit via MCMC.
ProcessParameterUnitsValueRemarks
IFN induction via RIG-Ik11μM h−11e5Fit manually
IFN induction via TLR7k12h−19.746Fit via MCMC
k13[unitless]12.511Fit via MCMC
IFN induction via IRF7Pk14h−113.562Fit via MCMC
Transport of IFNk21h−110.385Fit via MCMC
IFNe degradation τ 2h−13.481Fit via MCMC
STAT phosphorylationk31μM h−145.922Fit via MCMC
k32μM5.464Fit via MCMC
k33[unitless]0.068Fit via MCMC
STATP dephosphorylation τ 3h−10.3[39]
IRF7 induction via STATPk41h−10.115Fit via MCMC
IRF7 induction via IRF7Pk42h−11.053Fit via MCMC
IRF7 mRNA degradation τ 4h−10.3[40]
IRF7 phosphorylationk51h−10.202Fit via MCMC
IRF7P Dephosphorylation τ 5h−10.3[41]
Cell deathk61h−10.635Fit via MCMC
Viral replicationk71h−11.537Fit via MCMC
IFN effect on virusk72μM−147.883Fit via MCMC
Nonspecific viral clearancek73h−10.197Fit via MCMC