1. Introduction
Industrial plants are concerned with the availability and reliability of production due to market demand, such as the electrical industry and oil‒gas plants. Nowadays, producing electric energy without interruption has attracted much attention from industries. The maintenance of an electrical generator, therefore, plays a critical role in ensuring the reliability of the energy supply, with key goals of improving the operational efficiency and the service life of the equipment. Therefore, industrial plants apply different maintenance strategies. Reliability-centered maintenance (RCM) is a methodology that can be used to decide what maintenance activities need to be performed in order to keep the equipment working within its designed function range [
1]. RCM can choose the most suitable maintenance tasks, reduce the probability of failure, and/or reduce the consequences of failure. RCM was originally created for use in the aircraft industry [
2].
Many researchers [
1,
3,
4] have described an extension of the RCM method. Moreover, RCM II was presented by Moubray [
1], designed to be applicable to conventional industry.
RCM offers valuable insights into existing maintenance to find pertinent maintenance policies and thus creates a balance between reliability, availability, and the cost of equipment [
5]. Moreover, the RCM technique potentially has a wide area of successful implementation that ranges from use in a transmission system [
6] to a power distribution system [
7]. Due to recent economic demands, maintenance teams are often faced with a variety of difficulties, such as maintenance scheduling, asset criticality and management, and practices in subsystems or plants [
8]. Conventional reliability approaches for maintenance are insufficient for industrial world demands such as preventive maintenance and condition-based maintenance. Furthermore, in the electrical distribution field, RCM is mostly combined with FMECA (failure modes, effects and criticality analysis) to define the criticality of equipment for the improvement of the reliability of maintenance [
9].
Despite all RCM’s advantages, some industrial plants have found RCM to be too sophisticated a methodology because of some difficulties in implementation. Especially if they are analyzing a massive amount of data in a large plant, this will require experts and will be time-consuming. However, profits grow immediately after program implementation, which can be drawn out only for some equipment or if the equipment is nonstandard [
10]. Several studies have reported the drawbacks, as follows [
11,
12,
13,
14,
15,
16]: complicated, time-consuming, costly, too qualitative an approach, shortfalls in safety due to a failure to update maintenance approaches, a lack of identification and prioritization for failure modes, and handling each failure mode individually, which misses out on the combinational effects of failure modes.
Several methods have been suggested to overcome RCM’s drawbacks, such as a genetic algorithm (GA) [
6,
7], particle swarm optimization (PSO) [
17], game theory [
18], GO methodology [
19], MAUT (multi-attribute utility theory) [
20], direct fault tree analysis [
21], and the ANN technique [
22].
The FMEA approach is a part of the RCM steps, and in previous studies, FMEA structures were improved to simplify the failure modes analysis and prioritization—for instance, ANP-DEMATEL (Decision-Making Trial and Evaluation Laboratory) [
23], hybrid linguistic failure mode and effect analysis (HL-FMEA) [
11], technique for order of preference by similarity to ideal solution (TOPSIS) [
24], and (an acronym in Serbian for a multi-criteria optimization and compromise solution) VIKOR with house of reliability [
25].
ANP is an extension of analytical hierarchy process (AHP), and was presented by Saaty [
26]. The advantages of ANP compared to AHP are an ability to offer an internal relationship, independence, and interdependencies among the criteria, subclusters, and alternatives [
26,
27]. Similarly, ANP has a novel calculation technique “supermatrix,” which is used to determine the weights of criteria and alternatives for decision-making purpose [
28]. According to Ziemba [
29], ANP can assist a decision-maker with solving the problem of the location and design selection for a wind farm, and is the best technique for estimating issues and making decisions.
Particle swarm optimization (PSO) is an evolutionary algorithm based on a computation method to find optimal solutions on Pareto fronts, introduced previously [
30]. PSO models the collaborative behavior of bird clustering or fish swarming. Also, the PSO algorithm has been successfully applied in many fields, such as medical data classification [
31], operation strategy optimization in integrated energy systems [
32], operation optimization [
33], and fault diagnosis in power transformers [
34]. Moreover, PSO was combined with Monte Carlo simulations to improve the outcomes of maintenance planning for aircraft maintenance optimization [
35]. Furthermore, several studies suggest that the reliability and cost should be considered when determining the optimal maintenance plan [
36] and the availability for multi-period scheduling [
37]. Recently, several PSO algorithms were proposed to improve standard PSO and handle some complicated multi-objective optimization problems [
38,
39].
In previous studies, it was noted that RCM models were improved to solve some drawbacks in failure mode identification and prioritization. Similarly, the work of Heo and Lyu [
17] has demonstrated an improved RCM by integrating PSO and other methods into the analysis. However, unlike the study of Heo and Lyu [
17], most of the modified RCM versions lack a focus on the optimization of optimal RCM policy selection.
To our knowledge, no previous research in RCM modeling has covered the three phases of optimization of failure mode prioritization, multi-objective maintenance optimization, and multicriteria decision-making, especially for electricity generation in a hazardous location like an oil and gas plant. Hence, a new approach is needed to fill this gap. Therefore, a new hybrid RCM model was proposed via the hybrid LFMEA (linguistic failure mode and effect analysis), CMPSO (co-evolutionary multi-objective particle swarm optimization), ANP, and developed maintenance decision tree (DMDT) techniques to overcome the drawbacks of traditional RCM. This paper aims to present a new RCM optimization model with the objective of overcoming the drawbacks related to traditional RCM, with a valid maintenance plan.
The rest of this paper is organized as follows.
Section 2 illustrates the proposed methodology of the new hybrid RCM model using the hybrid LFMEA, ANP, co-evolutionary multi-swarm PSO algorithm, and the developed decision tree approach.
Section 3 and
Section 4 give the discussion and results of the practical implementation of the model using the electrical generators case study in a Yemeni oil and gas plant. Finally, the paper’s conclusions and suggested future work are given in
Section 5.
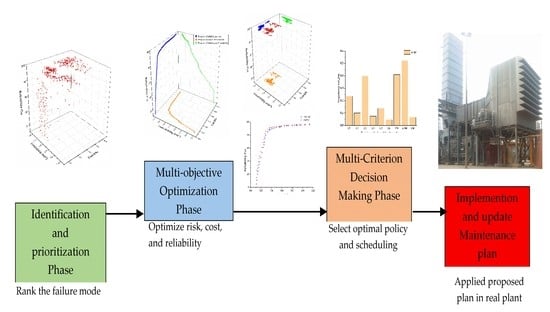
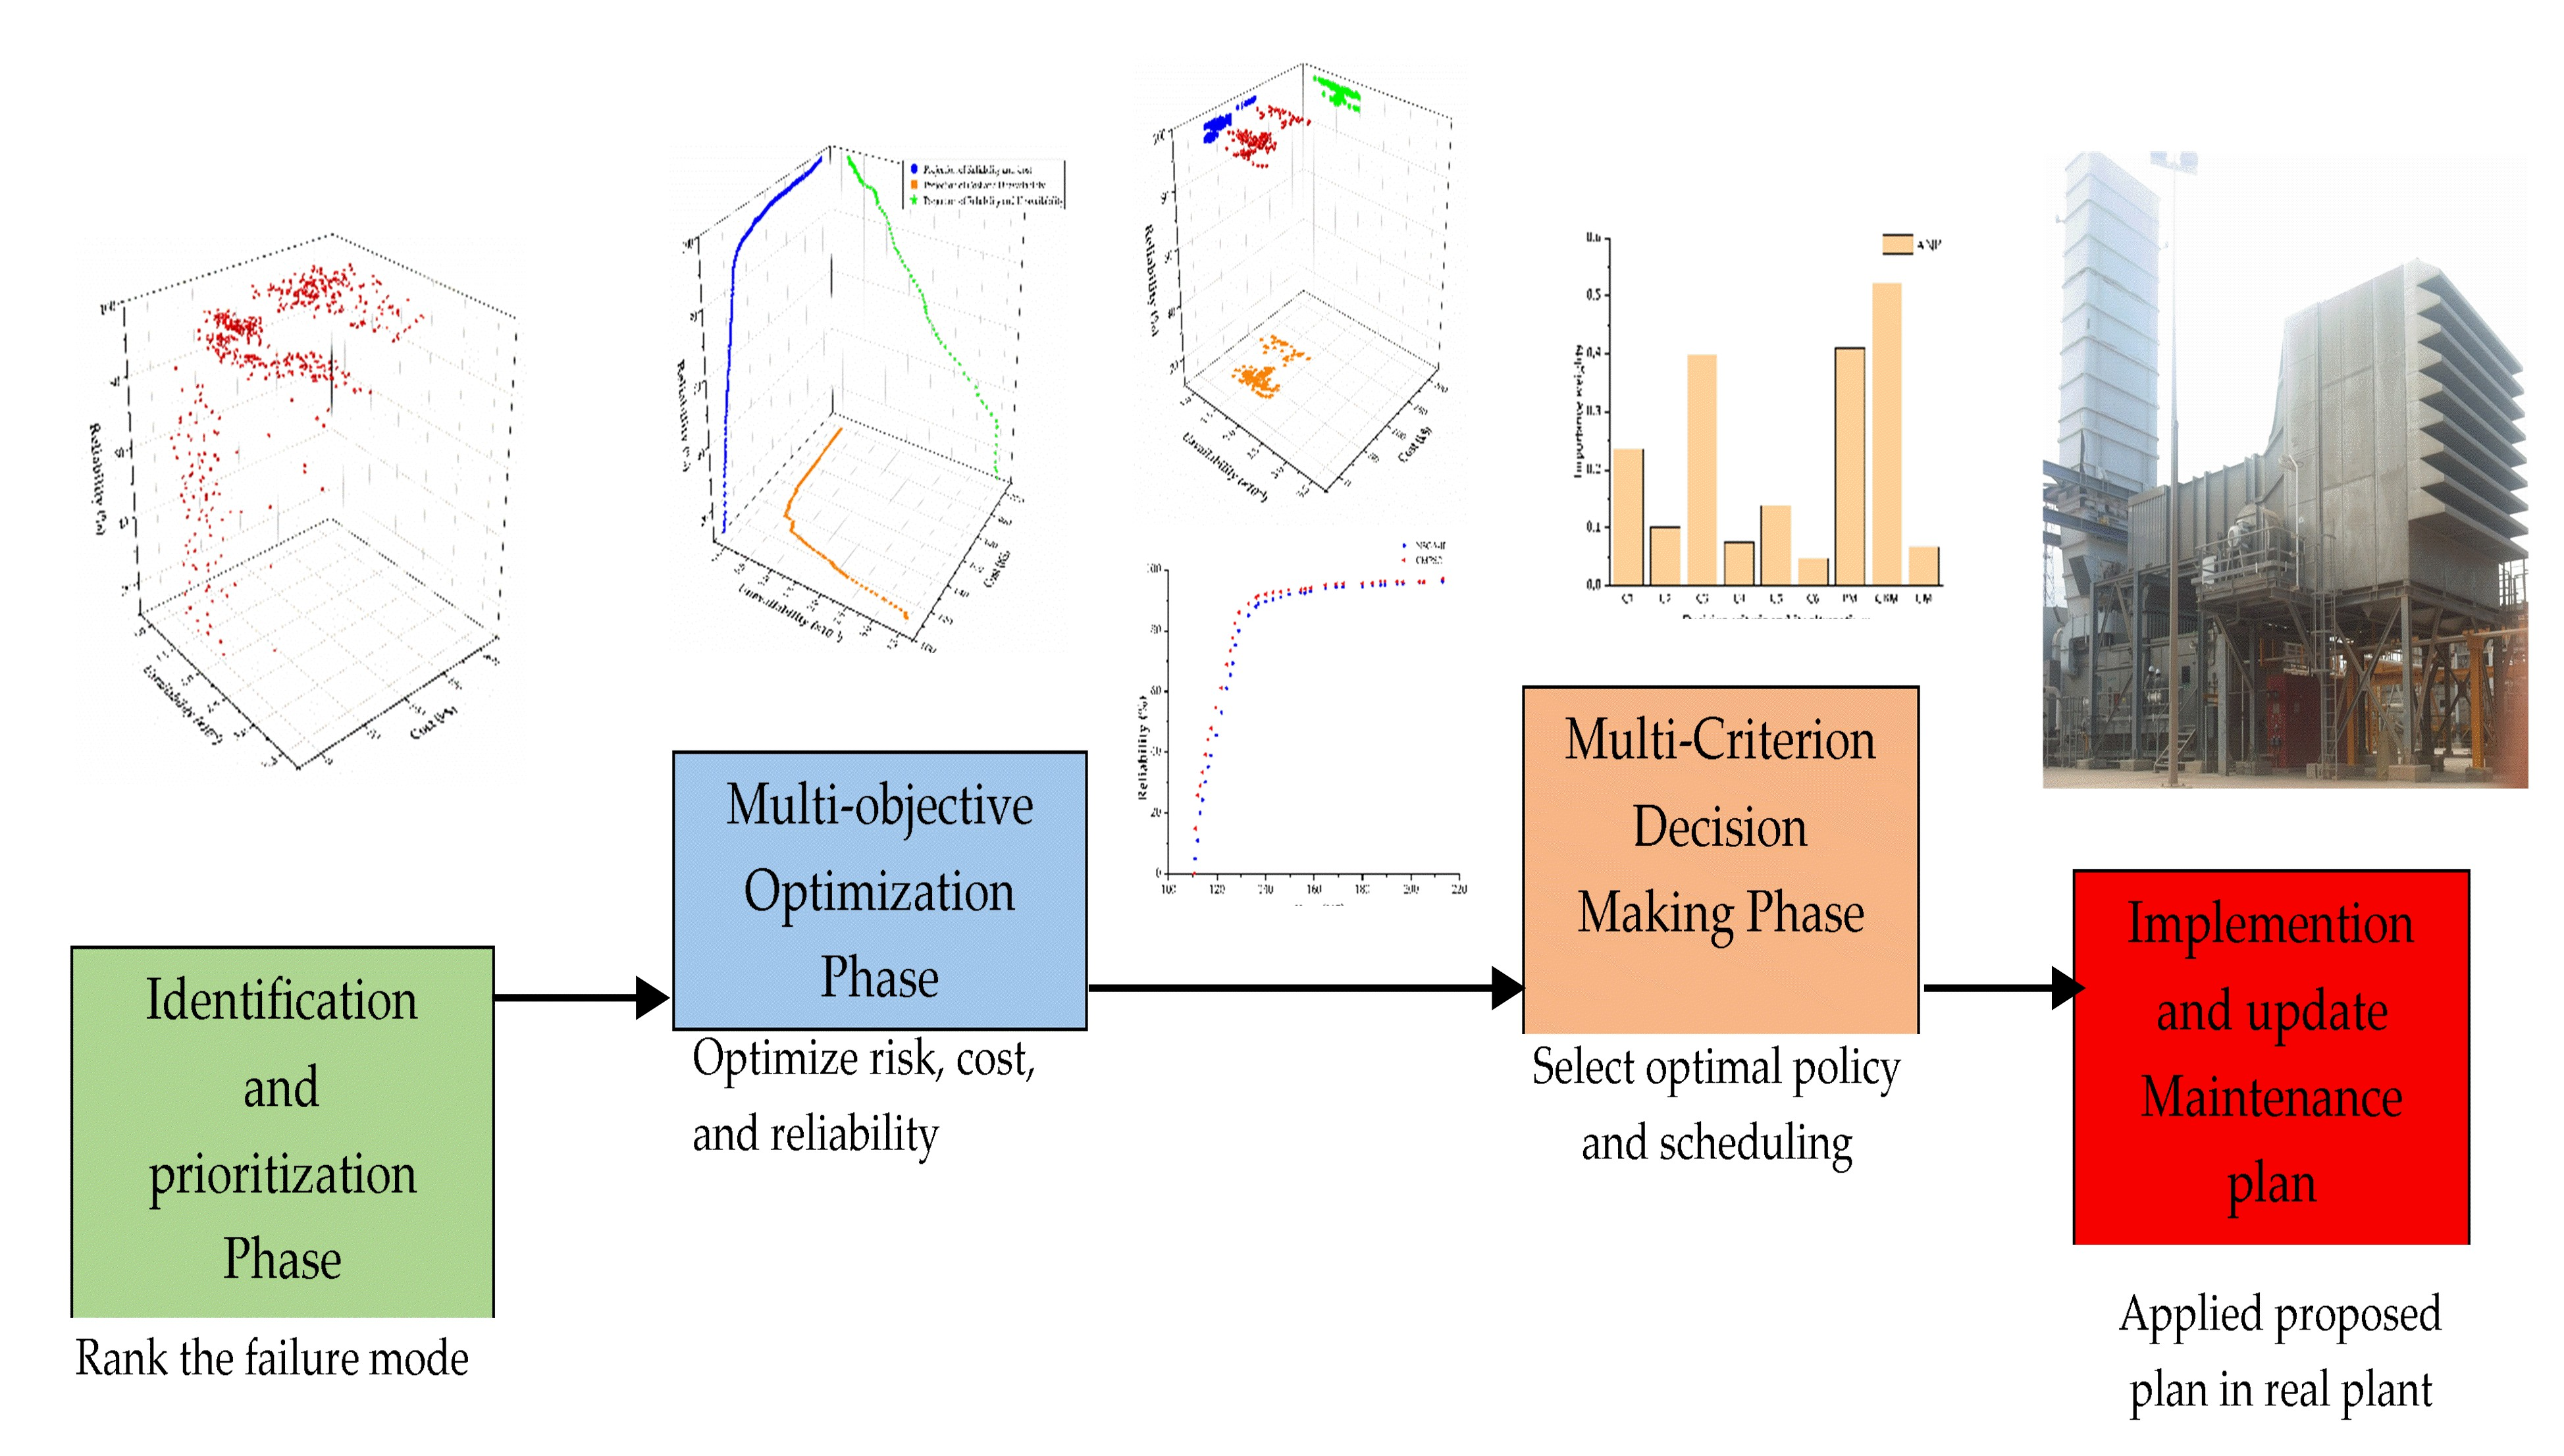
2. Proposed Methodology of New Hybrid RCM Model
In this part, a hybrid RCM model was established based on the hybrid LFMEA, ANP, co-evolutionary multi-swarm PSO algorithm, and the developed maintenance decision tree approach. The opinions of experts and engineers were considered to obtain a more precise RCM analysis during the application of the methodology.
Figure 1 displays the proposed model for the hybrid RCM model in an oil and gas plant with a hazardous environment.
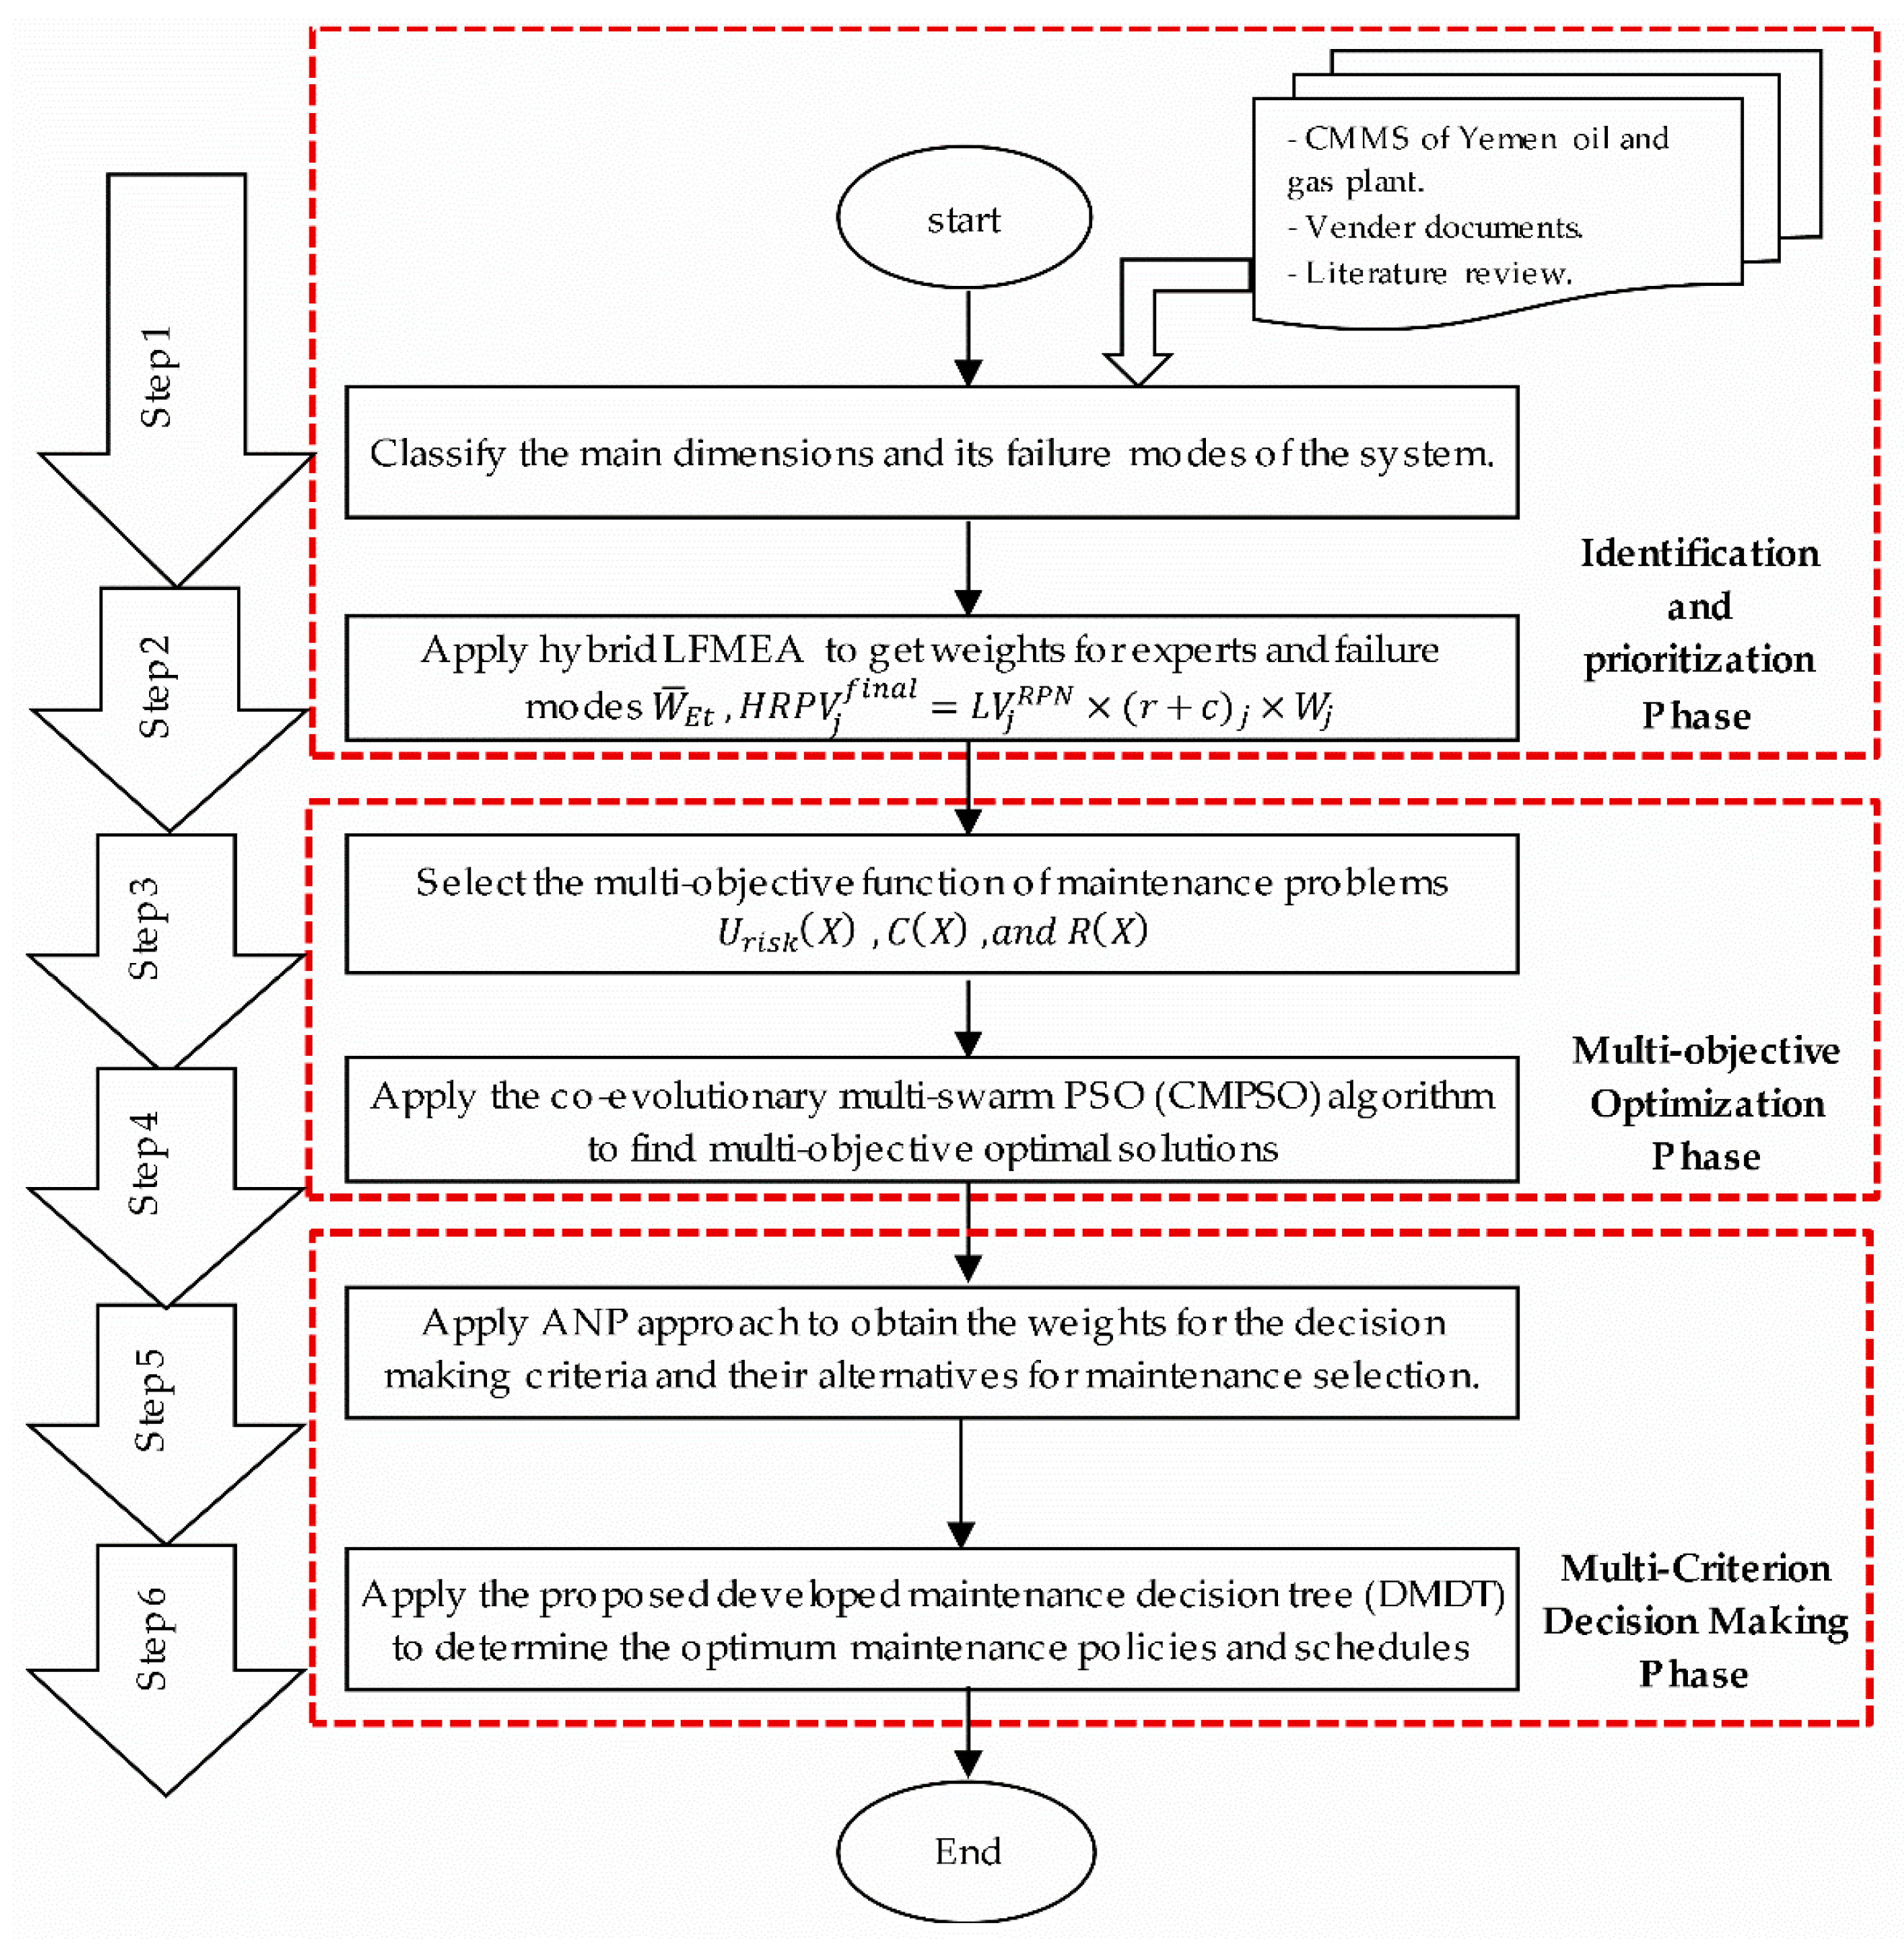
The methodology of the proposed RCM model consisted of six steps, described as follows.
2.1. Identification and Prioritization of FMs by HL-FMEA Approach
Step 1: Classify the main dimensions and failure modes of the system. Data are extracted from the literature reviews, vendor documents, the database of computerized maintenance management systems (CMMS), and the opinions of industrial experts. A team of experts will structure and organize the data into main risk factor dimensions and failure modes , where is a number of failure modes.
Step 2: Apply the hybrid LFMEA approach to identify and prioritize the failure modes, which contain all weights of LFMEA, DEMATEL, and the ANP supermatrix.
In this step, risk weights of all failure modes and main clusters are determined to rank the failure modes and their main clusters.
The HL-FMEA technique is presented as follows [
11]:
- (i)
Compute the weights for risk factors through an analytic network process (ANP), where .
- (ii)
Calculate linguistic evaluation matrix values
for FMs and main risk factor, which will consist of
n rows of experts and
m columns of FMs.
where
n denotes the number of expert members, and
m denotes the number of failure modes.
are risk language evaluation weights given by the expert member
for every failure mode
. Then, risk constant
:
- (iii)
Compute the linguistic risk priority value
for main clusters and failure modes.
- (iv)
Determine the expert weights by a fuzzy priority matrix, where .
Fuzzy priority matrix F is used to determine a weight for every expert member, which are explained in the following steps:
Then, the expert constant
:
- (v)
Compute the linguistic value of priority risk number
for every
.
where
is the expert constant,
is the expert weight, and
is the risk priority number.
- (vi)
Apply the DEMATEL approach with alpha cut to find the weights
and the relationship between FMs. The detailed steps for DEMATEL are described in [
11].
- (vii)
Apply the ANP approach with supermatrix to evaluate the weights
, feedback, and interdependence among FMs. The ANP approach steps will be explained in
Section 2.3.1.
- (viii)
Calculate the final risk weights
of FMs and main cluster:
- (ix)
Rank the failure modes and clusters according to the final risk weights.
2.2. Multi-Objective Optimization Based on Multi-Swarm PSO Algorithm
Optimization of maintenance problems is a multi-objective optimization process. In this section, the objective functions are defined and modeled for maintenance problems, then used in the co-evolutionary multi-swarm PSO (CMPSO) algorithm to seek optimal multi-objective solutions.
Defining the appropriate objective functions plays a key role in setting up a multi-swarm PSO optimization algorithm. A common multi-objective optimization is formulated in Equation (11) to obtain the decision variable vector
from the vector of objective functions
.
where
represents
q inequality constraints, and
represents
l equality constraints.
2.2.1. Multi-Objective Function Modeling
Step 3: Select the multi-objective function of maintenance problems that will be used in the next step of the optimization algorithm for evaluating and selecting the optimum solutions in the multidimensional solution space.
In this paper, the objective functions of reliability
, risk (component failure)
, and cost
are selected and formulated as follows.
Then, an approximate risk model can be formulated as follows [
40]:
where
is the failure risk of the
ith equipment.
Finally, the objective function of cost can be formulated as follows:
where
is the
ith component cost.
2.2.2. Co-Evolutionary Multi-Swarm PSO Algorithm
The CMPSO approach deals with multi-objective optimization problems, and was developed by Zhan et al. in 2013 [
41]. However, unlike CMPSO, the standard PSO lacks the focus on the shortcomings of the fitness assignment and is unable to optimize all objectives simultaneously due to achieving one objective and being weaker on the other objectives.
The CMPSO approach consists of N subswarms, which are executed together to find optimal solutions for N objectives. Similarly, each subswarm has the same optimization process of the single-objective PSO technique. However, all subswarms and their particles share information by an external shared archive. Therefore, the information gained from search experience is shared by all subswarms and their particles, which achieves the actual Pareto front successfully.
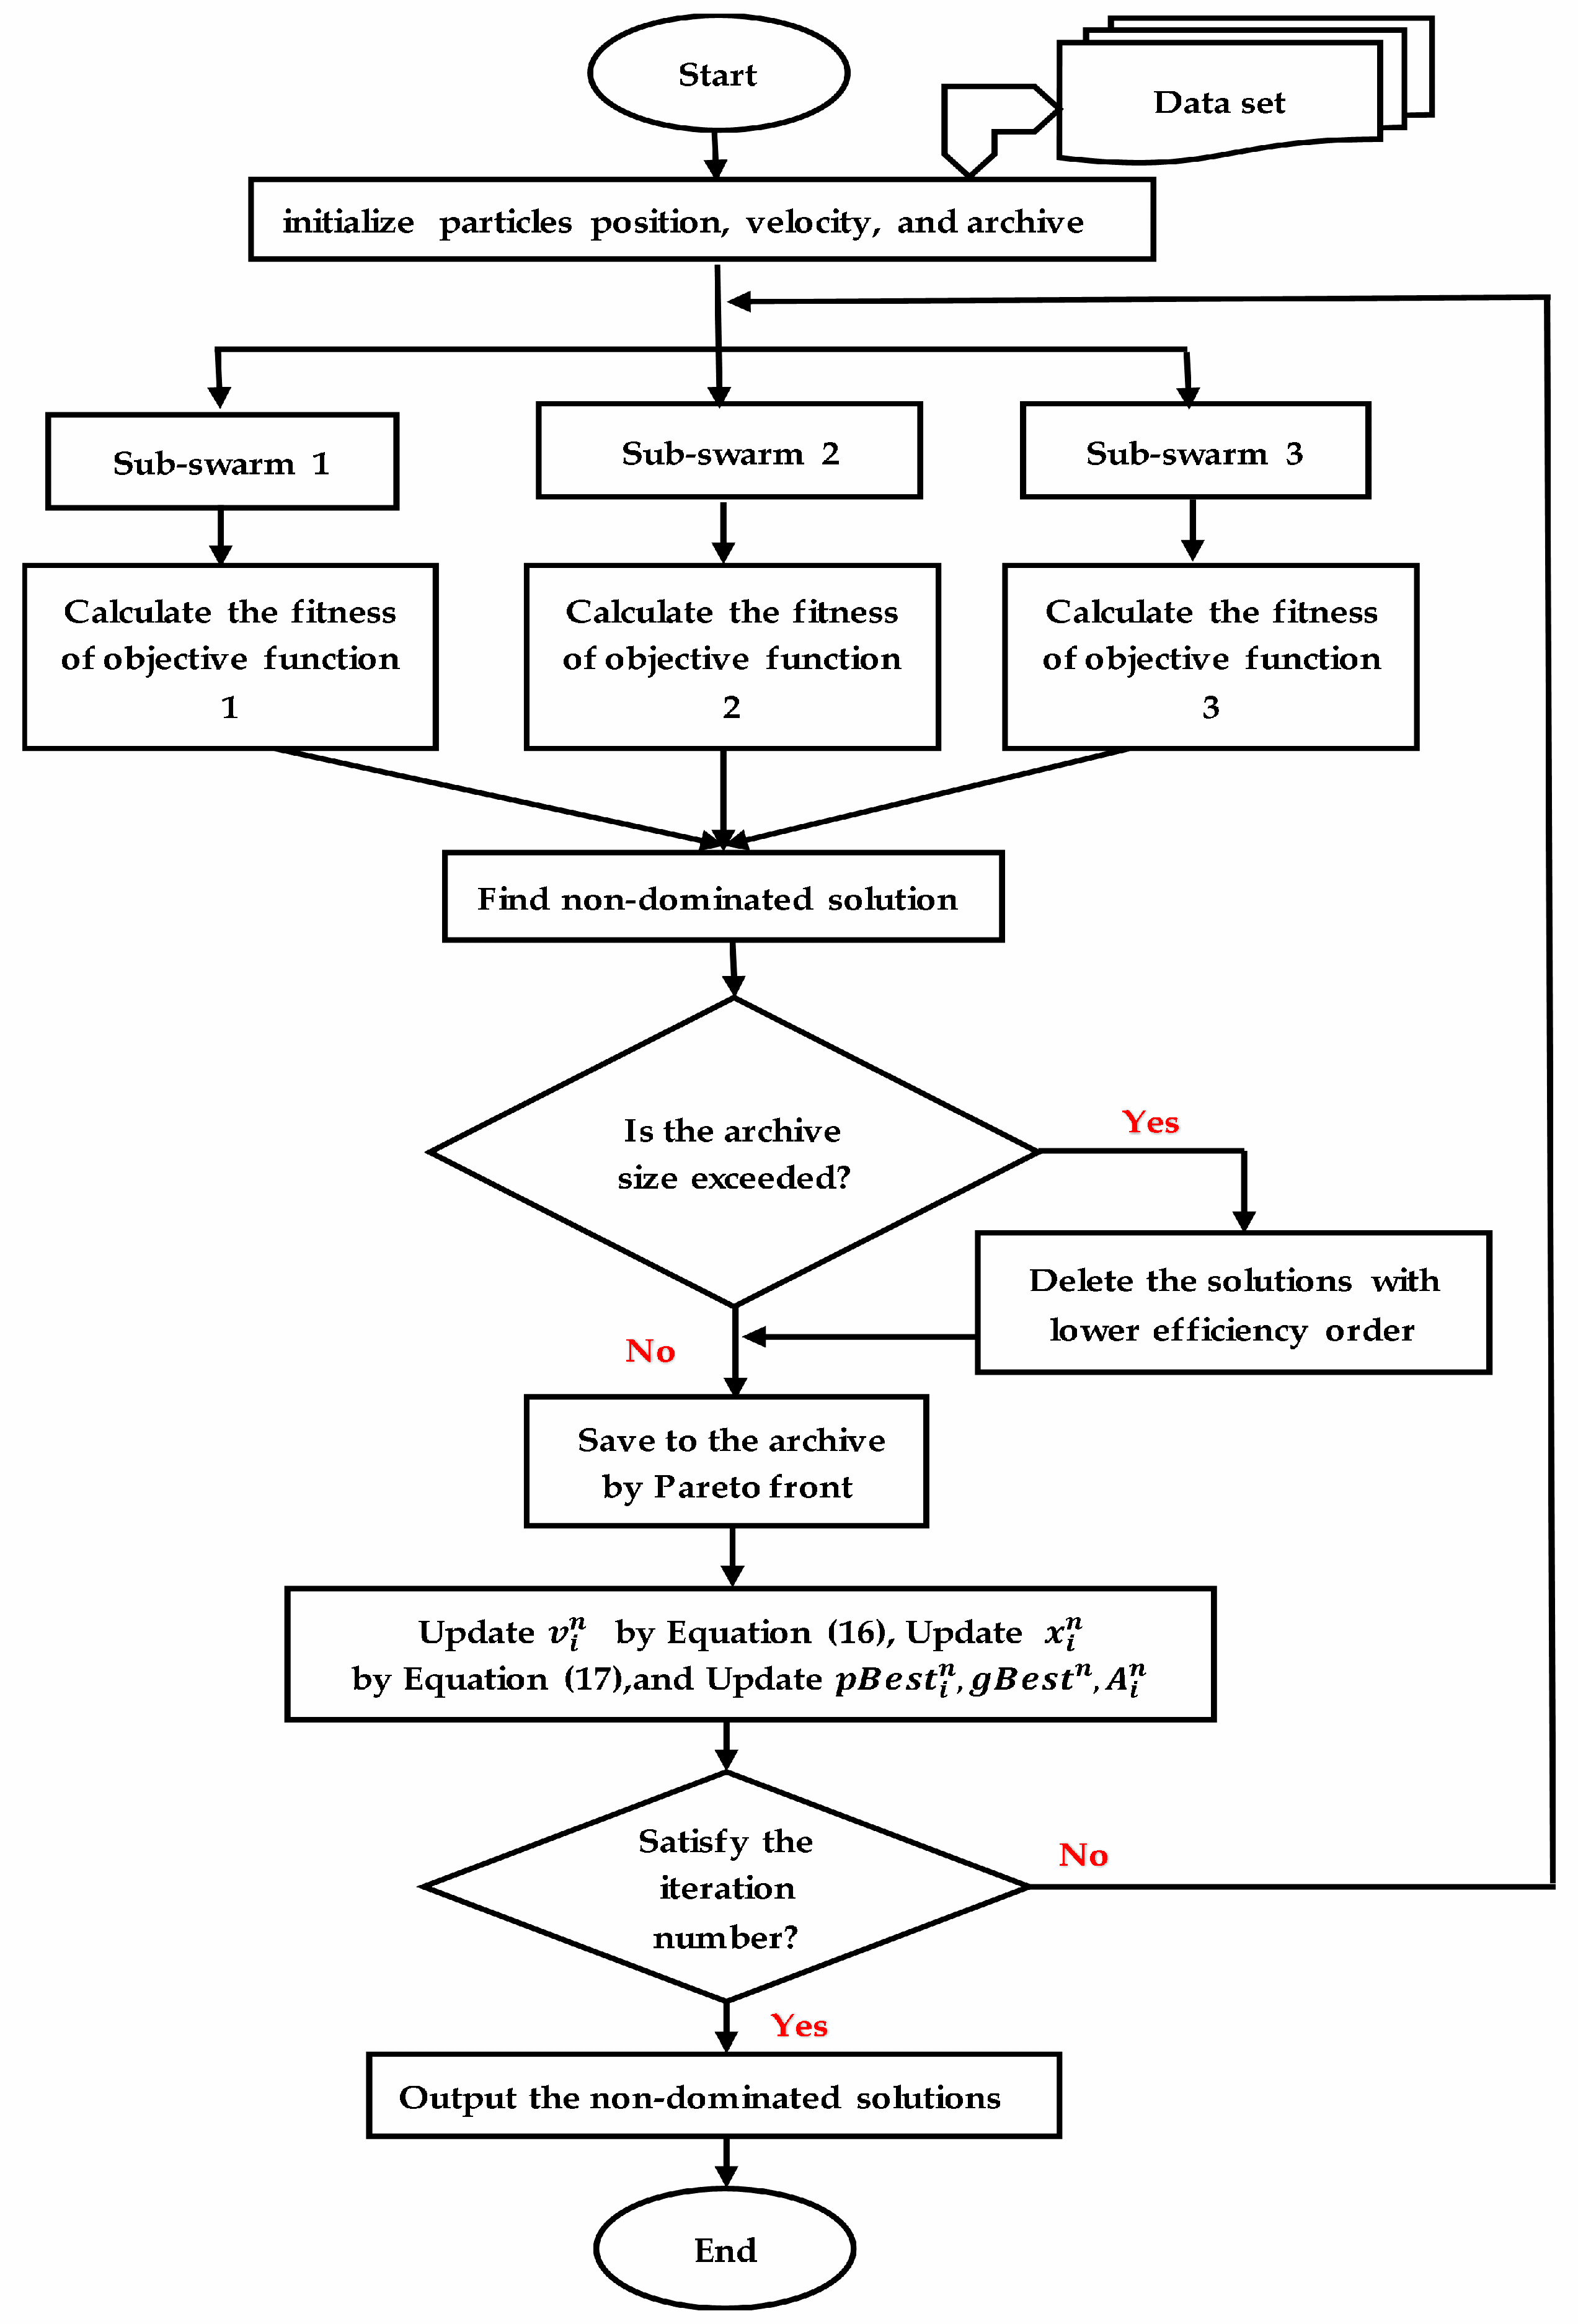
Step 4: Apply the co-evolutionary multi-swarm PSO (CMPSO) algorithm to find the multi-objective optimal solutions in the space of multidimensional objective solutions.
The particles in a swarm can travel in the multidimensional solution space and seek the optimal solutions.
Figure 2 shows the detailed steps of the proposed CMPSO algorithm for multi-objective maintenance optimization.
In CMPSO, every ith particle in the nth swarm has positions , and the velocity vectors . Moreover, positions and velocity will be updated after the fitness function calculation.
For iteration
, the velocity
and position
can be updated with the following equations [
41,
42]:
where
,
, and
are random variables;
,
are the best local solution and the best global solution of all particles in swarm
n, respectively;
denotes the optimal random variable, which is selected from the external archive;
denotes the inertia weight; and
and
denote learning factors, whereas
denotes a social learning factor.
2.3. Multi-Criteria Decision-Making (MCDM) Based on the ANP and DMDT Techniques
Increasing the size of optimal multi-objective solutions for maintenance problem will add more difficulties for the decision-maker due to conflicting objectives and constraints. Likewise, making maintenance decisions has to balance all objectives and consider all limitations and risks, especially in a hazardous area. Therefore, a multi-criteria decision-making approach is proposed in the next subsections.
In the proposed MCDM phase, ANP and the developed maintenance decision tree (DMDT) are used simultaneously to evaluate alternative maintenance policies with differing goals for maintenance policy selection and scheduling.
2.3.1. ANP Approach
In this subsection, the ANP approach enables the decision-maker to prioritize the criteria and their alternatives for maintenance policy selection, which involves six main factors: C1 (maintenance cost), C2 (production loss), C3 (safety effect), C4 (environmental effect), C5 (complexity of maintenance), and C6 (unavailability of spare parts).
Step 5: Apply the ANP approach to obtain the weights for the decision-making criteria and their alternatives for maintenance selection.
The ANP approach is presented as follows [
26,
43,
44]:
Arrange the ANP network structure of criteria, subcriteria, and alternatives according to the relationship between criteria and their alternatives. The influenced criteria and alternatives are exemplified in the supermatrix Equations (18) and (19), which will offer the feedback and the interdependence weights at a higher level.
Construct matrix A through pairwise comparisons concerning the influenced criterion, clusters, and alternatives on those that it influences.
Calculate the inconsistency of the pairwise comparison matrix (CR ≤ 0.1 [
45]):
where RI denotes a random inconsistency value.
Calculate the weights of supermatrix through the following expression:
where A is the matrix of pairwise comparison,
is the eigenvector; and the maximum eigenvalue is
.
Normalize the matrix by dividing every value in the supermatrix by the sum of its column to get the weighted supermatrix .
Compute the final weights of limit supermatrix
as follows:
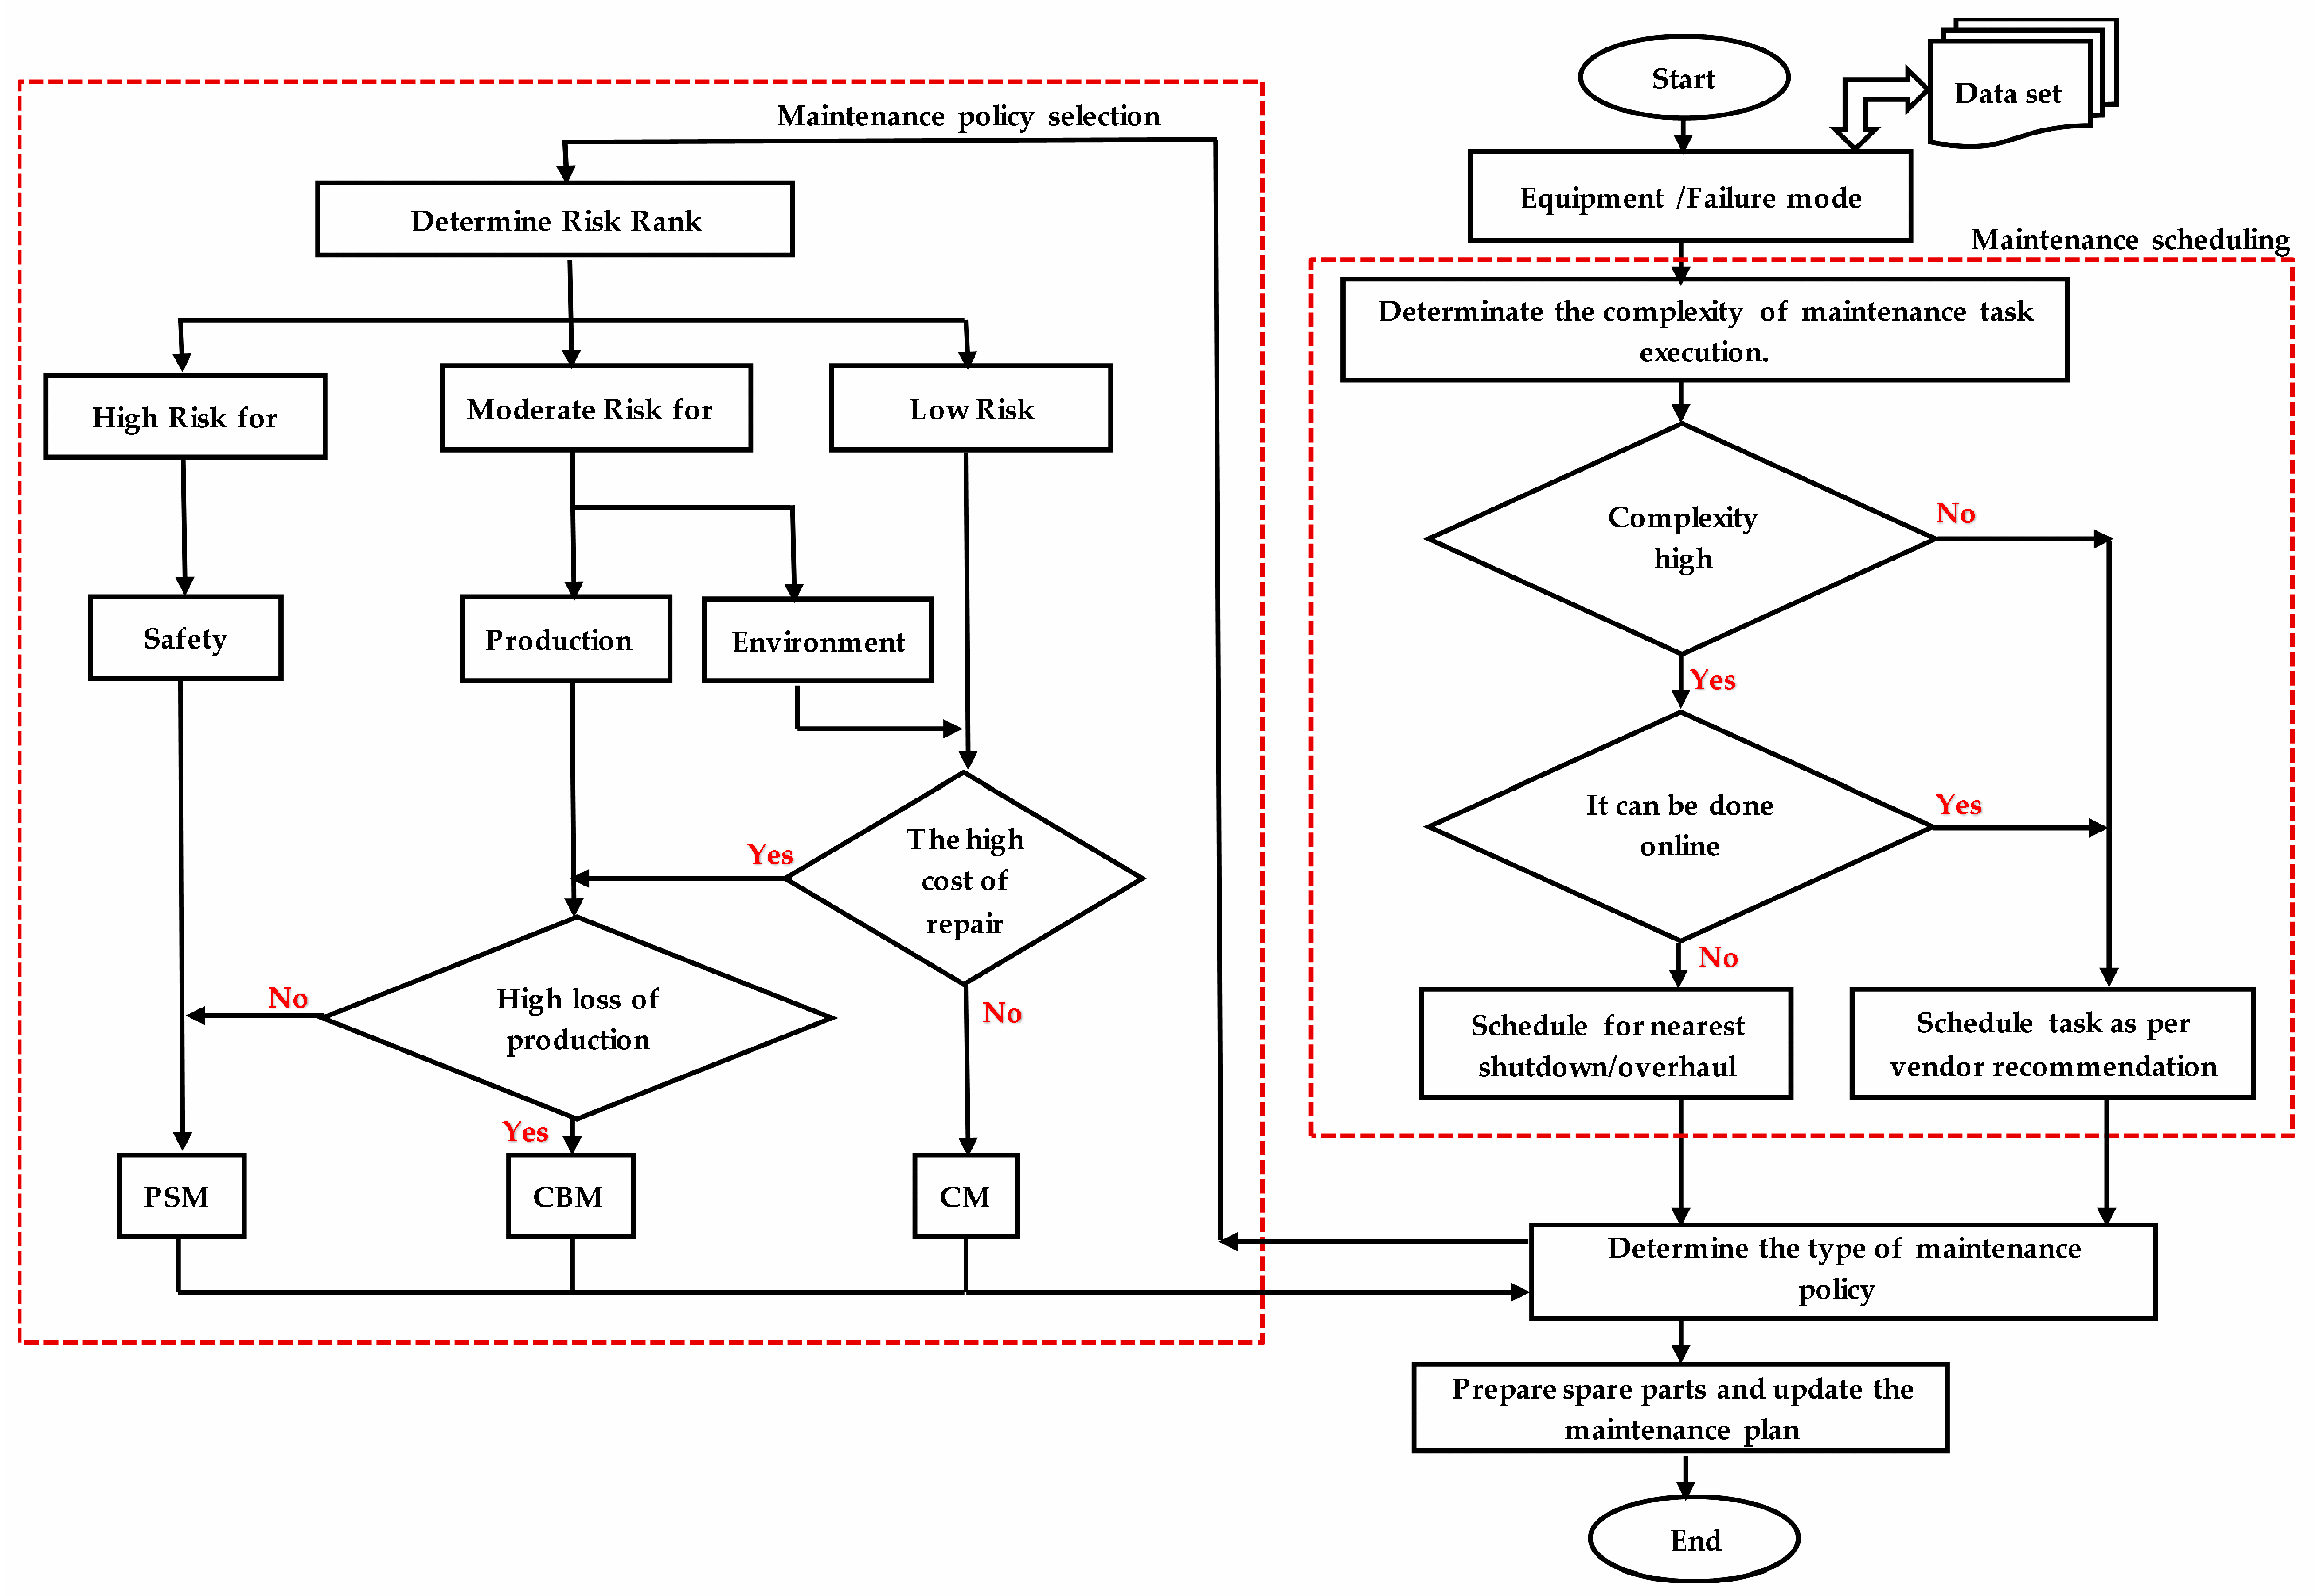
2.3.2. Developed Maintenance Decision Tree (DMDT)
Step 6: Apply the proposed developed maintenance decision tree (DMDT) to determine the optimum maintenance policies and schedules.
In this step, the DMDT algorithm is proposed to help the decision-maker select suitable maintenance policies and scheduling, after the steps of ANP weight calculation and CMPSO optimization. Moreover, the DMDT considers more criteria such as risk, safety, production loss, cost of repairing, maintenance complexity, spare parts, and maintenance scheduling.
Figure 3 shows the proposed algorithm of the developed maintenance decision tree.
4. Results and Discussion
4.1. Hybrid Linguistic FMEA Rank
In this step, hybrid linguistic FMEA was conducted to prioritize the failure mode risk and the weights of three risk factors (
), which were determined by experts
and through the ANP method. These weights are in line with previous studies [
46,
47], where the severity risk factor (0.453) has a higher weight among other risk factors.
Table 2 illustrates the linguistic values of the main FMs with scale (
, …,
. The linguistic scale is s = 5, with range (2
s − 1 = 9). Three risk values
were determined for every FM by the five experts in Equation (1), as shown in
Table 2.
The risk constant = 1 is obtained by Equation (2); the consistency index is calculated by Equations (4)–(6); for instance, if the rank of failure modes for an expert is equal to the ordering consistency index will be . Therefore, the rank is , 4 > 2.6 > 2.2 > 0.8 > 0.4 and = {0.736, 1.027, 1.027, 1.027, 1.027}.
However, expert weights
and risk priority values
were calculated to obtain a linguistic value of priority risk number
in Equations (7) and (9), then the expert constants
= {0.212, 1} are given by Equation (8). Expert weights
= (0.152, 0.212, 0.212, 0.212, 0.212) showed that the evaluation of expert
departed from the team’s consensus. Moreover, expert
has a lower weight (0.152) that will reduce his bias on the expert group. As a consequence, serious bias in the analysis and FM assessment results will be prevented. The weights of
and
were calculated through the DEMATEL and ANP approaches to obtain the final rank with risk weights
in Equation (10). The final rank and risk weights
are shown in
Table 3, and the result is compared with the traditional FMEA approach.
As shown in
Table 3, the highest-priority FMs are ME, OT4, ME3, OP, EL, and OT2, which are associated with the hazards of gas and mechanical failures.
By contrast, the rank of the traditional FMEA for ME3, OT4, IN2, and IN4 is not clear due to the drawback of mathematical calculation, while the HL-FMEA approach had a better ranking due to the weights of the FM interrelationship and feedback, which were determined through the ANP and DEMATEL methods.
So, according to the proposed methodology, a suitable maintenance policy should be selected to prevent or control the risk of FMs. However, the selection of maintenance strategies involves many factors (such as risk, cost, and reliability), which should be optimized before maintenance policy selection and will be executed in the next steps.
4.2. Maintenance Optimization and Comparison
In this section, we applied the co-evolutionary multi-swarm PSO (CMPSO) to find a set of optimal solutions.
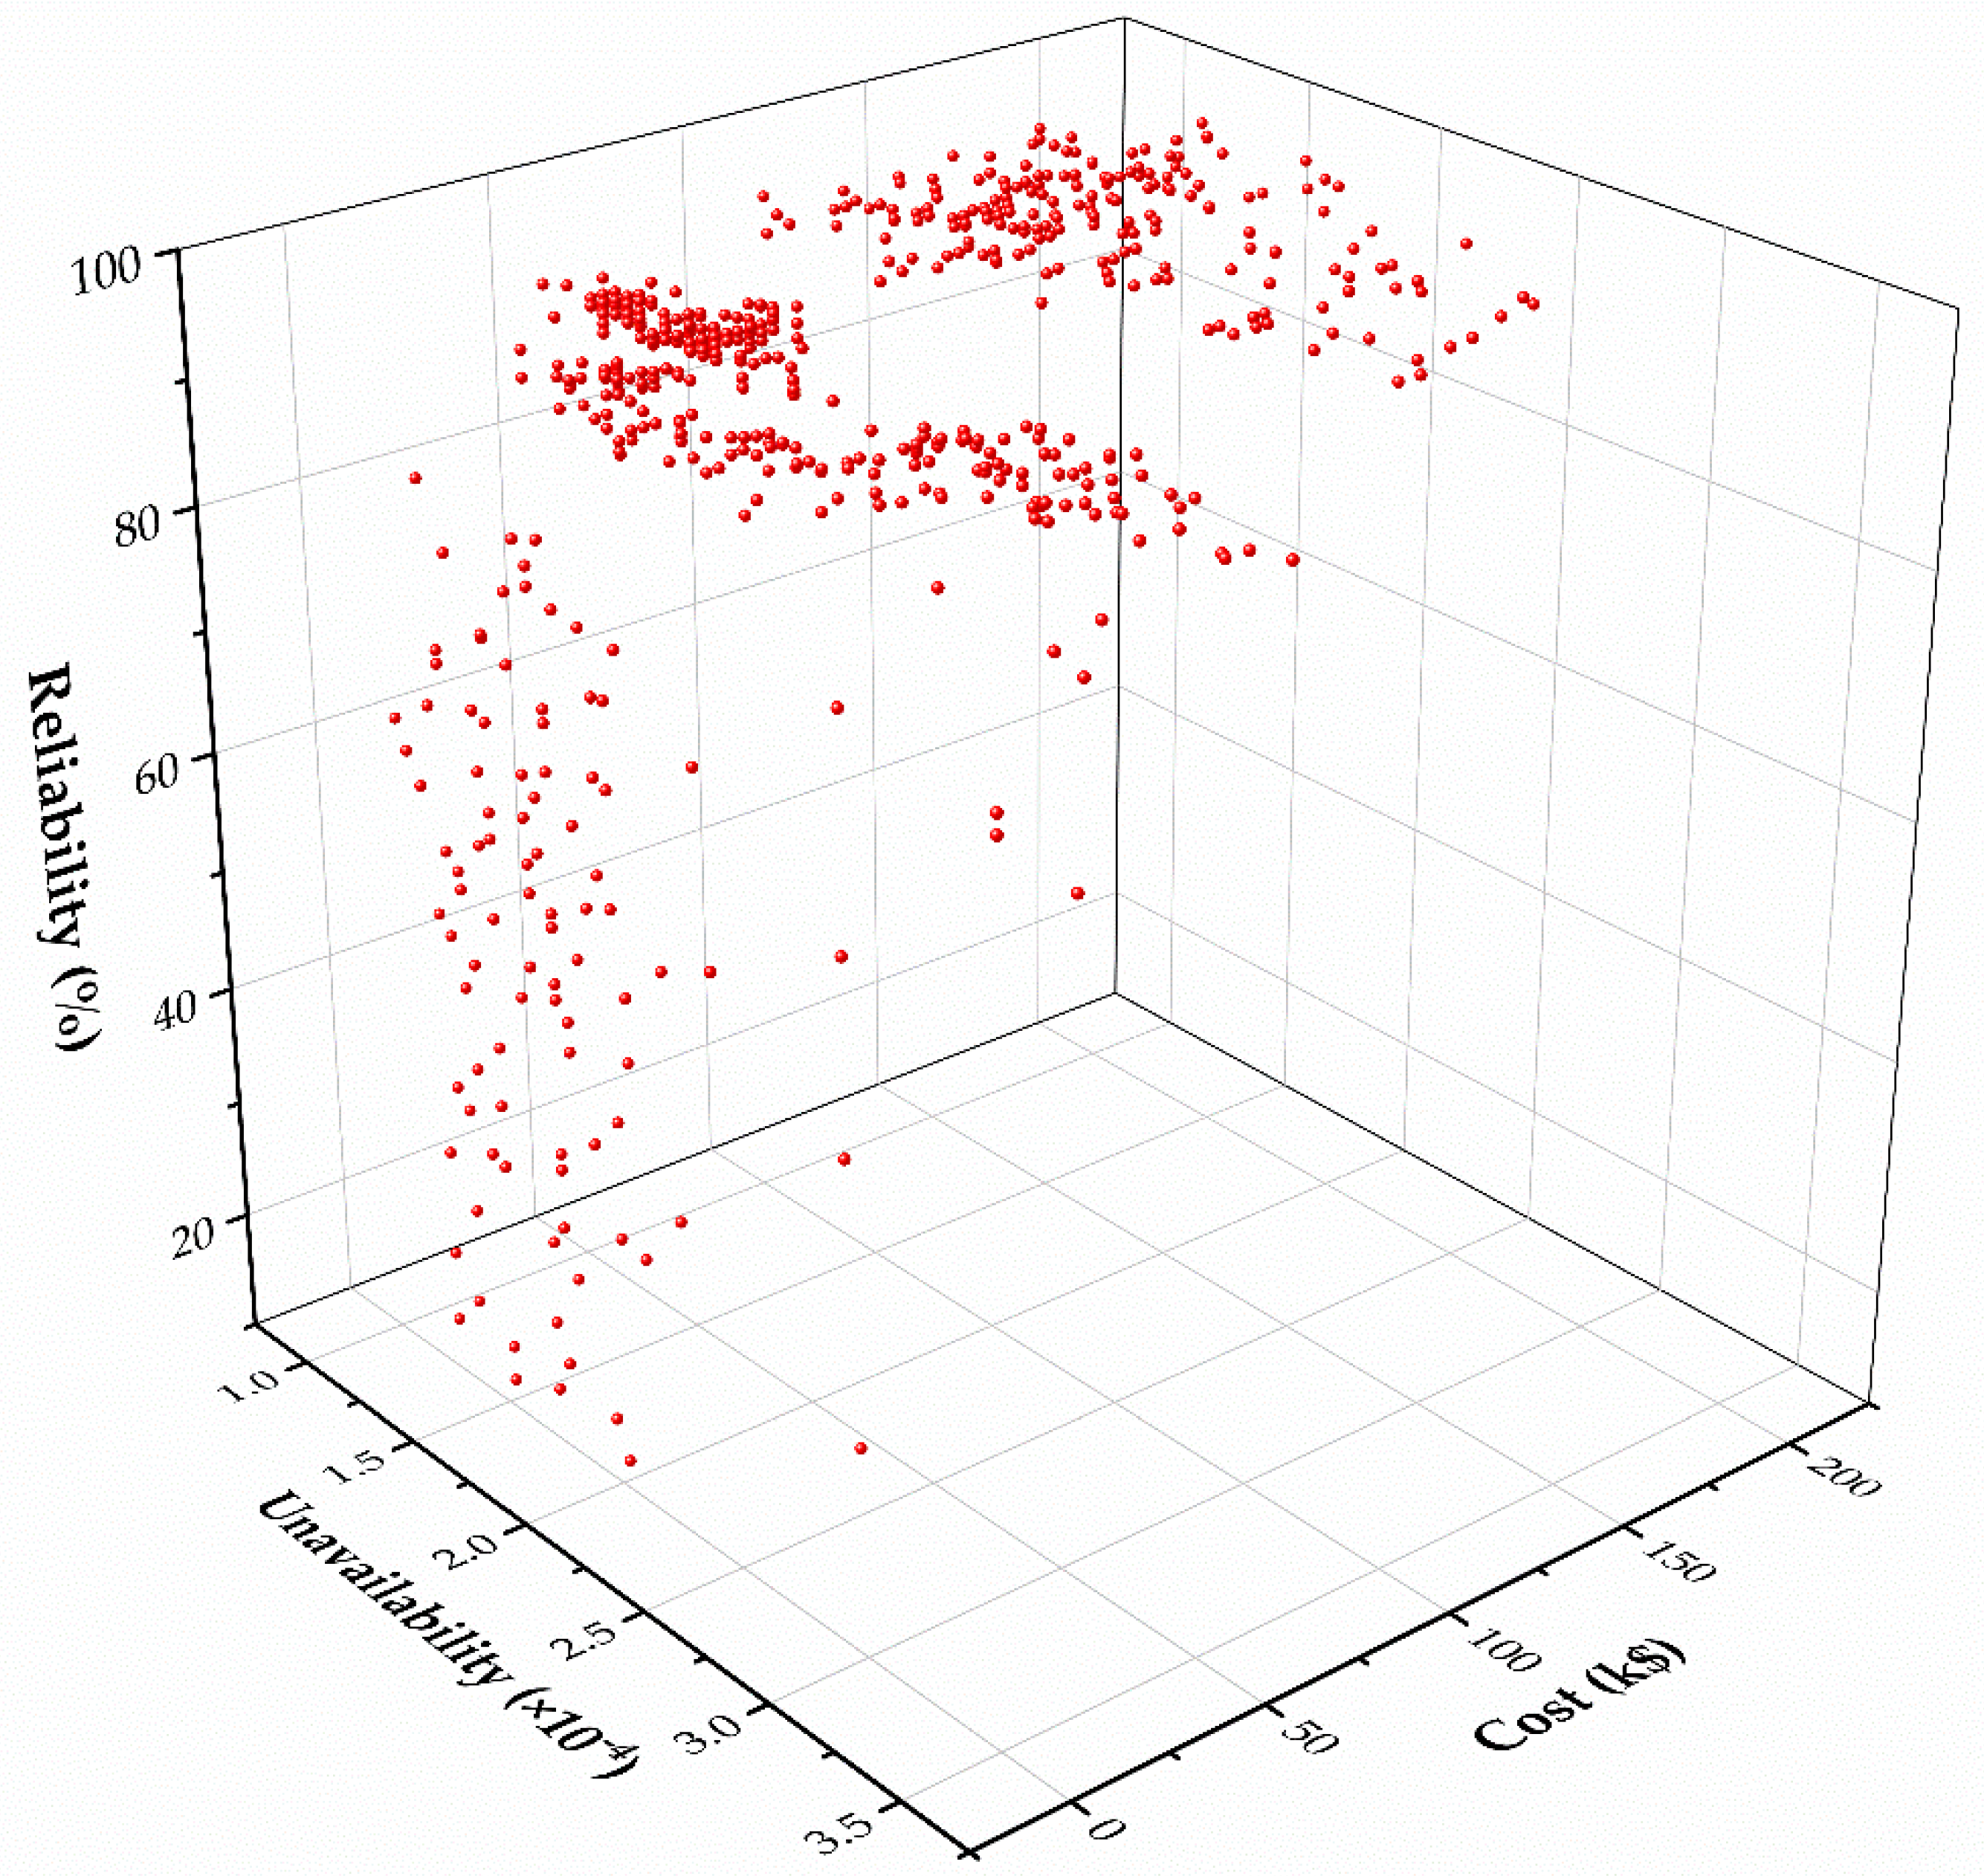
Figure 4 shows the 3D space of nondominated solutions and multi-objective functions.
In this optimization phase, the three objective functions (risk of unavailability, cost, and reliability) are treated simultaneously in Equations (11)–(15) through the CMPSO algorithm in
Figure 2. However, Equations (16) and (17) were used to find the best local and global solution of all particles in swarm
n. The CMPSO algorithm was executed in MATLAB
® 2018b software to verify the effectiveness of the optimization phase for obtaining the optimal solution set.
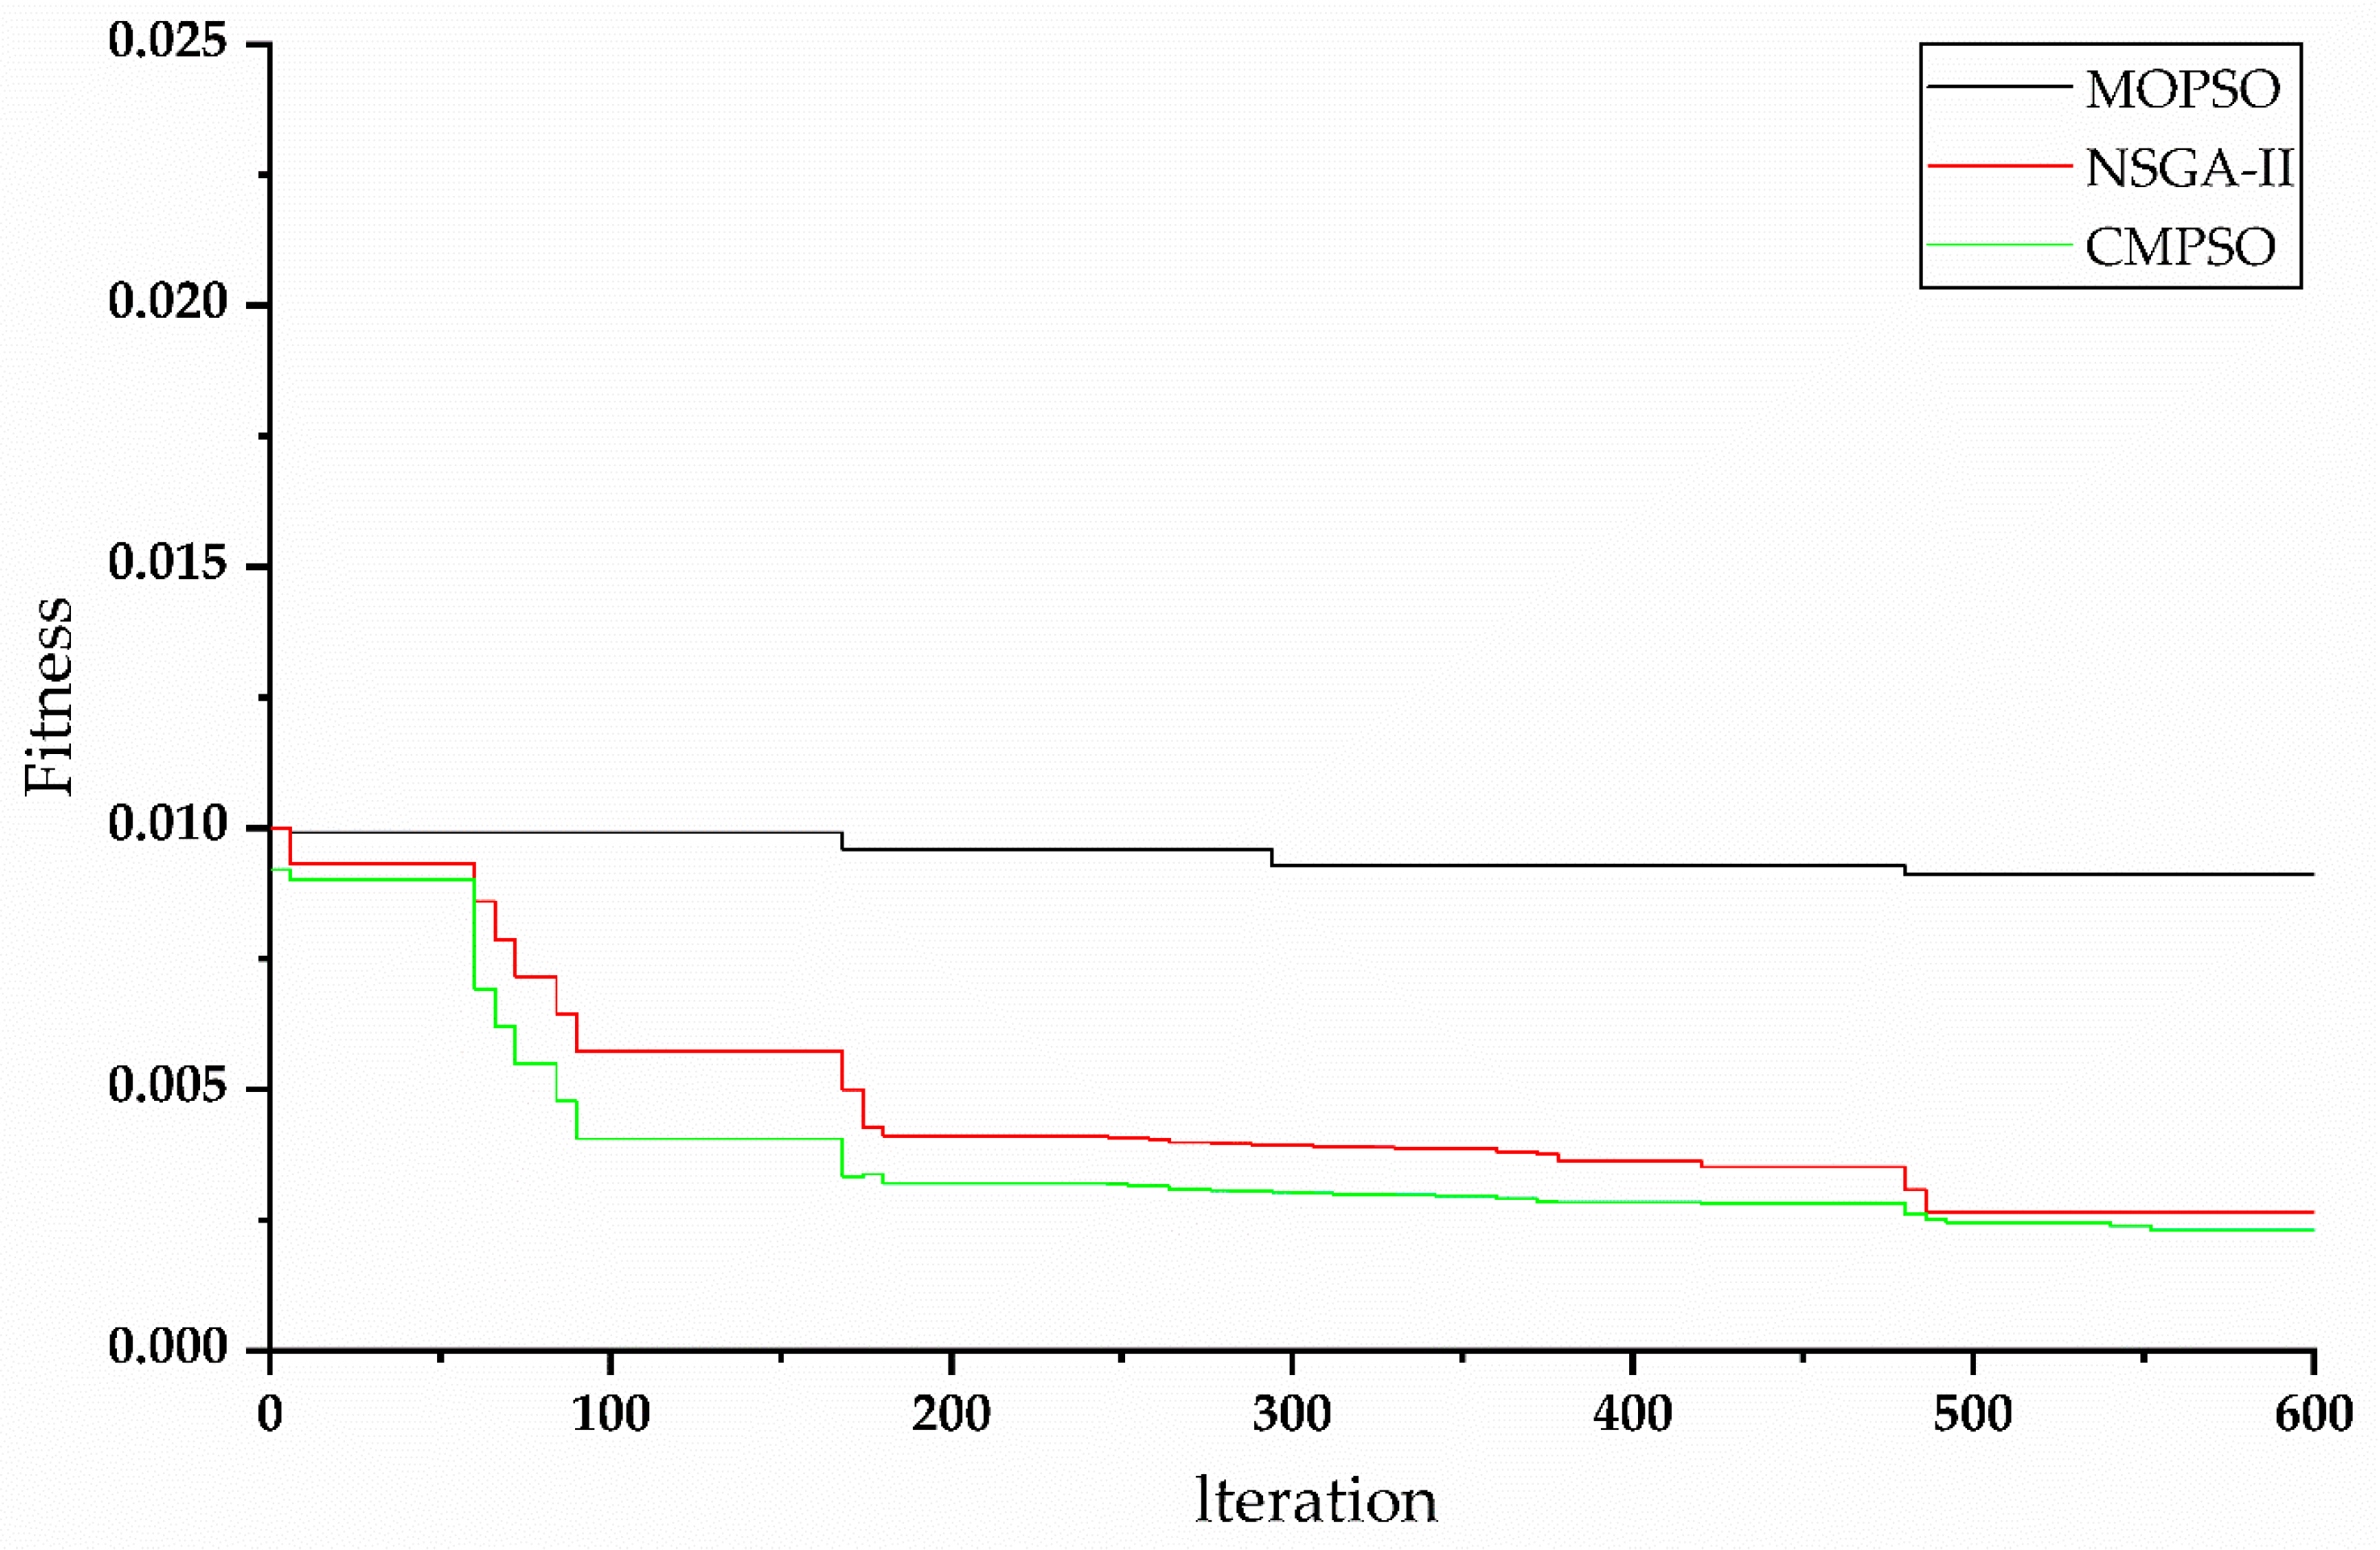
A stable value of fitness was obtained at 600 iterations. Hence, the maximum optimization iteration of CMPSO number was set to 600, and the maximum capacity of external archive or Pareto front is 200. The CMPSO algorithm contains three different swarms of PSO that work cooperatively.
The initial population size for each swarm was set to 30 particles, Learning factor as (, and inertia weight as .
To verify the effectiveness of the CMPSO methodology, the MOPSO [
48] and NSGA-II [
7] algorithms were also applied to optimization problems and evaluated using the same objective functions. As can be seen in
Figure 5, the CMPSO has a better fitness value than MOPSO and NSGA-II due to the self and social learning of subswarms and particles in CMPSO.
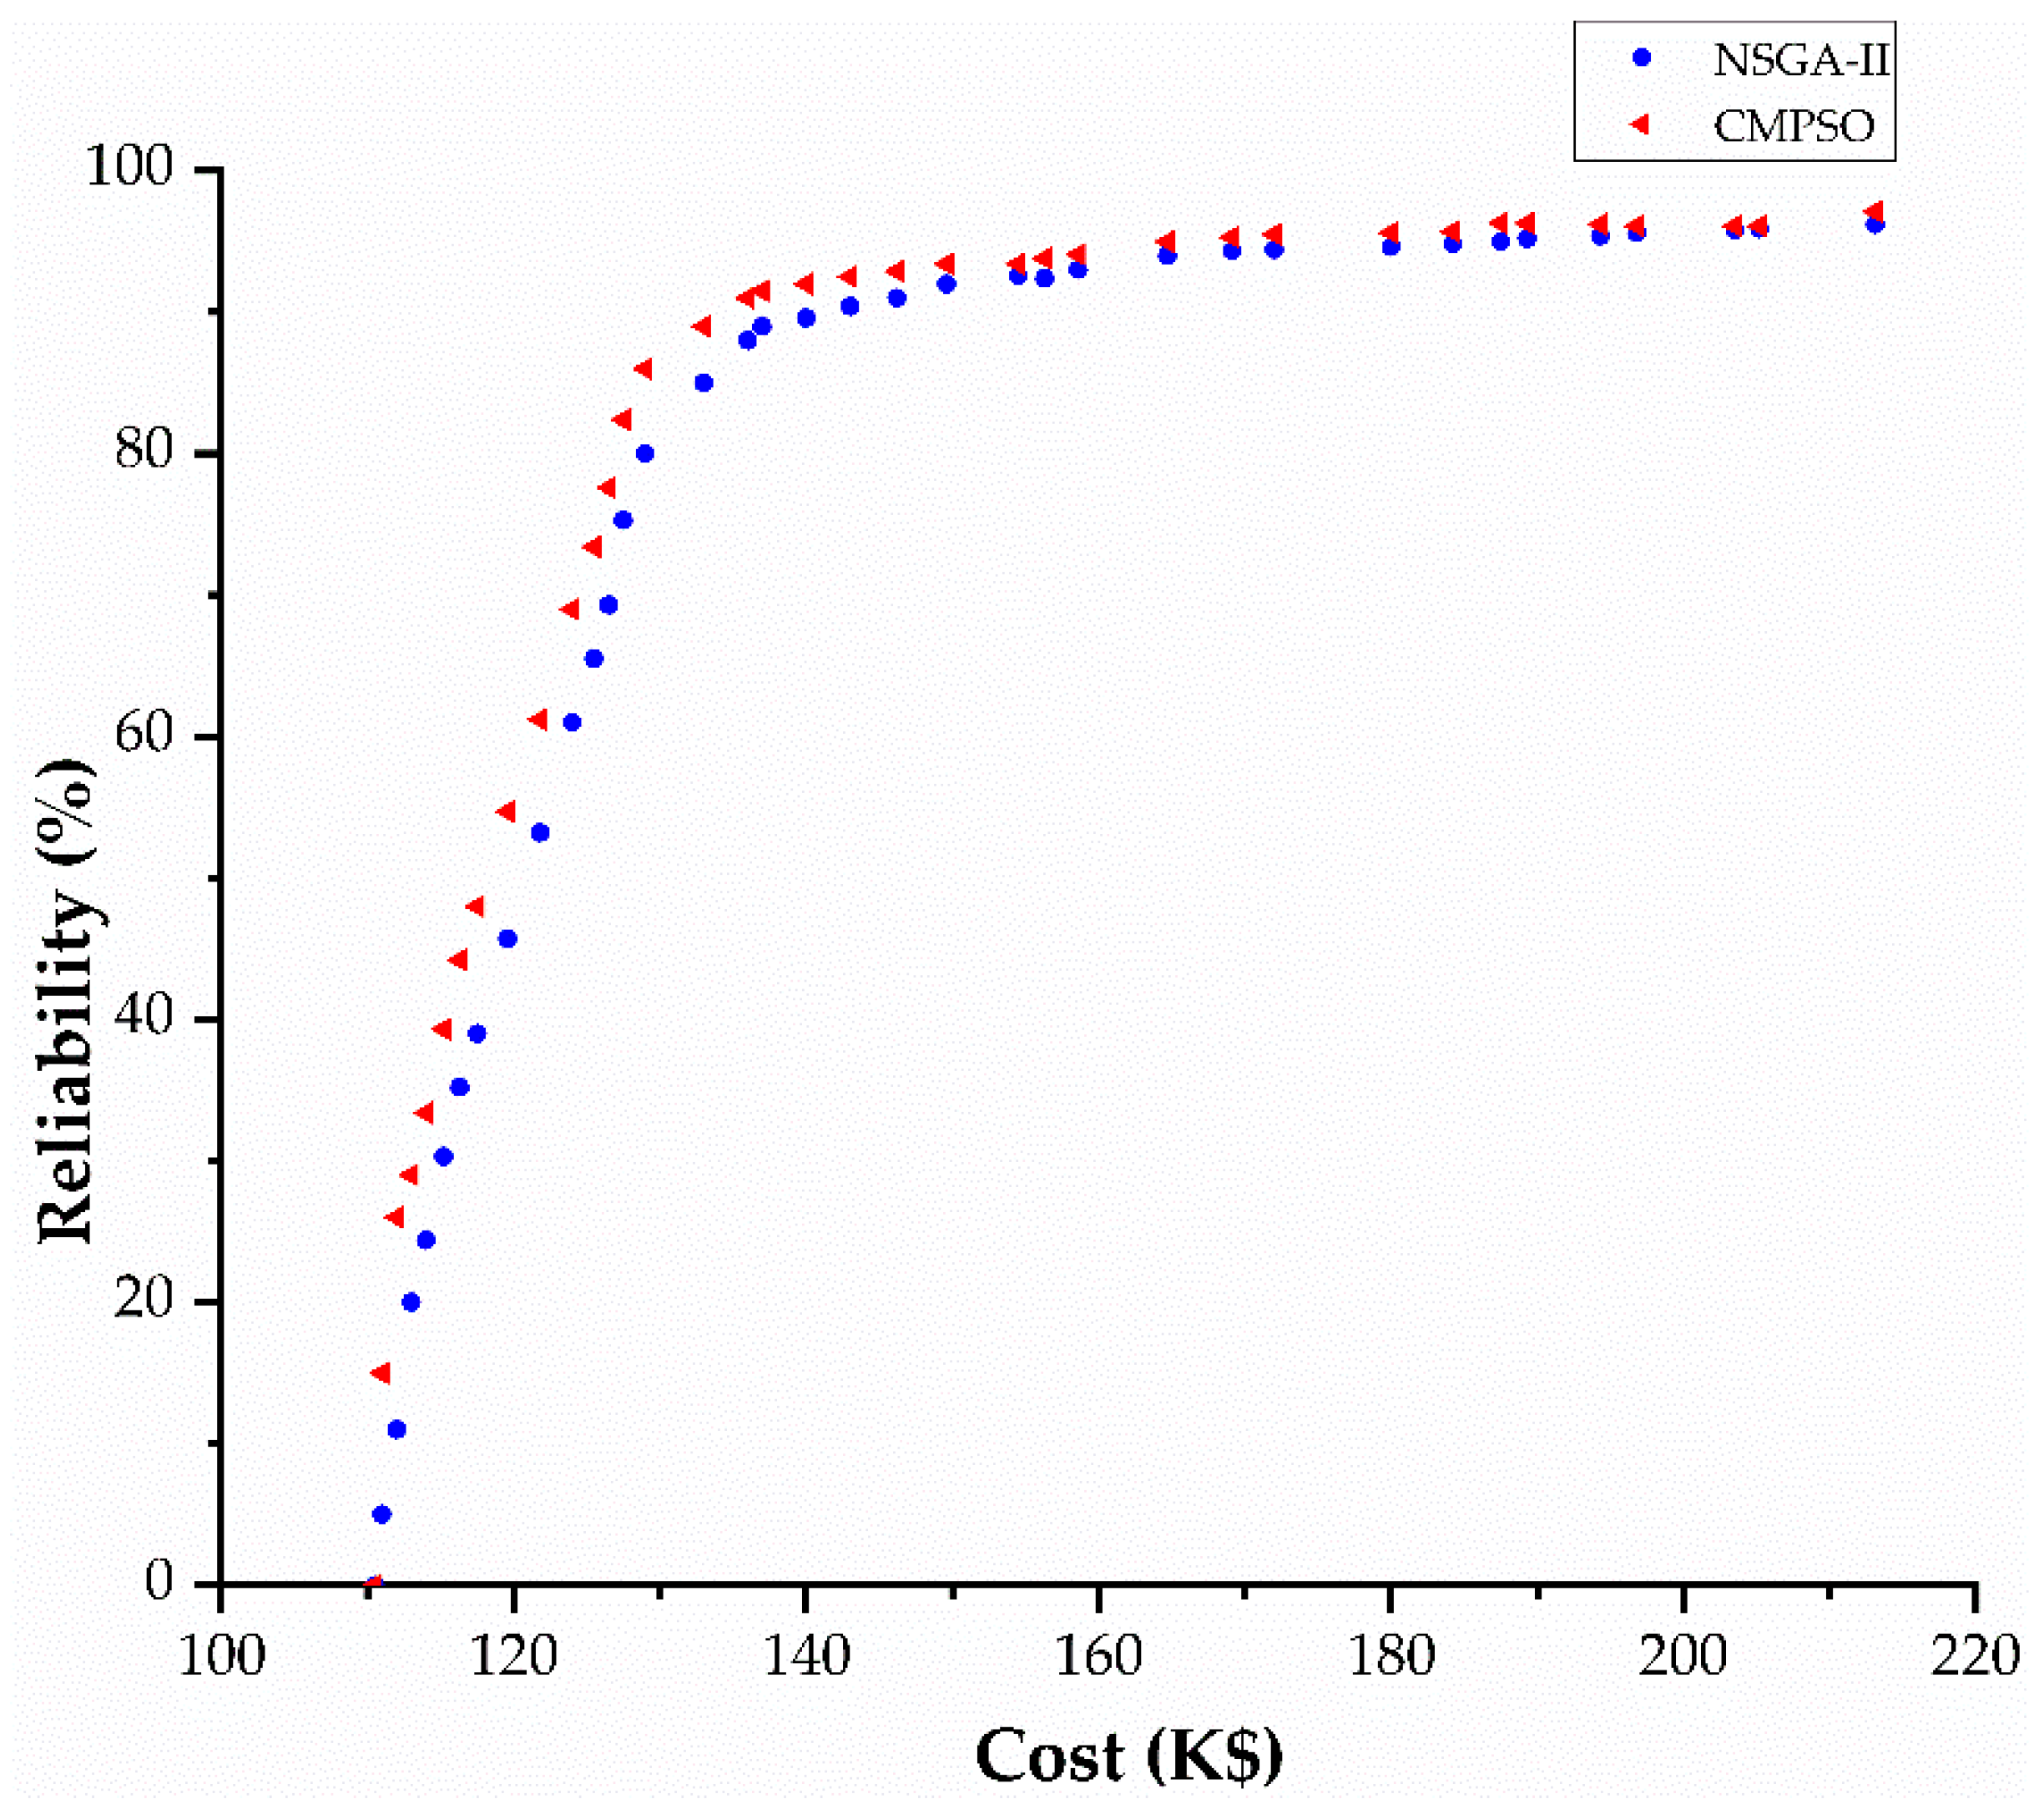
As observed in
Figure 6, after 600 iterations, the Pareto fronts of cost reliability—dimensional, which are provided by CMPSO, are more precise and faster than those provided by the NSGA-II algorithm.
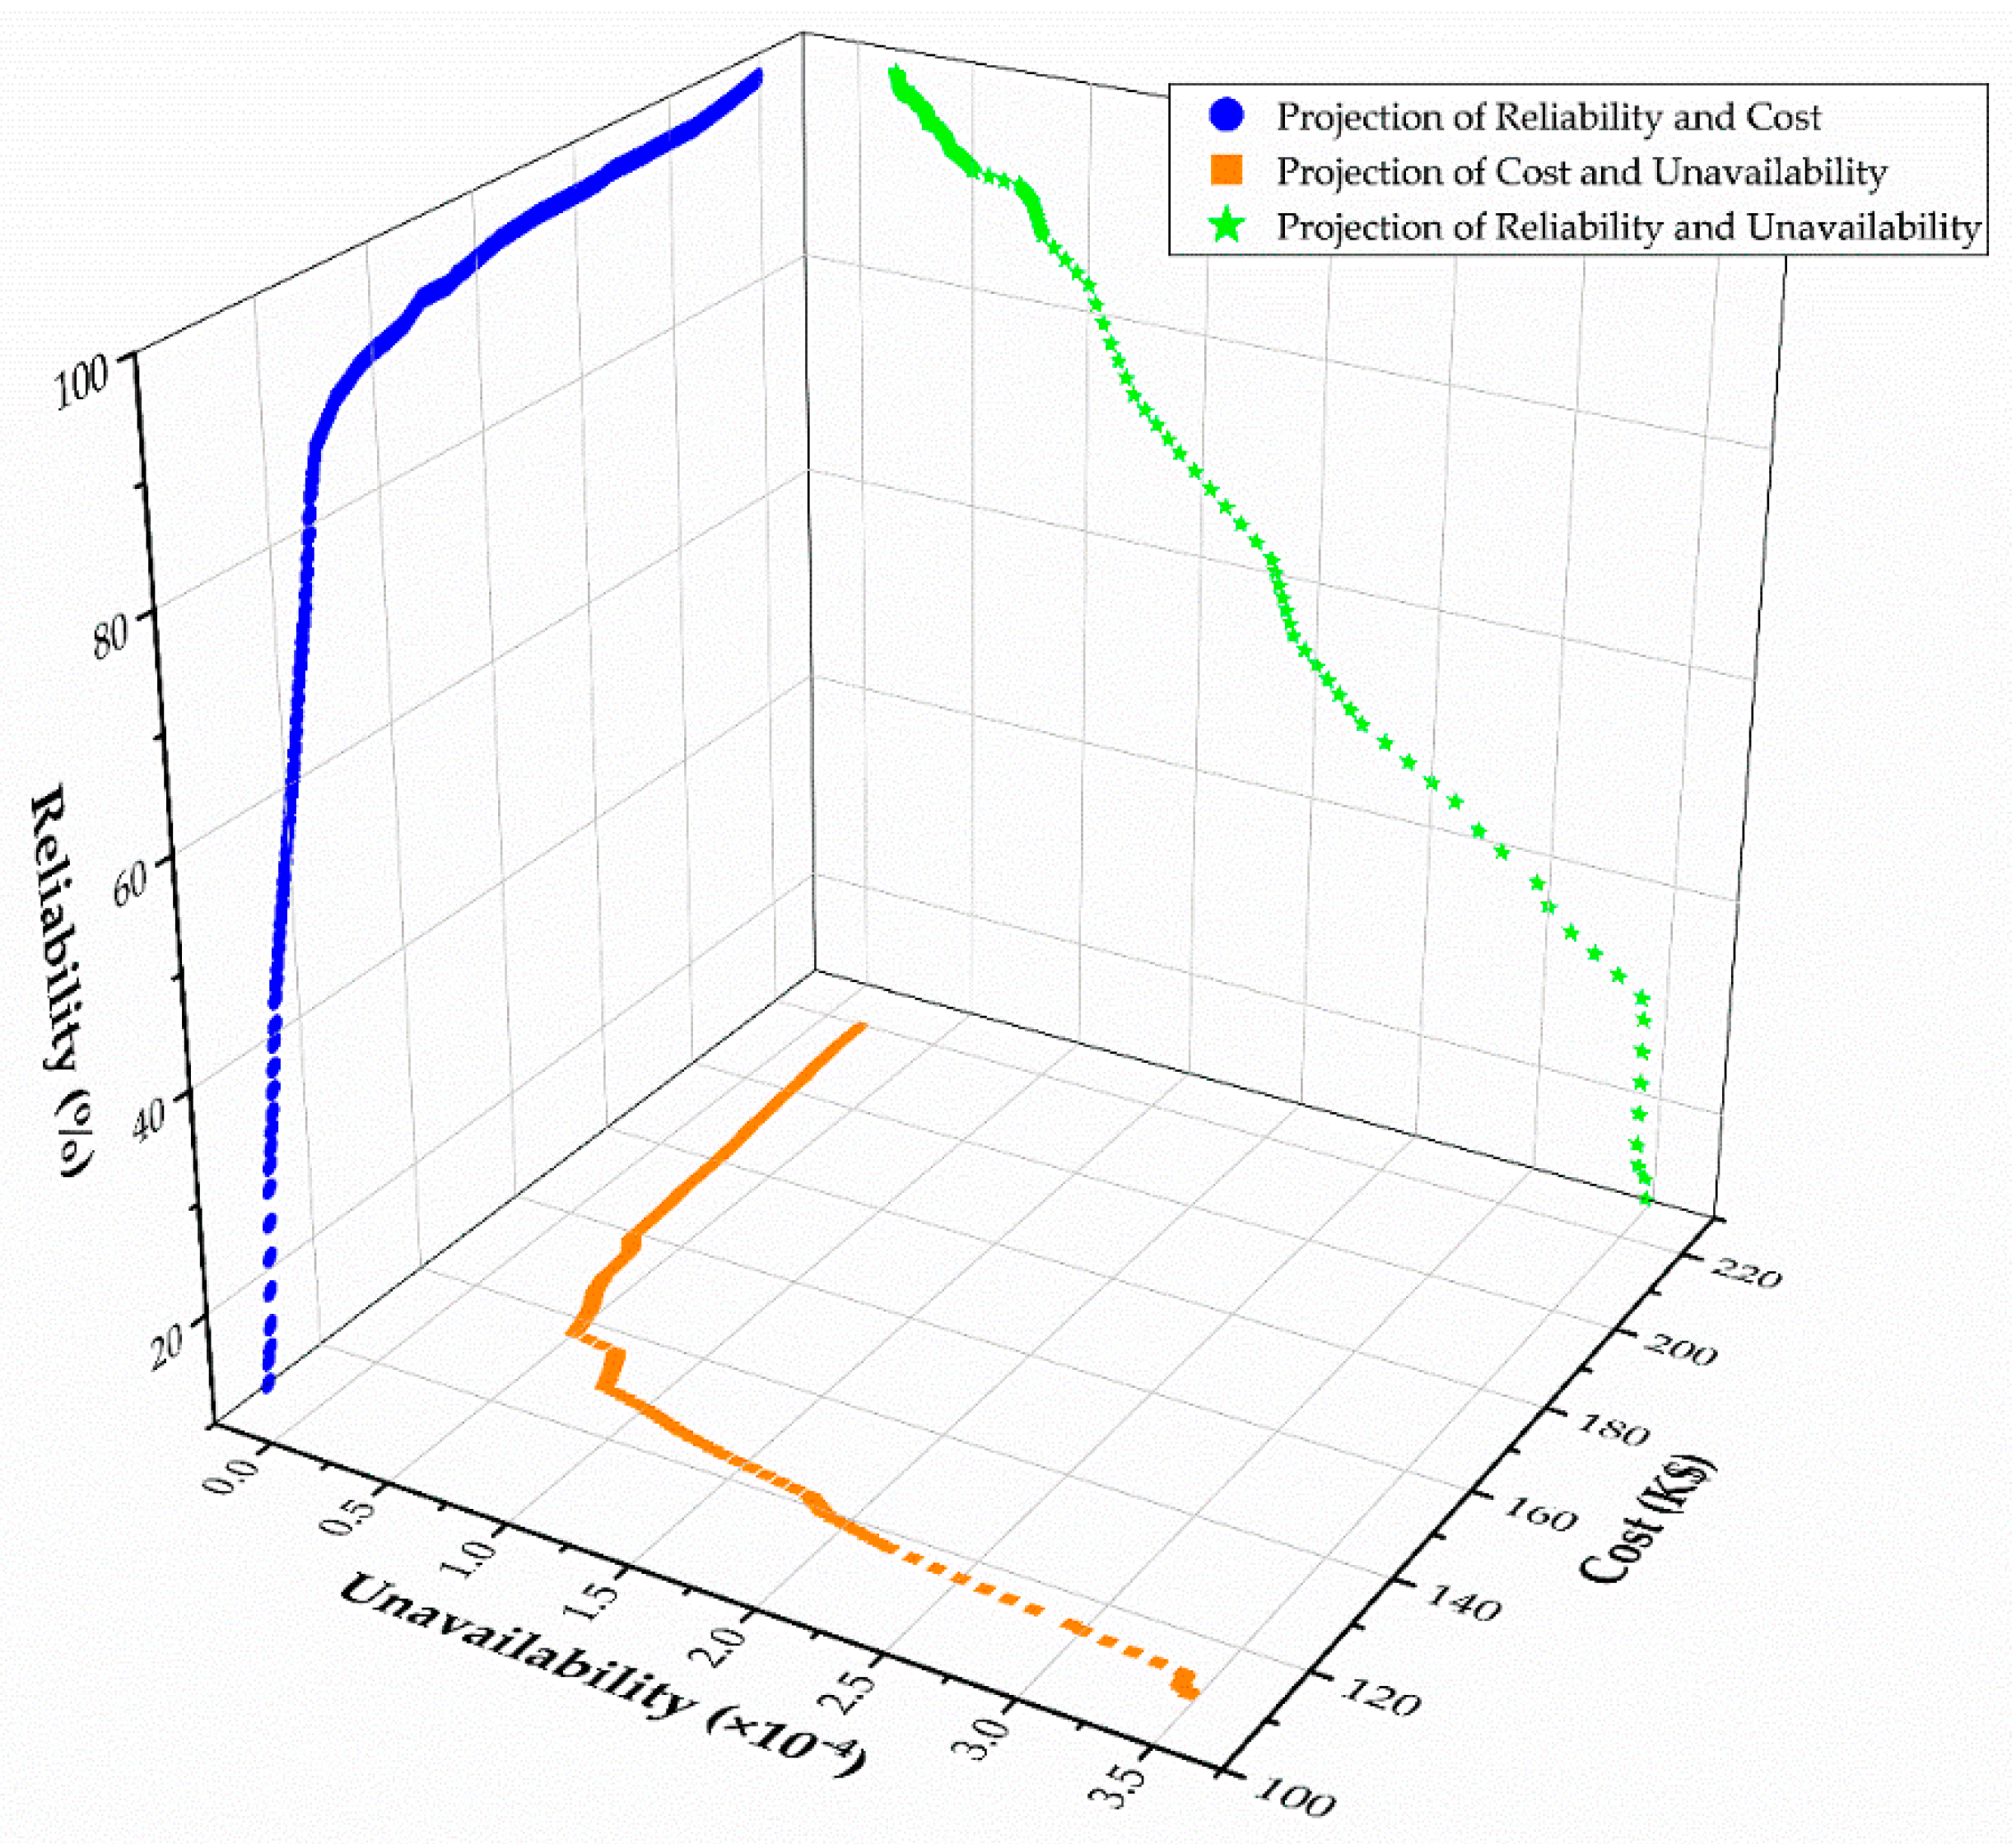
In
Figure 7, the orange squares in the x‒y plane represent the two objectives (cost and unavailability), which show contradictory trajectories. As the cost goes up, the risk of unavailability becomes smaller. The green stars in the x‒z plane show the contradictory relationship of unavailability and reliability. The blue dots in the y‒z plane represent two objectives (cost and reliability) that show a positive relationship of mutual rising. As the cost increases, the reliability rises until it becomes stable.
Figure 7 indicates that the optimum solutions are achieved with reliability (>93%) and unavailability (<0.5 × 10
−4) when the cost is greater than
$140K. Thus, more attention would be given to this multi-objective zone during the selection process.
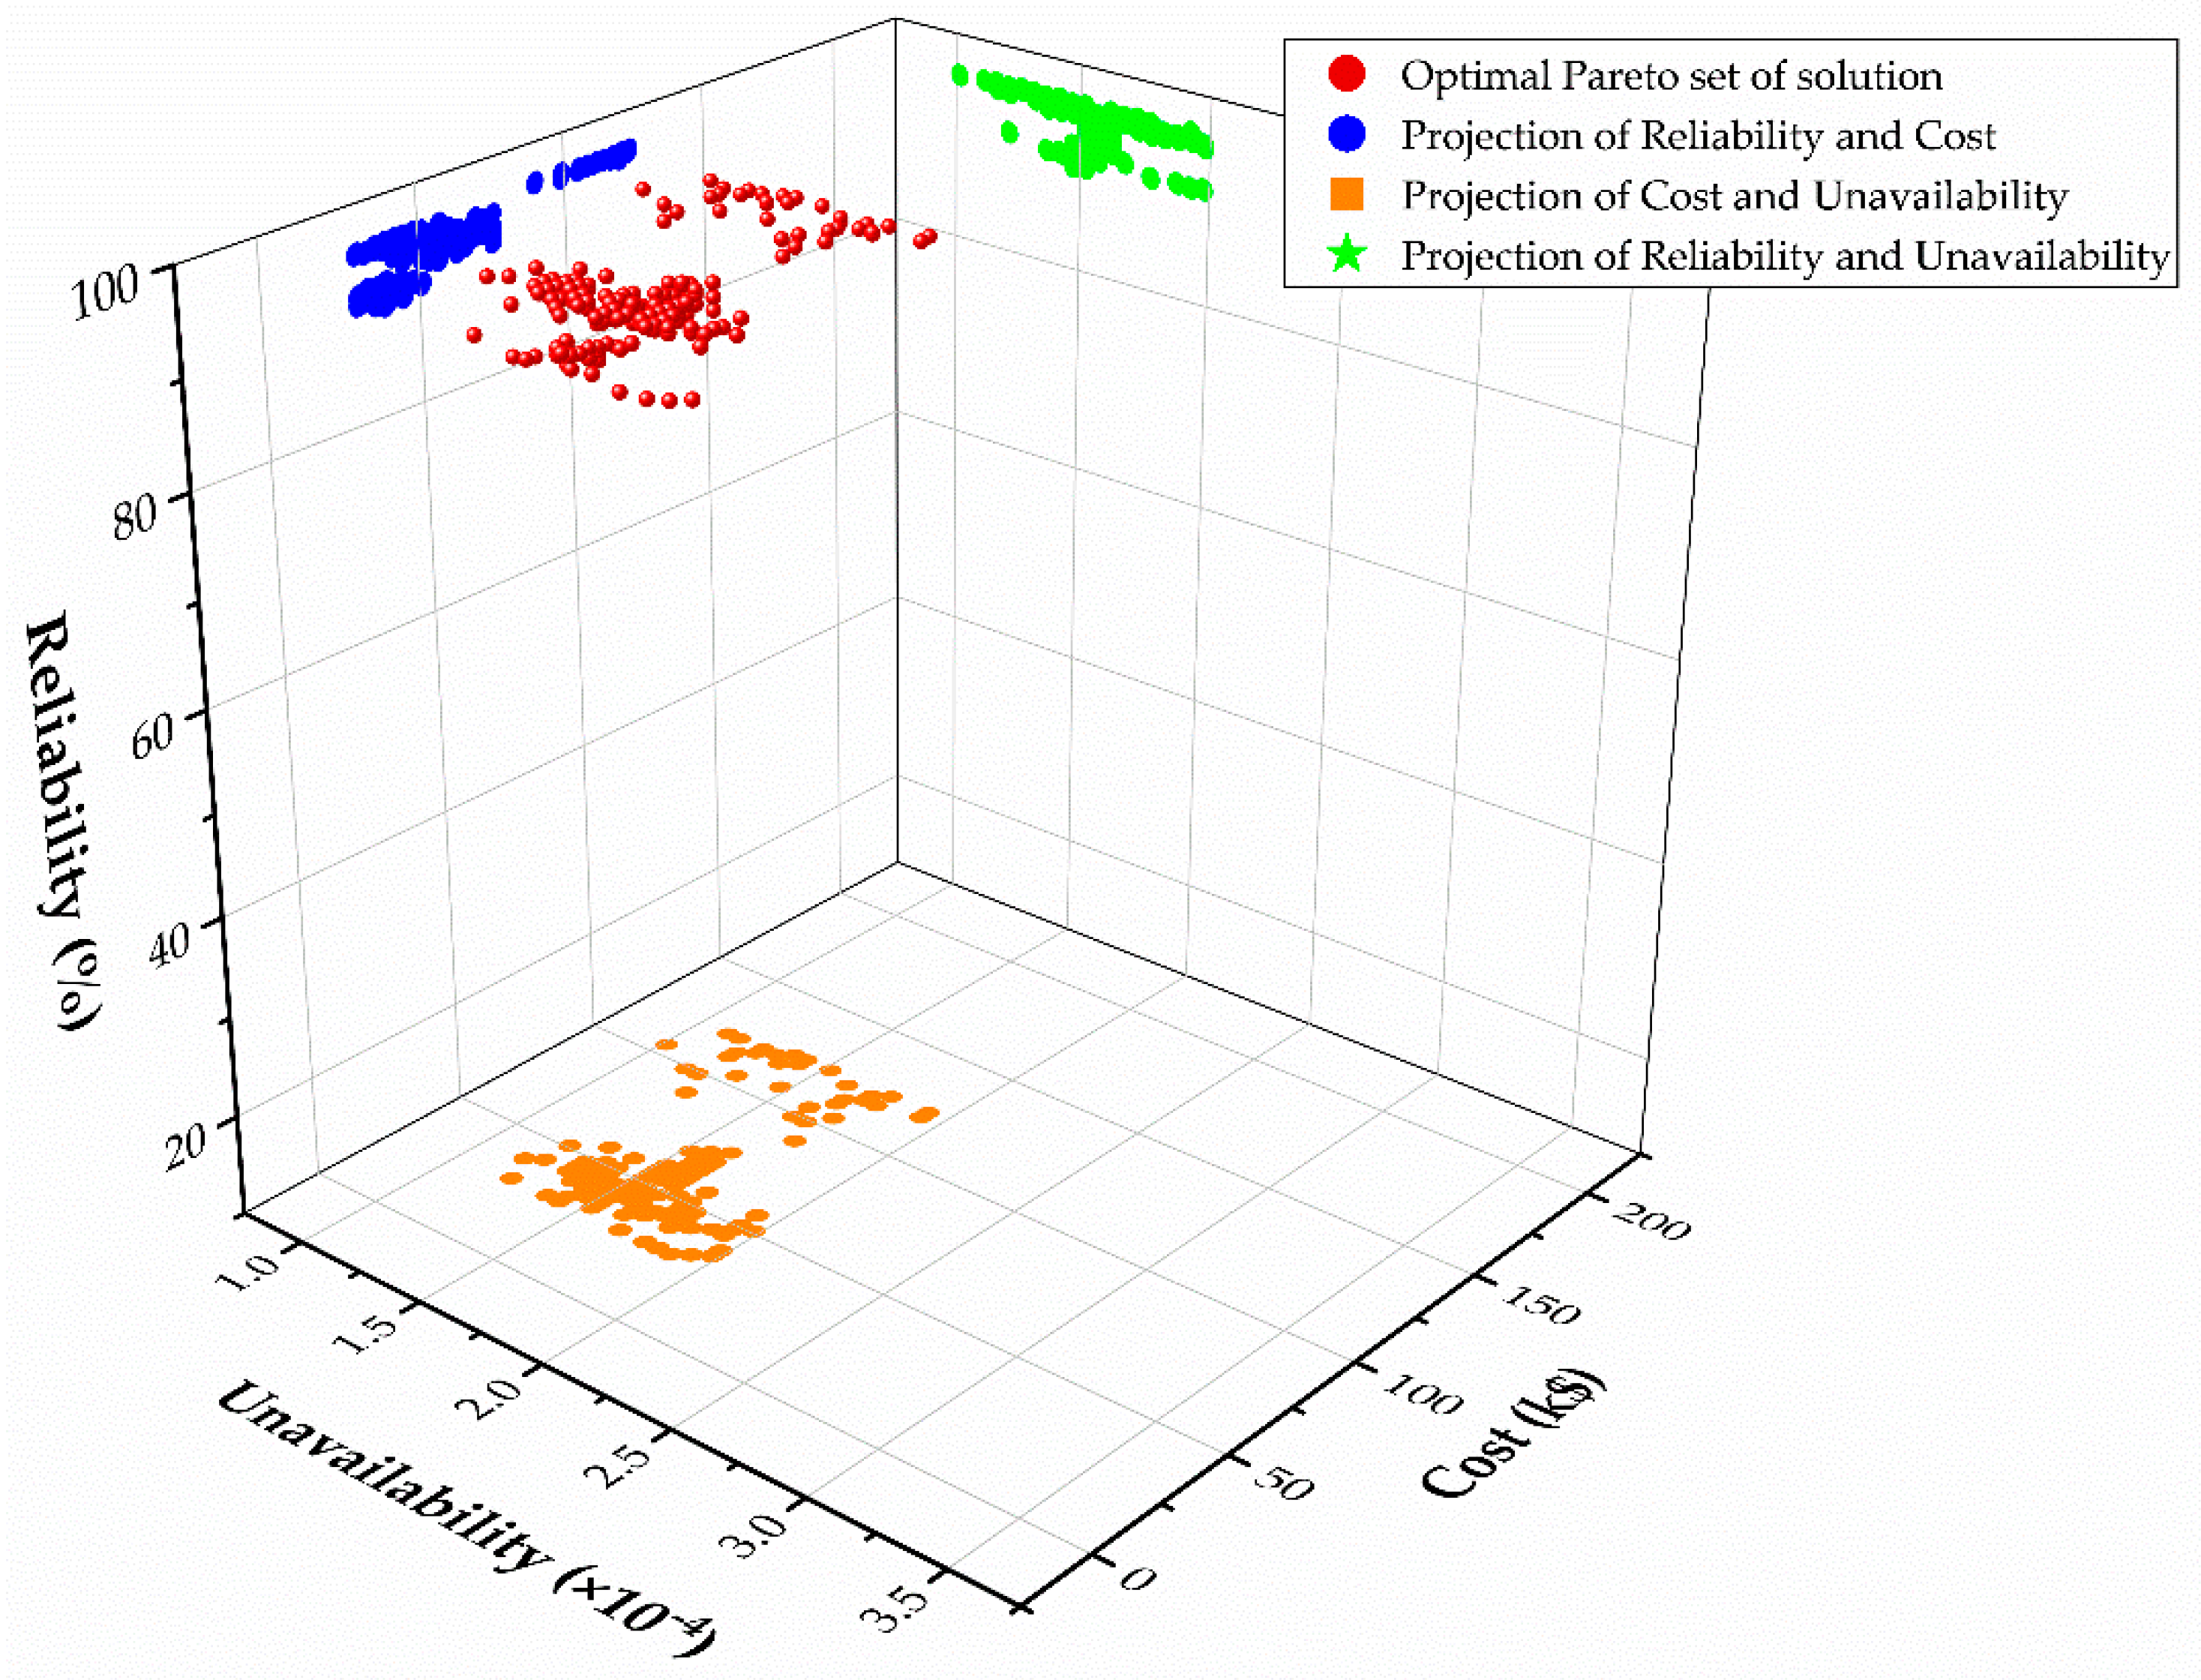
In
Figure 8, the red spheres of the distributed surface represent a graphically optimal Pareto set of three-dimensional solutions. Orange cubes, green stars, and blue dots are the projections of the optimization objectives in three planes.
Figure 8 illustrates the final optimal Pareto front, which was obtained from the CMPSO algorithm. The optimum solutions have reliability (>90%), but the unavailability and cost vary (0.5 × 10
−4 < U(x) < 1 × 10
−4), (
$25K < C (x) <
$125K). Therefore, more decision criteria are essential to deal with the unavailability and cost variance for maintenance selection. Moreover, maximizing the system reliability ensures that the unavailability and cost are optimized for maintenance selection with regards to the decision-making criteria, especially for a multi-objective problem. Furthermore, the lower cost is related to the measures of high unavailability and very low reliability. As such, the decision-maker should always consider both the risk of unavailability and the maintenance costs. The final set of the optimal Pareto front has 200 valid solutions in the reliability‒cost‒unavailability dimensions.
Finally, each element of the optimal solution is unique when all objectives are concerned. Consequently, it may not be possible to select all elements for the optimization problem. Therefore, the decision-maker needs assistance to select the best solutions efficiently. In this respect, the final step of the proposed RCM model will be held in the decision phase by the assistance of the ANP and DMDT approaches.
4.3. Multi-Criteria Decision-Making Phase and Performance Evaluation
4.3.1. ANP Weights of Evaluation Criteria
In this step, the ANP approach was used to compute the weights of maintenance decision criteria and alternatives. By using those weights, the developed maintenance decision tree (DMDT) was adopted to select maintenance policies and scheduling.
In order to find the evaluation criteria weights, the CMMS data of historical operation and maintenance were analyzed and collected. Then, a pairwise comparison of the six evaluation criteria was set up by engineers and experts from the production, safety, and maintenance departments. Each pairwise evolution was determined based on the nine scores in Saaty [
45].
The relationships between the criteria and their alternatives were determined in judgment matrix A; see Equations (18) and (19).
Table 4 shows the pairwise comparison of the six criteria to the goal; then those weights are placed in the column
of matrix A.
Then, the inconsistency ratio was derived from Equation (20); CR = 0.04758 (an acceptable value is less than 0.1).
The same pairwise comparison steps were followed to construct the remaining columns of matrix A. For the criteria feedback effects, four tables were organized to generate columns
of matrix A and six tables were organized for every criterion to create the matrix columns
. Moreover, the final weights of the supermatrix were determined in Equations (21) and (22), as shown in
Table 5. The ANP supermatrix calculation was executed and verified with MATLAB 2018b software. The final weights of each decision criterion and alternative are shown in
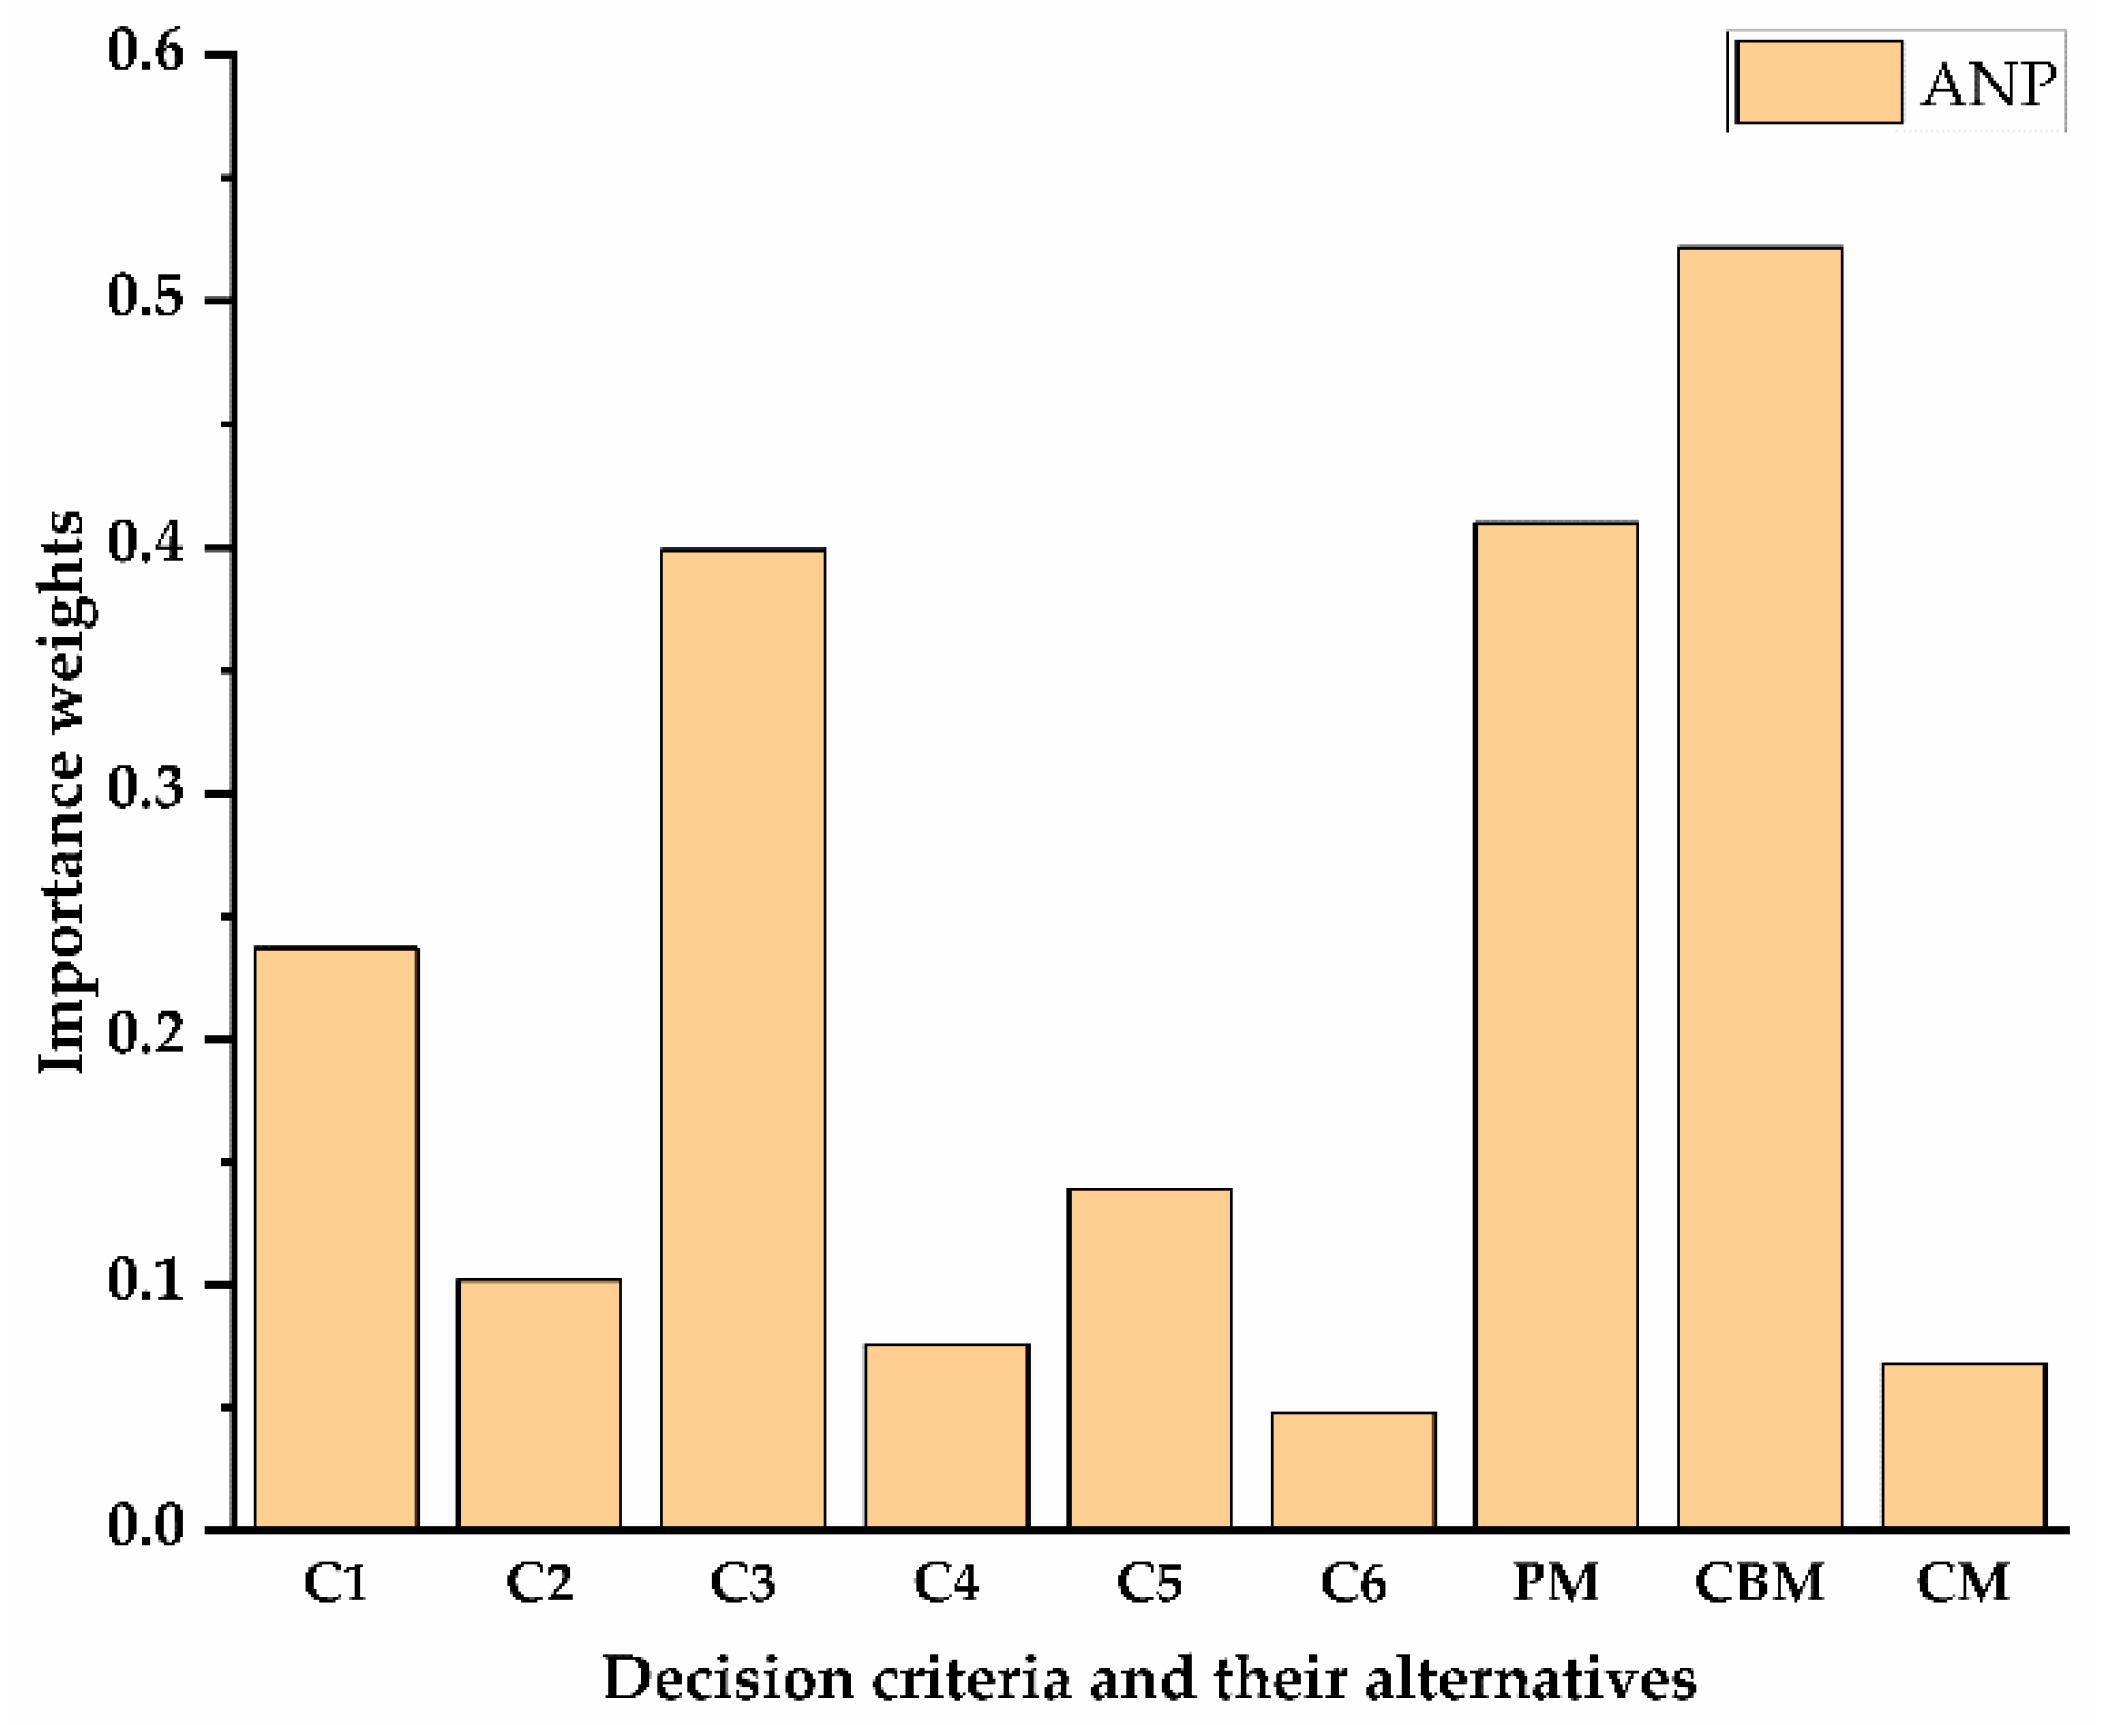
Table 6 and
Figure 9.
Figure 9 shows that C3 (the safety effect) has the highest rank among the maintenance decision criteria, followed by C1 (the maintenance cost) due to the importance of safety effects in the oil and gas field, which validates the proposed methodology. C6 (the unavailability of spare parts) has the lowest rank due to the ability of the CMMS system, which can organize the spare parts automatically.
CBM (condition-based maintenance) has the highest rank among the maintenance policies, followed by PSM (preventive scheduled maintenance) due to the influence of machine condition monitoring and maintenance planning in failure prevention that is associated with a hazardous field such as oil and gas plants.
4.3.2. Maintenance Policy Selection and Evaluation
After the prioritization of decision criteria and alternatives, the proposed developed maintenance decision tree (DMDT) was implemented to select appropriate maintenance policies and scheduling.
Table A1 reveals the selected maintenance policies and the schedule of the proposed RCM model for the failure modes of the electrical generator.
From
Table A1 in
Appendix A, the FMs with highest risk priority are suited to CBM because of the strong impact of CBM on machine condition, production loss avoidance, and failure prevention, especially in a hazardous field such as oil and gas plants. Furthermore, PSM and CM policies are assigned for FMs with medium and low risk, respectively. Likewise, the highest-priority FMs are OT4, ME3, and OT2, which required more condition monitoring due to hazardous gas leakages and mechanical component failures. Thus, these findings demonstrate the validity of the proposed maintenance decision-making methodology.
To validate the applicability of the above maintenance plan, the selected maintenance policies and scheduling were executed within 72 weeks for the electrical generator unit in a Yemeni oil and gas plant. The significant results are as follows:
Triple transmitters were installed to overcome the functional failure of critical measures such as vibration, temperature, and gas detection. Moreover, controller redundancy improves the safety and reliability of operations and maintenance. For instance, the installation of triple gas detectors cost $3030 and saved 5 h of production loss and a machine shutdown cost of $5000.
For critical valves and instrumentations, functional testing and recalibration were carried out at a workshop before the field installation, which reduces the failure rate and determines any fluctuations in service at an early stage.
Critical activities were carried out during shutdown or overhaul; this scheduling avoids production losses and equipment failure.
For different sampling points, an oil analysis was carried out, which gave useful information about when the oil must be changed due to the impact of load and condition changes.
For operator error prevention, training and operation procedures were carried out. For instance, operator decisions traditionally depend on experience, which varies from one operator to another.
Modification of the graphical display and control logic is necessary to simplify the control view and avoid repeatable control failures.
Moreover, there is no task of “run to fail” at all in the proposed maintenance plan due to its safety impact in a hazardous oil and gas environment.
The optimization results of RCM implementation in comparison with traditional RCM for electrical generators are summarized in
Table 7. It is worth highlighting that the optimization results were improved after the execution of the proposed plan due to the field experience of the maintenance team that solved most of the practical maintenance issues. As seen in
Table 7, it is clear that, in general, the proposed RCM model has sufficient effectiveness in terms of reliability and unavailability and represents a real cost reduction—of 38.7% in comparison with the traditional model.
For the validation of the proposed RCM model, the proposed model was compared with other RCM models based on the electrical generator case study. Therefore, the traditional RCM model, the RRCM model [
9], and the NA-RCM model [
7] were selected for comparison to appraise the benefits of the proposed RCM model.
Table 8 reveals the risk prioritization and selected policy results of the four FMs derived from the above RCM models.
In
Table 8, the priority orders of FMs for the proposed model and the NA-RCM model [
7] are similar to each other, but different from the traditional RCM model and the RRCM model [
9]. This proves the validity of our proposed RCM model. Additionally, ME3 has been replaced by OT4 in the proposed model due to the advantages of using risk assessment, which has a safety impact on the final risk. CBM was selected as the optimal policy of the proposed RCM model. However, there are slight differences in the optimal selected policies due to the considerable differences in the optimization algorithm and multi-criteria decision-making, which are adopted by the proposed RCM model in relation to the literature in
Table 8. Hence, the proposed RCM model has a better discrimination degree than the traditional RCM, the RRCM [
9], and the NA-RCM [
7] models. By comparison, the results reveal the ability of the proposed RCM model to find the optimal maintenance policy in a hazardous environment.
This study shows that the proposed RCM model is the most suitable for selecting the optimum maintenance policy and scheduling in a hazardous environment. This can efficiently support industrial engineers in their decision-making and overcome the time-consuming nature and the complexity of extended RCM models, such as the game theory RCM model [
18] and the mode-based RCM model [
49].
The application of the proposed RCM model in an oil and gas plant shows how companies can benefit from the new optimization and policy selection methodology. Furthermore, the application of the proposed RCM model proves that the implementation of the proposed maintenance plan helps with creating practical tasks and schedules. Moreover, the proposed RCM model has a better ability to deal with interdependencies and feedback effects due to considering all relationship weights among all possible decision criteria through the ANP approach.
As a result of the above case study, the findings of optimization and policy selection were offered to the maintenance department at a Yemeni oil and gas company to update the current maintenance plan, particularly in order to prevent potential failures and improve the system reliability.
5. Conclusions
This paper presents the application of a new hybrid RCM model that integrates the HL-FMEA, CMPSO, ANP, and DMDT approaches and is suitable for use in a hazardous environment. The HL-FMEA approach was used to identify and prioritize the risk weight of FMs. Moreover, the CMPSO algorithm was applied to handle multi-objective optimization problems. ANP and DMDT were applied to determine the optimal maintenance policy and schedule for every FM cost-effectively while sustaining the reliability requirements in a hazardous plant. The validation of the RCM model was carried out through a practical application study and analysis of the electrical generators of an oil and gas plant in Yemen. The three phases of the proposed methodology were integrated into the new RCM model to overcome the main shortcomings of the traditional RCM model.
The results of the case study show that the proposed RCM model is capable of optimizing the risk and cost with reducing reliability. Furthermore, the decision algorithm has a reasonable consideration for the criteria weight of safety, production loss, and repair cost for carrying out the selection of maintenance policy and schedule. This study also points out that multi-objective prioritization, optimization, and decision-making methods can be integrated into other applications such as design optimization and process management. Moreover, the model offers a quantitative and qualitative approach that is well-structured to assist decision-makers, especially in selecting relevant maintenance policies and actions instead of making a decision based on expert opinions only.
To our knowledge, the proposed hybrid RCM is the first RCM model that deliberately combines the effects of the three phases, rather than the approach of traditional RCM, which only evaluates FM independently and ignores the combined effects of safety, production loss, and repair cost on the whole machine.
Overall, the results of the present research demonstrate that costs can be optimized by secluding CM tasks to reduce the interval of the electrical generator maintenance and inspection in relation to the equipment reliability and area risks. Also, the model provides a good defense against any sudden failure, which may happen before or after a planned maintenance event. In addition, companies could tap into this model to evaluate and classify their risk in order to prevent future failures and help their decision-makers, especially in hazardous areas such as nuclear and gas electrical plants. Future research should adapt the model using artificial and automatic approaches, such as ANN and machine learning, so that experts and engineers can enhance maintenance plans.


