1. Introduction
Discrete Event Simulation (DES) is an approach to event-based simulation through which a real productive system can be represented, whether for goods or services, using a dynamic model over time [
1,
2]. This type of simulation is recognized as a suitable technique for the quantitative analysis of highly complex operations, since it can provide objective elements to traditional management in construction, where decision mechanisms based on the intuition and experience of the decision-makers involved in the project persist [
3].
Part of the complexity considered by the DES models corresponds to the nature of the activities to be represented and the variables involved. For healthcare services, the type of procedure to be performed, the human resources involved (doctors, technicians, nurses, others), the infrastructure and equipment, the coordination of the services and, undoubtedly, the specific condition of each patient must be considered [
4].
The complexity underlying healthcare services is related to high acquisition and operation costs [
5]. They require an adequate amount of resources to ensure quick attention times for patients and financial sustainability over time for appropriate use of resources and avoidance of idle or overload problems [
6,
7]. Some services, such as coronary computed tomography angiography (CCTA), are costly, ranging from
$4630 to
$8380 per patient, due to the complexity of the equipment, the materials, the procedures and the technical personnel involved [
8].
Among the uses of DES models are cost assessments of implementing new therapeutic technologies for patients with major depressive disorders, in which they yield better results compared to other models such as the Markov model [
9]. This study focuses on logistical elements to determine the resources needed to meet current demand and reduce waiting times, although it does not incorporate cost and economic analysis.
Ambulance management is another example of the application of DES models, where the interaction of elements such as patients, hospitals and health authorities is considered in the analysis of response times of these units, mainly for patients with Acute Coronary Syndrome [
10]. Unlike this case, the model focuses on the interaction of the arrival of patients with the resolution capacity of the angiography room by defining the resources needed, instead of using optimal distribution routes.
Another DES application was carried out in the orthopedics and neurosurgery specialties, where the objective was in the possible configurations of both services to reduce waiting lists and attention times [
11]. The proposed model considered the availability of different amounts of resources for patient care considering the utilization rate and waiting times to determine the optimal level of resources.
One of the concerns of emergency departments is the availability and occupation of beds for their patients. DES models have been used to analyze different queuing disciplines in these situations, with triage prioritization being the most convenient [
12].
Another way in which the performance of an emergency department can be assessed is by analyzing different scenarios considering the physical layout of the site, which can improve bed utilization rates [
13]. The model developed considers a queue discipline for First-In-First-Out (FIFO) patients, which was used in the service while data were being collected. The research also focuses on a room that performs catheter angiographic procedures and not on a functional healthcare center service, for which it is essential to consider that the emergency department may require the angiography room in some instances.
Another element for analyzing the efficiency of healthcare services is the bottleneck (process restriction), which determines the maximum number of patients that can be attended to and the average waiting time required to receive care. This situation occurs when the demand exceeds the supply or installed productive capacity of a service. In some cases, this restriction is based on the time it takes the patient to get from one place to another [
14]. The analysis of this study also considers the constraints theory. However, it is based on the installed productive capacity of the angiography room under the conditions at the time of the study and scenarios where the supply is increased to reduce patient waiting times.
Waiting time is often one of the causes of dissatisfaction among healthcare service users, particularly in patient registration, which is the first contact with users. In these services, with a 24 h availability, simulation is considered as an option to devise improvements that do not affect operation [
15]. This analysis consisted only in verifying and validating the simulation model carried out and proposes the analysis of resource requirements through scenarios for future work. This is one of the actions carried out in the project developed by the research group.
Easter et al. (2019) evaluated the performance of nine emergency department distribution design proposals by simulating discrete events and defined which option provides the best performance, combined with other elements such as one-way and two-way analysis of variance (ANOVA) [
13]. However, they used data with an empirical distribution to build the models. In contrast, in this study, the authors used a constant arrival rate, and the server rate considers a parametric probability distribution obtained from historical hospital data.
Discrete Event Simulation is one way to analyze the installed productive capacity of healthcare services, which generally experience long waiting time problems due to factors such as demand growth, access limitations and capacity reduction [
16]. The analysis carried out focuses on determining the installed productive capacity of the angiography room to attend the demand.
Shortening waiting times is critical in the provision of healthcare services to ensure timely care and avoid compromising patients’ integrity and increasing operating costs. The greater the pathological complexity treated, the higher the operating cost; hence, the importance of analyzing patient flow throughout the process to reduce waiting times [
17,
18].
Sometimes the process restrictions that affect patient flow correspond to clinical support services (laboratory, medical imaging, and others) or operational services such as administrative staff [
19]. This research considers the participation of resources as a whole and not separately, where even the angiography room could be seen as a support service to the cardiology specialty due to the procedures performed there.
Although the literature analyzed is extensive, no precedents have been found of similar works that use simulation techniques based on discrete events to optimize the demand for care in high-tech hospital wards.
This paper analyzes the installed productive capacity of an angiography room using Discrete Event Simulation (DES) as support to decision-making processes, where the number of equipment required to meet patient demand must be determined, the need to hire more staff must be evaluated, and even the acquisition of new buildings must be made, all under a logistic approach applied to high-tech rooms, such as those used to perform catheter angiography procedures. This will provide a suitable tool for optimizing hospital management.
2. Materials and Methods
During the research, a Discrete Event Simulation (DES) model was created, and a simulated model based on historical variables from the current system was built with software. The authors analyzed the duration of 2044 procedures performed between 2014 and 2015 at a hospital in San Juan (Costa Rica). The DES model considers these elements to determine critical variables such as patient flow through the several stages and departments of the process, attention times, logical sequence of activities and waiting times, among others [
3,
13].
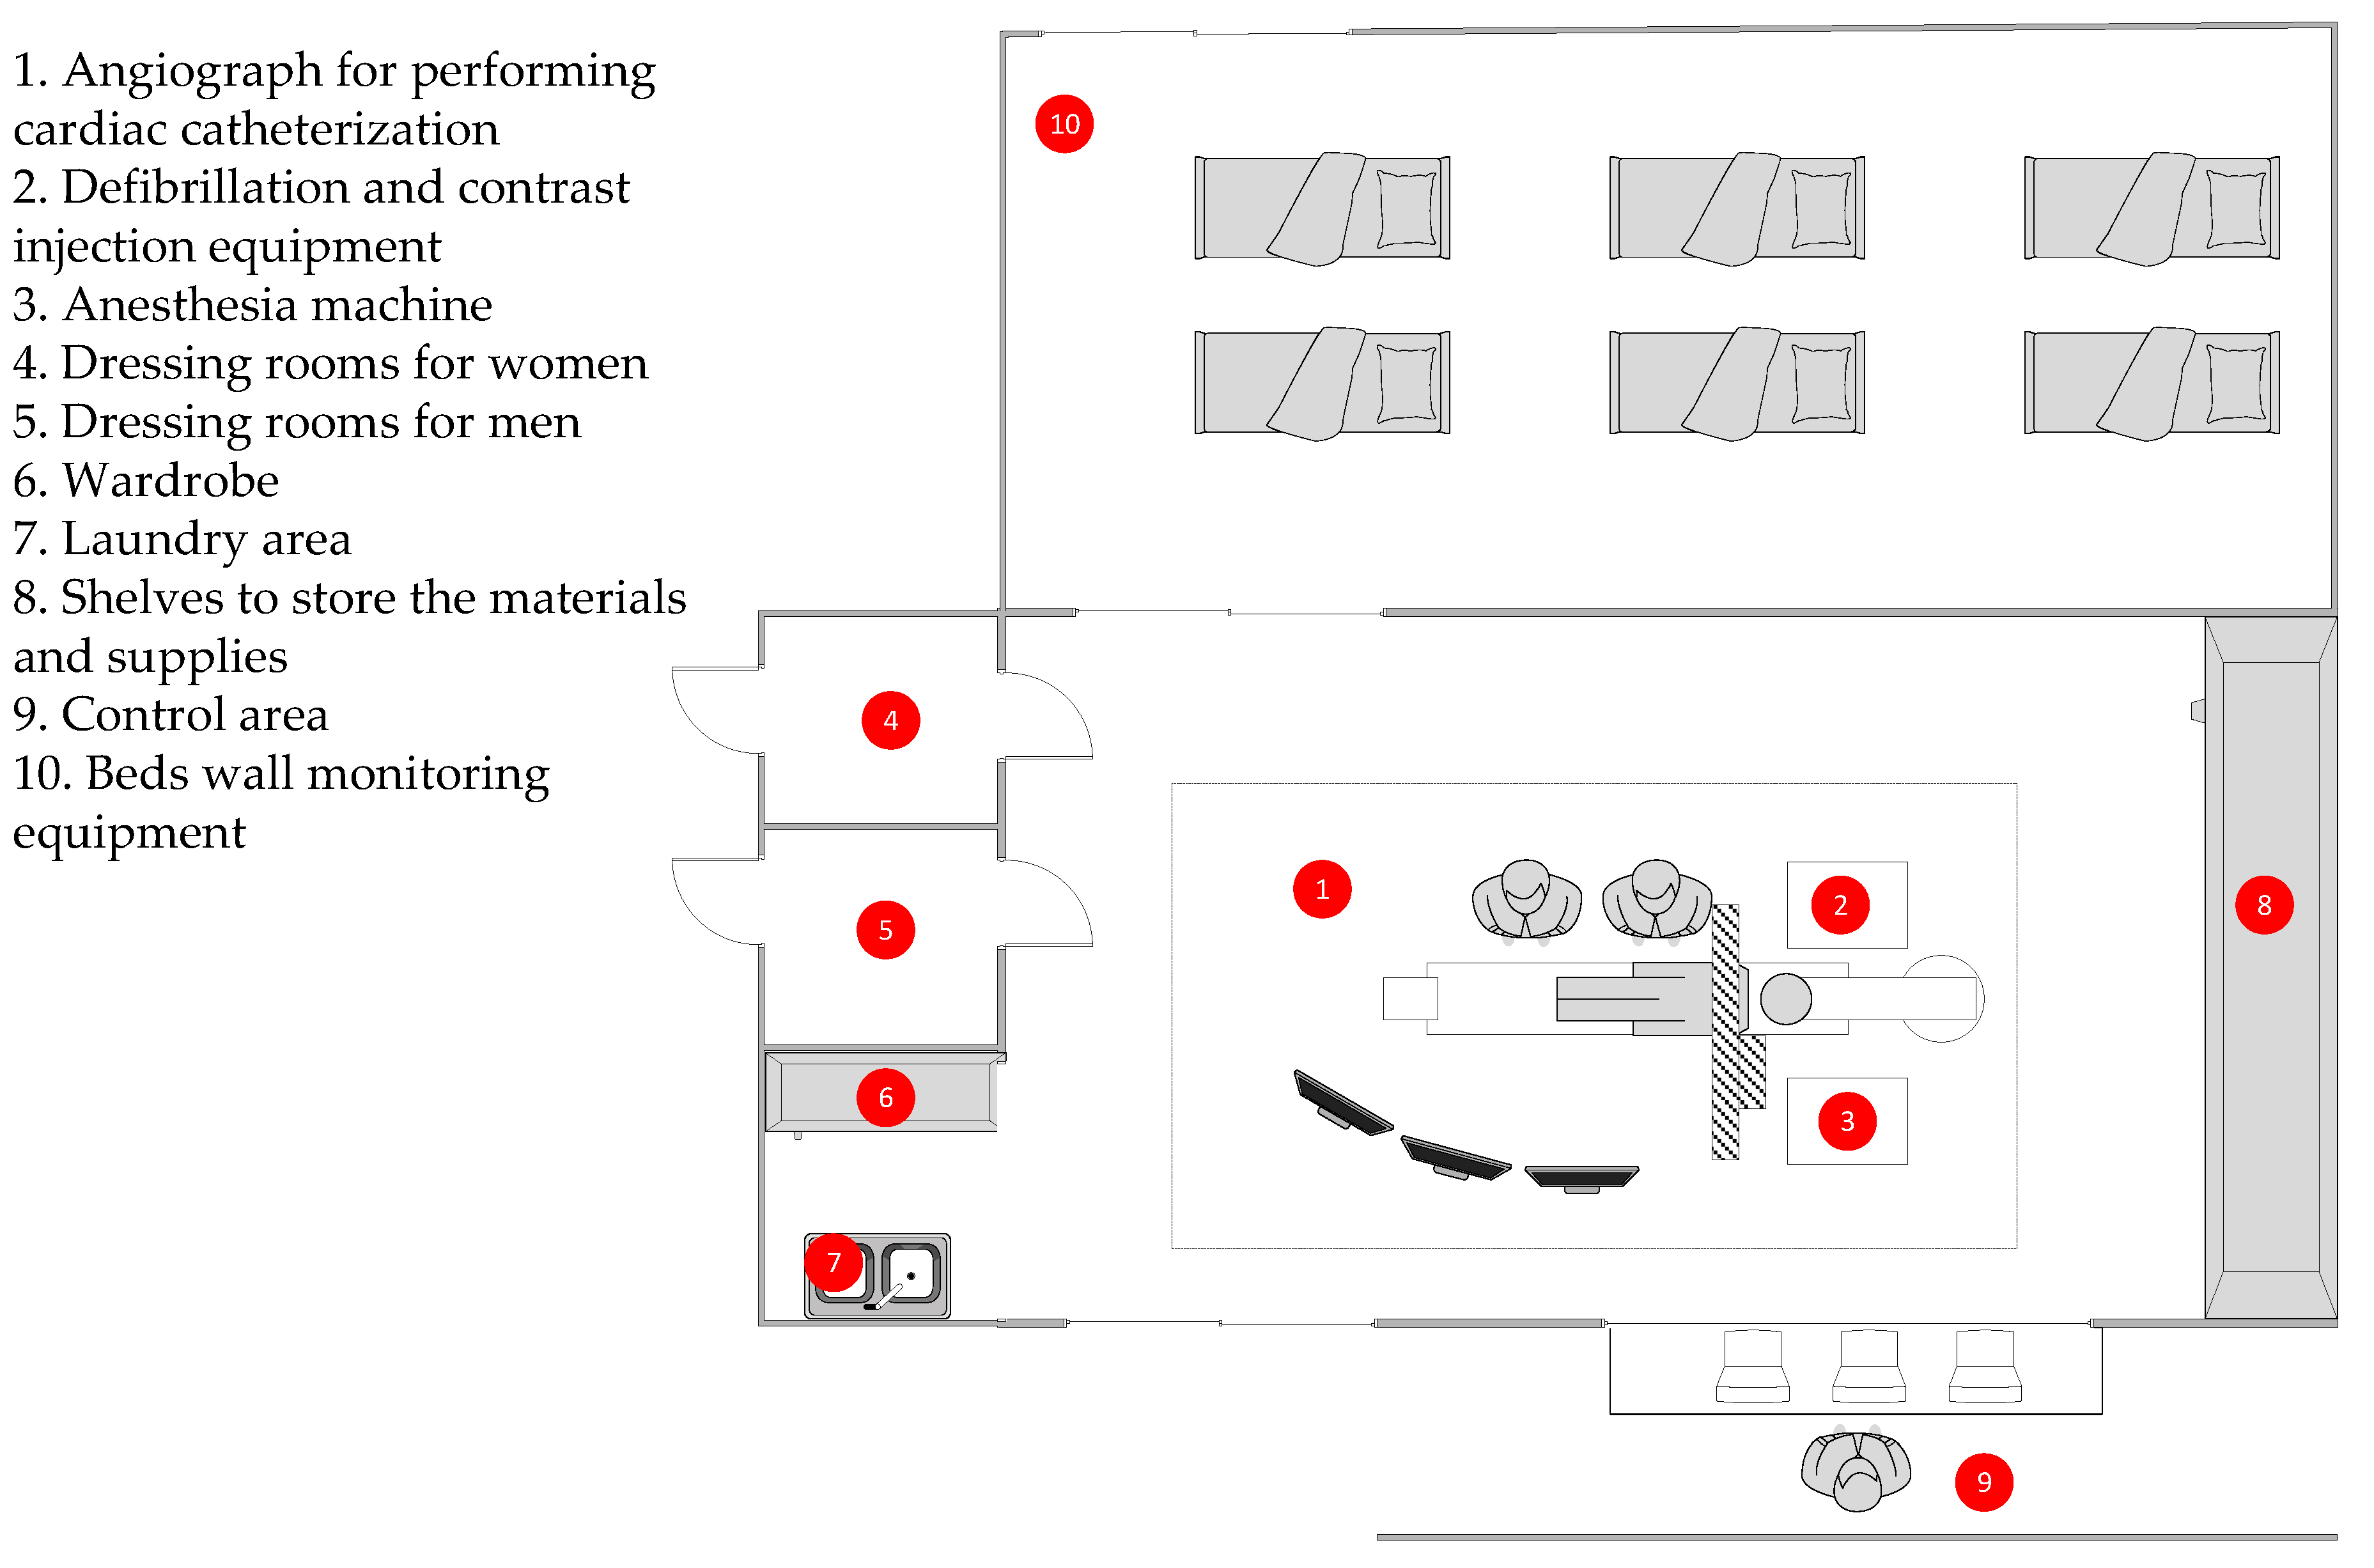
At the time of the study, the hospital had an angiograph for performing cardiac catheterization, an anesthesia machine, defibrillation and contrast injection equipment, as well as shelves to store the materials and supplies used during the procedures. It also has a control area, dressing rooms for men and women, a laundry area and a wardrobe. Right next to it, there is a space with six beds and wall monitoring equipment for the patients to whom the angiographic procedures are performed. Generally, patients must be admitted into hospital 24 h before the operation with the angiograph and remain hospitalized between 24 and 72 h after, depending on the complexity of the procedure to monitor their evolution. All these elements are specified in
Figure 1.
The structure used in this research was based on the DMAIC methodology, composed of several stages (Define, Measure, Analyze, Improve and Control), which is part of the continuous process improvement methodology known as six sigma, used to reduce variability in the processes of goods and services.
Define stage: The variability problem is established and will be addressed in the study [
20]. It corresponds to reducing the number of patients on the waiting list for an angiography procedure [
9]. Once the problem has been defined, the objective is to analyze the installed productive capacity in health services by simulating discrete events, with which to compare the number of patients expected to be treated in the angiography room with the proposed capacity.
Measure stage: A data collection plan was defined for the variables selected for the simulation model. To this end, the official information sources available to the health service under study were validated. The data correspond to records from the last seven years before this study.
Table 1 shows the variables considered. The type of probability distribution had to be determined for cycle time data. For this purpose, a goodness-of-fit test was applied to the observed data, following Equation (1).
where
is a value of a random variable whose sample distribution approximates the chi-square distribution with v = k − 1 degree of freedom, where k is the total of data that compose the sample. The variables o
i and e
i represent the observed and expected frequencies, respectively, for the i-th cell.
This test was performed at different parametric probability distributions, and the one with the best fit to the data is selected, considering the mean square error. The tool used for the analysis is INPUT ANALYZER version 15.10.00 (2019) (Rockwell Automation, Milwaukee, WI, USA) in the ARENA software version 15.10.00001 (2019) (Rockwell Automation, Milwaukee, WI, USA), which was also used to develop the simulation [
21].
Analyze stage: A simulation model of discrete events using ARENA software was created to determine how the installed productive capacity of the current service (supply) relates to patient demand. This simulation model considered the variables defined in the measure stage and other relevant elements of the current system under study. The discrete events discussed in this model correspond to the patients’ arrival and care in the angiography room.
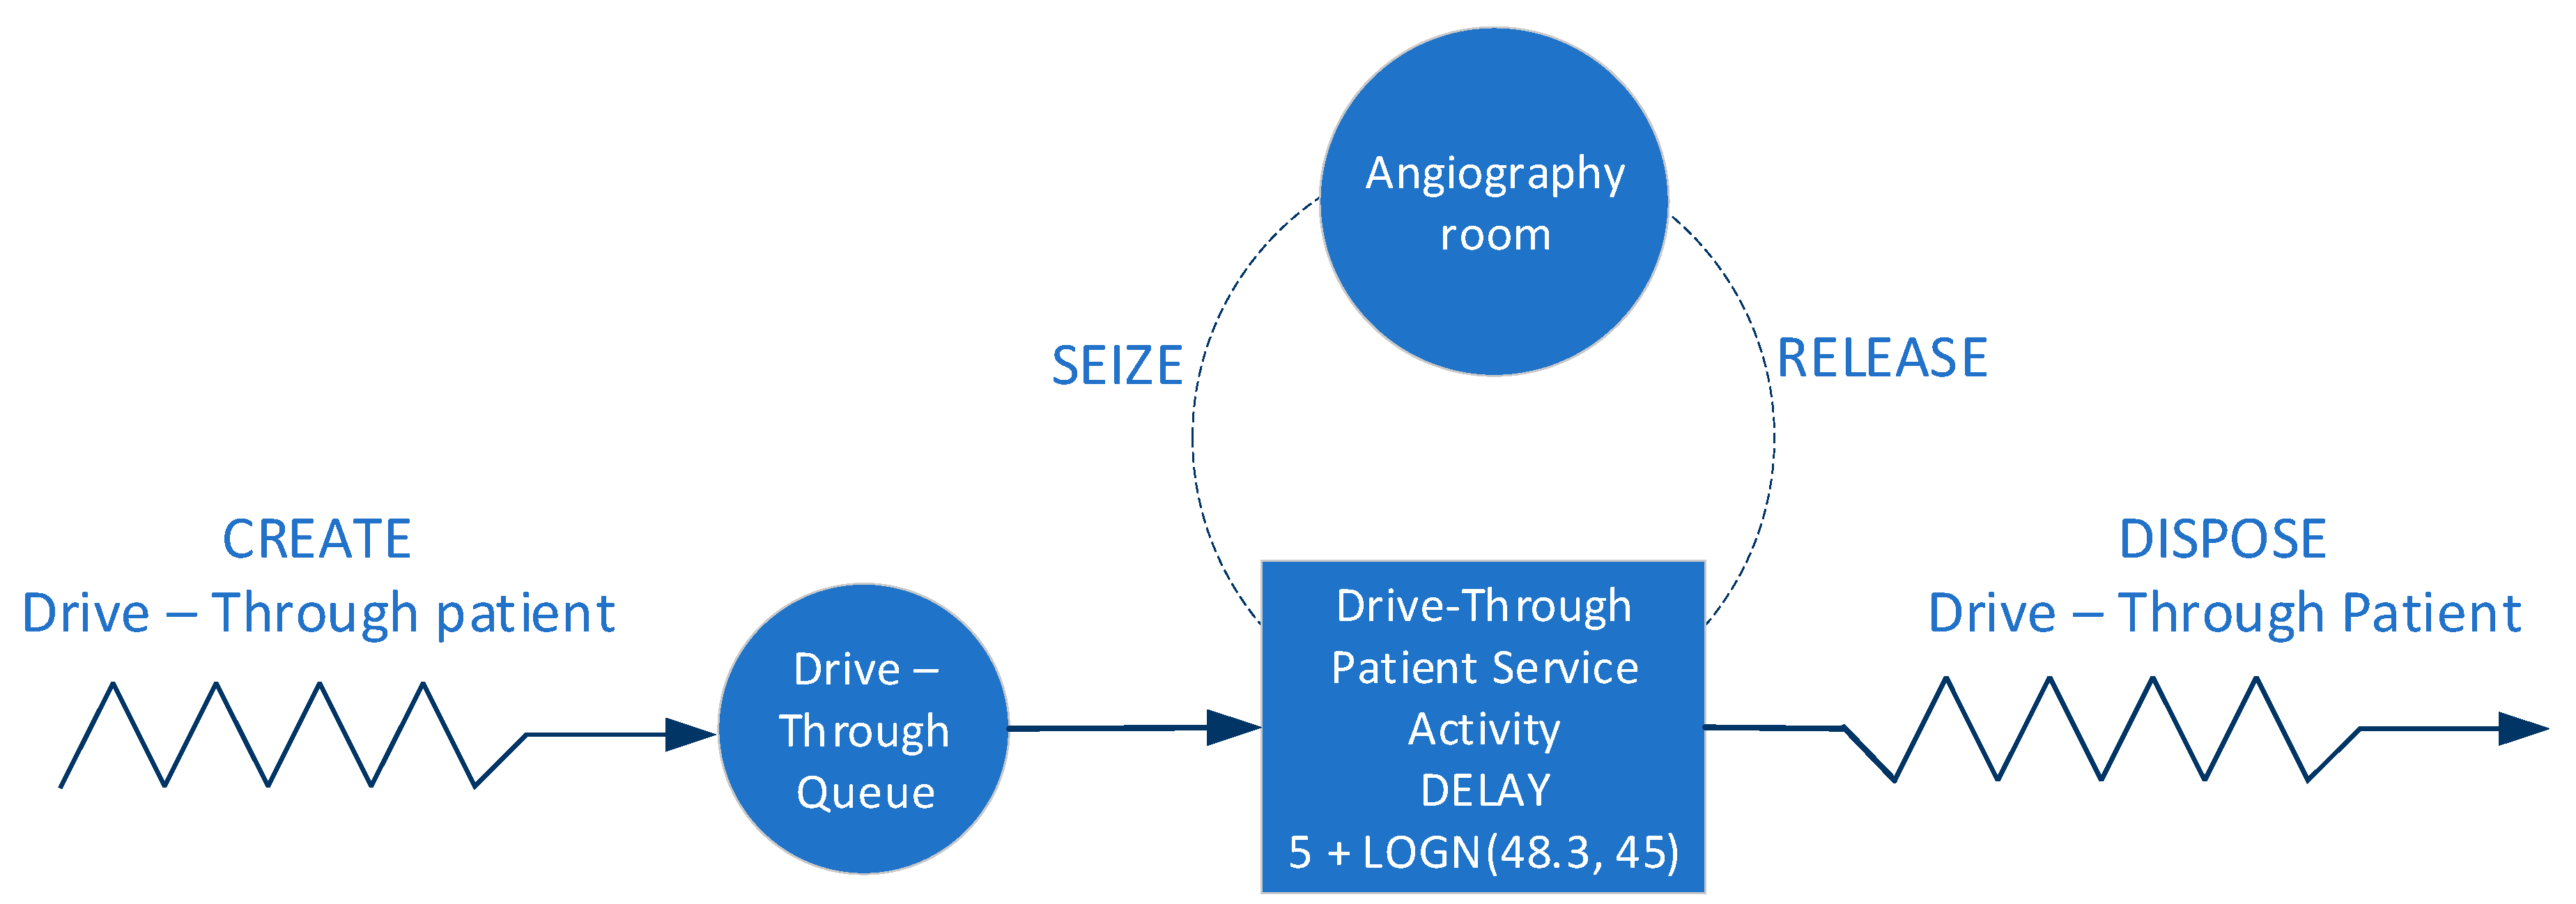
Figure 2 shows the elements considered in the simulation model created in ARENA, where the entity that runs the process is the patient, the angiography room is the resource that the entity takes, uses and then releases. When the entity finds the occupied resource, it queues using the First-In-First-Out (FIFO) discipline, and then, it exits the system.
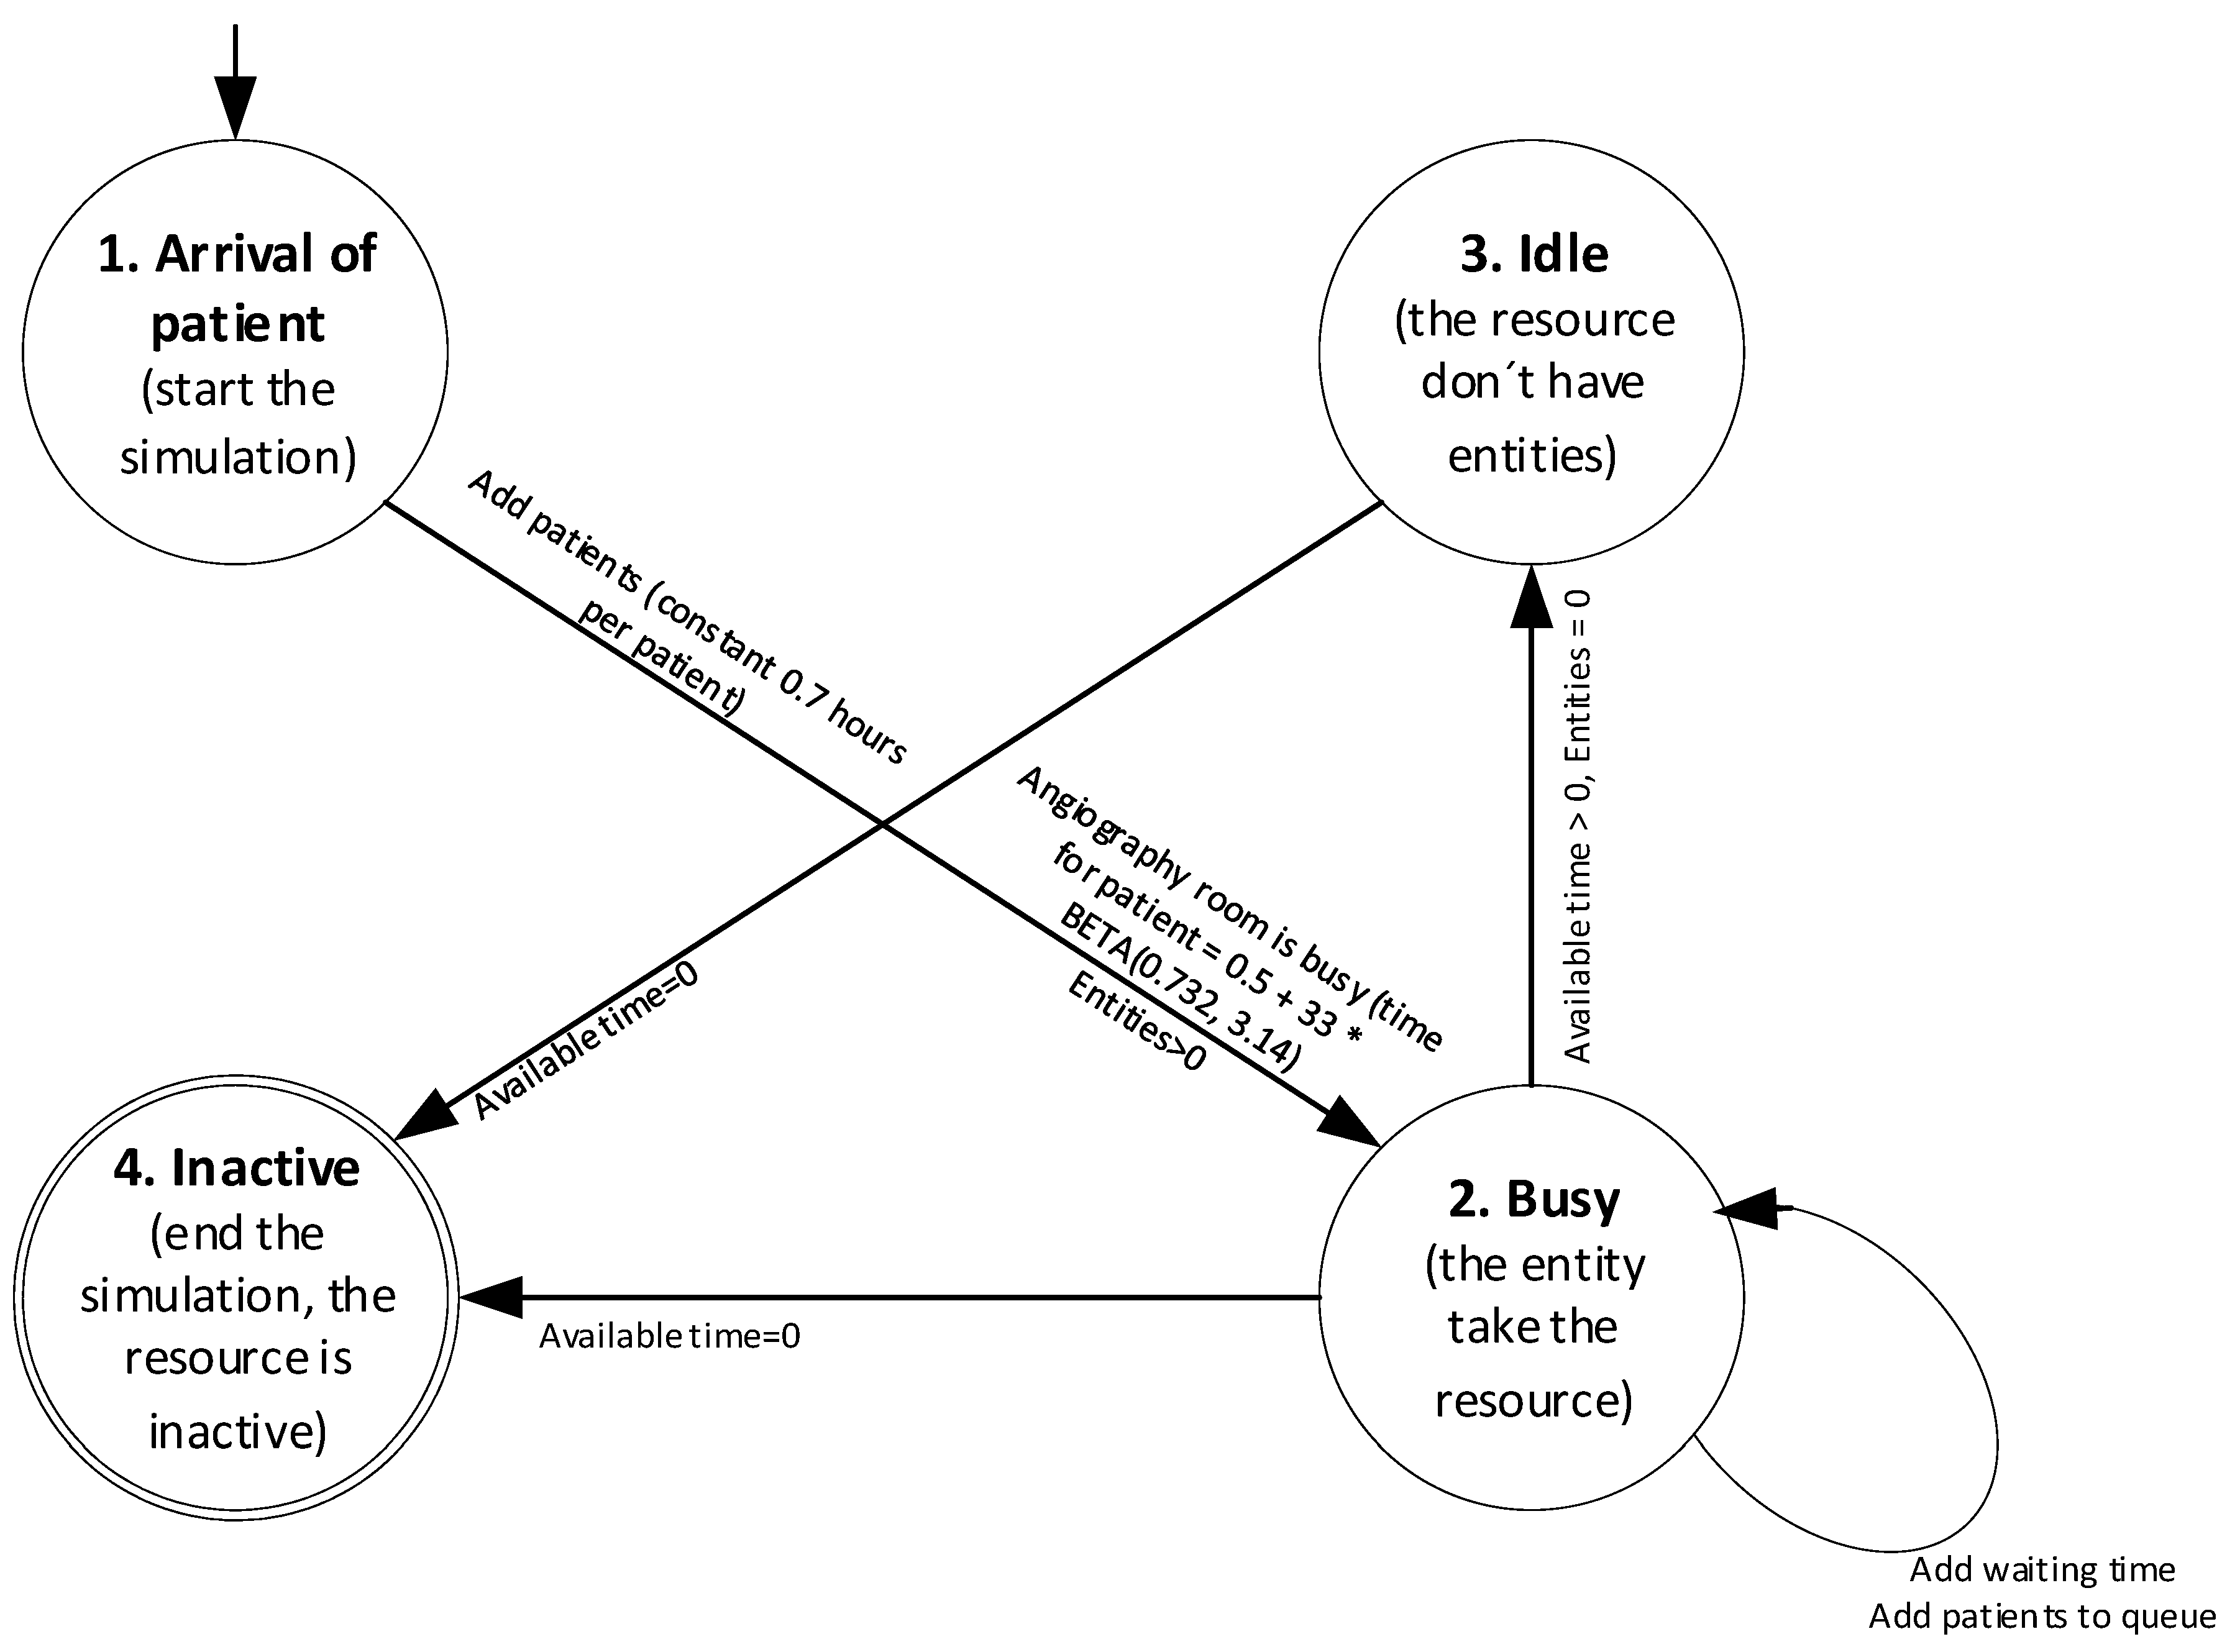
For complementing the DES model,
Figure 3 shows the state transition diagram. In this case, the simulation model begins when the patient’s arrival with a constant time of 0.7 h, is in this moment when the angiography room acquires the state of Busy and assign a time in minutes with a Beta probability distribution, such as shown in Equation (6), for the attention of each patient. While the angiography room has this state, also more patients join the system, which causes the queue and the waiting time increases. When the angiography room does not have patients, it acquires the status of Idle and does not assign time to the resource. Finally, at the end of the available simulation time, the angiography room becomes inactive [
22,
23].
The scope of the project is delimited in knowing if the current resources are sufficient to meet the patient’s demand for the service. That is why, when the angiography room is mentioned, reference is made to the human resource (specialist doctors, technicians, nurses), angiography equipment and infrastructure.
Additionally, the simulation model created was validated statistically compared to the current system carried out using confidence intervals. For this purpose, production data for one month (X) were taken and compared with the data from the simulation (Y) for the same period. If the interval created from this dataset contains zero, it indicates that there is sufficient evidence not to reject the null hypothesis that there are no differences, otherwise, if there are [
24,
25]:
where H
0 is the null hypothesis. H
a is the alternative hypothesis. The variable X represents the data obtained from the current system, corresponding to the data obtained by the simulation model,
corresponds to the average of the data obtained by the current system.
is the average of the data obtained by the simulation model. t is the statistic of a probability distribution t par ν − 1 degrees of freedom and a degree of confidence of 1 − α.
is the variance of the difference of the current system data compared to the data of the simulation model.
Improve stage: At this stage, new scenarios are proposed for the service provided in the angiography room. The aim is to bring the installed productive capacity into line with the current demand for the service, mainly by varying the amount of resources available [
25].
Control stage: The purpose of this phase is to implement the improvement in the original process. A series of indicators have, therefore, been developed with which the performance of the process can be monitored to determine whether the objective of the study has been met. The indicators considered in the simulation model were current patient demand, unmet patient demand, angiography room supply and angiography room utilization rate.
3. Results
3.1. Current Supply and Demand
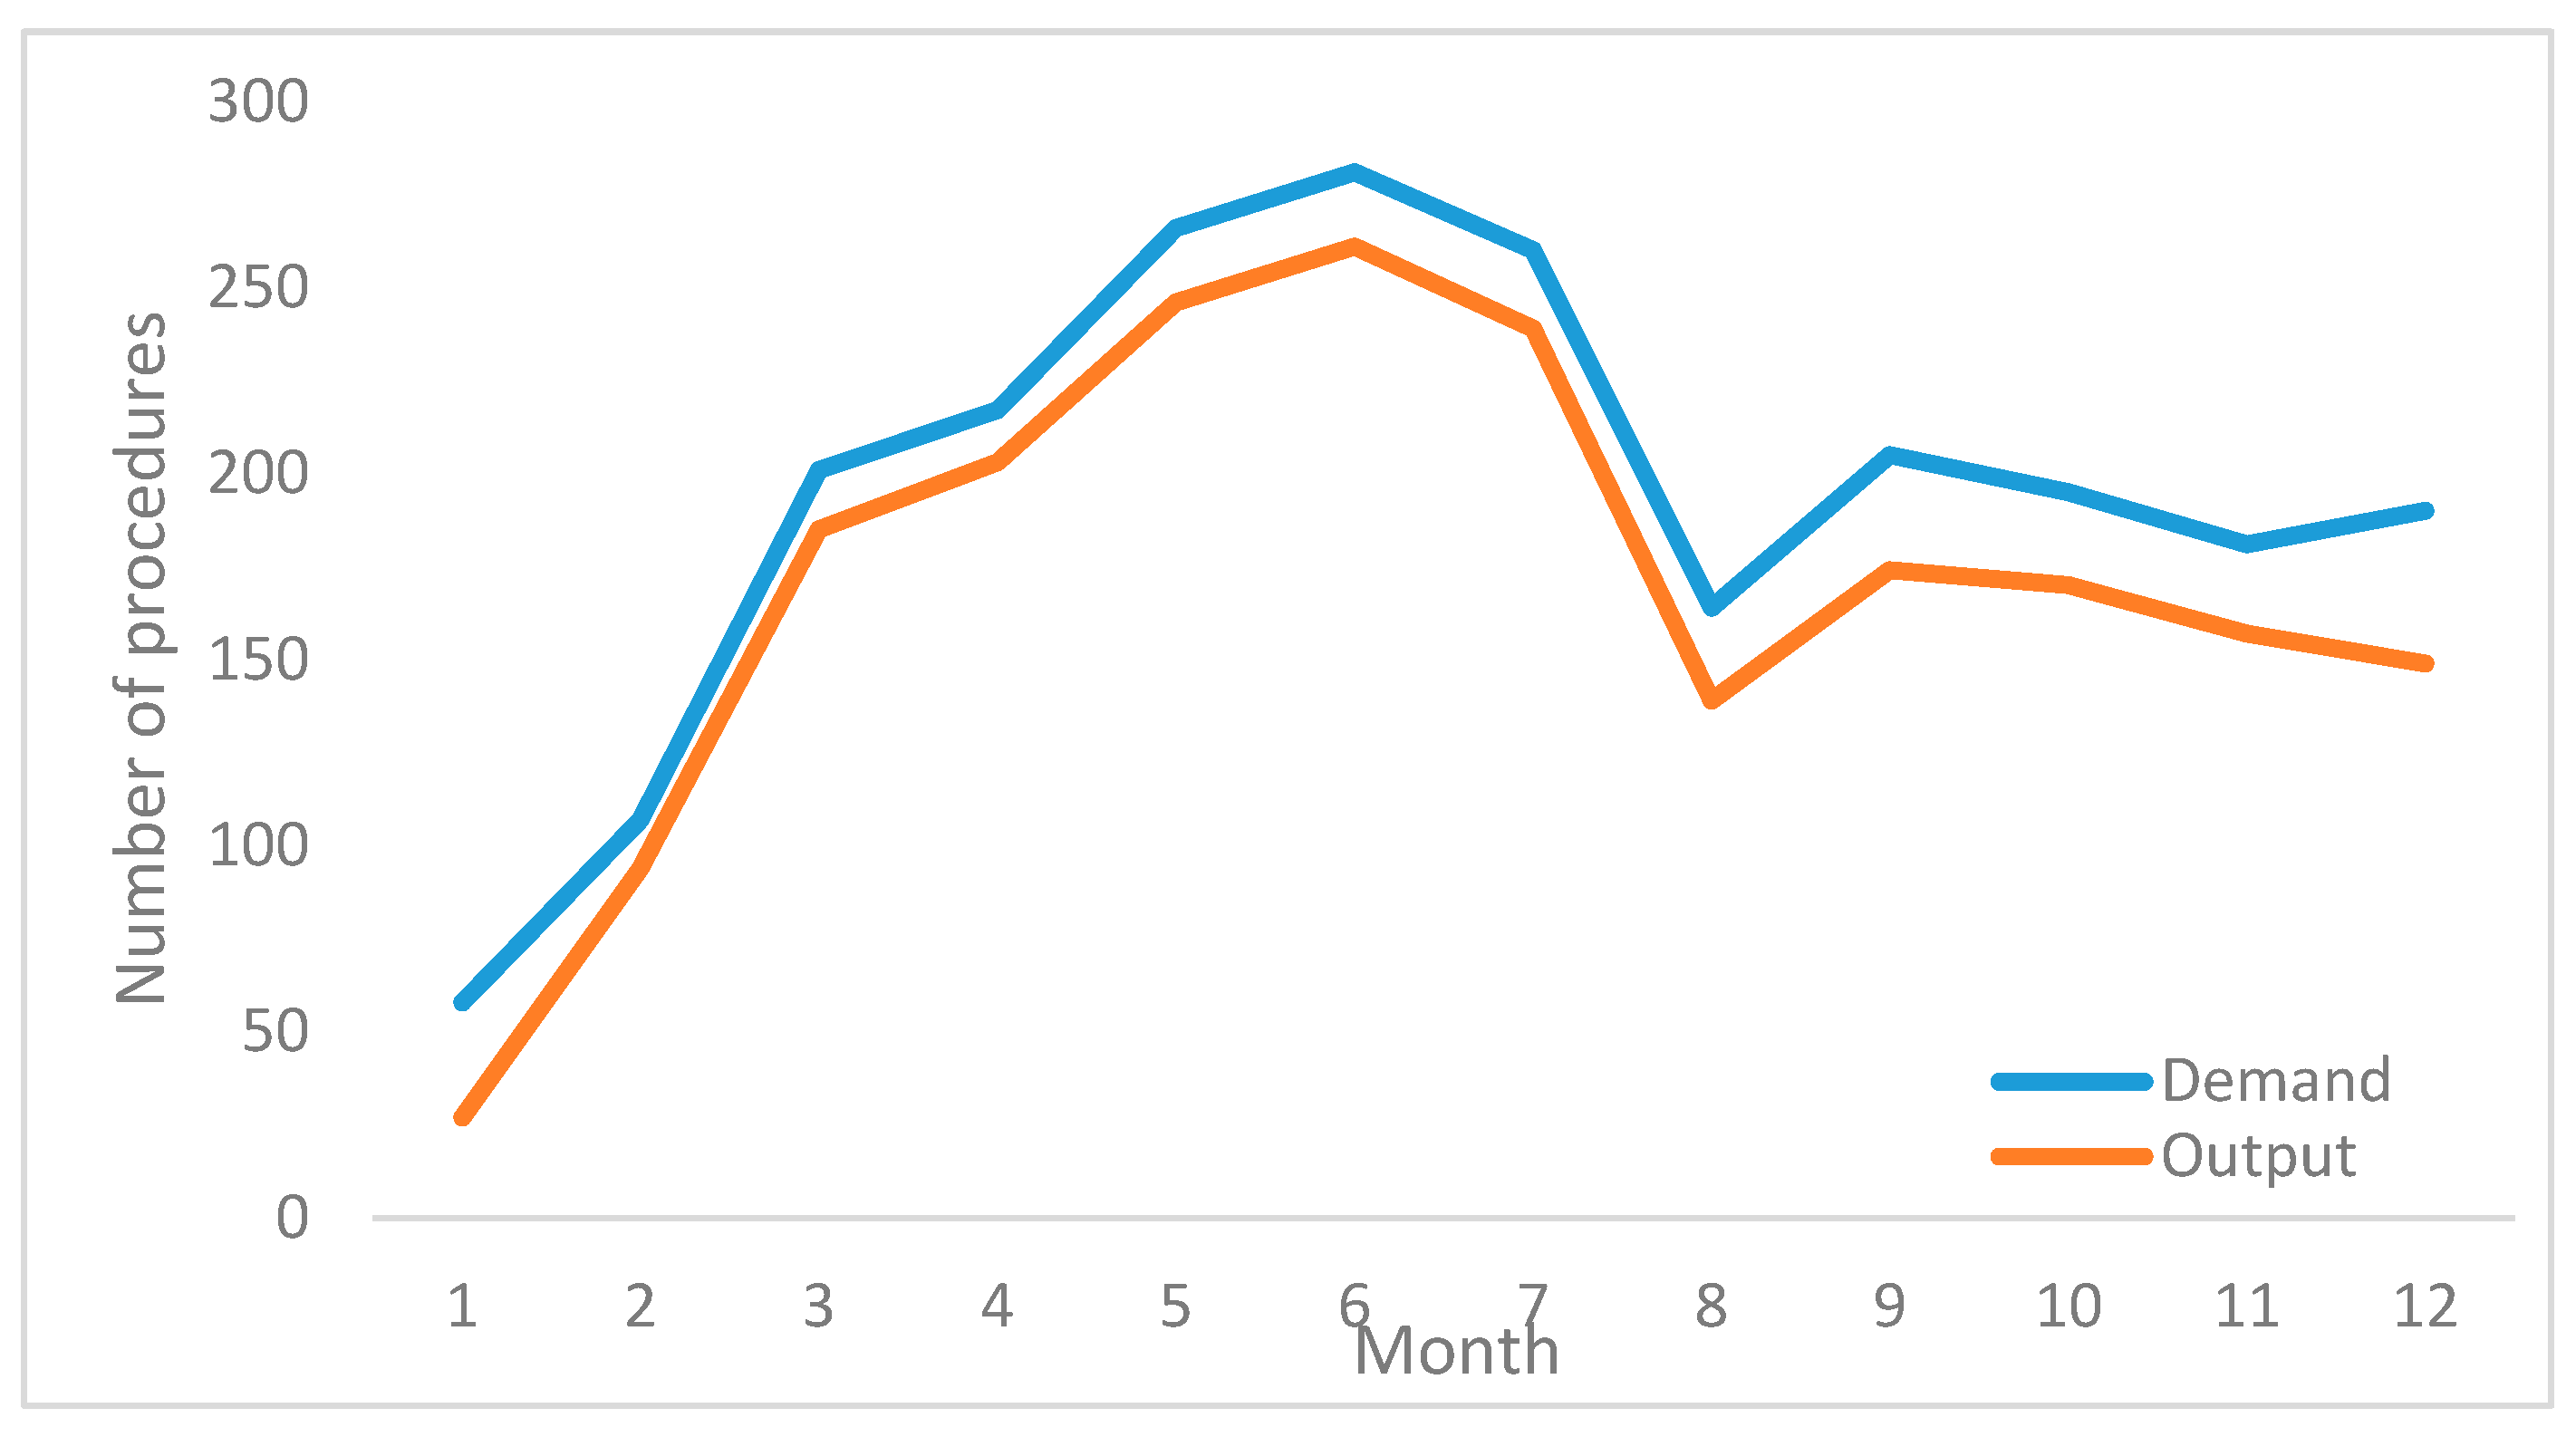
Data for the last twelve months of output and demand for the angiography room are shown in
Table 2. The monthly output corresponds to the procedures performed in the angiography room for the period under study. The demand considers the monthly output plus the cancelled procedures and the waiting list, which totals 2325 cases.
The gap between demand and production translates into an increase in the waiting list of patients requiring the angiography room. This gap can be seen in
Figure 4, where production is always below the demand for the service. Additionally, the variations in the curve show how susceptible production is to resource availability.
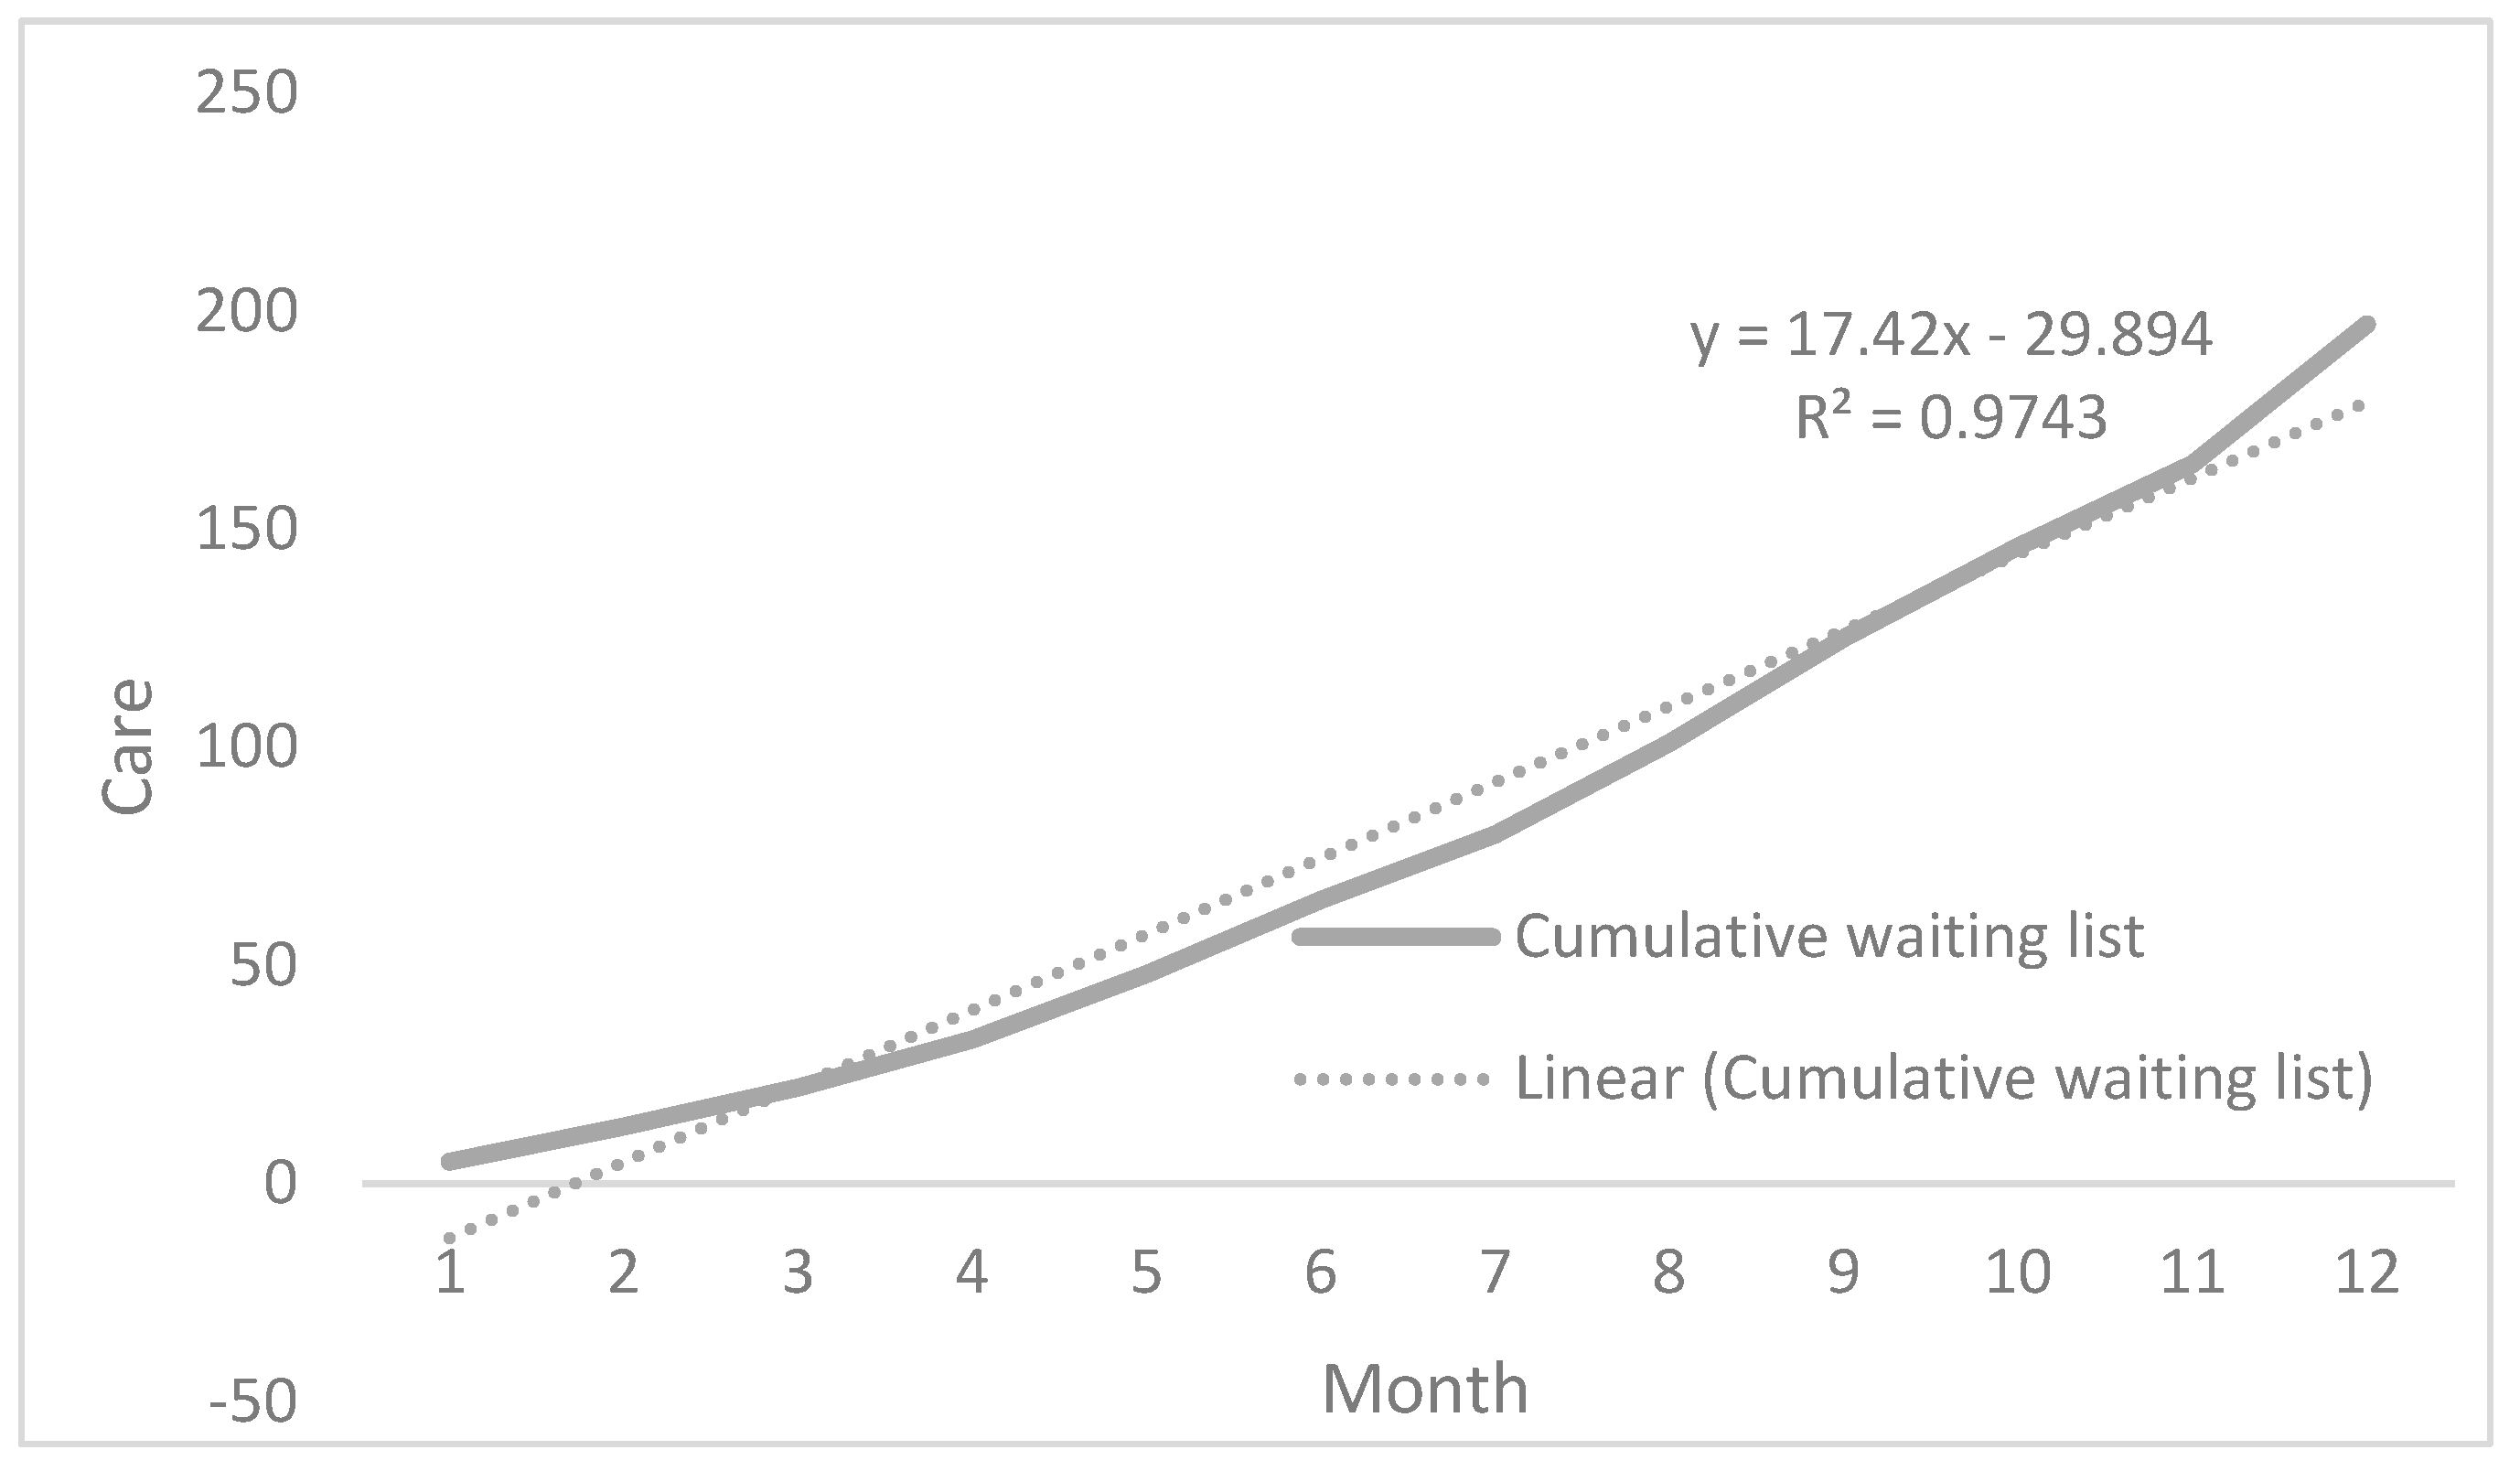
Given the constant difference between supply and demand for the service, the waiting list increases every month, generating ever longer waiting times for patients, as shown in
Figure 5. Regarding care in a public healthcare service, this situation will lead to a constant increase in the list. In contrast, a private healthcare system will suffer a considerable market loss because patients will have to seek other alternatives for service providers.
3.2. Arrival Time between Patients (λ)
An average of 9.3 patients would have to be seen per day or its equivalent in time, i.e., that a patient arrives every 0.7 h [
26], in order to incorporate into the model an annual demand of 2325 procedures in the angiography room, during 250 days a year, in which there are 6.5 h of equipment availability to perform the required procedures.
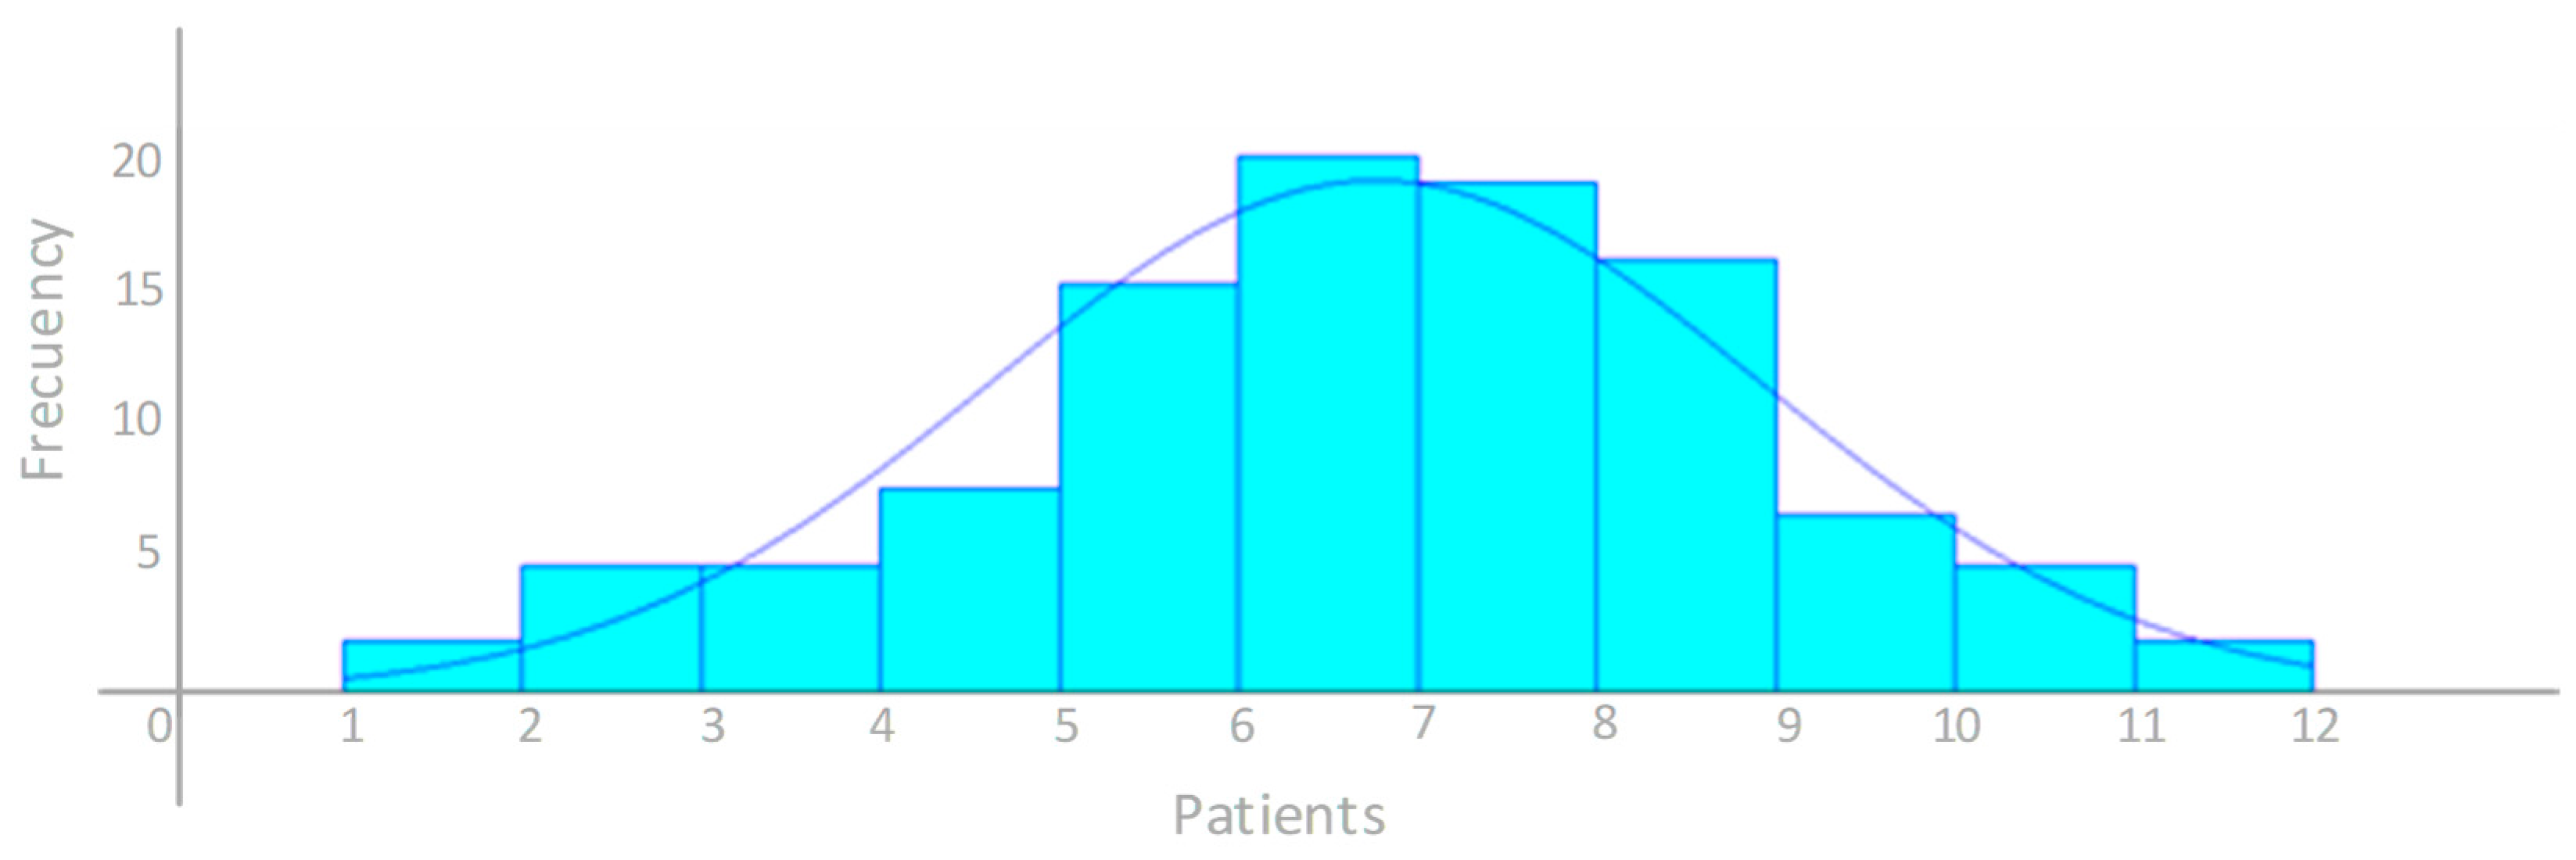
Additionally, the probability distribution was analyzed by the INPUT ANALYZER. The authors identified that the data followed a normal parametric distribution, with a mean of 6.26 patients and a standard deviation of 2.14 patients per day. Equation (5) shows the parameters of the normal distribution:
Figure 6 shows the histogram generated by the INPUT ANALYZER for daily patient arrivals.
The goodness-of-fit test shows that the smallest square error is for the normal probability distribution with a value of 0.00295, which was the best fit for the number of patients arriving at the angiography service. The
Table 3 shows the results by the goodness-of-fit tests applied to ten different probabilities distributions.
3.3. Cycle Time in the Room (μ)
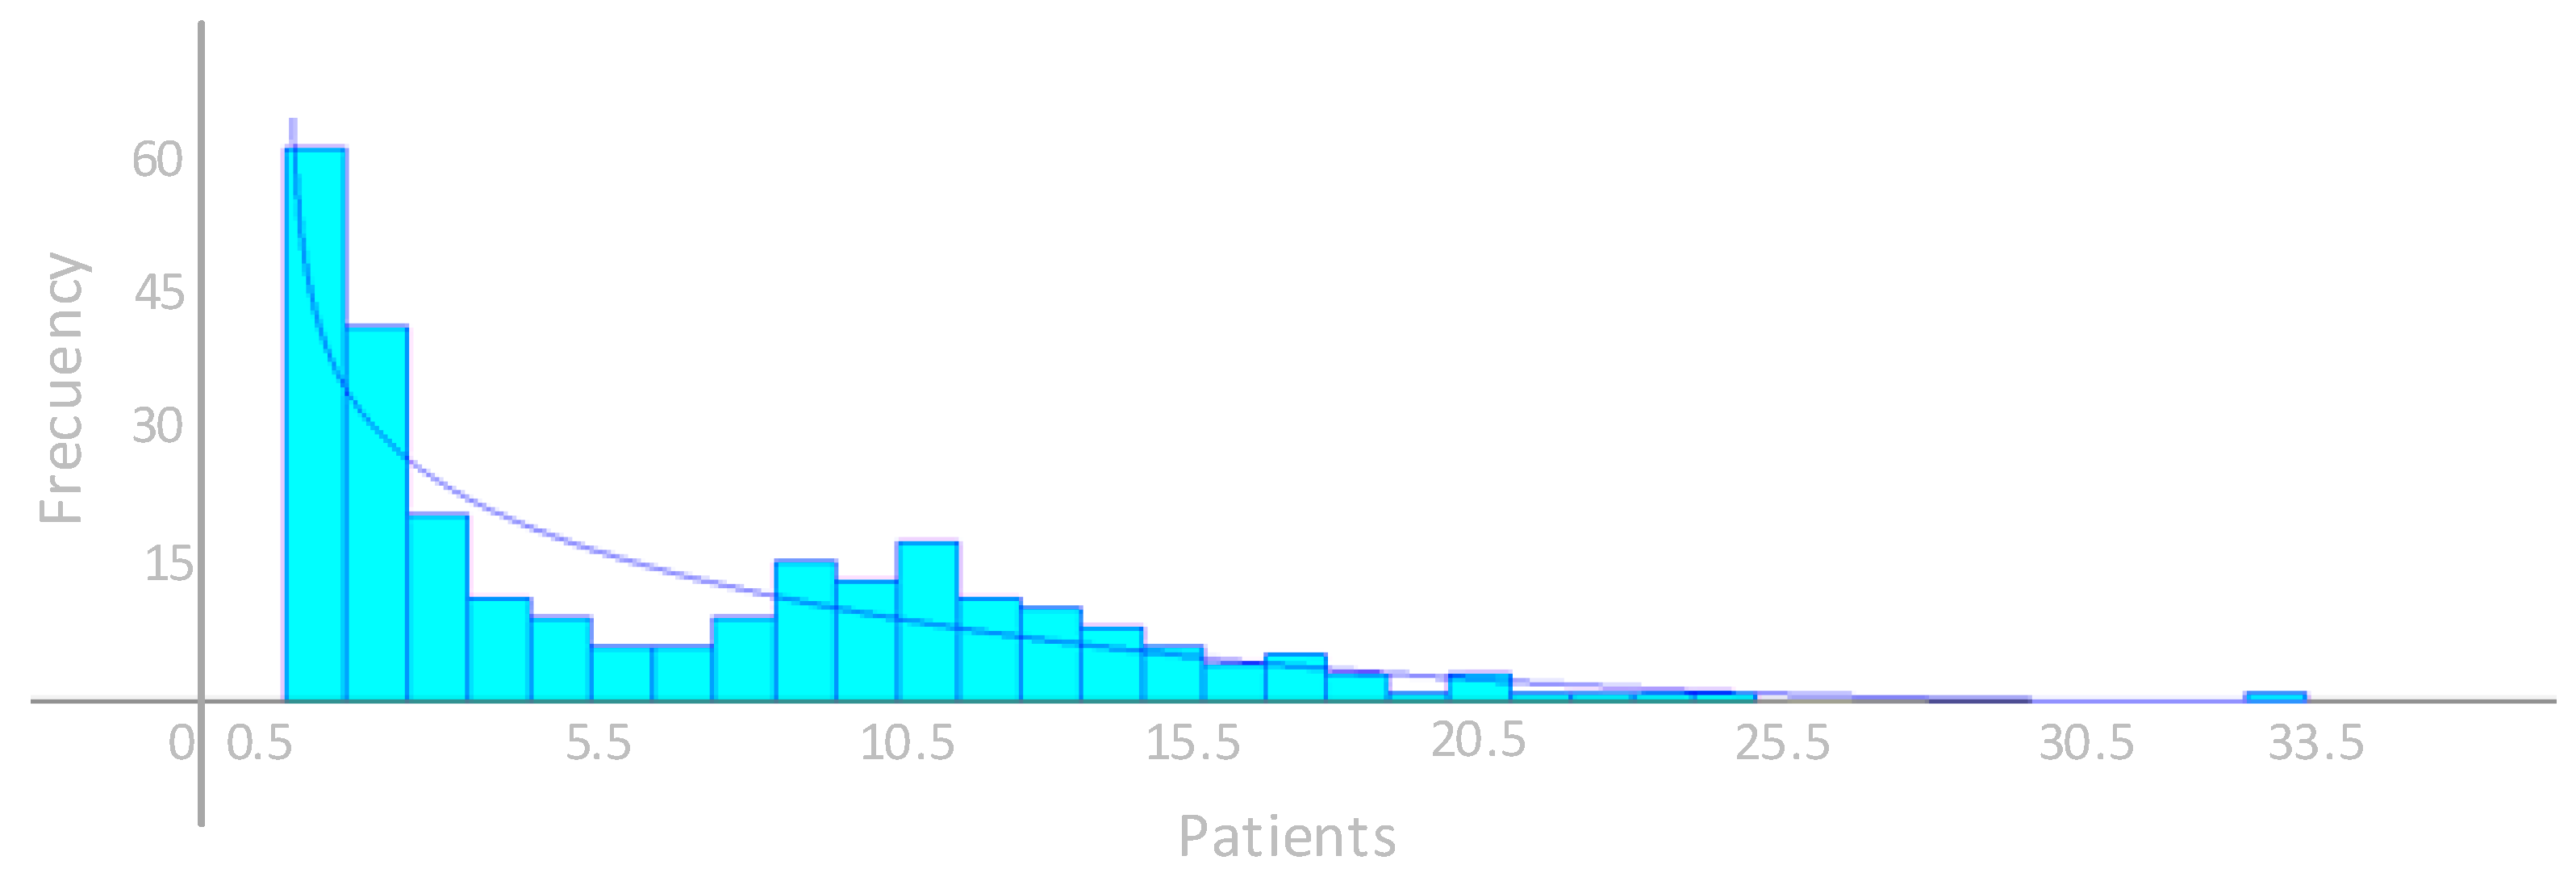
As for cycle time, the records of the room times were used, and the INPUT ANALYZER determined that they have a Beta probability distribution represented by Equation (6), expressed in minutes.
where, T represents the cycle time with a probability distribution shown as Beta, according to the notation used by the INPUT ANALYZER.
Figure 7 shows the probability distribution identified by the INPUT ANALYZER for the cycle time of the angiography room.
By applying goodness-of-fit tests, the authors determined that the Beta distribution has the best fit, with the lowest error of all probability distributions evaluated. The
Table 4 shows the results by the goodness-of-fit tests applied to ten different probabilities distributions.
3.4. Simulation Model
Among the assumptions used in the simulation model is that one working day corresponds to 6.5 h, so 21 days are equivalent to one month of output in service. The daily rate of patients requiring a procedure has a normal probability distribution with a mean of 6.26 patients and a standard deviation of 2.14 patients. This situation shows how stable the demand is over time. To meet the annual demand of 2325 patients per year, the authors decided to establish the time between patient arrivals in the system as a constant at 0.7 h, which is equivalent to 9.3 patients per day.
The cycle time of the procedures performed in the angiography room expressed in minutes has a Beta distribution represented by Equation (6), which clearly shows a bias to the right due to the variability of the times analyzed and the complexity of the procedures performed.
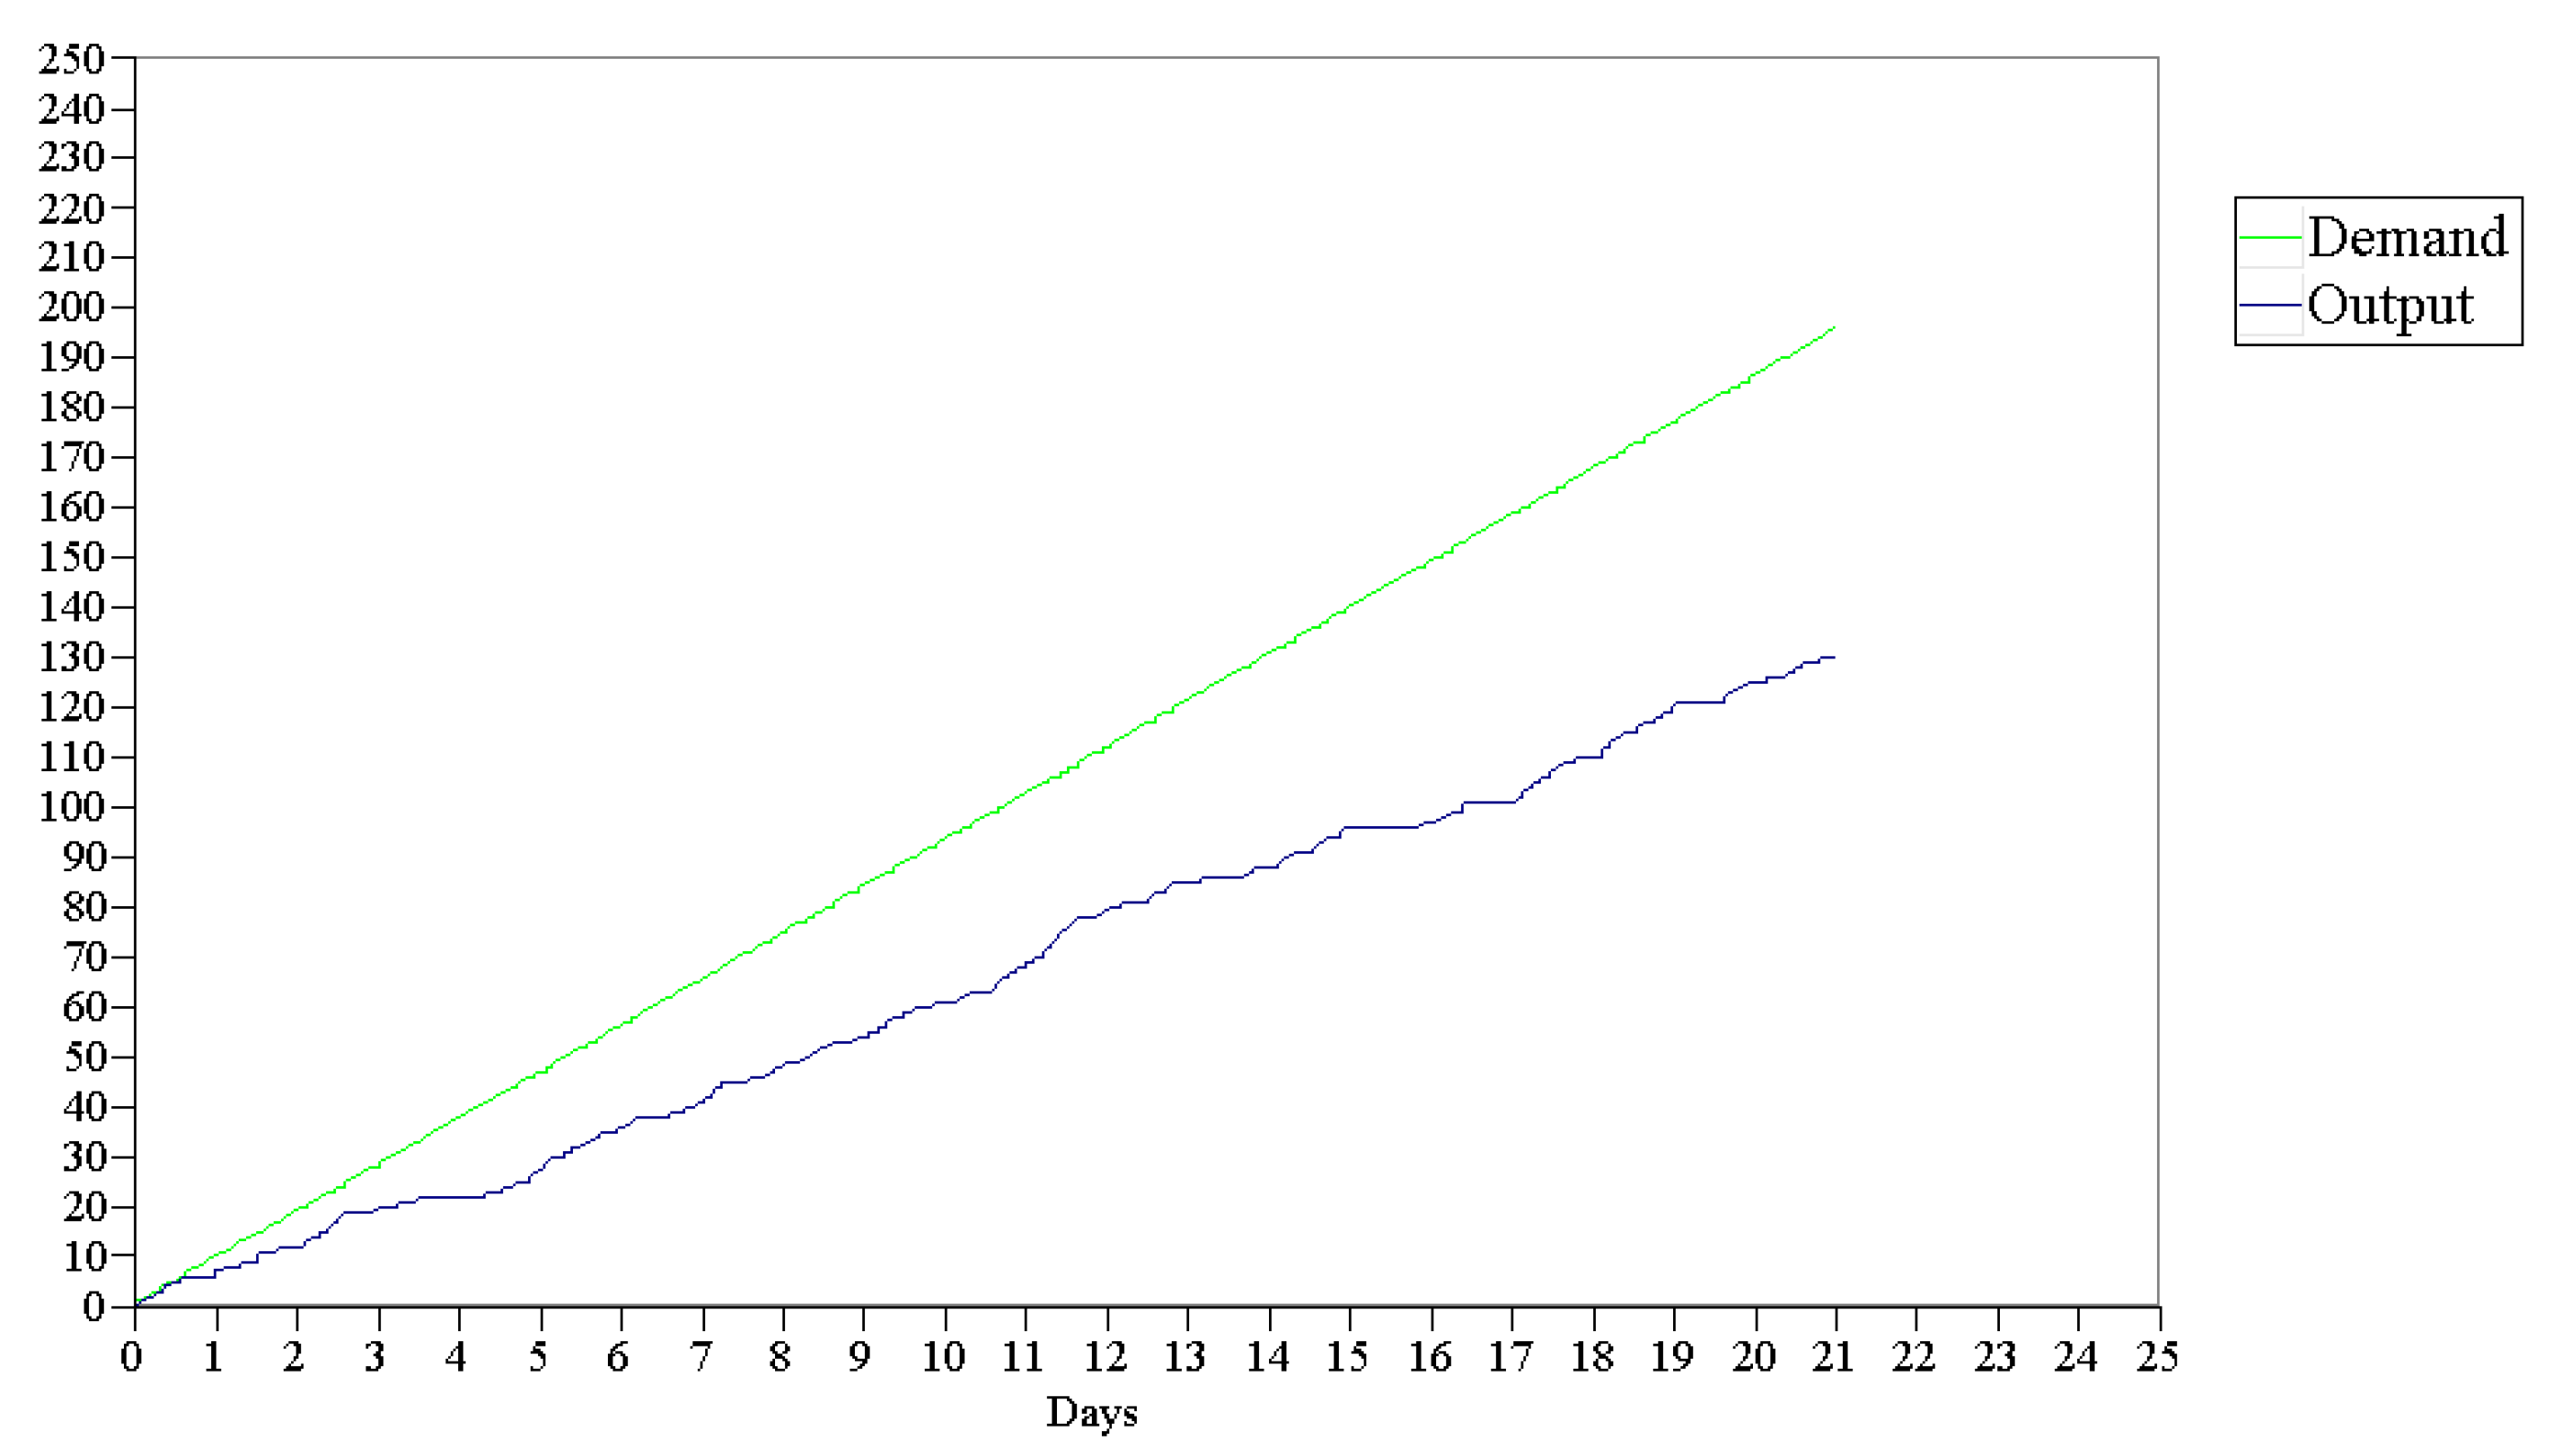
Each month, 196 patients are incorporated into the simulation model, and an average of 148 procedures (each procedure equals one patient) are performed in the angiography room. With these data, a monthly average of 24 patients is added to the waiting list. This information is obtained by running 12 replications of the simulation model, where a utilization rate of 0.99 was quantified for the angiography room and a waiting time of 6.75 days. The average wait was 2.46 days.
Figure 8 shows how, as the days go by, an ever-widening gap opens between the patients who enter the system and the patients who have attended, which is known in health services as the waiting list. This gap corresponds to the difference between supply and demand for the service.
3.5. Validation of the Simulation Model
The monthly production results obtained from the 12 replications of the simulation model were compared with the 12 monthly data collected from the current system, calculating the difference between them. A 95% confidence interval of (−89.83, 133.66) was obtained. Zero was among the values of the interval. The authors, therefore, conclude that there is no significant variation between the results presented by the simulation model and the current system on which the design was based.
3.6. Improvement Scenario 1: To Have Two Angiography Rooms
The primary aim is to improve the current situation and to do that, the current capacity of the resource, i.e., the angiography room, could be doubled, which is equivalent to incorporating an additional room or outsourcing the service.
The simulation model maintains the same conditions; however, the capacity of the resource is doubled, which means that the average number of procedures performed per replication is 194.42, and the average waiting time per patient is 0.11 h (6.85 min approximately). The maximum waiting time recorded in the responses was 0.57 days (about 3.71 h). The use of the resource, the angiography room, goes to 0.64, with the capacity to attend to eventualities such as increases in demand, maintenance shutdowns or other contingencies that may arise in the daily operations of the room. The average number of patients on the waiting list would increase to 1.45, which would cover the demand for the service.
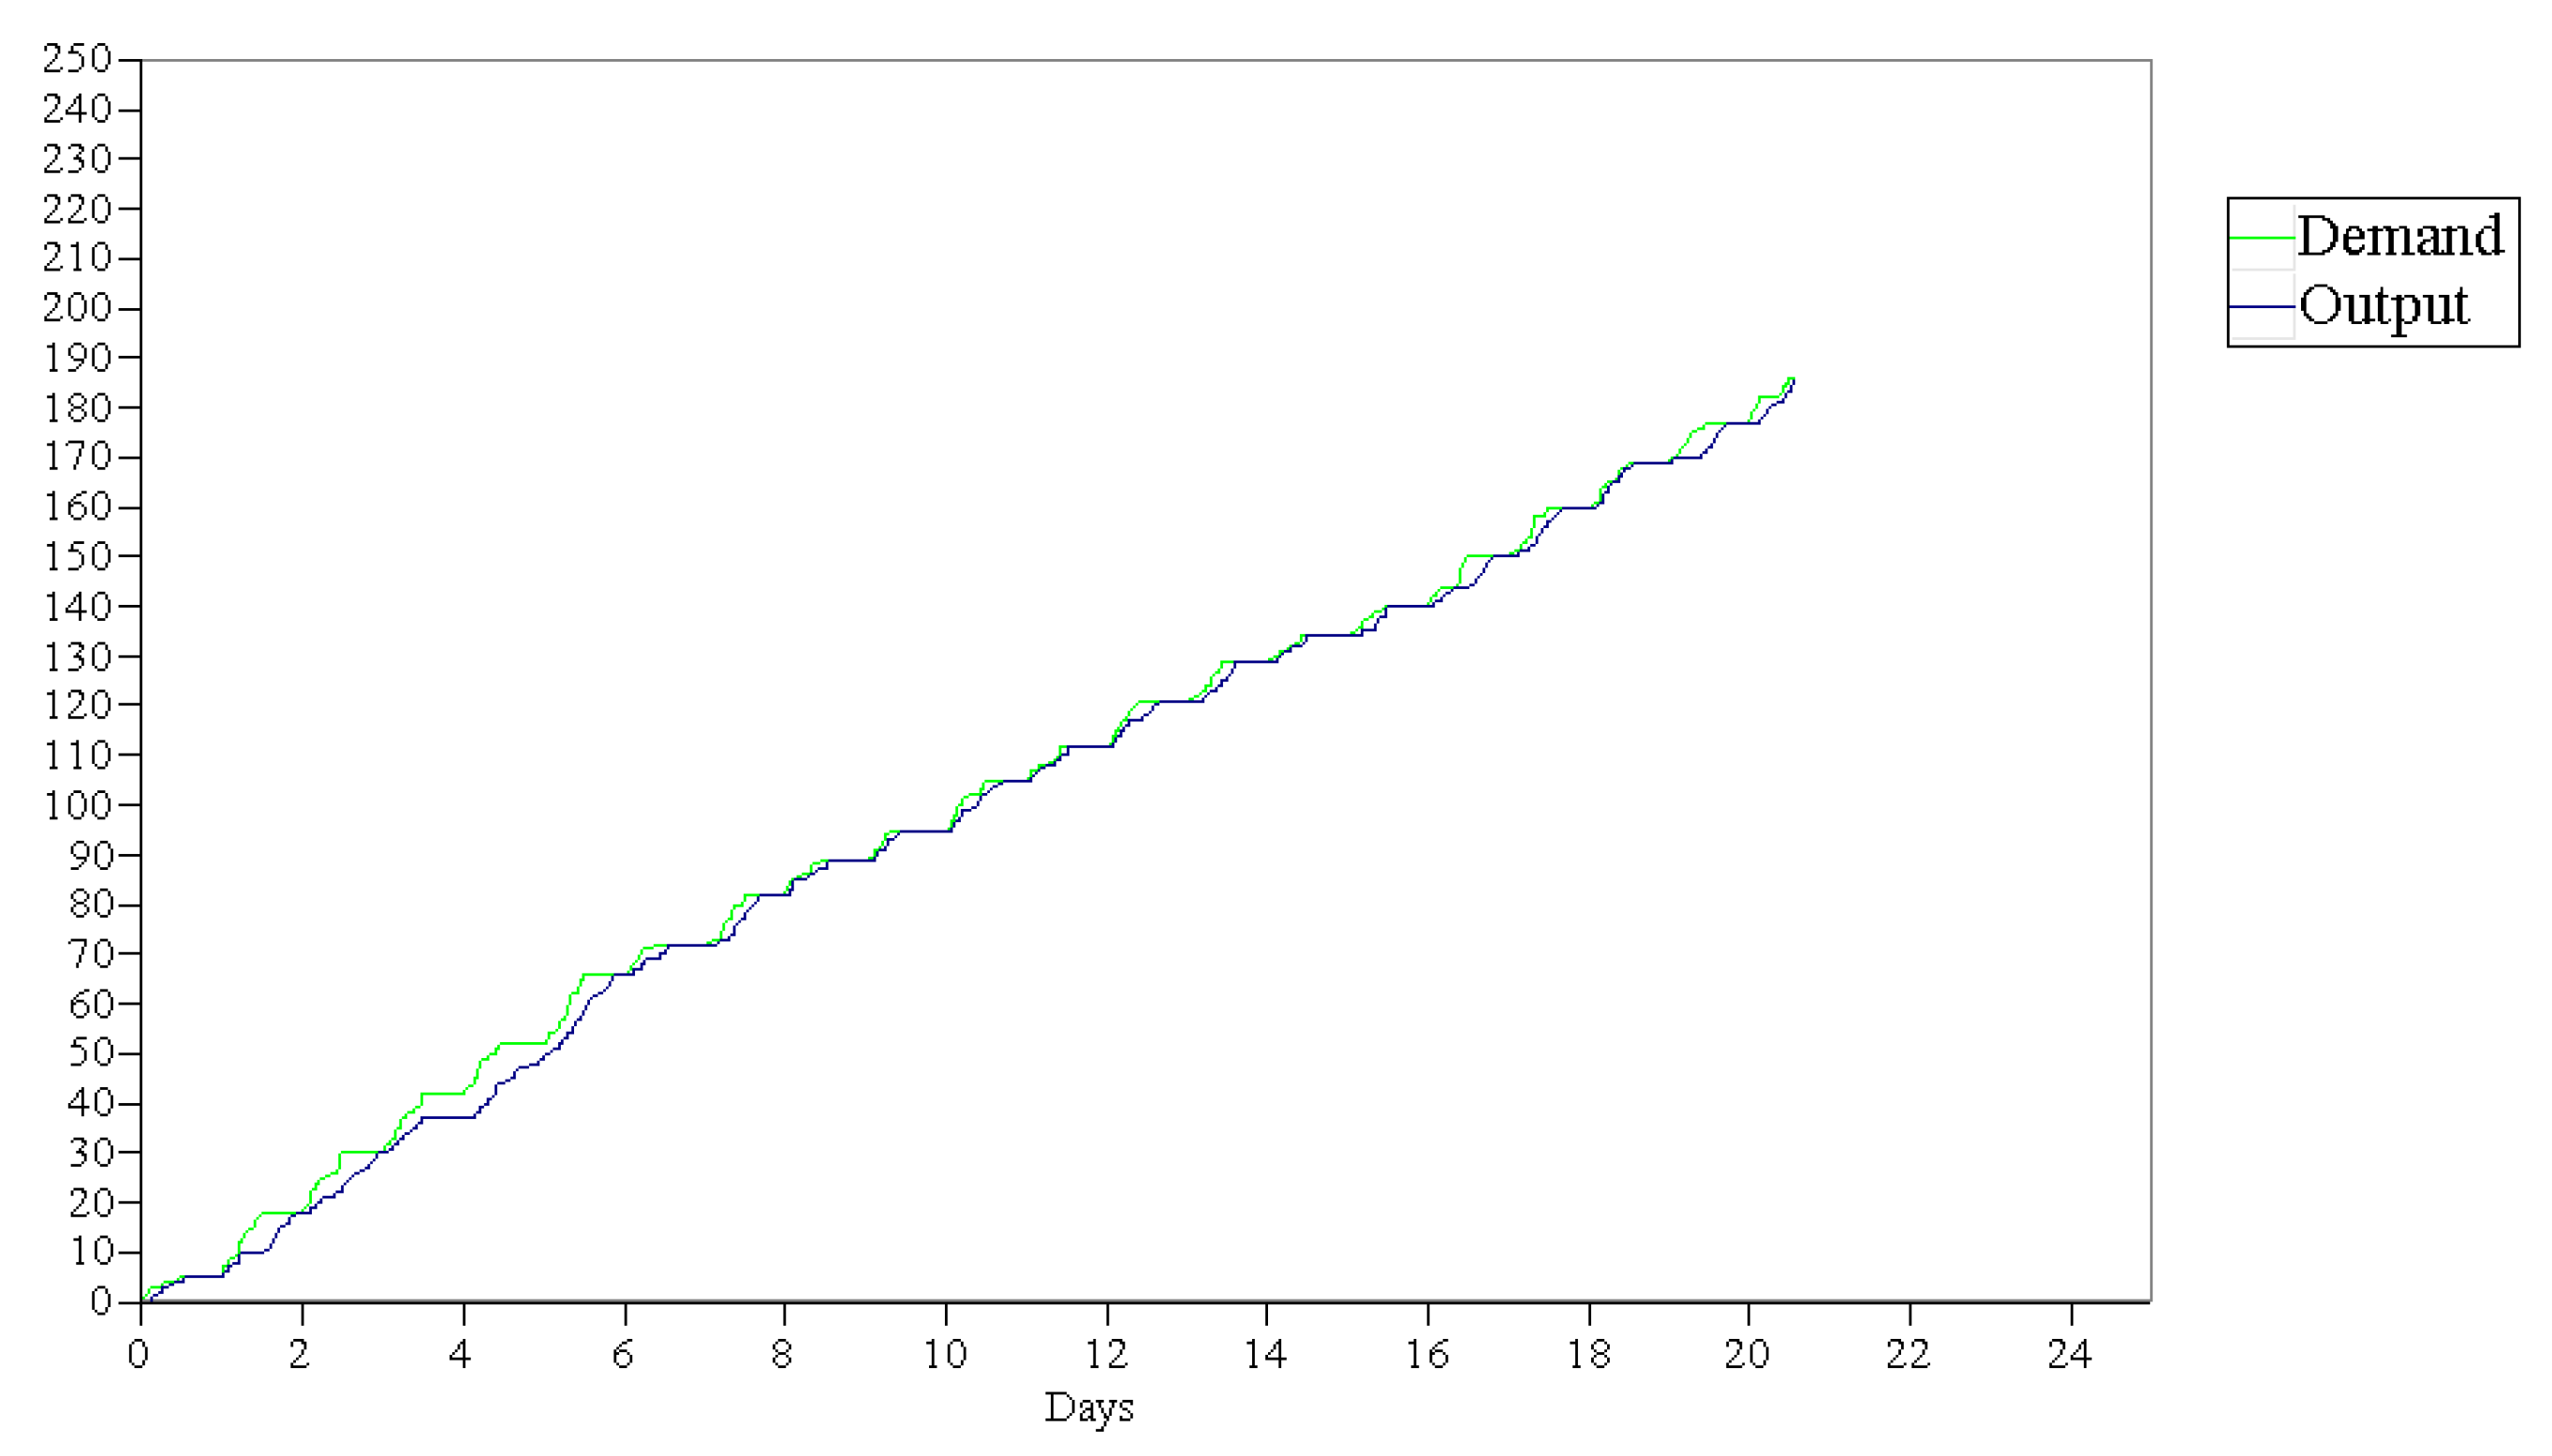
Figure 9 shows the small gap between supply and demand for the proposed scenario over the time considered in the simulation model. This means that the system has sufficient installed productive capacity to meet the required demand. The small differences between the two lines represent the patients on the waiting list.
3.7. Improvement Scenario 2: Enable an Additional Second Shift
The model maintains the same current parameters. However, the angiography room has a time availability of 13 h per day and the arrival of patients is maintained at a schedule of 6.5 h with a rate of arrivals of 1 patient every 0.7 h or the equivalent of 1.43 patients per hour. The average number of patients that attended is 197.92, with a 95% confidence interval of (167, 222), and the average waiting time per patient is 2.06 h, with a maximum of 16.50 h.
The angiography room reports a utilization rate of 0.64 with these new parameters, the same as with the previous scenario, which enables having sufficient idle capacity to cover possible eventualities such as those mentioned above.
Figure 10 shows the same situation as in the previous scenario, a small gap between supply and demand, which means that the system has sufficient installed productive capacity to meet the required demand. The small differences between the two lines represent patients on the waiting list but have attended in the short term.
4. Discussion
Attendance time in the angiography room has a wide variability, represented by a wide confidence interval. When representing the current conditions of the process, the utilization of the room was 0.99, showing that it is at full capacity and has no chance of meeting possible contingencies in the process, which causes it to generate a waiting list that increases substantially over time. On average, 24 patients a month wait for their treatment [
2,
27].
For the options considered, the current capacity doubles in both cases, either by acquiring an additional angiography room or by enabling an additional work shift. Although, in both cases, the utilization rate is 0.64, which provides an idle capacity to meet possible increases in demand and both routine and sporadic maintenance items [
28]. The difference between these lies in the patients’ waiting time. Enabling a second shift generates a longer waiting time that can reach 15 h equivalent to just over a day, while the wait would be close to 3.71 h with a new room. The waiting times are significantly less with either option, which is currently at 6.75 days [
29,
30].
Incorporating an angiography room requires significant design and implementation time, and while these start-up activities are being considered, the waiting list will continue to grow [
31,
32,
33]. Besides, a new building and the required angiography equipment come with high initial investment. In contrast, the fitting out of an additional work shift would only require the operating costs of supplies and specialized technical personnel to perform the daily surgical procedures [
34]. The
Table 5 shows an analysis of expense by each scenario.
The availability of beds is another point that must be considered in the analysis of installed productive capacity since sufficient quantities must be guaranteed to hospitalize patients one day before and between one and three days after the procedure [
35].
It is essential to consider that although the results of the proposed model indicate limited or zero waiting times, patients do not always want immediate care [
36]. If the patient is a mother who is fully dedicated to the care of her children, she will need to find a caregiver for the time she will be away. A worker may require some time in advance to prepare for their absence [
37]. This is the case in elective procedures, not emergencies [
13].
Social security systems have waiting lists. The problem is greater or lesser, depending on the resources available to the system [
38]. Spain, Italy, England, New Zealand, Canada, and Australia are the countries with the most documented waiting lists situation. According to the OECD, “in the wake of the recent economic downturn and severe pressures on public budgets, waiting times may again be on the rise” [
39].
The DES models are created with different assumptions according to the needs or problems that require be analyzed; in this case, it focused on analyzing the amount of resources necessary to meet the demand of patients, therefore, this document explained that the arrival time between patients, as well as the cycle time has kept constant. The only factor that changes in the model is the amount of resource until it has enough installed productive capacity to meet the demand. Additionally, the activities carried out within the angiography room are standardized and present a series of clinical and legal requirements to identify the integrity of patient care, which are outside the logistical scope of this investigation [
13].
The real variability of the time data is represented in the model by the probability distributions used and they were statistically validated [
40].
In the improvement process, usually the reorganizing or eliminating of some of the activities that do not have value added are considered. However, this is not the target in this project because this process has activities with medical and legal requirements that must be considered in the attention of the patient; these aspects that are outside the logistical focus of this research [
41].
This paper technically demonstrates that the proposal is viable and solves a significant and latent problem for social security systems. Future research should focus on applying this methodology to the optimization of waiting times in other care areas of a hospital.
5. Conclusions
The authors used the Discrete Event Simulation model to determine that the current installed productive capacity in the angiography room is not sufficient to meet demand, given that it has a utilization rate of 0.99. Therefore, doubling the current capacity results in a utilization of 0.64. The most favorable recommendation is, therefore, to enable a second shift because it is more economical and reduces patient waiting times, compared to building a new angiography room or the current service offering.
However, if with the information provided in this study and with the availability of budget, it is considered appropriate to build a properly equipped building, the time required until the implementation would be not less than one year. For this, a second shift should be provisionally made available to avoid the waiting list from increasing because according to the model developed, the average monthly number of patients on the waiting list is 24, reaching a maximum of 71 in some replications. Although both improvement proposals reduce the utilization rate to 0.64 and increase the monthly output of the angiography room to 200 patients, having an additional shift increases patient waiting times compared to enabling a parallel resource.
During the research, DES simulation proved to allow for the optimization of the use of resources used in healthcare systems and is a suitable tool for optimizing hospital management.
