Analysis of the Installed Productive Capacity in a Medical Angiography Room through Discrete Event Simulation


Abstract

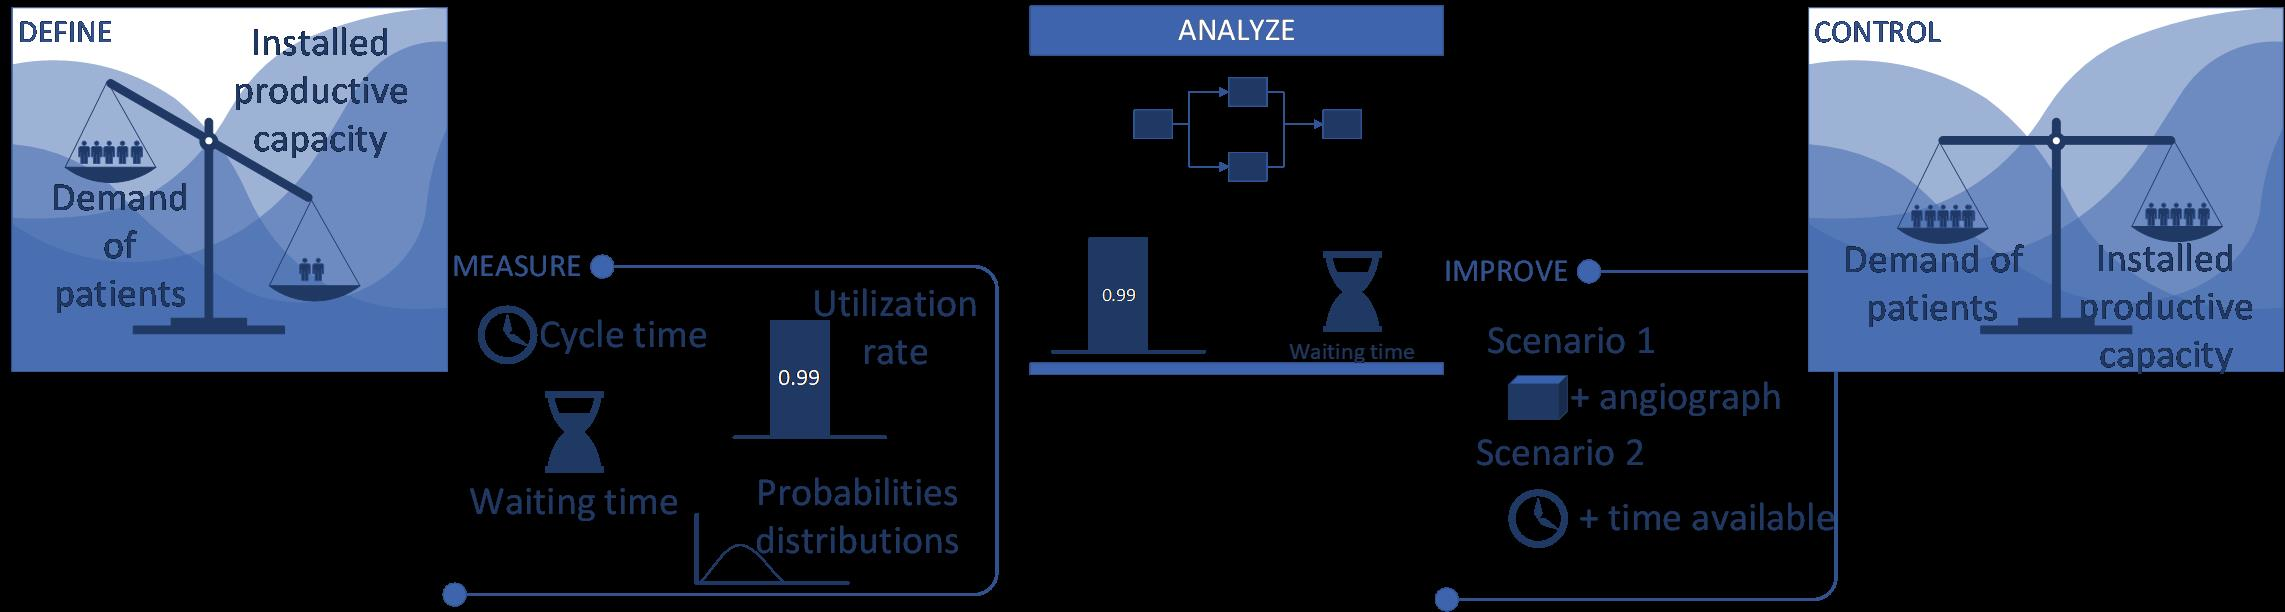
1. Introduction
2. Materials and Methods
3. Results
3.1. Current Supply and Demand
3.2. Arrival Time between Patients (λ)
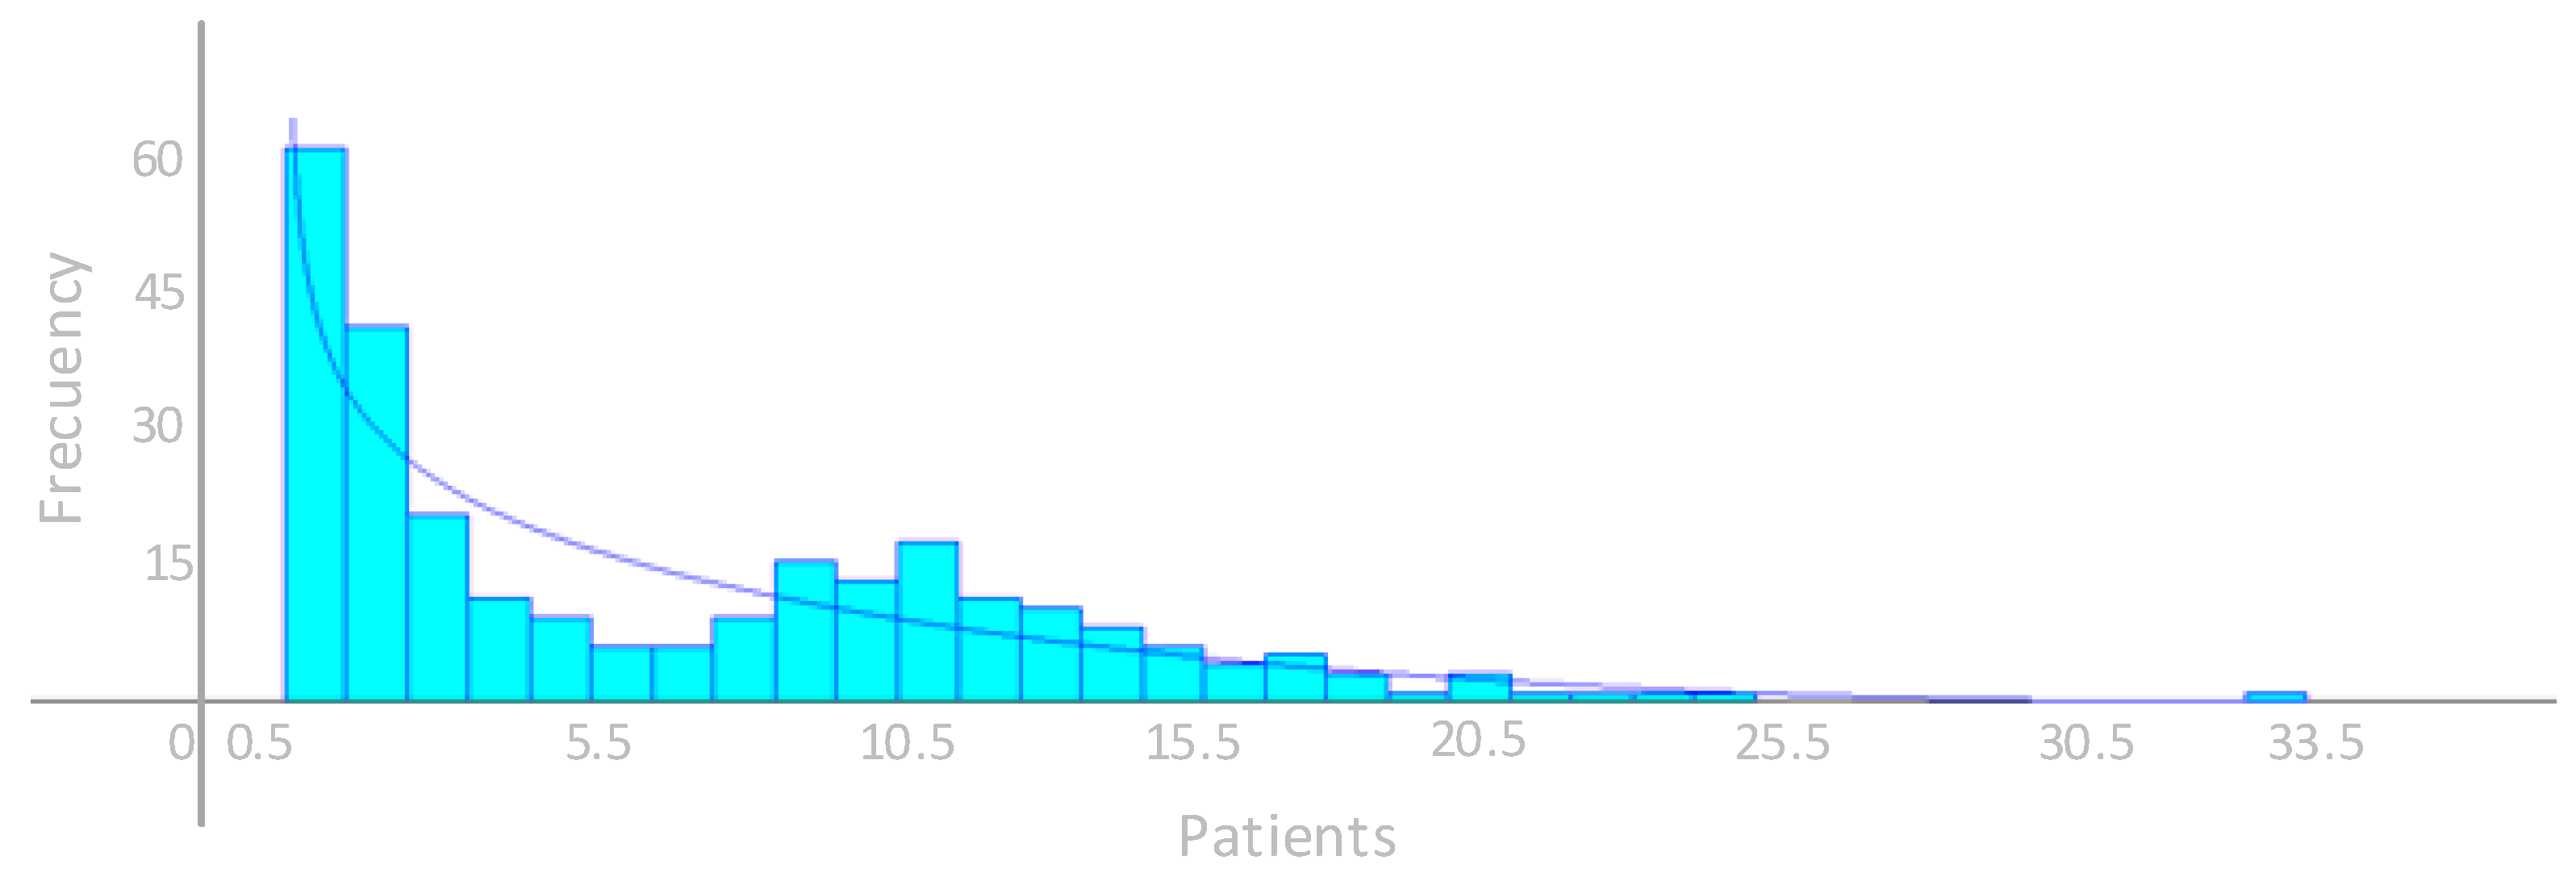
3.3. Cycle Time in the Room (μ)
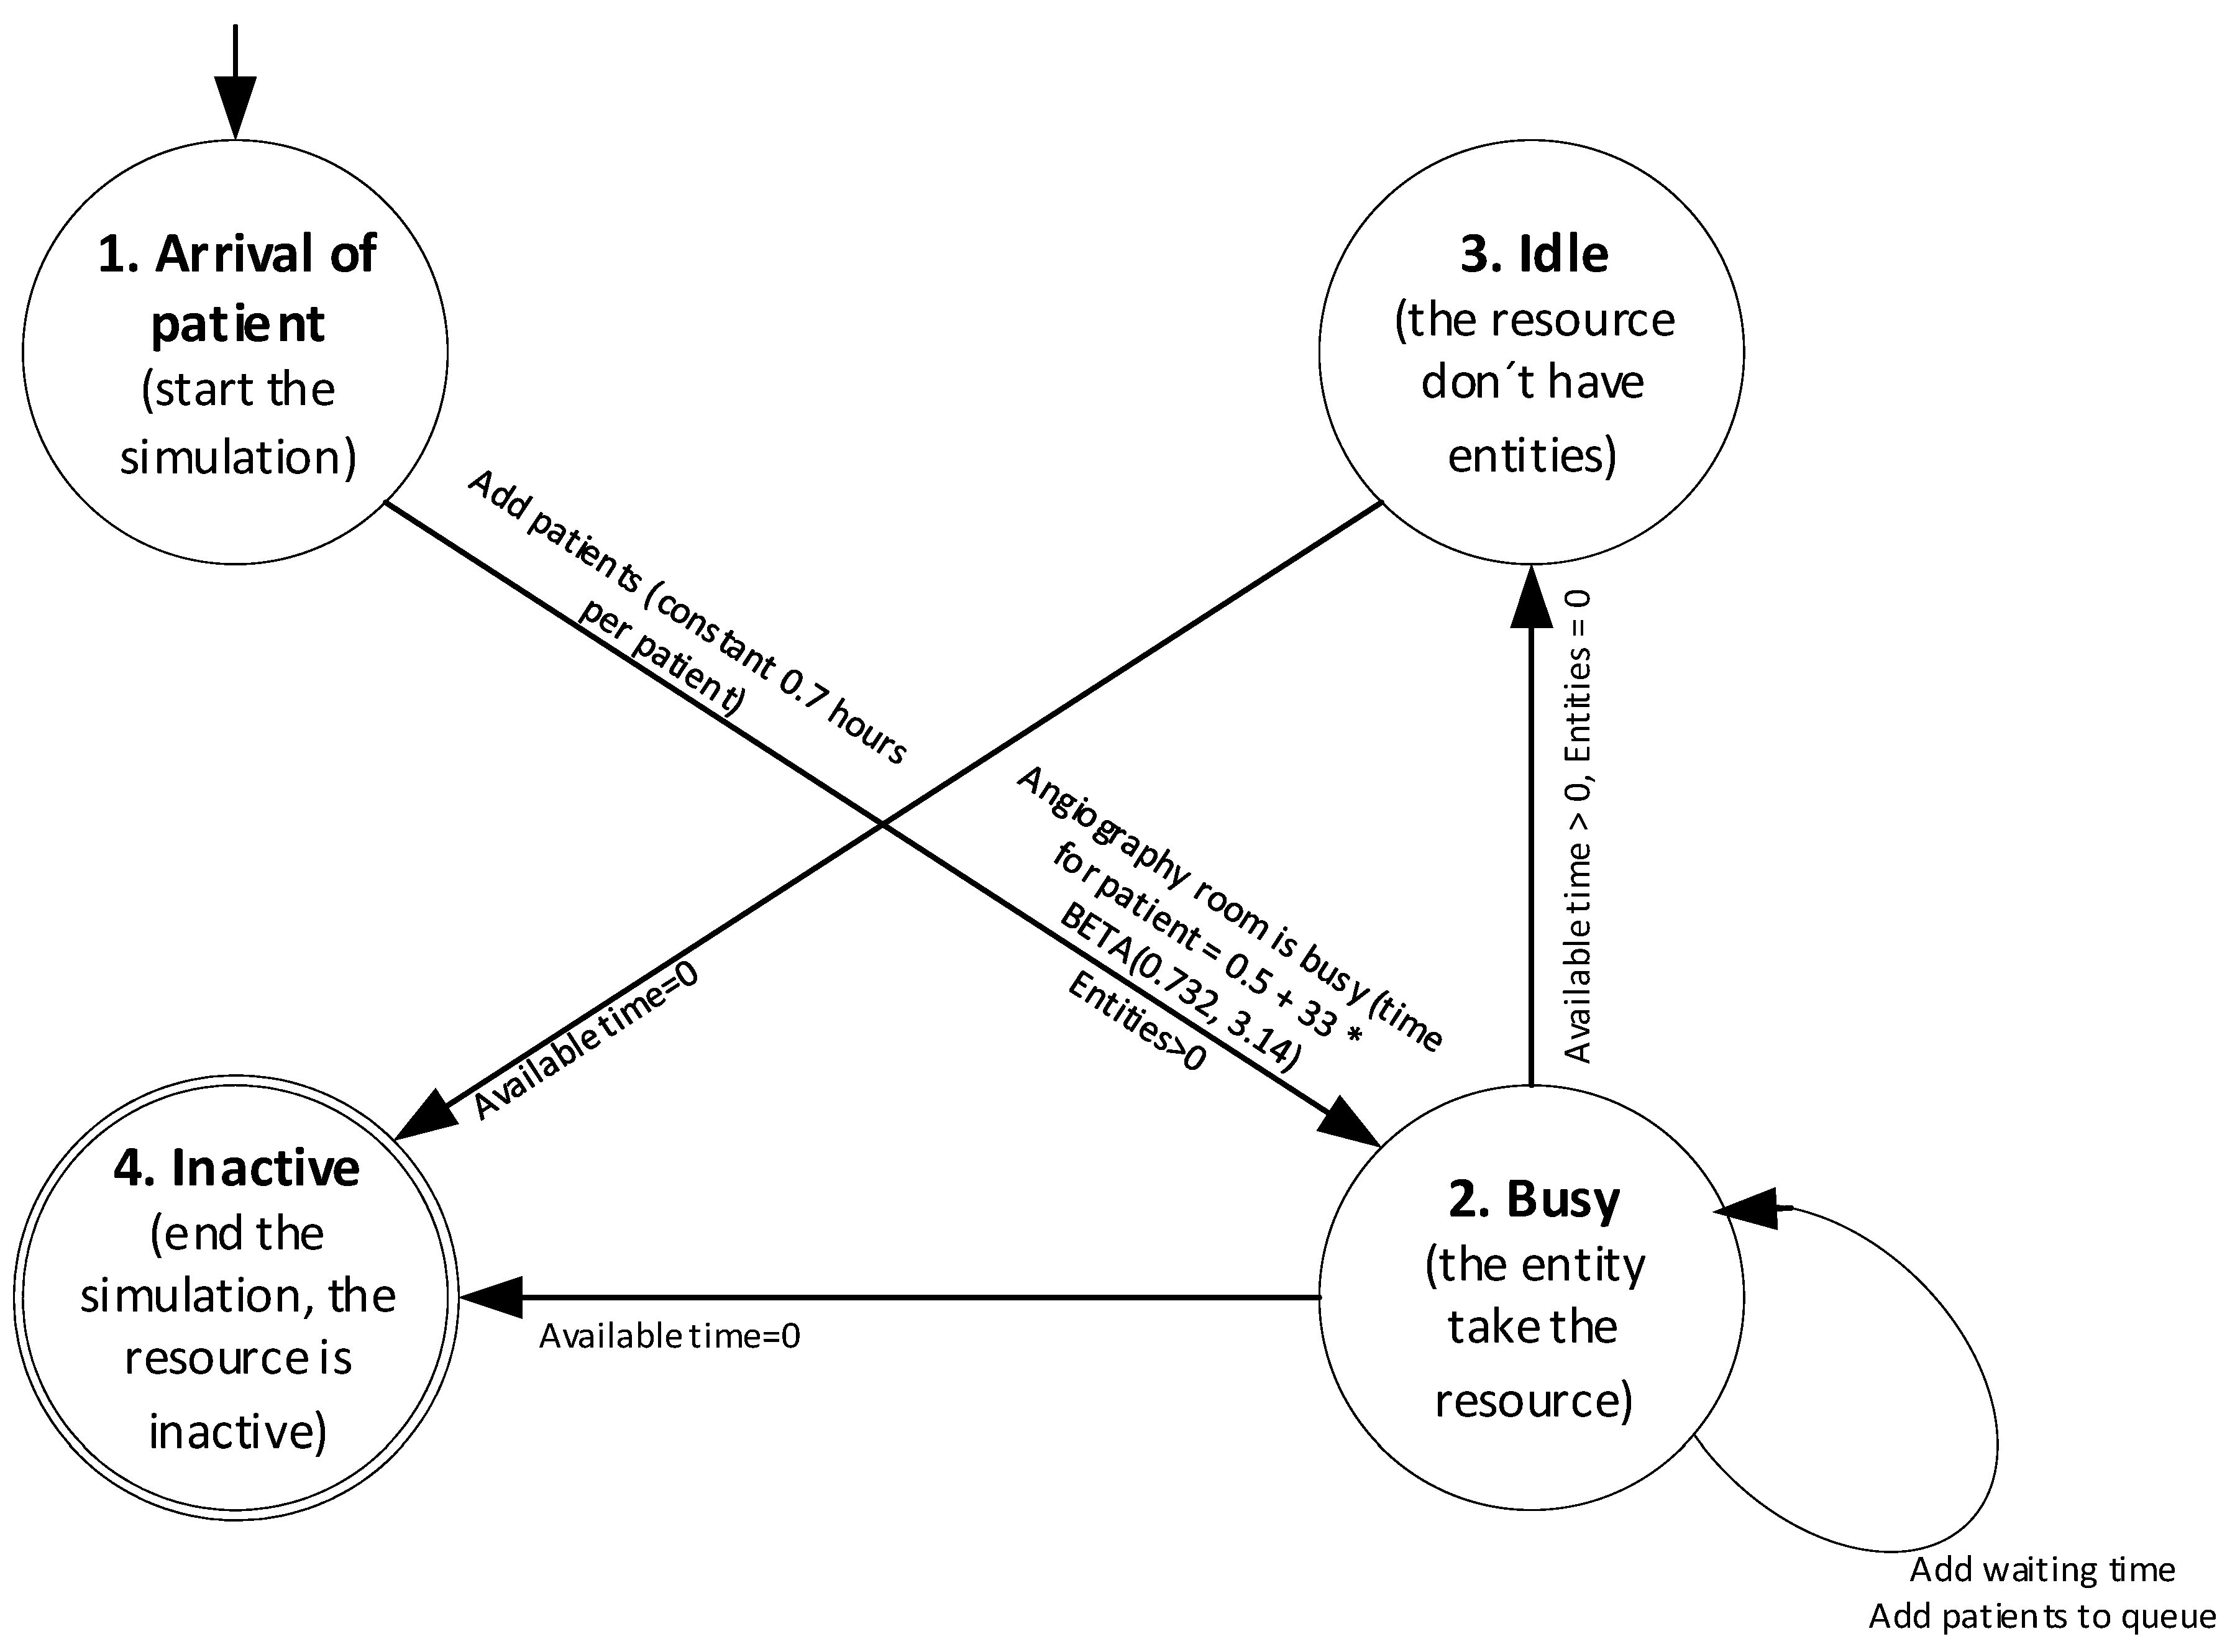
3.4. Simulation Model
3.5. Validation of the Simulation Model
3.6. Improvement Scenario 1: To Have Two Angiography Rooms
3.7. Improvement Scenario 2: Enable an Additional Second Shift
4. Discussion
5. Conclusions
Author Contributions
Funding
Acknowledgments
Conflicts of Interest
References
- Marchesi, J.F.; Hamacher, S.; Fleeck, J.L. A stochastic programming approach to the physician staffing and scheduling problem. Comput. Ind. Eng. 2020, 142, 106281. [Google Scholar] [CrossRef]
- de Sousa Junior, W.; Barra Montevechi, J.A.; de Carvalho Miranda, R.; Teberga Campos, A. Discrete simulation-based optimization methods for industrial engineering. Comput. Ind. Eng. 2019, 128, 526–540. [Google Scholar] [CrossRef]
- Mohammadi Bidhandi, H.; Patrick, J.; Noghani, P.; Varshoei, P. Capacity planning for a network of community health services healthcare data to study causal treatment effects. Eur. J. Oper. Res. 2018, 275, 266–279. [Google Scholar] [CrossRef]
- Improta, G.; Guizzi, G.; Ricciardi, C.; Giordano, V.; Ponsiglione, A.M.; Converso, G.; Triasi, M. Agile Six Sigma in Healthcare: Case Study at Santobono Pediatric Hospital. Int. J. Environ. Res. Public Health 2019, 17, 1052. [Google Scholar] [CrossRef] [PubMed]
- Chyu, M.-C.; Austin, T.; Calisir, F.; Chanjaplammootil, S.; Davis, M.J.; Favela, J.; Gan, H.; Gefen, A.; Haddas, R.; Hahn-Goldberg, S.; et al. Healthcare Engineering Defined: A White Paper. J. Healthc. Eng. 2015, 6, 635–648. [Google Scholar] [CrossRef]
- Caro, J.C.; Möller, J.M.; Getsios, D.G. Discrete Event Simulation: The Preferred Technique for Health Economic Evaluations? Value Health 2010, 13, 1056–1060. [Google Scholar] [CrossRef] [PubMed]
- Moretto, N.; Comans, T.A.; Chang, A.T.; O’Leary, S.P.; Osborne, S.; Carter, H.E.; Smith, D.; Cavanagh, T.; Blond, D.; Raymer, M. Implementation of simulation modelling to improve service planning in specialist orthopaedic and neurosurgical outpatient services. Implement. Sci. 2019, 14, 1–11. [Google Scholar] [CrossRef] [PubMed]
- Rudziński, P.N.; Kruk, M.; Kępka, C.; Schoepf, U.J.; Otani, K.; Leonard, T.J.; Dębski, M.; Dzielińska, Z.; Pręgowski, J.; Witkowski, A.; et al. Assessing the value of coronary artery computed tomography as the first-line anatomical test for stable patients with indications for invasive angiography due to suspected coronary artery disease. Initial cost analysis in the CAT-CAD randomized trial. J. Cardiovasc. Comput. Tomogr. 2019, 10, 771–788. [Google Scholar] [CrossRef]
- Vataire, A.L.; Aballéa, S.; Antonanzas, F.; van Roijen, L.H.; Lam, R.W.; McCrone, P.; Persson, U.; Toumi, M. Core Discrete Event Simulation Model for the Evaluation of Health Care Technologies in Major Depressive Disorder. Value Health 2014, 17, 183–195. [Google Scholar] [CrossRef]
- Fu, X.; Presbitero, A.; Kovalchuk, S.V.; Krzhizhanovskaya, V.V. Coupling Game Theory and Discrete-Event Simulation for Model-Based Ambulance Dispatching. Procedia Comput. Sci. 2018, 136, 398–407. [Google Scholar] [CrossRef]
- Comans, T.; Chang, A.; Standfield, L.; Knowles, D.; O´Leary, S.; Raymer, M. The development and practical application of a simulation model to inform musculoskeletal service delivery in an Australian public health service. Oper. Res. Health Care 2017, 15, 13–18. [Google Scholar] [CrossRef]
- De Boeck, K.; Carmen, R.; Vandaele, N. Needy boarding patients in emergency departments: An exploratory case study using discrete-event simulation. Oper. Res. Health Care 2019, 21, 19–31. [Google Scholar] [CrossRef]
- Easter, B.; Houshiarian, N.; Debajyoti, P.; Wiler, J.L. Designing efficient emergency departments: Discrete event simulation of internal-waiting areas and split flow sorting. Am. J. Emerg. Med. 2019, 37, 2186–2193. [Google Scholar] [CrossRef] [PubMed]
- Furian, N.; O’Sullivan, M.; Walker, C.; Vössner, S. Evaluating the impact of optimization algorithms for patient transits dispatching using discrete event simulation. Oper. Res. Health Care 2018, 19, 134–155. [Google Scholar] [CrossRef]
- Pannakkong, W.; Chemkomnerd, N.; Tanantong, T. Simulation Analysis of University Hospital in the Medical Record Department. In Proceedings of the Seventeenth International Conference on ICT and Knowledge Engineering, Bangkok, Thailand, 20–22 November 2019. [Google Scholar]
- Badrul Ahsan, K.; Alam, M.; Gordon Morel, D.; Karim, M. Emergency department resource optimisation for improved performance: A review. J. Ind. Eng. Int. 2019, 15, 253–266. [Google Scholar] [CrossRef]
- Vieira, B.; Demirtas, D.; Van De Kamer, J.B.; Hans, E.W.; Van Harten, W. Improving workflow control in radiotherapy using discrete-event simulation. Med Inform. Decis. Mak. 2019, 19, 199. [Google Scholar] [CrossRef]
- Carter, H.; Knowles, D.; Moroney, T.; Holtmann, G.; Rahman, T.; Appleyard, M.; Steele, N.; Zanco, M.; Graves, N. The use of modelling studies to inform planning of health services: Case study of rapidly increasing endoscopy services in Australia. Health Serv. Res. 2019, 19, 1–8. [Google Scholar] [CrossRef]
- Lamprecht, J.; Kolisch, R.; Pförringer, D. The impact of medical documentation assistants on process performance measures in a surgical emergency department. Eur. J. Med Res. 2019, 24, 1–8. [Google Scholar] [CrossRef]
- Arafeh, M.; Barghash, M.A.; Haddad, N.; Musharbash, N.; Nashawati, D.; Al-Bashir, A.; Assaf, F. Using Six Sigma DMAIC Methodology and Discrete Event Simulation to Reduce Patient Discharge Time in King Hussein Cancer Center. J. Healthc. Eng. 2018, 2018, 3832151. [Google Scholar] [CrossRef]
- Available online: https://www.arenasimulation.com (accessed on 18 May 2020).
- Hu, X.; Zhuang, Y.; Zhang, F. Security modeling and verification method of embedded software based on Z and MARTE. Comput. Secur. 2020, 88, 101615. [Google Scholar] [CrossRef]
- Uğur Acar, O.; Güvenç, L.; Altuğ, E. Hardware-in-the-Loop Testing of Automatic Lift Dropping System for Heavy Trucks. J. Intell. Robot. Syst. 2019, 1–22. [Google Scholar] [CrossRef]
- Acuña, J.A. Simulación de Procesos; Tecnológica de Costa Rica: Cartago, Costa Rica, 2015; pp. 613–632. [Google Scholar]
- Kubiak, T.; Donald, W. Chapter 26 Implementation. In The Certified Six Sigma Black Belt Handbook, 3rd ed.; American Society for Quality (ASQ): Milwaukee, WI, USA, 2017; p. 576. [Google Scholar]
- Hillier, F.S.; Lieberman, G.J. Investigación de Operaciones; Mc GRaw-Hill: México D.F., Mexico, 2015; pp. 708–757. [Google Scholar]
- Luo, L.; Zhang, Y.; Qing, F.; Ding, H.; Shi, Y.; Guo, H. A discrete event simulation approach for reserving capacity for emergency patients in the radiology department. Health Serv. Res. 2018, 18, 452. [Google Scholar] [CrossRef] [PubMed]
- Ramwadhdoebe, S.; Buskens, E.; Sakkers, R.J.; Stahl, J.E. A tutorial on discrete-event simulation for health policy design and decision making: Optimizing pediatric ultrasound screening for hip dysplasia as an illustration. Health Policy 2009, 92, 143–150. [Google Scholar] [CrossRef] [PubMed]
- Babashov, V.; Aivas, I.; Begen, M.; Cao, J.; Rodrigues, G.; D’Souza, D.; Lock, M.; Zaric, G. Reducing Patient Waiting Times for Radiation Therapy and Improving the Treatment Planning Process: A Discrete-event Simulation Model (Radiation Treatment Planning). Clin. Oncol. 2017, 29, 385–391. [Google Scholar] [CrossRef] [PubMed]
- Marshal, D.A.; Burgos-Liz, L.; IJzerman, M.J.; Crown, W.; Padula, W.; Wong, P.; Pasupathy, K.; Higashi, M.; Osgood, N.D. Selecting a Dynamic Simulation Modeling Method for Health Care Delivery Research—Part 2: Report of the ISPOR Dynamic Simulation Modeling Emerging Good Practices Task Force. Value Health 2015, 18, 147–160. [Google Scholar] [CrossRef]
- García-Sanz-Calcedo, J.; Al-Kassir, A.; Yusaf, T. Economic and Environmental Impact of Energy Saving in Healthcare Buildings. Appl. Sci. 2018, 8, 440. [Google Scholar] [CrossRef]
- Bodur, E.K.; Atsa’am, D.D. Filter Variable Selection Algorithm Using Risk Ratios for Dimensionality Reduction of Healthcare Data for Classification. Processes 2019, 7, 222. [Google Scholar] [CrossRef]
- García-Sanz-Calcedo, J.; Monzón, P. Analysis of the economic impact of environmental biosafety works projects in healthcare centres in Extremadura (Spain). Dyna Colomb. 2014, 81, 100–105. [Google Scholar] [CrossRef]
- Gaspari, J.; Fabbr, K.; Gabrielli, L. A Study on Parametric Design Application to Hospital Retrofitting for Improving Energy Savings. Buidings 2019, 9, 220. [Google Scholar] [CrossRef]
- Viana, J.; Breines Simonsen, T.; Faraas, H.E.; Schmidt, N.; Dahl, F.A.; Flo, K. Capacity and patient flow planning in post-term pregnancy outpatient clinics: A computer simulation modelling study. Health Serv. Res. 2020, 20, 1–15. [Google Scholar] [CrossRef]
- Candelario-Garrido, A.; García-Sanz-Calcedo, J.; Reyes, A.M. A quantitative analysis on the feasibility of 4D planning graphic systems versus conventional systems in building projects. Sustain. Cities Soc. 2017, 35, 378–384. [Google Scholar] [CrossRef]
- Leon-Sanz, P. Key Points for an Ethical Evaluation of Healthcare Big Data. Processes 2019, 7, 493. [Google Scholar] [CrossRef]
- Gómez-Chaparro, M.; García-Sanz-Calcedo, J.; Armenta Márquez, L. Analytical determination of medical gas consumption and their impact on hospital sustainability. Sustainability 2018, 10, 2948. [Google Scholar] [CrossRef]
- The Organisation for Economic Co-operation and Development (OECD). Waiting Times. Available online: http://www.oecd.org/els/health-systems/waiting-times.htm (accessed on 25 January 2020).
- Kalwar, M.A.; Irshad Mari, S.; Memon, M.S.; Tanwari, A.; Siddiqui, A.A. Simulation Based Approach for Improving Outpatient Clinic Operations. Mehran Univ. Res. J. Eng. Technol. 2020, 39, 153–170. [Google Scholar] [CrossRef]
- Stephensa, A.; Walwynb, D.R. Wind energy in the United Kingdom: Modelling the effect of increases in installed capacity on generation efficiency. Renew. Energy Focus 2018, 27, 44–58. [Google Scholar] [CrossRef]


| Variables | Description | Variable Type | Source |
|---|---|---|---|
| Number of patients served | Number of patients seen in the angiography room by year | Quantitative, discrete | Healthcare center operating software |
| Number of patients on waiting lists | Patients registered pending a procedure in the angiography room | Quantitative, discrete | Healthcare center operating software, waiting list |
| Cycle time in the room (μ) | The average duration of procedures performed in the angiography room. This time includes when the patient is admitted until he or she leaves the room. | Quantitative, continuous | Healthcare center operating software |
| S = Cycle time for patient i n = Total number of patients seen in the service | |||
| Arrival time between patients (λ) | The average time of arrivals between patients. | Quantitative, continuous | Healthcare center operating software |
| t = Time between arrivals for patient i n = Total number of patients arriving at the service | |||
| Patient demand | It is the total amount of patients that require the service in a year, considering both those served, on the waiting list and those cancelled | Quantitative, discrete | Healthcare center operating software |
| Average waiting time | The average waiting time in the system and in queue | Quantitative, continuous | Simulation model |
| Average number of patients waiting | The average number of patients waiting to be seen in the angiography room | Quantitative, discrete | Simulation model |
| Utilization rate | The ratio between the time between arrivals and the time. | Quantitative, continuous | Simulation model |
| Month | Monthly Demand (Procedures) | Cancellations | Waiting List | Monthly Output (Procedures) |
|---|---|---|---|---|
| 1 | 58 | 26 | 5 | 27 |
| 2 | 107 | 5 | 8 | 94 |
| 3 | 201 | 7 | 9 | 185 |
| 4 | 217 | 3 | 11 | 203 |
| 5 | 266 | 5 | 15 | 246 |
| 6 | 281 | 3 | 17 | 261 |
| 7 | 260 | 6 | 15 | 239 |
| 8 | 164 | 4 | 21 | 139 |
| 9 | 205 | 7 | 24 | 174 |
| 10 | 195 | 4 | 21 | 170 |
| 11 | 181 | 5 | 19 | 157 |
| 12 | 190 | 9 | 32 | 149 |
| Total | 2325 | 84 | 197 | 2044 |
| Function | Sq. Error |
|---|---|
| Average | 0.00295 |
| Triangular | 0.00485 |
| Weibull | 0.00517 |
| Beta | 0.00616 |
| Poisson | 0.0088 |
| Erlang | 0.0163 |
| Gamma | 0.0166 |
| Lognormal | 0.0292 |
| Uniform | 0.0447 |
| Exponential | 0.083 |
| Function | Sq. Error |
|---|---|
| Beta | 0.0105 |
| Gamma | 0.0149 |
| Weibull | 0.015 |
| Lognormal | 0.0153 |
| Exponential | 0.018 |
| Erlang | 0.018 |
| Triangular | 0.0485 |
| Average | 0.0519 |
| Uniform | 0.0711 |
| Poisson | 0.124 |
| Type | Purchase of Additional Angiography Room | Enable a Second Shift in the Current Room |
|---|---|---|
| Building design | x | |
| Building construction | x | |
| Purchase of angiography equipment | x | |
| Purchase of supplies | x | x |
| Recruitment of specialized technical staff | x | x |
© 2020 by the authors. Licensee MDPI, Basel, Switzerland. This article is an open access article distributed under the terms and conditions of the Creative Commons Attribution (CC BY) license (http://creativecommons.org/licenses/by/4.0/).
Share and Cite
Badilla-Murillo, F.; Vargas-Vargas, B.; Víquez-Acuña, O.; García-Sanz-Calcedo, J. Analysis of the Installed Productive Capacity in a Medical Angiography Room through Discrete Event Simulation. Processes 2020, 8, 660. https://doi.org/10.3390/pr8060660
Badilla-Murillo F, Vargas-Vargas B, Víquez-Acuña O, García-Sanz-Calcedo J. Analysis of the Installed Productive Capacity in a Medical Angiography Room through Discrete Event Simulation. Processes. 2020; 8(6):660. https://doi.org/10.3390/pr8060660
Chicago/Turabian StyleBadilla-Murillo, Félix, Bernal Vargas-Vargas, Oscar Víquez-Acuña, and Justo García-Sanz-Calcedo. 2020. "Analysis of the Installed Productive Capacity in a Medical Angiography Room through Discrete Event Simulation" Processes 8, no. 6: 660. https://doi.org/10.3390/pr8060660
APA StyleBadilla-Murillo, F., Vargas-Vargas, B., Víquez-Acuña, O., & García-Sanz-Calcedo, J. (2020). Analysis of the Installed Productive Capacity in a Medical Angiography Room through Discrete Event Simulation. Processes, 8(6), 660. https://doi.org/10.3390/pr8060660