Article

Improvement of the Mechanical Properties of Thermosetting-Binding-System-Based Composites by Means of Kneading Procedure Modification and Composite Formulation

Nanotesla Institut Logatec, Obrtna cona Logatec 4, SI-1370 Logatec, Slovenia
*
Author to whom correspondence should be addressed.
Processes 2020, 8(5), 625; https://doi.org/10.3390/pr8050625
Submission received: 23 April 2020 / Revised: 18 May 2020 / Accepted: 19 May 2020 / Published: 23 May 2020
(This article belongs to the Section Materials Processes)

Abstract

:
By understanding the effects of the physical properties of individual input materials (e.g., binding system) on the physical and thermal properties of a composite material, the latter can be engineered in advance according to the desired properties and application. Often, a need to replace a specific component in a composite material arises, due to various reasons such as high raw material prices, product price reduction, environmental issues, improvement of properties, and others. In this study, we focused on the substitution of a phenolic novolac resin binding system and the reduction of compounding process temperature in combination with material throughput and screw speed variation of a phenolic-novolac-resin-based composite material, manufactured by kneading process using a co-kneader single screw extruder. Modifications were carried out in the interest of reducing production process cost and positive environmental effect due to reduction of energy consumption in the compounding process. We achieved great success in improvement of mechanical properties with all four substituted phenolic molding compounds (PMCs), while the decrease in thermal stability was the lowest for PMCs prepared at higher screw speeds and material throughput. The results indicated that higher screw speeds produce the best combination of mechanical and thermal properties of PMCs.

1. Introduction

Composite materials are one of the most universally used materials in industrial applications such as the building and construction, automotive, aerospace, and marine industries, due to their excellent adaptability to various required properties [1,2]. The selection of suitable a phenolic novolac resin (PF) as a binding system for use in the manufacture of a composite material is essential to achieving the desired mechanical and thermal properties in the final product [3,4]. The primary function of the binding system in a composite material is to hold all the components in the composite material together, but that is not the only function of it. Other functions of the binding system in the composite material include assisting in the distribution or transfer of mechanical loads, assisting in controlling the chemical properties of the composite materials, the transfer of interlayer shear, the transfer of applied force to the reinforcement of composite material (reinforcement binder), and prevention and protection against mechanical damage to fibers resulting from the spread of cracks (occurring in the material manufacturing phase or in the end product). In order to provide adequate performance in the properties listed above, a suitable PF should be applied in the compounding process [5]. There is a wide range of commercially available PFs on the market; thus, knowledge of the influence of their physical properties, such as the melt viscosity and glass transition temperature, on the mechanical and thermal properties of the final product is of crucial importance [4]. The rheological properties of phenolic-novolac-resin-based composite materials are highly dependent on the thermomechanical conditions applied during the compounding process. In addition to consideration of the homogeneity and dispersion of components in the compound, the phenomenon of thermosetting resins (PF resins) partly crosslinking during the compounding process should not be neglected [6]. Often, a need to replace single or multiple specific components in a composite material arises, due to various reasons such as high raw material prices, product price reduction, environmental issues, improvement or modification of properties, among others [7,8]. Ideally, with a suitable choice of substitute of phenolic novolac resin, the same technological process can be maintained. In most cases, after the substitution of a particular input material, it is necessary to modify or optimize the technological process [9]. Studies investigated the effects of various physical properties of PF resins and compounding process parameters on the properties of composite materials. Wan et al. [4] reported the effect of molecular weight (Mw) and molecular weight distribution (Mn) of novolac PF resins on curing reaction kinetics, and rheological and mechanical properties of phenolic molding compounds. Kaylon et al. [6] investigated the influence of compounding process parameters on the degree of curing of powder PF resin during the compounding process and further processability.
In recent years, the polymer industry has put great focus on producing renewable-material-based polymers as a way of tackling environmental issues and dependence on the petrochemical industry [10]. It is not the only way to address these environmental concerns; making an effort to reduce the power consumption and heat emissions during the compounding process is also of value. The aim of our work was the substitution of a phenolic novolac resin binding system and reduction of the compounding temperature of a phenolic-novolac-resin-based composite material. We strove to preserve or improve the mechanical and thermal properties of the modified phenolic-novolac-resin-based composite material compared to the initial composite material. In order to optimize the technological process, we chose a phenolic novolac resin binding system with a lower melt viscosity and lower glass transition temperature than the initial phenolic novolac resin binding system, which made it possible to reduce the compounding temperature. With the compounding temperature reduction, we lowered the energy consumption and heat emissions during the compounding process. Compounding of composite materials was carried out on a Buss Co-Kneader PLK 46-11R, which is a single-screw design that not only rotates but is accompanied by position alternation in the axial direction during every rotation. As long as the metering of the individual components is appropriate, temperature rise and torque can be kept adequately under control, even for thermally unstable and potentially problematic compounding processes [11,12].

2. Materials and Methods

2.1. Materials

We applied four commercially available phenolic novolac resins, supplied by different manufacturers, marked as PF 1, PF 2, PF 3, and PF 4. Resin PF 1 was supplied by Kangnam Chemical Co., Seoul, Republic of Korea, PF 2 was supplied by Hüttenes-Albertus Chemische Werke GmbH, Düsseldorf/Hanover, Germany, and resins PF 3 and PF 4 were supplied by BI-QEM RESINS AB, Perstorp, Sweden. Resins PF 3 and PF 4 were polymers based on phenol (CAS 108-95-2) and formaldehyde (CAS 50-00-0). Information on the molecular weight (Mw), molecular weight distribution (Mn), polydispersity index (Mw/Mn), and free phenol content provided by the suppliers is presented in Table 1 The supplier of PF 2 provided us only with information about free phenol content. Hexamethylenetetramine (HMTA) was used as a curing agent, non-treated kaolin and silane-treated calcined kaolin as fillers, chopped glass fibers as a reinforcement agent, and curing accelerator, lubricant, release agent, pigment, and a dye as additives. The specified specific surface area (B.E.T. model Brunauer-Emmett-Teller theory) of non-treated kaolin and silane-treated calcined kaolin was 8.0 m2/g and 8.5 m2/g (prior to surface treatment), respectively. Both types of filler had a specific gravity of 2.6 g/cm3. The specified nominal glass fiber diameter was 11 µm with average fiber length 3 mm.

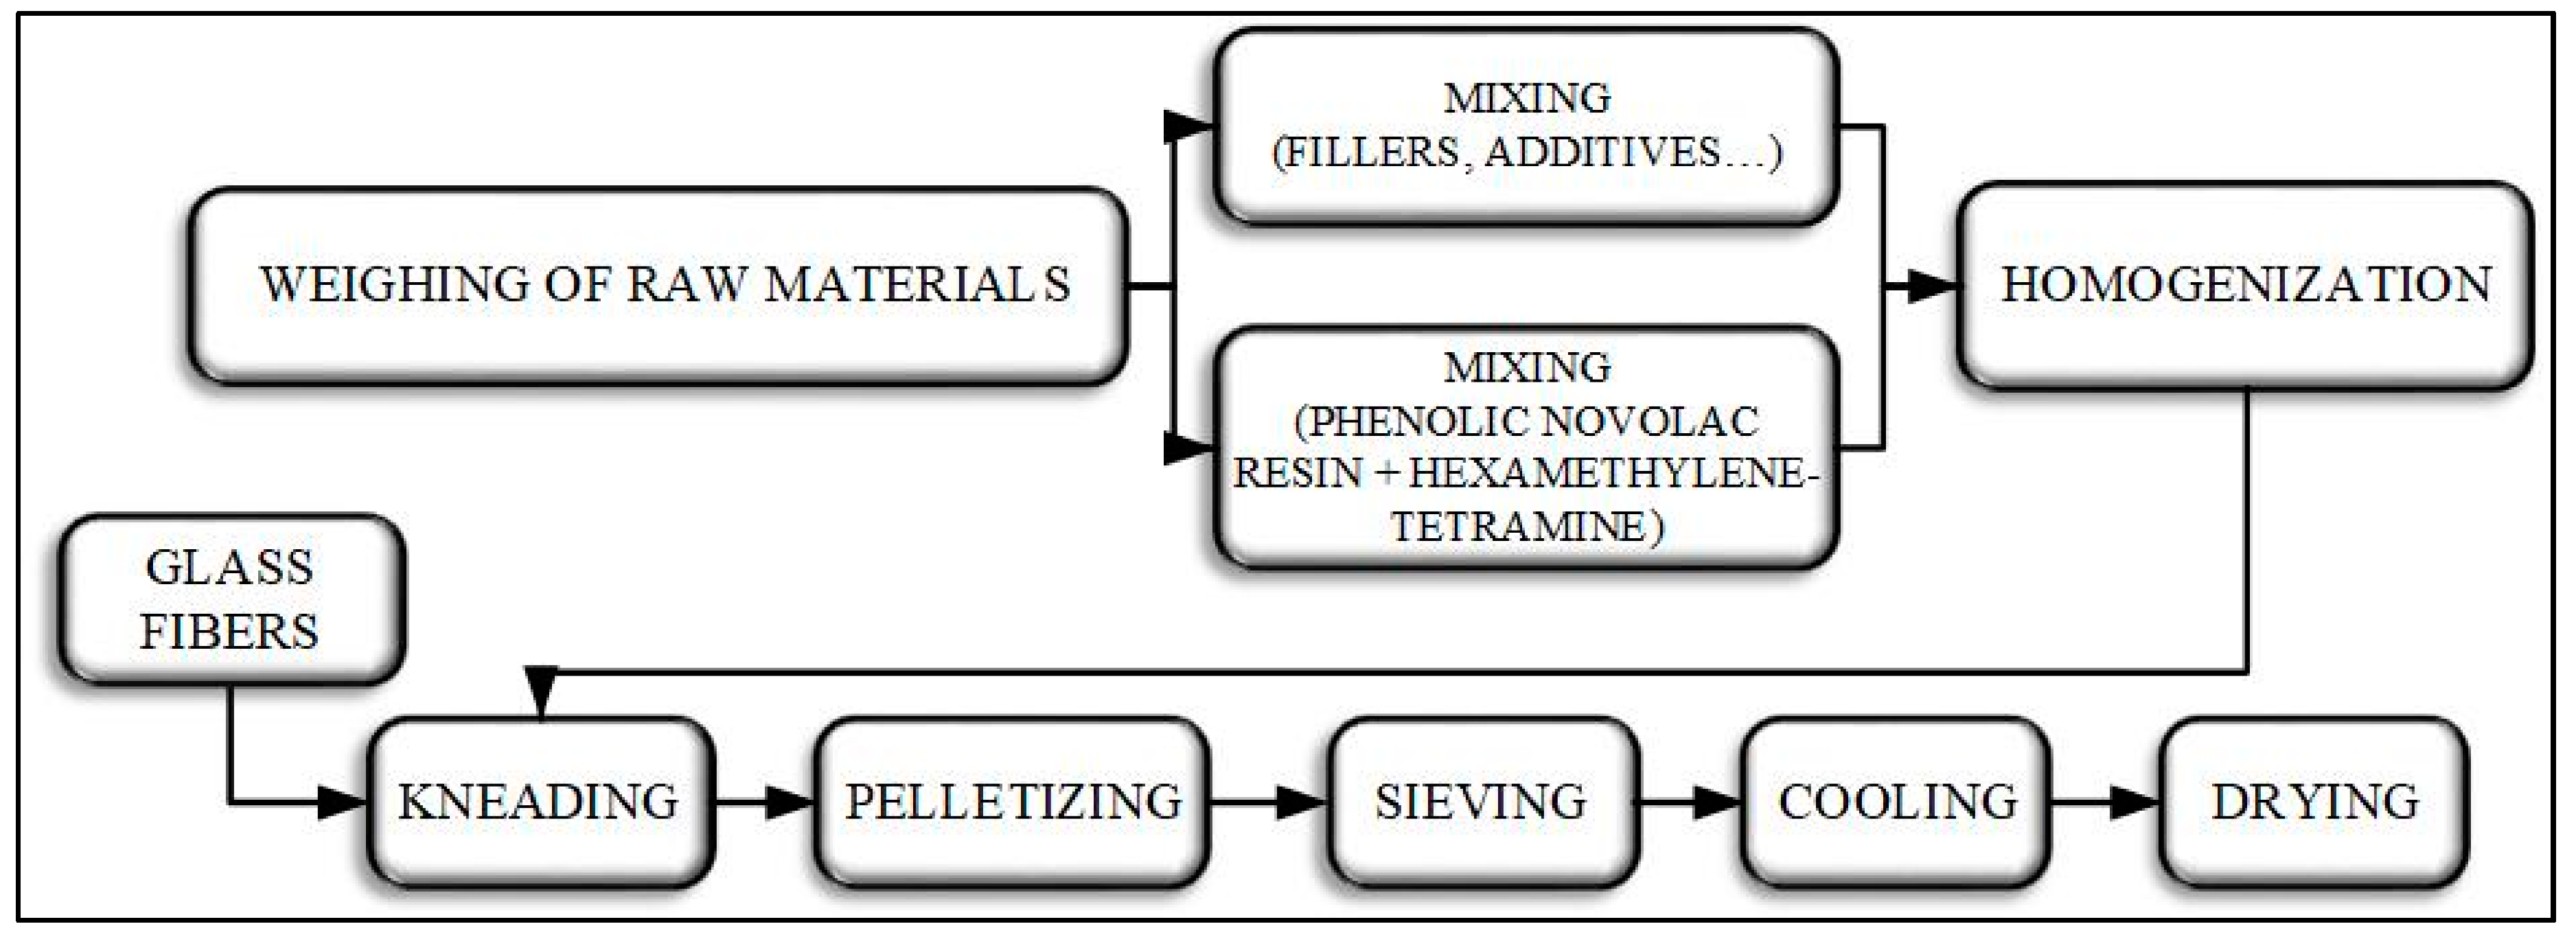
2.2. Preparation of Phenolic Molding Compounds

Five different PMCs—marked as PMC 1 (initial phenolic molding compound material), PMC 2, PMC 3, PMC 4, and PMC 5—were prepared. The preparation process of all five PMCs involved compounding process temperature, screw speed, and material throughput variations, as presented in Table 2. Binding System 1 in PMC 1 consisted of PF 1, PF 2, and HMTA; Binding System 2 in PMCs 2 to 5 consisted of PF 3, PF 4, and HMTA. The weight ratio of PF 1 to PF 2 and weight ratio of PF 3 to PF 4 was 2:1. The weight ratios of PFs were set at 2:1 based on to supplier specifications and thermal analyses performed. Binding System 1 was decided based on selection of the PF resins with the lowest values of glass transition temperatures of the four PFs, with two units assigned to the PF resins with the higher values of melt viscosity and one unit assigned to the PF resins with the lower values of melt viscosity. The alternative Binding System 2 consisted of the PF resins with the highest values of glass transition temperature, with two units assigned to the PF resins with the lower values of melt viscosity and one unit assigned to the PF resins with higher melt viscosity. The weight loading of each binding system was equal for all the prepared PMCs (30.0 wt. %). Weight fractions of all other used components was also invariable: 24.0 wt. % of fillers, 46.0 wt. % of reinforcement agent, and 3.0 wt. % of additives.
The preparation procedure of PMCs consisted of eight sequential operations, as presented in Figure 1. With the exception of glass fibers, all of the components were intensively mixed in a high-speed mixer for 10 min at room temperature to ensure a homogeneous mixture, which in the next step was compounded and melt-kneaded in combination with glass fibers in a continuous axially oscillating single-screw extruder (Buss PLK 46-11R, Buss AG, Pratteln, Switzerland), with the average compounding temperature varying from 80 °C to 86 °C in the kneading zone. Compounding process was followed by pelleting using a discharging extruder with an eccentric pelletizing line equipped with a ɸ3 mm nozzle die plate (Xinda PSJ-90, Xinda Corporation, Jiangyin City, Jiangsu Province, China), forming granulate PMCs with grain sizes ranging from 2 mm to 4 mm. Moisture removal (drying) was performed in a vibrating fluid-bed pilot plant (VF 20/1.5, VIBRA MACHINENFABRIK SCHULTHEIS GmbH & Co., Offenbach am Main, Germany) for 60 min ± 5 min at the temperature of 90 °C ± 2 °C, with the exception of PMC 4 (75 min at the temperature of 90 °C ± 2 °C).

2.3. Preparation of Phenolic Molding Compound Standard Test Specimens

The molding procedure of the PMCs was carried out with an injection molding machine (Arburg Allrounder 1500T 2000 – 400/290, ARBURG GmbH + Co KG, Lossburg, Germany), with a pressure range from 900 bar to 1100 bar for the PMC with the lowest melt viscosity and with a pressure range between 1400 bar and 1500 bar for the PMC with the highest melt viscosity. The mold temperatures for all of the PMCs were 170 °C ± 5 °C. Employing this process, we acquired standard test specimens with dimensions 170.00 mm (length) × 20.04 mm (width) × 4.00 mm (height), according to the ISO 527-2/1A standard.

2.4. Testing Methods

Various testing methods were applied in different stages of the work process. We used differential scanning calorimetry, melt viscosity analysis, phenolic resin flow distance test, and volatile organic compound analysis for characterization of PFs. Rheological properties and volatile organic compound analysis were applied to characterize the phenolic molding compound (PMC) granulates. To characterize the mechanical properties of the PMC standard test specimens, we used tensile strength, flexural strength, and Charpy impact strength (unnotched) measurements, and for characterization of thermal properties, we applied TMA. X-ray computed tomography was used to detect manufacturing defects in the PMC standard test specimens.
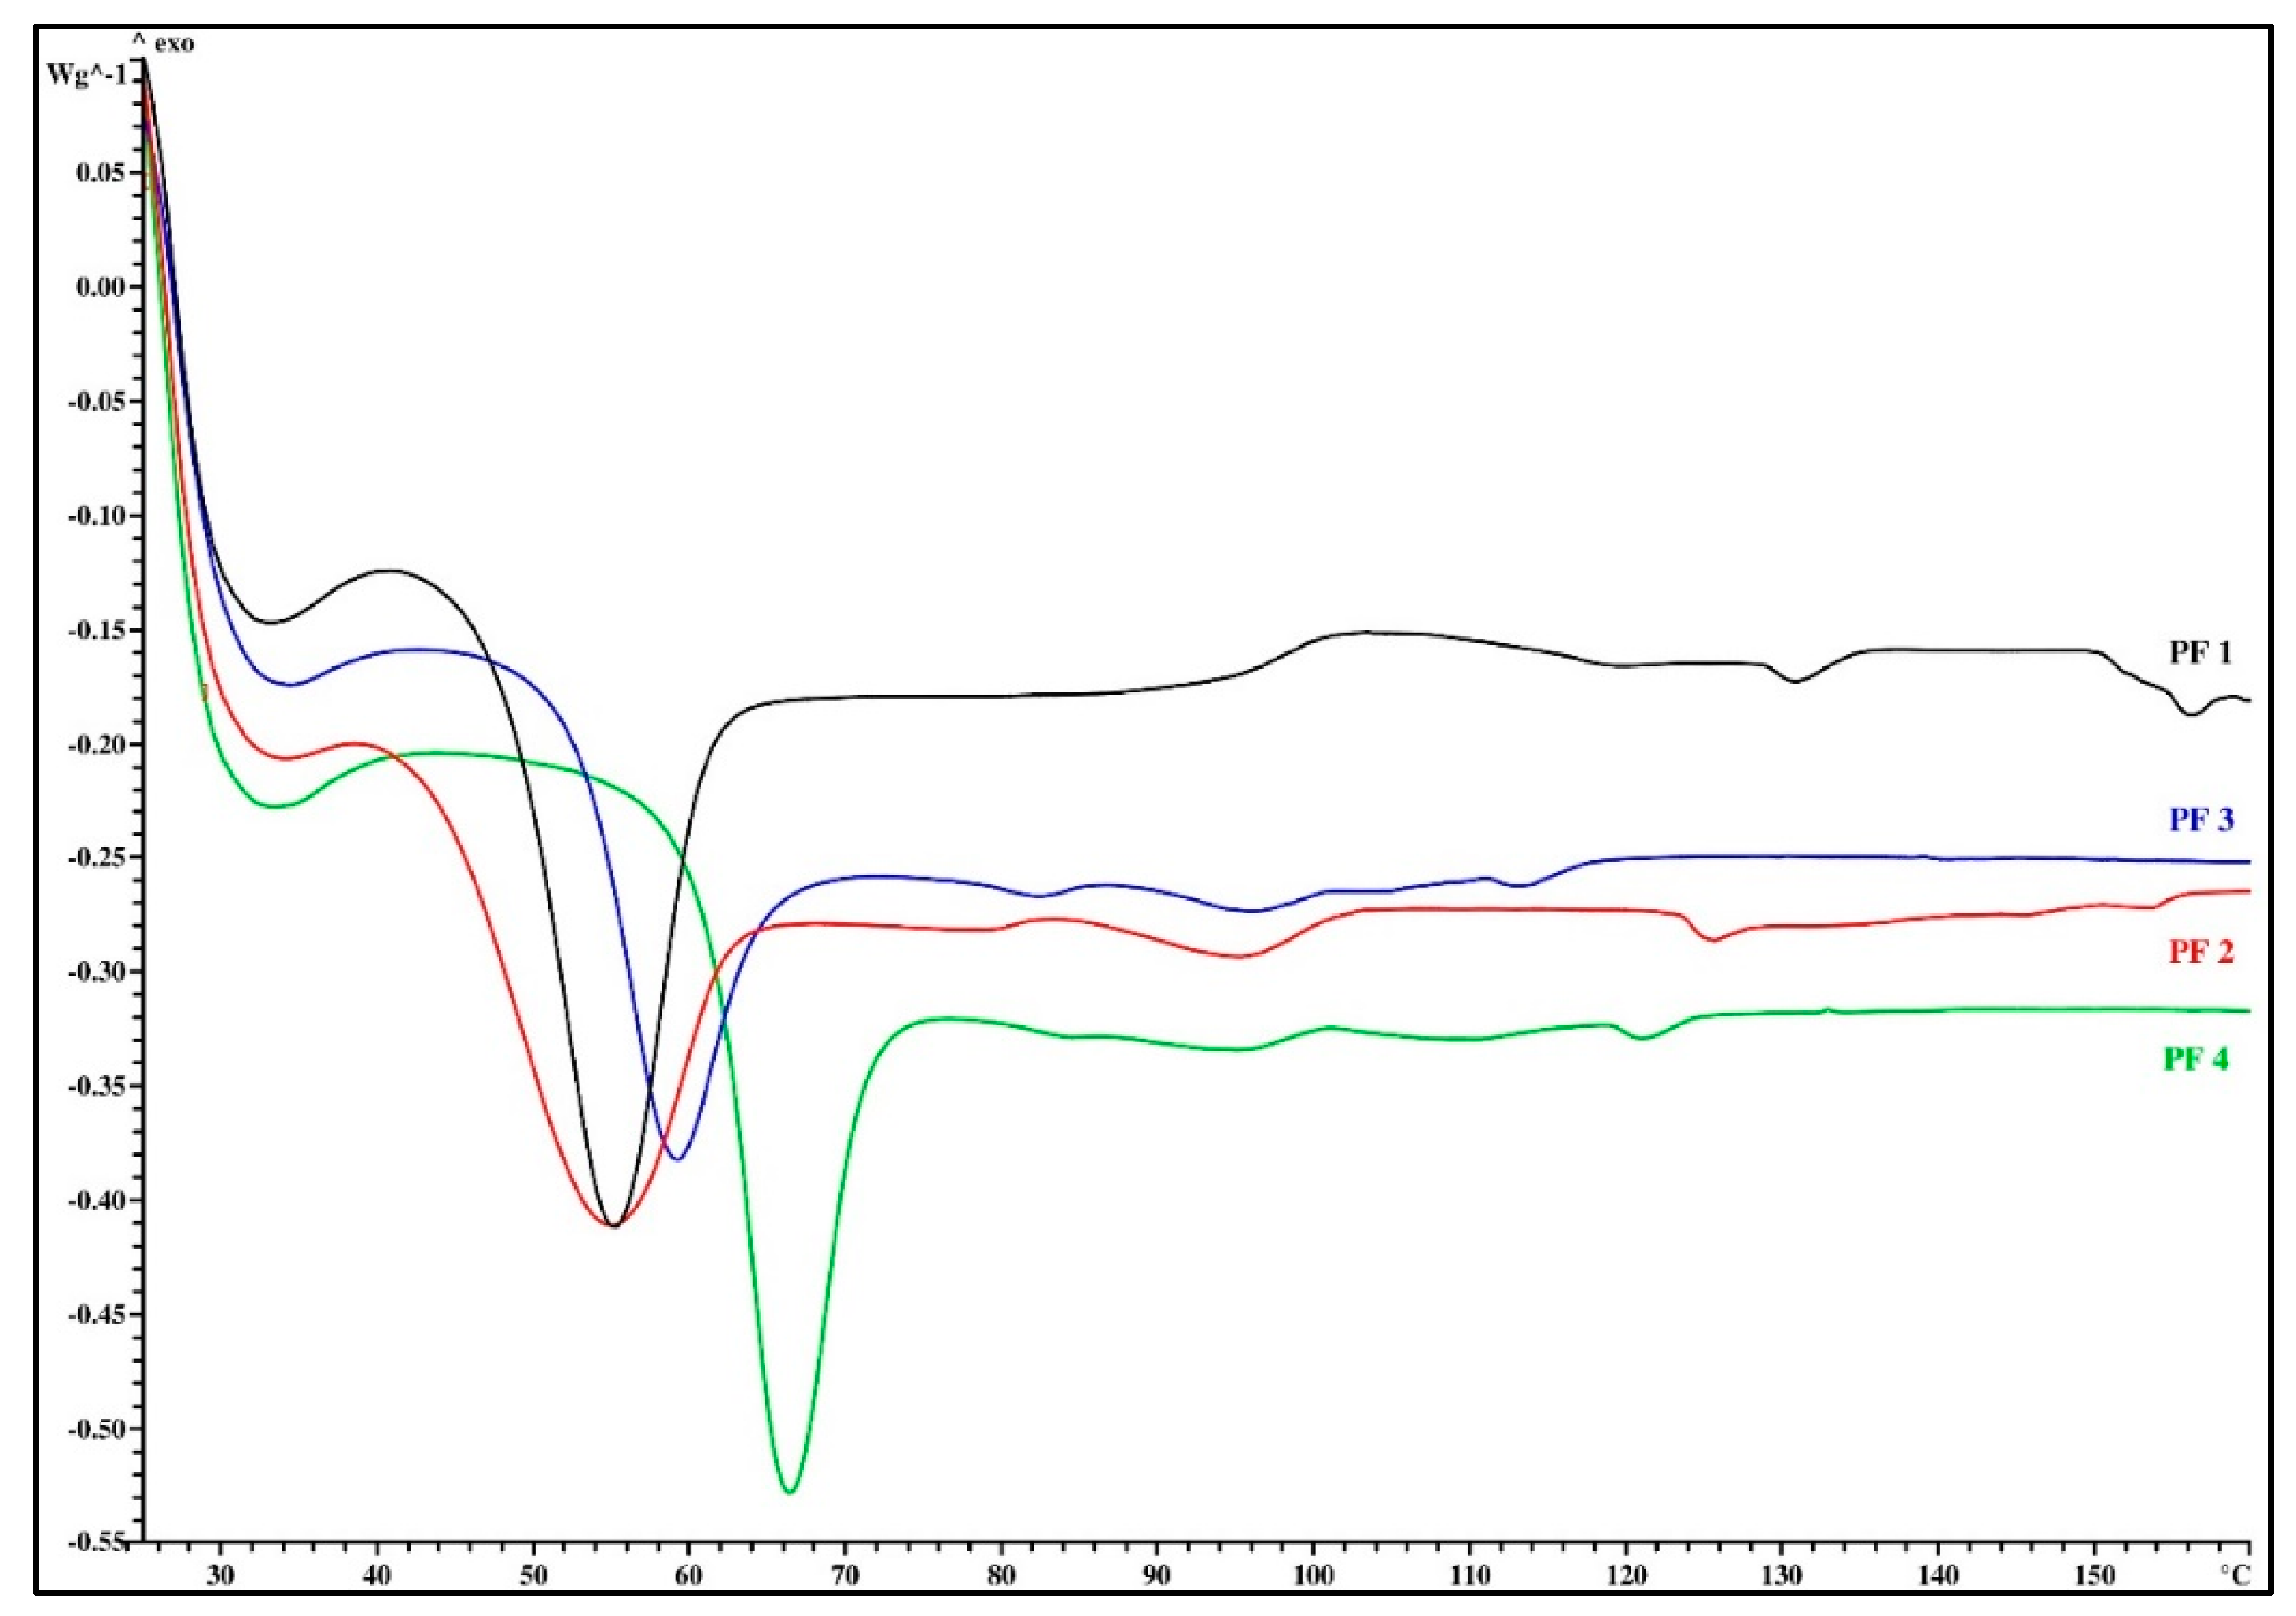
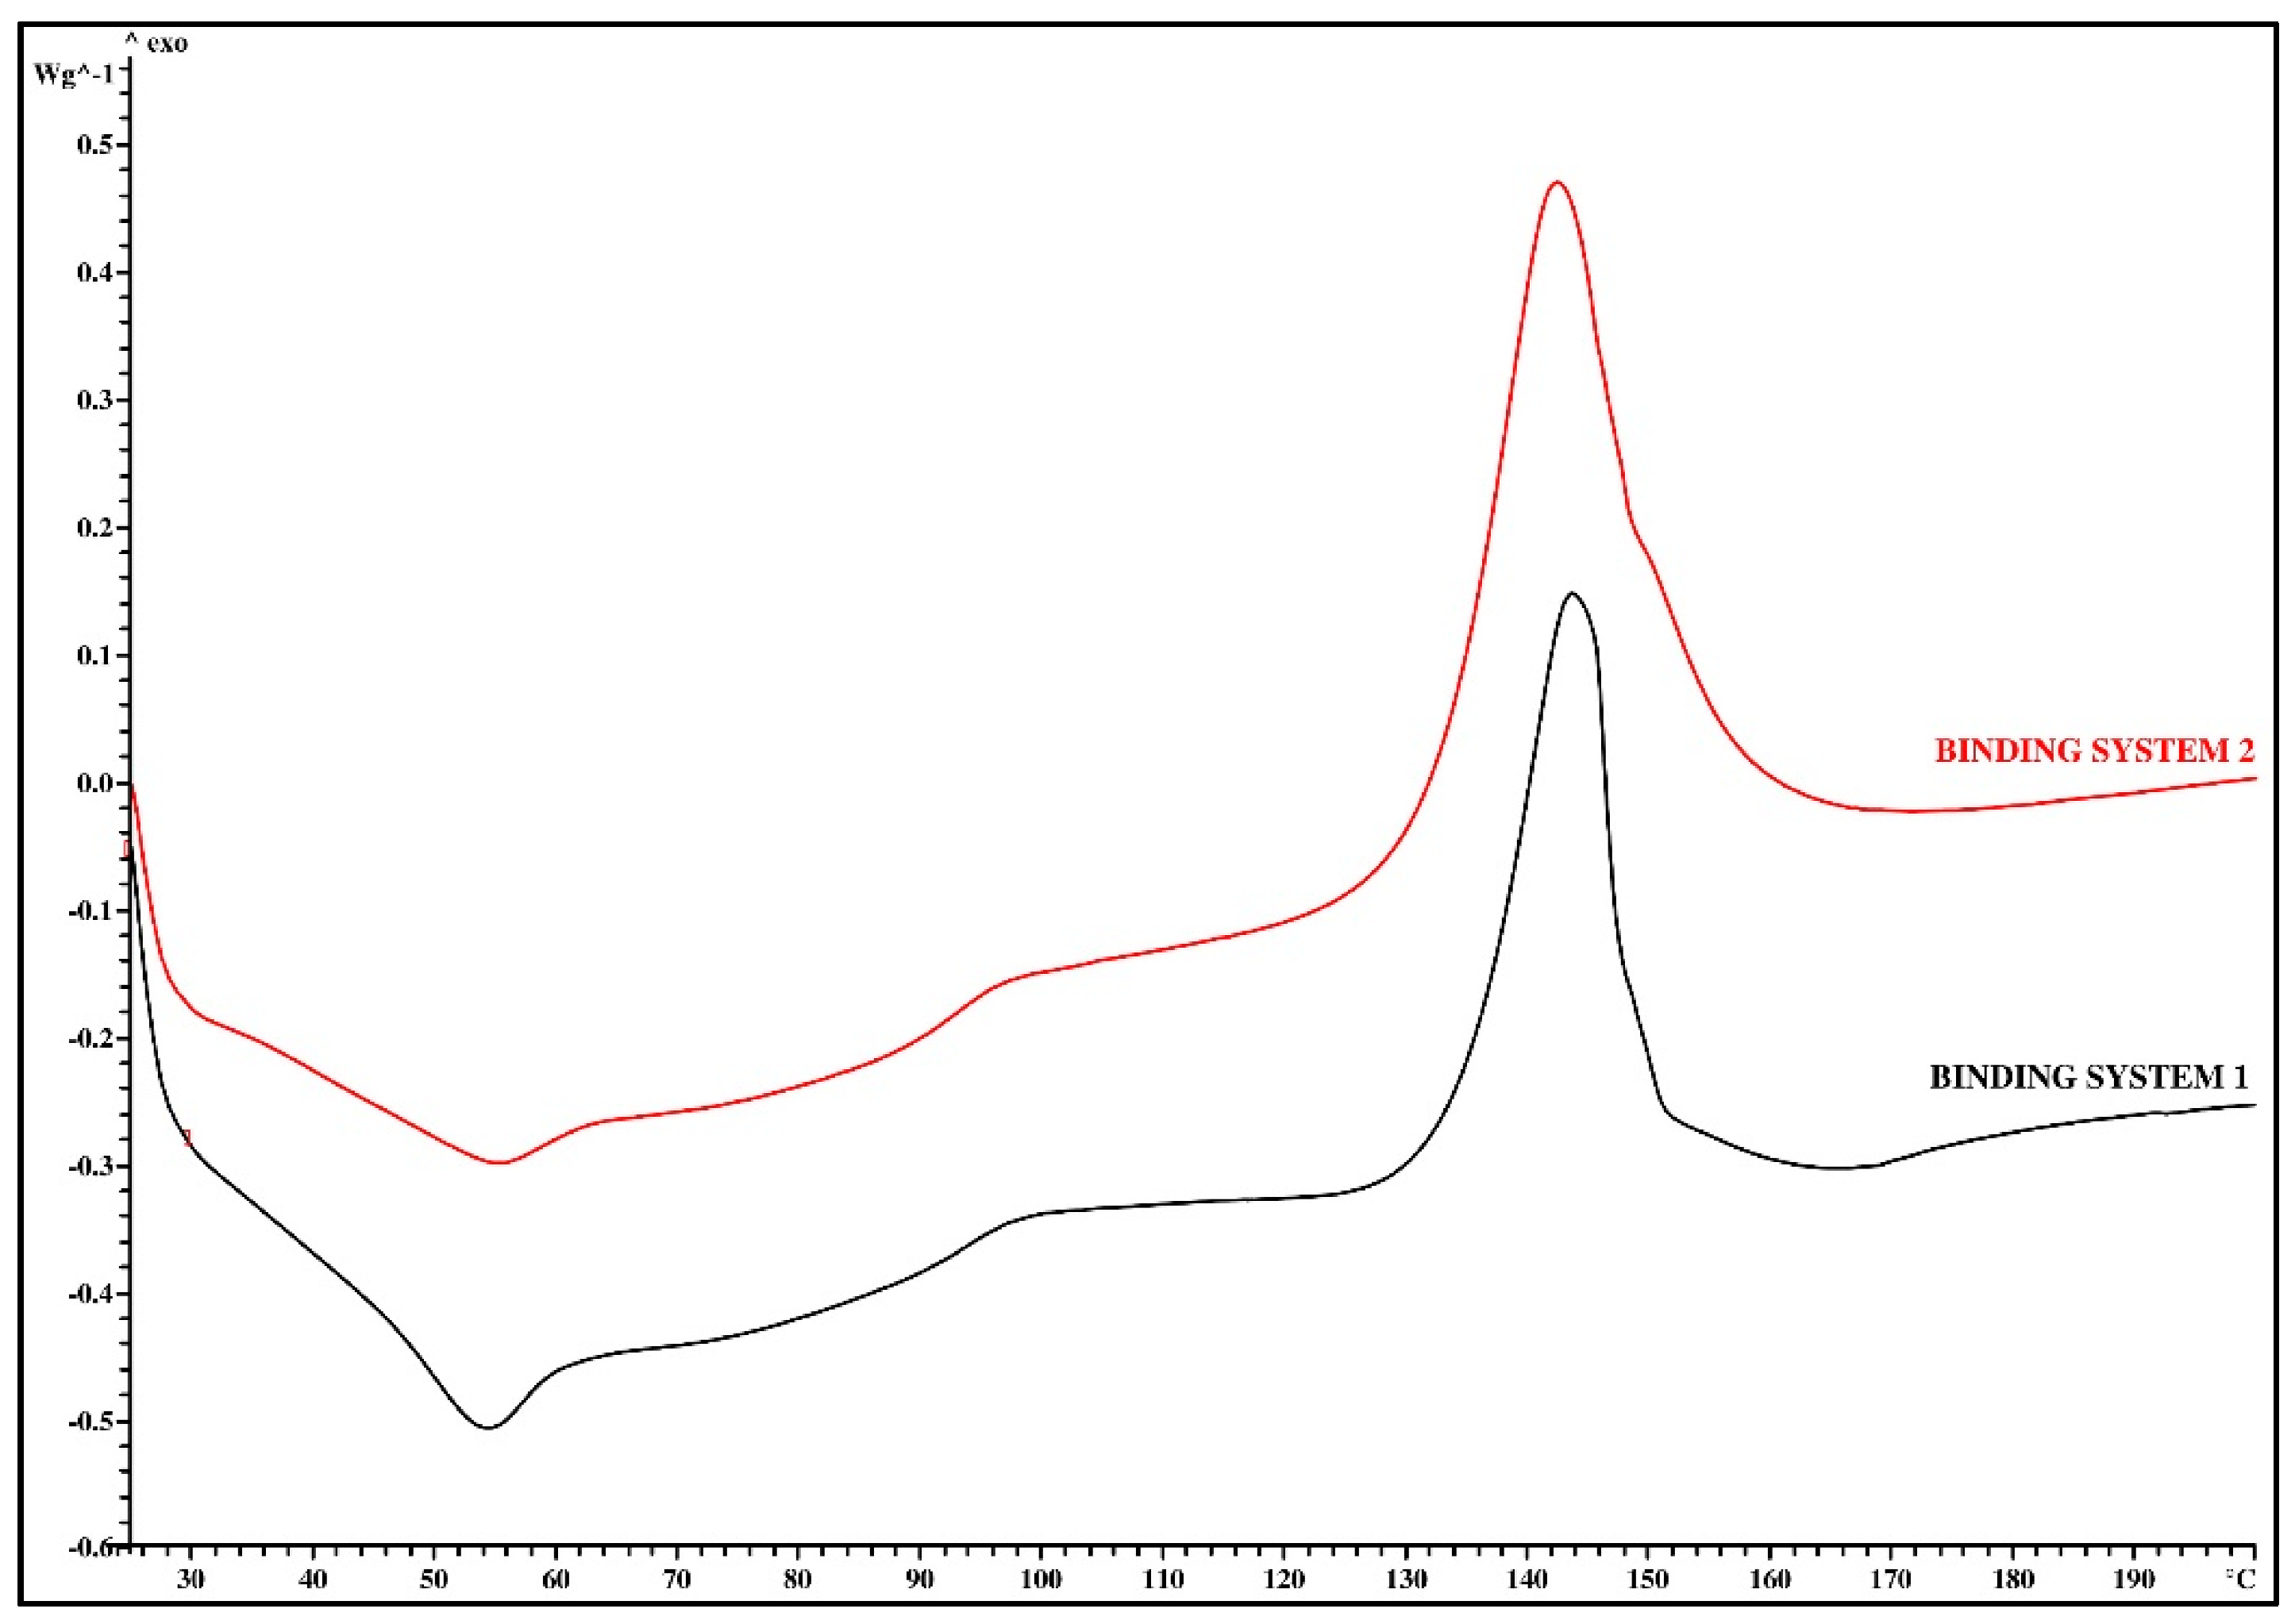
  • Differential scanning calorimetry (DSC): The test samples were heated in a thermal analyzer apparatus (DSC823e Module STARe System, Mettler Toledo, Greifensee, Switzerland), in order to determine heat flow profiles of the PFs before the compounding process and of the binding system before the compounding process. Aluminum pans (40 µL) with pierced lids, containing 12.0 mg ± 2.0 mg of test samples for PF resins and 10.0 mg ± 1.0 mg for binding system, were analyzed at the temperature range from 25 °C to 300 °C, with a heating rate of 10 K/min under air atmosphere.
  • Melt viscosity analysis: Melt viscosities of PF resins were measured using a cone-plate rotating springless viscometer (RM100 CP2405, Lamy Rheology, Champagne au Mont d’Or, France). Samples of 80.0 mg ± 0.2 mg of the tested PF resins were weighed and used for determination of melt viscosity of PF resins. Preset time of measurement was 60 s, temperature was 150 °C, and shear rate was 600 s−1.
  • Phenolic resin flow distance test: Phenolic resin flow distance is a standardized test (ISO 8619) used to check the reactivity and viscosity of resin. We applied two modifications to the standardized method: the pellet size was 14.50 mm ± 0.3 mm in diameter and 5.0 mm ± 0.2 mm in height, and the inclining apparatus was made out of stainless steel. Twenty grams of PF and HMTA were weighed in a weight ratio of 9:1 and homogenized in a coffee grinder (Coffee grinder SMK150B, Gorenje, Velenje, Slovenia) for 60 s. Pellets were crafted by weighing 0.50 g ± 0.01 g of powered homogeneous mixture of PF and HMTA, followed by pressing to specified dimensions. The stainless steel inclining apparatus was tempered in a horizontal position at 125 °C ± 1 °C for 60 min in an oven (Performance laboratory oven SP-45C, Kambič, Semič, Slovenia), while we placed the previously crafted pellets on a cold smooth glass plate—the distance from the edges of the smooth glass plate was 1 cm. After placing the cold smooth glass plate, carrying test pellets, on the inclining apparatus, we kept the plate in a horizontal position for 180 s ± 3 s, then lowered the shelf and glass plate to 60° and continued heating for 20 min. Finally, we removed the glass plate from the oven and cooled to room temperature before measuring the distance from the upper point in the original position of the pellets to the point of most extreme flow. We expressed the results as the arithmetic mean of the two flow distances.
  • Volatile organic compounds: The test samples were heated in a halogen moisture analyzer apparatus (HG63 Halogen Moisture, Mettler Toledo, Greifensee, Switzerland). We determined volatile organic compounds of PFs before the compounding process and of PMC granulates by heating (and maintaining at the temperature 168 °C for 12 min) aluminum sample pans containing 13.00 g ± 0.10 g of test samples.
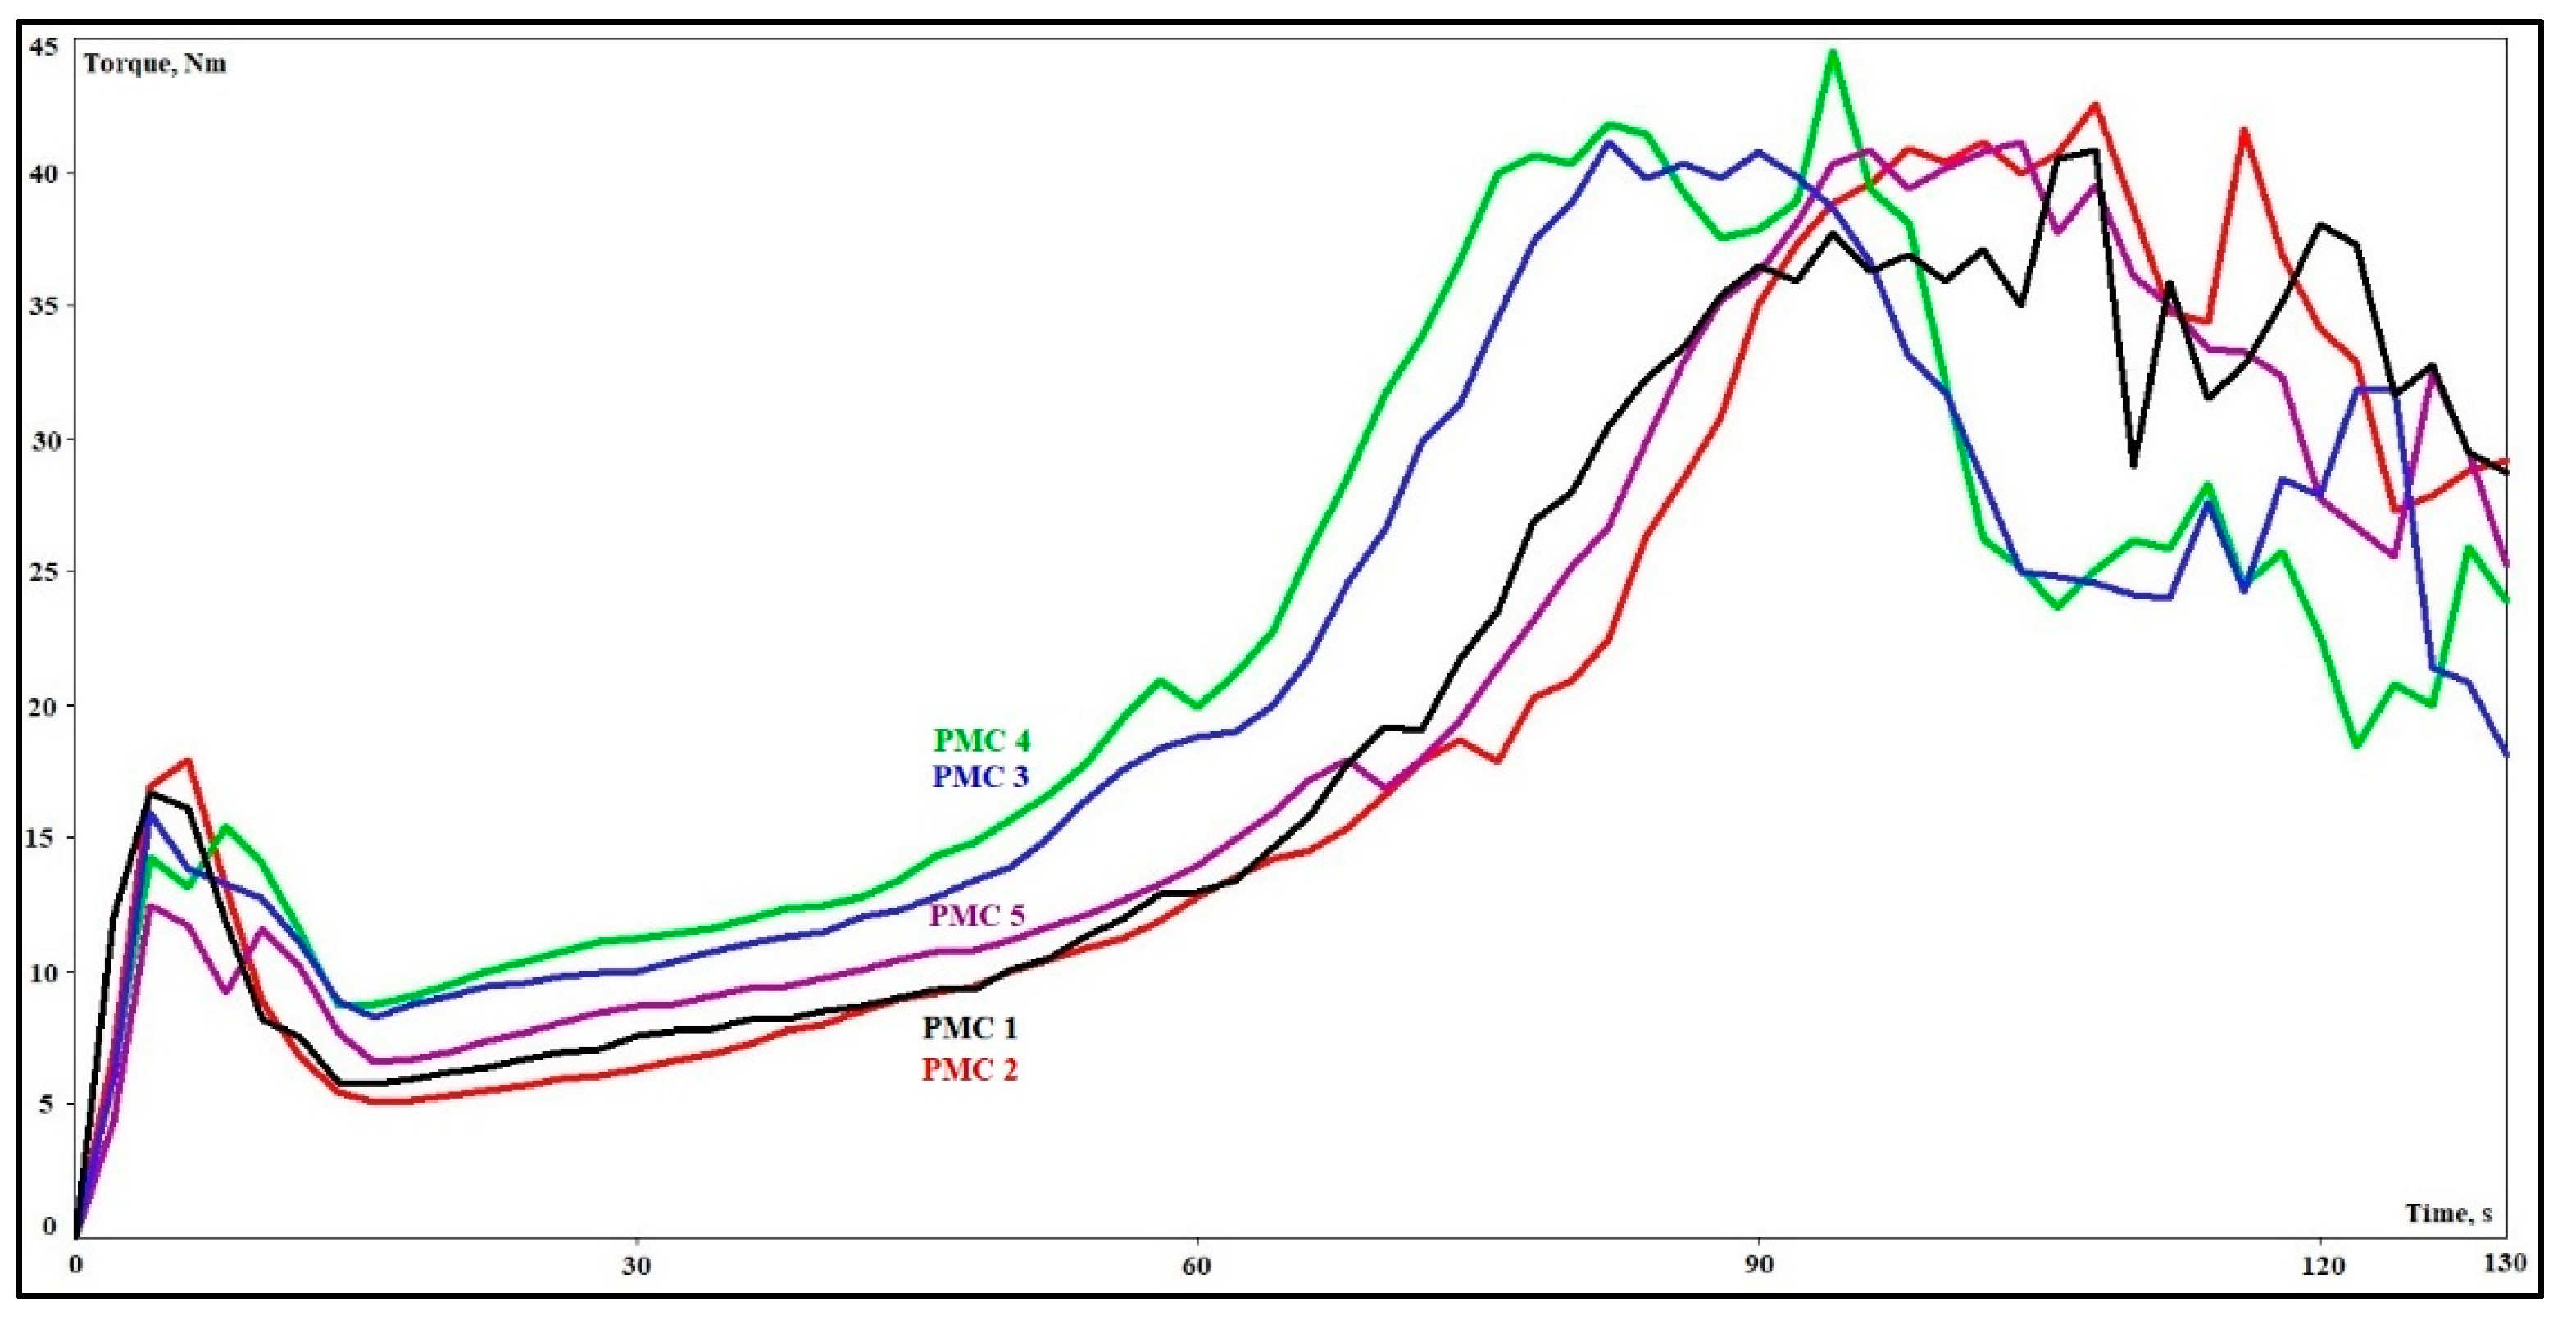
  • Chemical rheology analysis: The flow-curing behavior of the PMC granulates was determined using a torque rheometer (Brabender Plastograph EC plus equipped with MB30 mixer, Brabender GmbH & Co. KG, Duisburg, Germany), obtaining typical plastograms, which show the relationship between torque (corresponding to the melt viscosity of the tested sample) and the temperature–time in consideration of structural changes of the material. Twenty-five grams of test sample were loaded into the mixer bowl, which was heated and kept at a temperature of 140 °C. The speed of rotation of the triangle-shaped mixing blades was 30 rpm and the duration of the analysis was 130 s.
  • Mechanical properties: The mechanical characterization of the injection-molded PMC standard test specimens was carried out using a universal tensile testing machine (AG-x plus 10 kN, Shimadzu Corporation, Kyoto, Japan) to determine tensile strength and flexural strength (according to ISO 527-1 and ISO 178, respectively). To determine the Charpy impact strength, we used an impact strength measuring machine (Charpy LY-XJJDSM; according to ISO 179-1). For all methods applied, we used standard injection-molded PMC standard test specimens. For the Charpy impact strength measurements, we modified the PMC standard test specimens by cutting them to dimensions 120.0 mm × 20.0 mm × 4.0 mm (L × W × H).
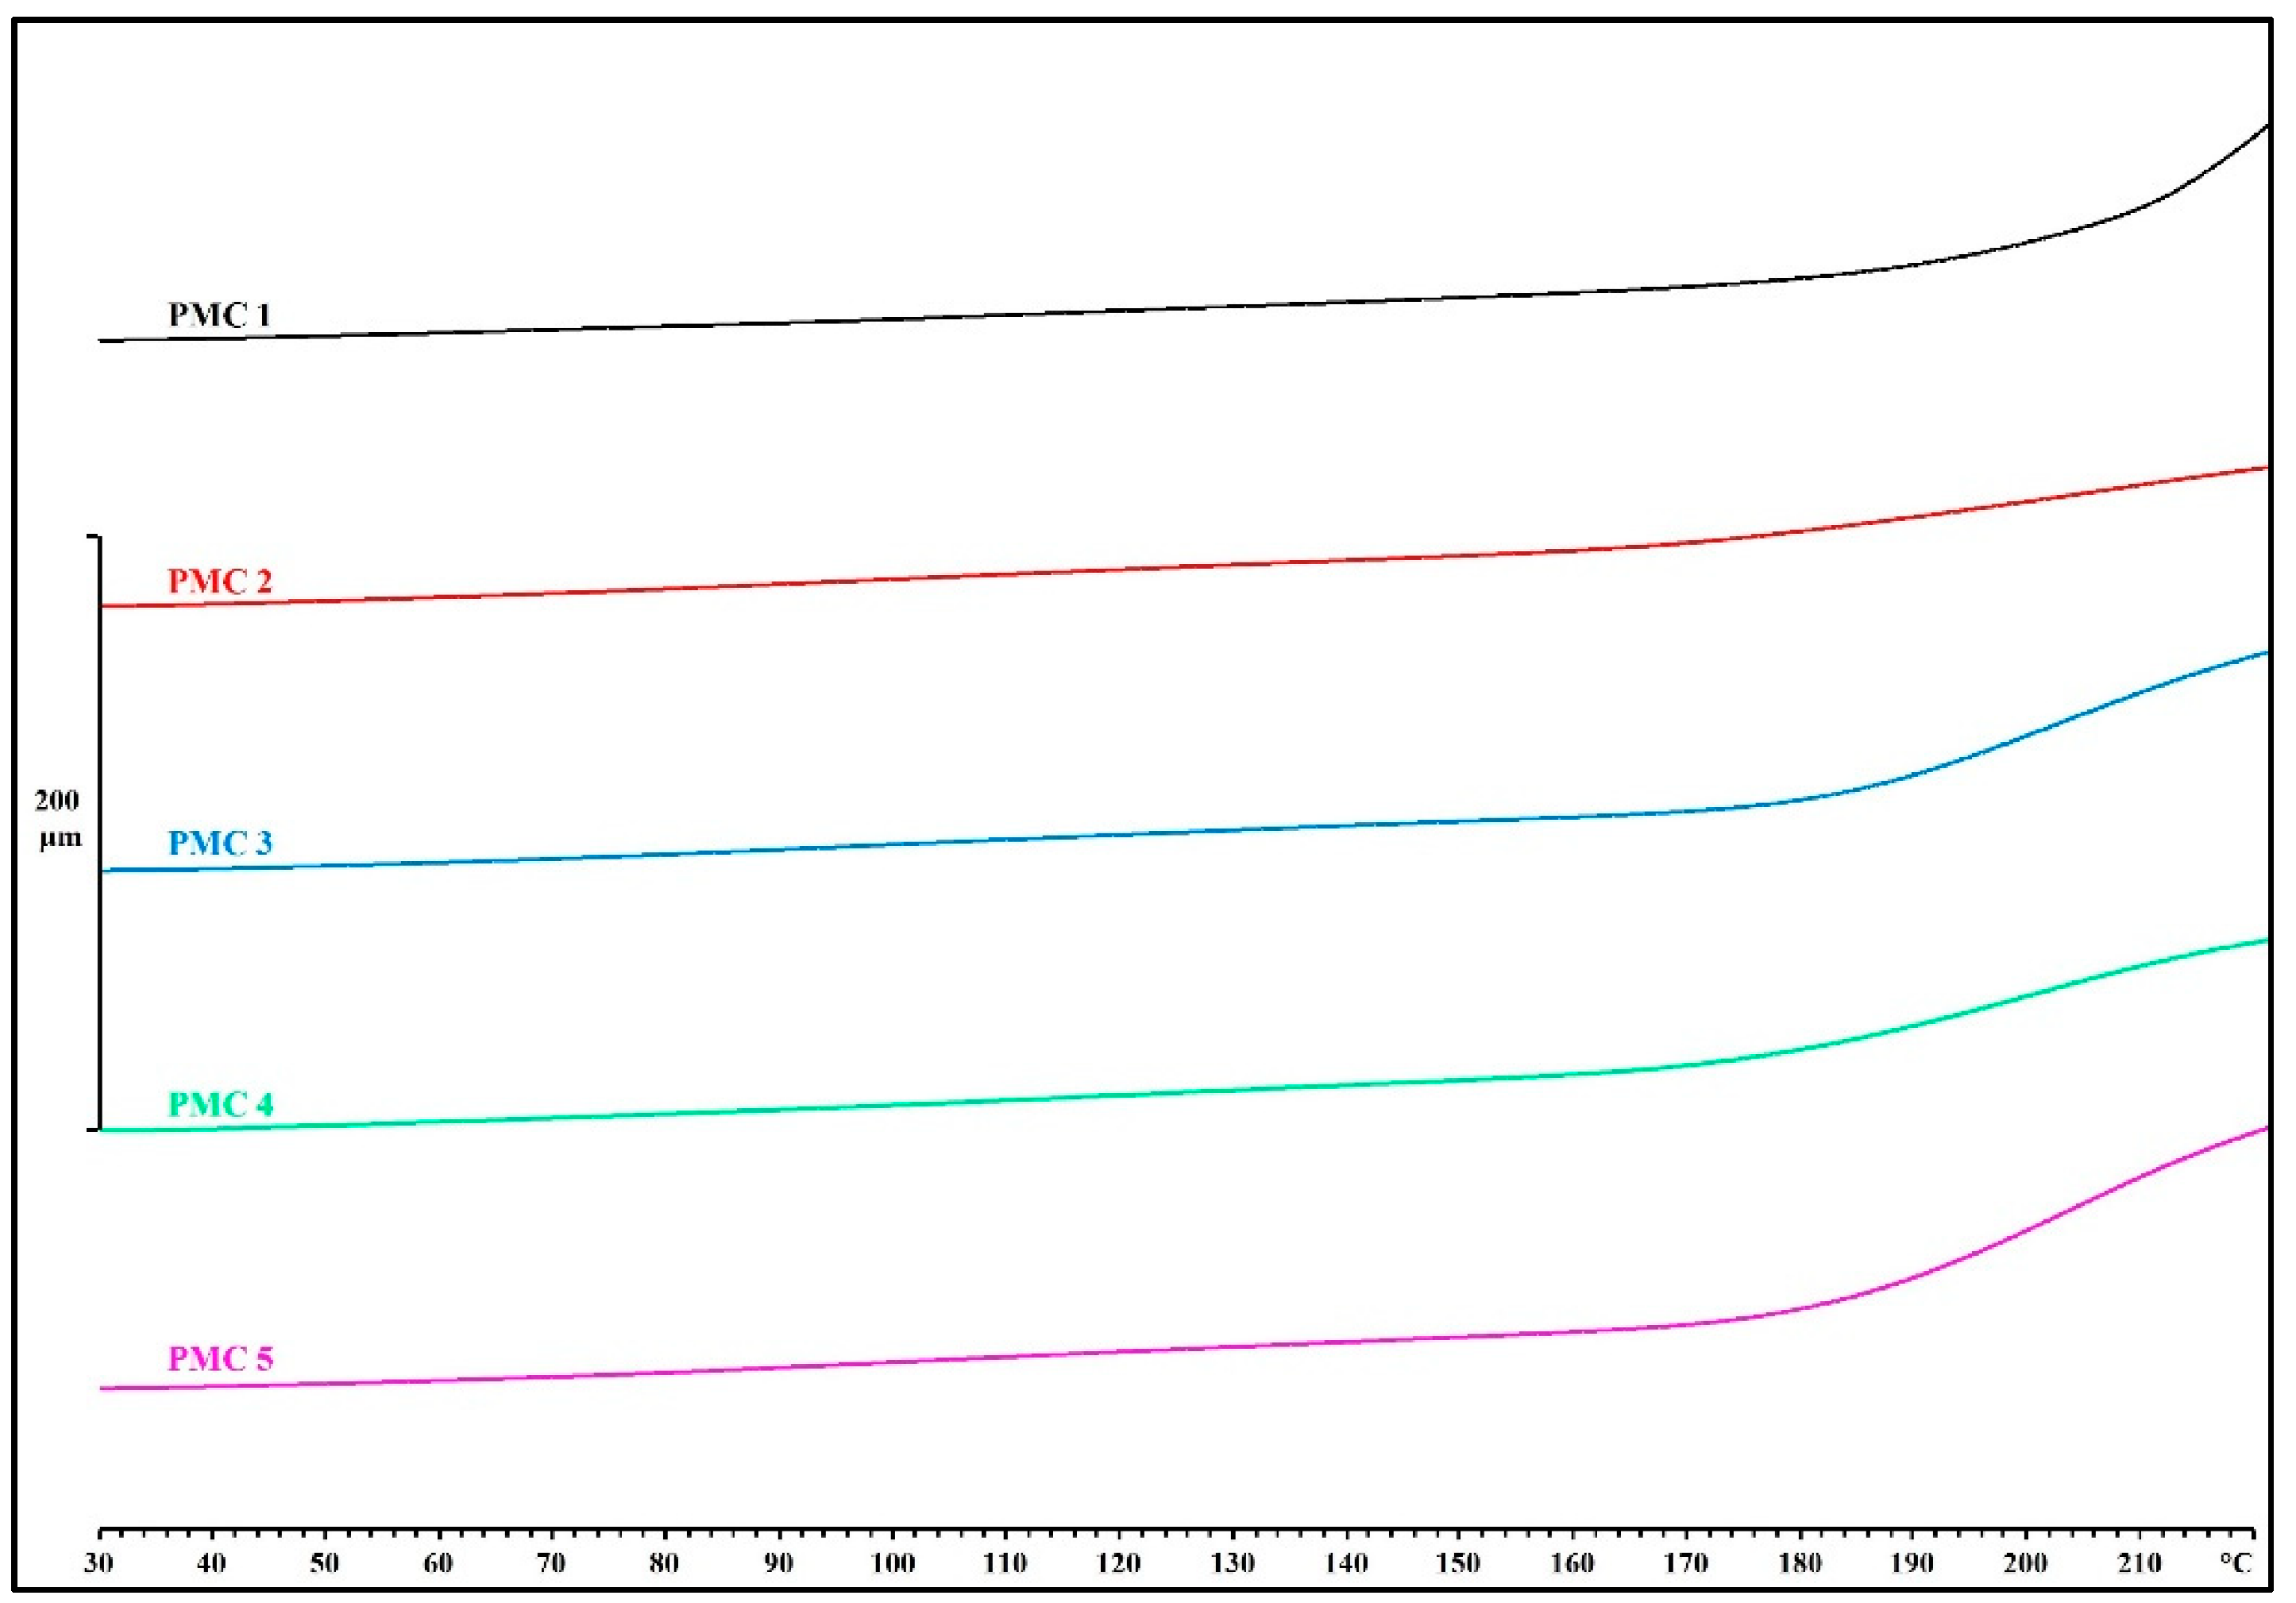
  • Thermogravimetric analysis (TMA): We determined thermal expansion profiles of PMC standard test specimens using a thermomechanical analyzer apparatus (TMA/SDTA840, Mettler Toledo, Greifensee, Switzerland). Standard test specimens were cut to dimensions 10 mm × 10 mm × (3.5 mm ± 0.5 mm) and analyzed at a heating rate of 10 K/min from 30 °C to 400 °C, using a 3.0 mm probe with a flat end (0.05 N force) under air atmosphere.
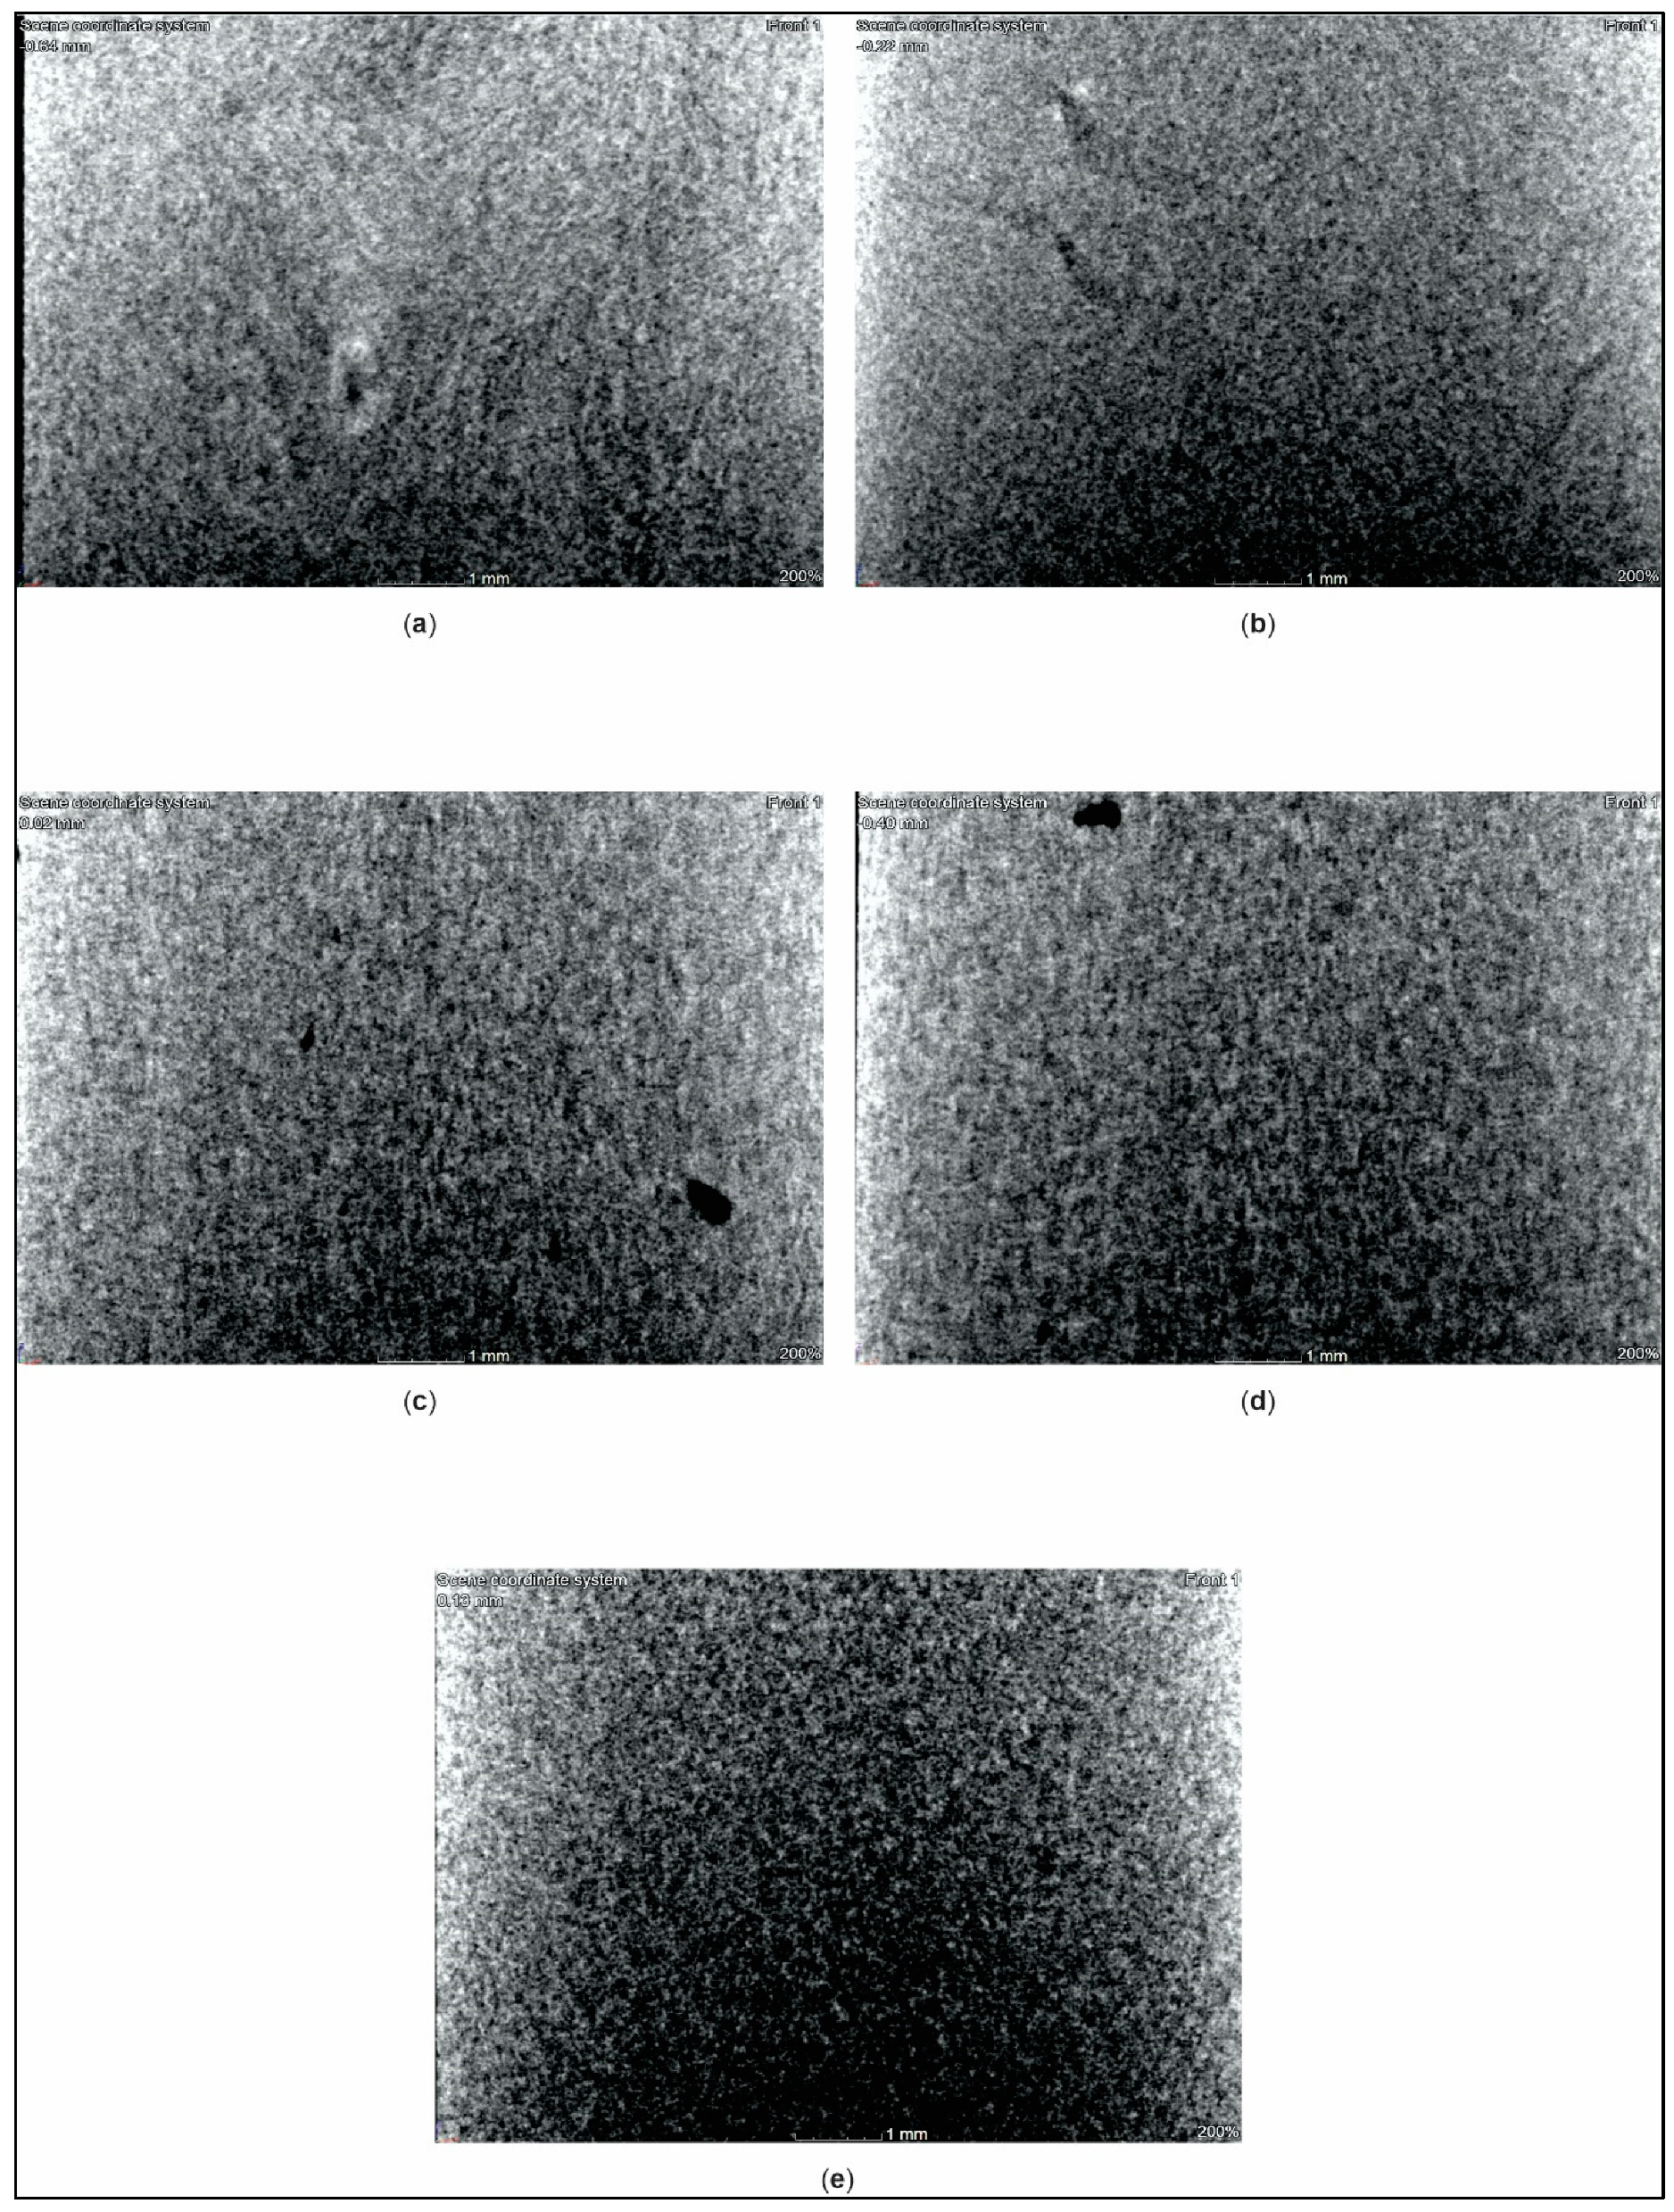
  • X-ray computed tomography (XCT): We determined manufacturing defects in the PMC standard test specimens using an X-ray computed tomography system (phoenix v|tome|x s240 system, General Electric, Boston, United States of America). Standard test specimens were cut to dimensions of 16.0 mm × 10.0 mm × 4.0 mm and scanned at a nano-focus tube voltage of 180 kV with a measurement current of 200 µA.

3. Results and Discussion

3.1. Thermal Analysis

DSC measurements were performed in order to determine glass transition temperatures (Tg), width of the glass transition (ΔTg), and the height of the specific heat capacity step (Δcp) of PFs, and the curing regime of binding systems. The glass transition temperature is the temperature above which the long-range translational motion of the polymer chain segments becomes active. Upon heating to this temperature, the glassy state changes into the rubbery or melt state. Tg was determined with the use of glass transition with enthalpy relaxation evaluation with the ASTM standard method applied. ΔTg is the temperature range from onset to endpoint of glass transition and was calculated using the following equation.
ΔTg = Tendpoint − Tonset
Reaction heat (ΔHc) is defined as the liberated heat accompanying the curing reaction, expressed as heat per mole of reacting groups (kJ/mol) or per mass of material (J/g), as in this study. ΔHc values of the binding systems were determined by integration of the exothermic peak evaluation, presented as the normalized value to negate the influence of different sample masses. Curing temperature range (ΔTc) was defined as the difference in start and end temperatures of the curing reaction and was calculated using the following equation.
ΔTc = ΔTendset − ΔTonset
Figure 2 presents the obtained thermograms of all four PFs. From the DSC thermograms, we observed an apparent endothermal change in the specific heat, representing the glass–rubber transition, accompanied by an endothermic relaxation peak due to PFs being stored for a long time below the glass transition temperature. For PF 1 and PF 2, we detected glass transitions at the temperatures of 48.5 °C and 45.4 °C, with a difference of specific heat capacity of 0.33 J/g∙K and 0.43 J/g∙K, respectively. The highest detected width of glass transition was for PF 2 at 3.2 °C, while the lowest measured width of glass transition was for PF 1 at 1.2 °C. For PF 3 and PF 4, we determined significantly higher glass temperatures—53.8 °C and 61.2 °C, respectively. The differences of specific heat capacity of PF 3 and PF 4 were also distinctly higher, with 0.56 J/g∙K and 0.65 J/g∙K, respectively. The width of glass transition of PF 3 was 2.4 °C and of PF 4 was 1.6 °C. Although the second heating run baseline is more commonly used to determine Tg, due to the specimen being heated well above the Tg to relax the enthalpy which was an excess internal energy in vitrification, it is possible to adequately determine Tg using the baseline from the first heating run. Due to limitations presented by of our Mettler Toledo 823e measuring system set-up (absence of a cryostat), we verified the reproducibility of the results obtained with our measurement system and the analytical method used by performing cross-laboratory examinations with National Institute of Chemistry (KI) in Slovenia. The KI method of examination commenced at −50 °C and concluded at 100 °C; the second heating run was examined and evaluated, yielding comparable results to ours. It is of critical importance to consider the enthalpy relaxation that occurs in combination with glass transition and, consequently, glass transition with enthalpy relaxation evaluation of baselines should be performed. We concluded that our measurement method is a viable alternative of determination of Tg for PF resins.
Table 3 summarizes the glass transition temperatures, widths of the glass transition and the heights of the specific heat capacity step, melt viscosities, flow lengths, and volatile organic compounds of the used PF resins. Melt viscosity and phenolic resin flow distance test measurements were performed to determine the rheological properties and reactivity of the studied PF resins. We detected the melt viscosity of PF 1 at 2834 mPa∙s, which was moderately higher than any of the three other PFs. For PF 2 and PF 3, we determined the lowest melt viscosity values, at 1070 mPa∙s and 1130 mPa∙s, respectively, and for PF 4 we detected a melt viscosity value of 1717 mPa∙s. We observed that the flow distance of PF 4 was the longest flow length (at 100.5 mm), and PF 1 had the shortest flow length (at 78.0 mm). PF 2 and PF 3 had very similar flow lengths, with 87.0 mm and 88.5 mm, respectively.
Volatile organic compounds were measured to determine emission of organic compounds by the PF resins up to 168 °C. The volatile organic compound emissions of PF 2 were significantly higher (at 1.6%) than the rest of the novolac phenolic resins. PF 4 released the least volatile organic compounds (at 0.8%), and PF 1 and PF 3 had similar volatile organic compound emissions at 1.1% and 1.0%, respectively. Considering the information provided by the suppliers (presented in Table 1), we concluded that PF 3 consists of 0.5% to 0.8% adsorbed moisture and PF 4 contains from 0.3% to 0.6% adsorbed moisture. We did not perform adsorbed moisture removal on the PFs prior to the VOC analysis, in order to preserve the same condition of PFs entering the preparation of phenolic molding compound process. For the four tested PF resins, we concluded that flow length and volatile organic compound values were in a reciprocal relationship with each other. This can be explained by water (moisture) acting as a plasticizer (at higher conversions) and contributing to an enhanced final conversion.
Figure 3 demonstrates the results of the DSC analysis for Binding System 1, consisting of PF 1, PF 2, and HMTA, and Binding System 2, consisting of PF 3, PF 4, and HMTA. The DSC thermograms indicated an unexpected difference between glass transition temperatures of Binding Systems 1 and 2, which can be explained by adaptive water on the surface of the PF resins—the finer the particle size of a PF resin, the higher the quantity of water that adsorbs onto its surface. The glass transition temperature of Binding System 1 was higher at 48.2 °C than the glass transition temperature of Binding System 2 at 43.6 °C. The width of glass transition of Binding System 1 (13.0 °C) was also substantially higher than the glass transition width of Binding System 2 (3.2 °C). The specific heat capacity of Binding System 1 (0.18 J/g∙K) was roughly 50% of the specific heat capacity of Binding System 2 (0.32 J/g∙K). We detected an exothermal baseline shift for both binding systems at temperatures from 90 °C to 110 °C. The described phenomena indicate that material compounding processes should operate below the detected transition temperature. The following enthalpy transitions of Binding Systems 1 and 2 originated from the enthalpy transitions of PF resins (presented in Figure 2) and can be explained by the characteristic resin synthesis procedure for each PF resin investigated. The exothermal peak corresponds to the curing reaction (crosslinking) in the binding system. We determined the peak temperature of curing reaction (Tc) of Binding System 1 at 143.6 °C, with reaction heat (ΔHc) −28.4 J/g and curing temperature range (ΔTc) of 13.8 °C (Tonset = 134.6 °C; Tendset = 148.4 °C). For Binding System 2, we detected Tc at 142.4 °C, with ΔHc being −45.1 J/g and ΔTc 19.3 °C (Tonset = 132.5 °C; Tendset = 151.8 °C). Binding System 2 had 58.7% higher ΔHc and 5.5 °C higher ΔTc in comparison to Binding System 1, which is shown in Table 4. The higher ΔTc of Binding System 2 can be explained by PF 3 and PF 4 resins having higher values of flow length, which in combination with melt viscosity values revealed that Binding System 2 was less reactive compared to Binding System 1. The higher ΔTc value of Binding System 2 indicated that resins PF 3 and PF 4 had higher values of Mn compared to PF 1 and PF 2. The lack of significant difference in Tc suggested a similar rate of cure for the two binding systems.

3.2. Chemical Rheological Analysis

The flow-curing behavior plastograms of all the prepared PMC granulates (Figure 4) exemplified the torque variation over time and indicated structural changes in the material. The critical values of the evaluation were the residence time (tV), the reaction time (tR), and the torque minimum (B), which are presented in Table 4 for each tested PMC granulate.
The residence time describes the time from the sample melting to the curing reaction commencement, and is calculated as torque minimum + 10% of the difference between torque maximum and torque minimum. PMC 4 had a 27.0% shorter tV compared to PMC 1, while PMC 2 had the closest tV to PMC 1 (at 10.8% shorter tV).
The reaction time characterizes the time between the loading peak maximum and the greater part of curing reaction being concluded, and is calculated as the time from the start of the measurement to the 80% of the difference between the torque maximum and torque minimum, subtracted by the time between the start of the measurement to the loading peak maximum. PMC 4 had a 19.5% shorter tR compared to PMC 1, and PMC 2 had almost the same tR as PMC 1, with only 2.4% difference. The torque minimum corresponds to the melt viscosity of a molded test sample before the curing reaction. PMC 4 had a 50% higher B in comparison to PMC 1, while PMC 2 had a 12.1% lower B than PMC 1.
The relationships between PMC 2 and PMC 3 were as expected, with PMC 2, compounded at a lower screw speed, exhibiting longer residence time, longer reaction time, and lower torque minimum values in comparison to PMC 3. In the case of PMC 4 and PMC 5, the relationship was contradictory as PMC 4 exhibited shorter residence time, shorter reaction time, and higher torque minimum values in comparison to PMC 5. This can be explained by the longer time of the moisture removal process for PMC 4 (75 min at 90 °C), compared to the moisture removal process of PMC 5 which was 60 min at 90 °C. This modification of the moisture removal process was necessary due to ensure that the VOC value of PMC 4 was adequate.
Volatile organic compound measurement is defined as a quality control method with a specified VOC range for PMC granulates from 2.8 to 3.5%. The volatile organic compounds of the prepared PMC granulates ranged between 3.0% and 3.4%, with PMC 3 having the lowest value at 3.0% and PMC 5 having the highest value at 3.4%. Considering the results in Table 5, we anticipate that the required injection molding pressure would be the lowest for PMC 2 and the highest for PMC 4.

3.3. Mechanical and Thermomechanical Properties

The results of mechanical properties of the PMC standard test specimens are presented in Table 6. The tensile strength, flexural strength, and Charpy impact strength (unnotched) of the PMC 2–5 standard test specimens averaged 73.0%, 48.6% and 33.9%, respectively, higher than PMC 1. The highest measured average tensile strength, flexural strength, and Charpy impact strength was for PMC 2 standard test specimens (averages of 88.7 MPa, 181.6 MPa and 8.3 kJ/m2, respectively), while PMC 1 standard test specimens had the lowest measured averages of 50.3 MPa, 118.4 MPa and 5.9 kJ/m2, respectively. The obtained results show that PMCs with higher minimum torque (higher melt viscosity) require higher injection molding pressure, which results in 6 to 12% lower values of Charpy impact strength. We did not detect a distinct influence of screw speed and material throughput on mechanical properties of the standard test specimens. This behavior can be attributed to the greater influence of virgin PF resins and their weight ratio used on the mechanical properties of the phenolic molding compounds, than the variation of compounding process conditions for this specific study.
The results of thermogravimetric analysis of the PMC standard test specimens are listed in Table 6, and thermograms are provided in Figure 5. The decomposition temperatures (Td) of PMC 2–5 were on average 9% lower than that of PMC 1. The highest measured decomposition temperature detected was for PMC 1 (at 190.7 °C), while the decomposition temperatures of PMC 2–5 ranged from 165.9 °C (PMC 2) to 178.4 °C (PMC 3). The influence of a higher compounding screw speed at both tested material throughputs on decomposition temperature was evident and arose from the lower material retention time, lower material filling level of the extruder, and higher energy input in the composite material through higher shear stress. Given the results, optimization of the compounding process is of great significance, as minor adjustments of the compounding process parameters noticeably improved thermal stability of the standard test specimens from 3.5 to 7.5%.

3.4. X-ray Computed Tomography Analysis

Figure 6 presents X-ray computed tomography scan results of all five PMC standard test specimens. The results showed that the PMC 1 standard test specimen contained the fewest pores, but simultaneously, we detected a less homogenous structure, which was exhibited by the inconsistent distribution of dark (binding system) and illuminated (glass fibers and fillers) regions on Figure 6a. Standard test specimens from PMC 2 and PMC 5 showed more consistency, while the lowest numbers of pores were detected for PMC 2 and PMC 5. Figure 6b exhibits a small resin-rich region in a PMC 2 standard test specimen, while Figure 6c,d represents pores in standard test specimens PMC 3 and PMC 4. Figure 6e does not exhibit any distinctive defect [13,14]. It was concluded that composite granulates with a higher torque minimum, combined with shorter residence and reaction time, require higher injection molding pressure as the melt flow is hindered, which results in the formation of defects in the shape of pores in the standard test specimens.

4. Conclusions

The effects of substitution of phenolic-novolac-resin-based binding system and variation of compounding process temperature in combination with material throughput and screw speed variation on the mechanical and thermal properties of phenolic molding compounds were experimentally investigated in this study. We concluded that irrespective of the compounding process variations, the substituted phenolic-novolac-resin-based composite materials yielded substantially improved mechanical properties. Regardless of the compounding process variations, the initial phenolic-novolac-resin-based composite material provided a higher decomposition temperature. We determined that substituted PMCs prepared at the same compounding temperatures and material throughput but with 20% higher screw speeds gave higher decomposition temperatures. PMC 2 compounded at a lower material throughput and lower screw speed demonstrated a higher homogeneity of injection-molded standard test specimens, while for higher material throughput, higher screw speed resulted in higher homogeneity of injection-molded standard test specimens.
In order to maximize the reduction of power consumption and heat emission during the compounding process, the lowest compounding process temperature, the lowest material throughput, and the lowest screw speed conditions (PMC 2) should be used as reference points for further investigation.
As an outcome, we could ensure that an applied PMC final product with our selection of substitute PF resins is going to present the same qualities as the PMC standard test specimens that were prepared in our work. Further compounding process modifications are required in order to achieve equal or improved thermal stability of the substituted PMCs. Additional tests on injection-molding operations are required to accomplish the optimal scale-up from pilot to industrial production.

Author Contributions

Conceptualization, A.Š. and B.M.; methodology, A.Š.; validation, A.Š. and B.M.; formal analysis, A.Š.; investigation, A.Š.; resources, B.M.; writing—original draft preparation, A.Š.; writing—review and editing, A.Š. and B.M.; visualization, A.Š.; supervision, B.M.; project administration, A.Š. All authors have read and agreed to the published version of the manuscript.

Funding

The research received no external funding.

Acknowledgments

The authors thank Peter Kernel and Dejan Mrak from Kolektor Group d.o.o. for TMA measurements and evaluations and x-ray computed tomography measurements, respectively.

Conflicts of Interest

The authors declare no conflict of interests.

References

  1. Sapuan, S.M. (Ed.) Composite materials. In Composite Materials: Concurrent Engineering Approach, 1st ed.; Butterworth-Heinemann: Oxford, UK, 2017; pp. 57–72. [Google Scholar]
  2. Hirano, K.; Asami, M. Phenolic resins—100 years of progress and their future. React. Funct. Polym. 2013, 73, 256–269. [Google Scholar] [CrossRef]
  3. Gardziella, A.; Pilato, L.A.; Knop, A. Phenolic Resins, 2nd ed.; Springer: Berlin/Heidelberg, Germany; New York, NY, USA, 2000; Volume 2, pp. 24–79. [Google Scholar]
  4. Wan, J.; Wang, S.; Li, C.; Zhou, D.; Chen, J.; Liu, Z.; Yu, L.; Fan, H.; Li, B.-G. Effect of molecular weight and molecular weight distribution on cure reaction of novolac with hexamethylenetetramine and properties of related composites. Thermochimica Acta 2012, 530, 32–41. [Google Scholar] [CrossRef]
  5. Mikhailin, Y.A.; Kerber, M.L.; Gorbunova, I.Y. Binders for polymer composites. P. Curtis (translation). Int. Polym. Sci. Technol. 2002, 29, 49–61. [Google Scholar] [CrossRef]
  6. Kalyon, D.M.; Hallouch, M. Compounding of Thermosets in Continuous Kneaders. Adv. Polym. Technol. 1986, 3, 237–249. [Google Scholar] [CrossRef]
  7. Števulová, N.; Schwarzova, I.; Hospodarova, V.; Junak, J.; Ondova, M.; Vaclavik, V. Possibilities of Using Alternative Materials as a Substitute Binder or Filler into Composites. Adv. Mater. Res. 2015, 1105, 31–35. [Google Scholar] [CrossRef]
  8. Ribeiro, M.C.S.; Meira-Castro, A.C.; Silva, F.G.; Santos, J.; Meixedo, J.P.; Fiúza, A.; Dinis, M.L.; Alvim, M.R. Re-use assessment of thermoset composite wastes as aggregate and filler replacement for concrete-polymer composite materials: A case study regarding GFRP pultrusion wastes. Resour. Conserv. Recycl. 2015, 104 Pt B, 417–426. [Google Scholar] [CrossRef] [Green Version]
  9. Liaw, J.H.; Hsueh, T.Y.; Tan, T.-S.; Wang, Y.; Chiao, S.-M. Twin-screw compounding of poly (methyl methacrylate)/clay nanocomposites: Effects of compounding temperature and matrix molecular weight. Polym. Int. 2007, 56, 1045–1052. [Google Scholar] [CrossRef]
  10. Williams, C.K.; Hillmyer, M.C. Polymers from Renewable Resources: A Perspective for a Special Issue of Polymer Reviews. Polym. Rev. 2008, 48, 1–10. [Google Scholar] [CrossRef]
  11. Elemans, P.H.M. Continuous equipment simulation—Co-kneader. In Mixing and Compounding of Polymers, 2nd ed.; Manas-Zloczower, I., Ed.; Carl Hanser Verlag: Munich, Germany, 2009; Volume 1, pp. 419–450. [Google Scholar]
  12. Saba, N.; Jawaid, M.; Sultan, M.T.H. An overview of mechanical and physical testing of composite materials. In Mechanical and Physical Testing of Biocomposites, Fibre-Reinforced Composites and Hybrid Composites, 1st ed.; Jawaid, M., Thariq, M., Saba, N., Eds.; Woodhead Publishing: Duxford, UK, 2019; Volume 1, pp. 1–12. [Google Scholar]
  13. Kastner, J.; Plank, B.; Salaberger, D.; Sekelja, J. Defect and porosity determination of fibre reinforced polymers by X-ray computed tomography. In Proceedings of the 2nd International Symposium on NDT in Aerospace, Hamburg, Germany, 22–24 November 2010. [Google Scholar]
  14. Garcea, S.C.; Wang, Y.; Withers, P.J. X-ray computed tomography for polymer composites. Compos. Sci. Technol. 2018, 156, 305–319. [Google Scholar] [CrossRef]
Figure 1. Stages of preparation process of phenolic-novolac-resin-based composite material.
Processes 08 00625 g001
Figure 2. Differential scanning calorimetry (DSC) thermograms of the four studied PF resins.
Processes 08 00625 g002
Figure 3. Differential scanning calorimetry (DSC) thermograms of both studied binding systems.
Processes 08 00625 g003
Figure 4. Flow-curing behavior of granulates from phenolic molding compound 1 (PMC 1) to phenolic molding compound 5 (PMC 5).
Processes 08 00625 g004
Figure 5. Thermomechanical (TMA) thermograms of standard test specimens from PMC 1 to PMC 5.
Processes 08 00625 g005
Figure 6. X-ray computed tomography scans of standard test specimens PMC 1 (a), PMC 2 (b), PMC 3 (c), PMC 4 (d), and PMC 5 (e).
Processes 08 00625 g006
Table 1. Information of molecular weight (Mw), molecular weight distribution (Mn), polydispersity index (Mw/Mn), and free phenol content of phenol-formaldehyde (PF) resins.
PF Resin MarkMw (Da)Mn (Da)Mw/MnFree Phenol Content
PF 1n.a.n.a.n.a.n.a.
PF 2n.a.n.a.n.a.0.44
PF 3 1190010001.90.20–0.50
PF 4190010001.90.20–0.50
1 Resin PF 3 contained 1–3% organic acid as curing accelerator.
Table 2. Compounding process temperature, material throughput, and screw-speed variations for prepared phenolic molding compound (PMC) granulates.
Phenolic Molding CompoundCompounding Process Temperature (°C)Material Throughput (kg/h)Screw Speed (rpm)
PMC 1862555
PMC 2802044
PMC 3802053
PMC 4832555
PMC 5832566
Table 3. Glass transition temperature (Tg), glass transition width (ΔTg), delta specific heat capacity (Δcp), melt viscosity, flow length, and volatile organic compounds (VOC) of studied PF resins.
PF Resin MarkTg (°C)ΔTg (°C)Δcp (J/g∙K)Melt Viscosity (mPa∙s)Flow Length
(mm)
VOC
(%)
PF 148.51.20.33283487.01.1
PF 245.43.20.43107078.01.6
PF 353.82.40.56113088.51.0
PF 461.21.60.651717100.50.8
Table 4. Glass transition temperature, glass transition width, delta specific heat capacity, curing temperature (Tc), curing temperature range (ΔTc), and reaction heat (ΔHc) of Binding Systems 1 and 2.
Binding System MarkTg (°C)ΔTg (°C)Δcp (J/g∙K)Tc (°C)ΔTc (°C)ΔHc (J/g)
Binding System 148.213.00.18143.613.8−28.40
Binding System 243.63.20.32142.419.3−45.06
Table 5. Evaluations of torque rheometer plastograms and volatile organic compound measurements for each PMC granulate.
Phenolic Molding CompositeResidence Time
(s)
Reaction Time
(s)
Torque Minimum
(Nm)
VOC (%)
PMC 137825.83.1
PMC 233845.13.2
PMC 329728.33.0
PMC 427668.73.1
PMC 530776.63.4
Table 6. Thermal and mechanical properties of PMC standard test specimens.
Standard Test SpecimenTd (°C)Tensile Strength (MPa)Flexural Strength (MPa)Charpy Impact Strength (Unnotched) (kJ/m2)
PMC 1190.750.3 ± 2.5118.4 ± 16.05.9 ± 1.7
PMC 2165.988.7 ± 7.7181.6 ± 5.98.3 ± 0.8
PMC 3178.485.7 ± 4.5175.0 ± 7.57.3 ± 1.0
PMC 4171.686.0 ± 2.3173.2 ± 8.17.8 ± 1.0
PMC 5177.787.7 ± 5.8174.0 ± 3.68.2 ± 0.5

