Article

Treatment of Landfill Leachate Using Palm Oil Mill Effluent

by
Tawfiq J. H. Banch
1,
Marlia M. Hanafiah
1,2,*,
Salem S. Abu Amr
3,
Abbas F. M. Alkarkhi
3 and
Mohammed Hasan
1
1
Department of Earth Sciences and Environment, Faculty of Science and Technology, Universiti Kebangsaan Malaysia, Bangi 43600, Selangor, Malaysia
2
Centre for Tropical Climate Change System, Institute of Climate Change, Universiti Kebangsaan Malaysia, Bangi 43600, Selangor, Malaysia
3
Universiti Kuala Lumpur Business School (Unikl bis), Kuala Lumpur 50250, Malaysia
*
Author to whom correspondence should be addressed.
Processes 2020, 8(5), 601; https://doi.org/10.3390/pr8050601
Submission received: 18 April 2020 / Revised: 5 May 2020 / Accepted: 14 May 2020 / Published: 18 May 2020
(This article belongs to the Special Issue Applications of Biosorption in Wastewater Treatment)

Abstract

:
Sanitary landfilling is the most common method of removing urban solid waste in developing countries. Landfills contain high levels of organic materials, ammonia, and heavy metals, thereby producing leachate which causes a possible future pollution of ground and surface water. Recently, agricultural waste was considered a co-substratum to promote the biodegradation of organics in industrial wastewater. The use of low-cost and natural materials for wastewater treatment is now being considered by many researchers. In this study, palm oil mill effluent (POME) was used for treating stabilized leachate from old landfill. A set of preliminary experiments using different POME/leachate ratios and aeration times was performed to identify the setting of experimental design and optimize the effect of employing POME on four responses: chemical oxygen demand (COD), total suspended solids (TSS), color, and ammoniacal nitrogen (NH3-N). The treatment efficiency was evaluated based on the removal of four selected (responses) parameters. The optimum removal efficiency for COD, TSS, color, and NH3-N was 87.15%, 65.54%, 52.78%, and 91.75%, respectively, using a POME/leachate mixing ratio of 188.32 mL/811.68 mL and 21 days of aeration time. The results demonstrate that POME-based agricultural waste can be effectively employed for organic removal from leachate.

1. Introduction

The landfilling of solid waste is still a significant problem in the solid waste management systems of all countries worldwide [1,2]. However, landfill leachate is a complex liquid generated from rainwater penetration through landfills that often includes high-strength contaminant resistance, such as humic acids, ammonia nitrogen, heavy metals, xenobiotics, and inorganic salts, which are important to avoid due to their adverse effects on the environment [3,4]. The factors that affect the composition of landfill leachate include the composition of waste, the level of compaction, the absorptive capacity of solid waste and age of solid waste, weather variations, precipitation, landfilling temperature, size of landfilling, hydrogeological conditions, factors of the landfill operation, pH, and chemical and biological activities in the process of landfilling [5,6]. In general, young leachate produced from new landfills (<5 years old) has a large biodegradation of comparatively low-molecular-weight materials, such as volatile organic acids, chemical oxygen demand (COD), total organic carbon (TOC), biological oxygen demand (BOD5), and biodegradability (BOD5/COD) [7]. On the other hand, old leachate (>10 years old) has high organic content of relatively high-molecular-weight materials, for instance, humic and fulvic substances that are refractory and not rapidly degradable. Generally, old leachate has a lower concentration of COD, TOC, BOD5, and BOD5/COD [6,7]. Leachate is stabilized and has low biodegradability since most landfills are old [8,9,10,11]. As a landfill gets older, a change from a relatively shorter initial aerobic to a longer anaerobic decomposition period takes place. Due to the biological breakdown of organic compounds and precipitation of soluble components, such as heavy metals, the strength of leachate generally lowers over time. Because of its biodegradable nature, organic compounds decrease faster than inorganic compounds with the increasing age of leachate production.
Several treatment techniques, such as physico-chemical processes, are used to treat leachate (coagulation precipitation, activated carbon adsorption [12,13], membrane filtration, activated carbon adsorption [14,15], and/or other separation techniques) [16], in addition to biological treatment methods, such as aerobic and anaerobic processes. In the past two decades, many studies reported that biological processes in the treatment of young leachate are effective but are comparatively insufficient in the treatment of old leachate because of the existence of bio-refractory substances [6,7]. Currently used procedures often involve mixed methods intended as modular or multi-stage units that are capable of treating pollutants that change in concentration over time. The appropriate treatment of leachate is applied to enhance and develop an appropriate technique of treatment that meets the relevant quality standards and regulations [5].
In particular, the palm oil sector in Malaysia adopts four types of treatment technologies: waste stabilization ponds, activated sludge systems, closed anaerobic digesters, and land application systems [17]. However, many questions remain unanswered about the cost of treatment, the production of sludge, and chemical residues in treated wastewater. Usage of low-cost and natural materials of wastewater treatment are currently gaining increased attention from a series of studies. Palm oil mill effluent (POME) is classified as a pollutant which is known for its ability to enhance the biodegradability of pollutants due to the relatively high content of organic matter [18,19]. An aeration process supplies the oxygen to the wastewater and acts as an oxidation of organics. Moreover, oxygen can also enhance the biodegradation of organics by bacteria which use oxygen to break down the organic matter into the form of CO2 and H2O [20]. Stripping of ammonia is a simple desorption method utilized to reduce the ammonia concentration of leachate. Ammonia reacts with water to form ammonium hydroxide [21], as shown in Equation (1).
NH4+ + OH−* ↔ H2O +NH3*.
The alkaline wastewater flows downward when the air enters through the bottle. As the air continues to flow, the wastewater moves in the opposite direction and ascends to the top of the aeration bottle. NH3 is stripped from dropping water droplets into the air flow, and then released into the atmosphere [22]. In this research, the effectiveness of aeration processes used in the treatment of a leachate/POME mixture was evaluated. The optimum experimental conditions for POME dosages were designed, and the ability to remove the different medicines was studied. In addition, the efficacy of POME in the leachate removal of heavy metals was also investigated. The removal of heavy metals by POME during aeration may be attributed to the high level of suspended solids in POME, which may act as a natural coagulant [23].

2. Methodology

2.1. Collection of the Samples and Landfill Characteristics

Samples of leachate were sampled from the Ampar Tenang Closed Landfill Site (ATCL). ATCL is situated nearly 40 km southwest of Kuala Lumpur, Malaysia at a latitude of 02°48.9250 north (N) and a longitude of 101°4.9330 east (E) [23]. ATCL is mostly surrounded by oil palm plantations. Labu River flows along the landfill 300 m away. The ATCL area is characterized as tropical. The average temperature is 27.2 °C, and the average rainfall is 2287 mm/year [24]. The landfill site is located on the eastern sector of the confined alluvial aquifer of the Langat Basin, composed primarily of silt (50%–70%), clay (<25%), and sand (<25%) [25,26,27]. This site is more clayey close to the surface of the ground, but changes to sandy in lower layers [25,26]. ATCL operated as of 1994 for a total of 15 years. About 100 tons of waste are dumped into this site every day during the operation of the landfill. This results in the on-site disposal of a total of half a million tons of solid waste. The site was completely closed in 2010. Before it was closed, it was converted to sanitary classification (Level 1) from a disposal site (Level 0) [8,27,28]. In 2018, the samples were manually collected and placed in 1000-mL containers manufactured from polyethylene. The samples were collected at 4 °C and immediately transformed to prevent significant biological degradation and chemical reactions. The samples were transported in a preservation refrigerator from the site to the laboratory before being stored in the laboratory refrigerator until the next day where the experiment was prepared; no acids were used for preservation.

2.2. Leachate and POME Characterizations

The physico-chemical characterization of the leachate is presented in Table 1.
The physico-chemical characterization of the POME is presented in Table 2.

2.3. Experimental Procedure

A bubble column bioreactor was used for the aeration process. It is characterized by its simple construction, higher efficiency in removal, and efficient control of the liquid residence time [31]. The aeration process was conducted at room temperature (25 °C). In the aeration process, the air pump is connected to four bottles of one liter each by a tube of 1 mm in diameter; these bottles contain different ratios of leachate/POME, and the process continues for 21 days.
The experiment was conducted in two steps; the first step was a preliminary experiment performed utilizing one factor at a time to determine the area of concern for each influential variable of the leachate/POME ratio and the aeration time to determine the optimal levels. The selected levels for the leachate/POME ratio and the aeration time were utilized to conduct the second step utilizing response surface methodology (RSM). RSM consists of a group of experimental methods devoted to estimating the relationship between a group of experimental variables (factors) and the (targeted) measured responses. To build a more practical model, the process variables under investigation need to be understood. Central composite face-centered (CCF), a type of central composite design (CCD), was used for two independent variables to estimate the effect value of POME dosages and aeration time on four response variables: COD, TSS, color, and NH3-N.

2.4. Effect of the Leachate/POME Ratio

For the first step, POME was used to improve the biodegradation of leachate. In 1000 mL of leachate samples, different leachate/POME ratios (1:0, 0.9:0.1, 0.7:0.3, and 0.5:0.50) were used. The initial pH for the leachate sample (8.4) was left unadjusted. The liquid was aerated using an aeration bump (HAILEA) model V-20 with output 20 L/min and pressure >0.02 MPa for 24 days. The treatment efficiency was evaluated based on COD, TSS, color, and NH3-N removal efficiency.
The efficiency for COD removal was estimated using Equation (2).
COD Removal (%) = [(Cr − Ck)/Ci] × 100,
where Cr is the initial COD concentration, and Ck is the final COD concentration.

2.5. Optimization of Treatment Efficiencies of Targeted Parameters

Using Design-Expert software (version 6.0.7), a central composite design (CCD) for the leachate/POME ratio was developed to examine whether COD, TSS, color, and NH3-N affected the leachate/POME ratio and aeration time. Depending on the preliminary experiments stated in Section 2.3, the amounts and rates of each factor were chosen. Thirteen experiments were conducted to include all possible combinations of the leachate/POME ratio and aeration time.
Data from different CCD experiments were utilized to appropriate a polynomial model and a second-order model (Equation (3)).
Y = β 0 + j = 1 k β j X j + j = 1 k β j j x 2 j + i < j = 2 k β i j X i X j + e i
where Y is the response, Xi and Xj are the variables, β is the regression coefficient, k is the number of variables tested and optimized in this experiment, and e is the random error. A p-value less than 0.05 was reported as significant.

Analytical Work

The chemical oxygen demand (COD), pH, biochemical oxygen demand (BOD5), electrical conductivity (EC), total suspended solids (TSS), ammoniacal nitrogen (NH3-N), and heavy metals (magnesium (Mg2+), calcium (Ca2+), iron (Fe2+), zinc (Zn2+), copper (Cu2+), chromium (Cr2+), cadmium (Cd2+), lead (Pb2+), arsenic (As3+), cobalt (Co2+), and manganese (Mn2+)) were tested before and after each aeration run. The level of BOD5 was estimated utilizing Method 5210B. The DO was tested utilizing a DO meter (model 1000, YSI Inc., Greene County, OH, USA). COD concentration was tested utilizing the closed reflux colorimetric method (5220B—DR2500 HACH, Loveland, CO, USA). Color was determined using the DR 2800 HACH spectrophotometer at 455 nm wavelength.
A portable digital pH/mV meter (model inoLab pH 720, WTW, Weilheim, Germany) was used to measure the pH and EC. TSS was determined utilizing method 2540D, dried at 103–105 °C, which included the following procedure: preparation of filter disc, selection of filter type and sample volume, analysis of samples, and calculation of Equation (4) (APHA 2012) [31].
TSS mg/L = [(A − B) mg/(V) mL,
where A is the weight of filter-dried residue (mg), B is the weight of the filter, and V is the sample volume.
NH3-N level was determined using the phenate method (4500-NH3 F) utilizing a DR2500 spectrophotometer at 640 nm. Heavy metals were measured using atomic absorption spectroscopy (Unicam 929 AA Spectrophotometer, UNICO, Franksville, WI, USA). All physico-chemical parameters and heavy metals were measured according to standard methods for examining water and wastewater [32]. Different leachate/POME ratios (1:0, 0.9:0.1, 0.7:0.3, and 0.5:0.50) were prepared in 1000-mL bottles to investigate the removal efficiency of targeted parameters.

3. Results and Discussion

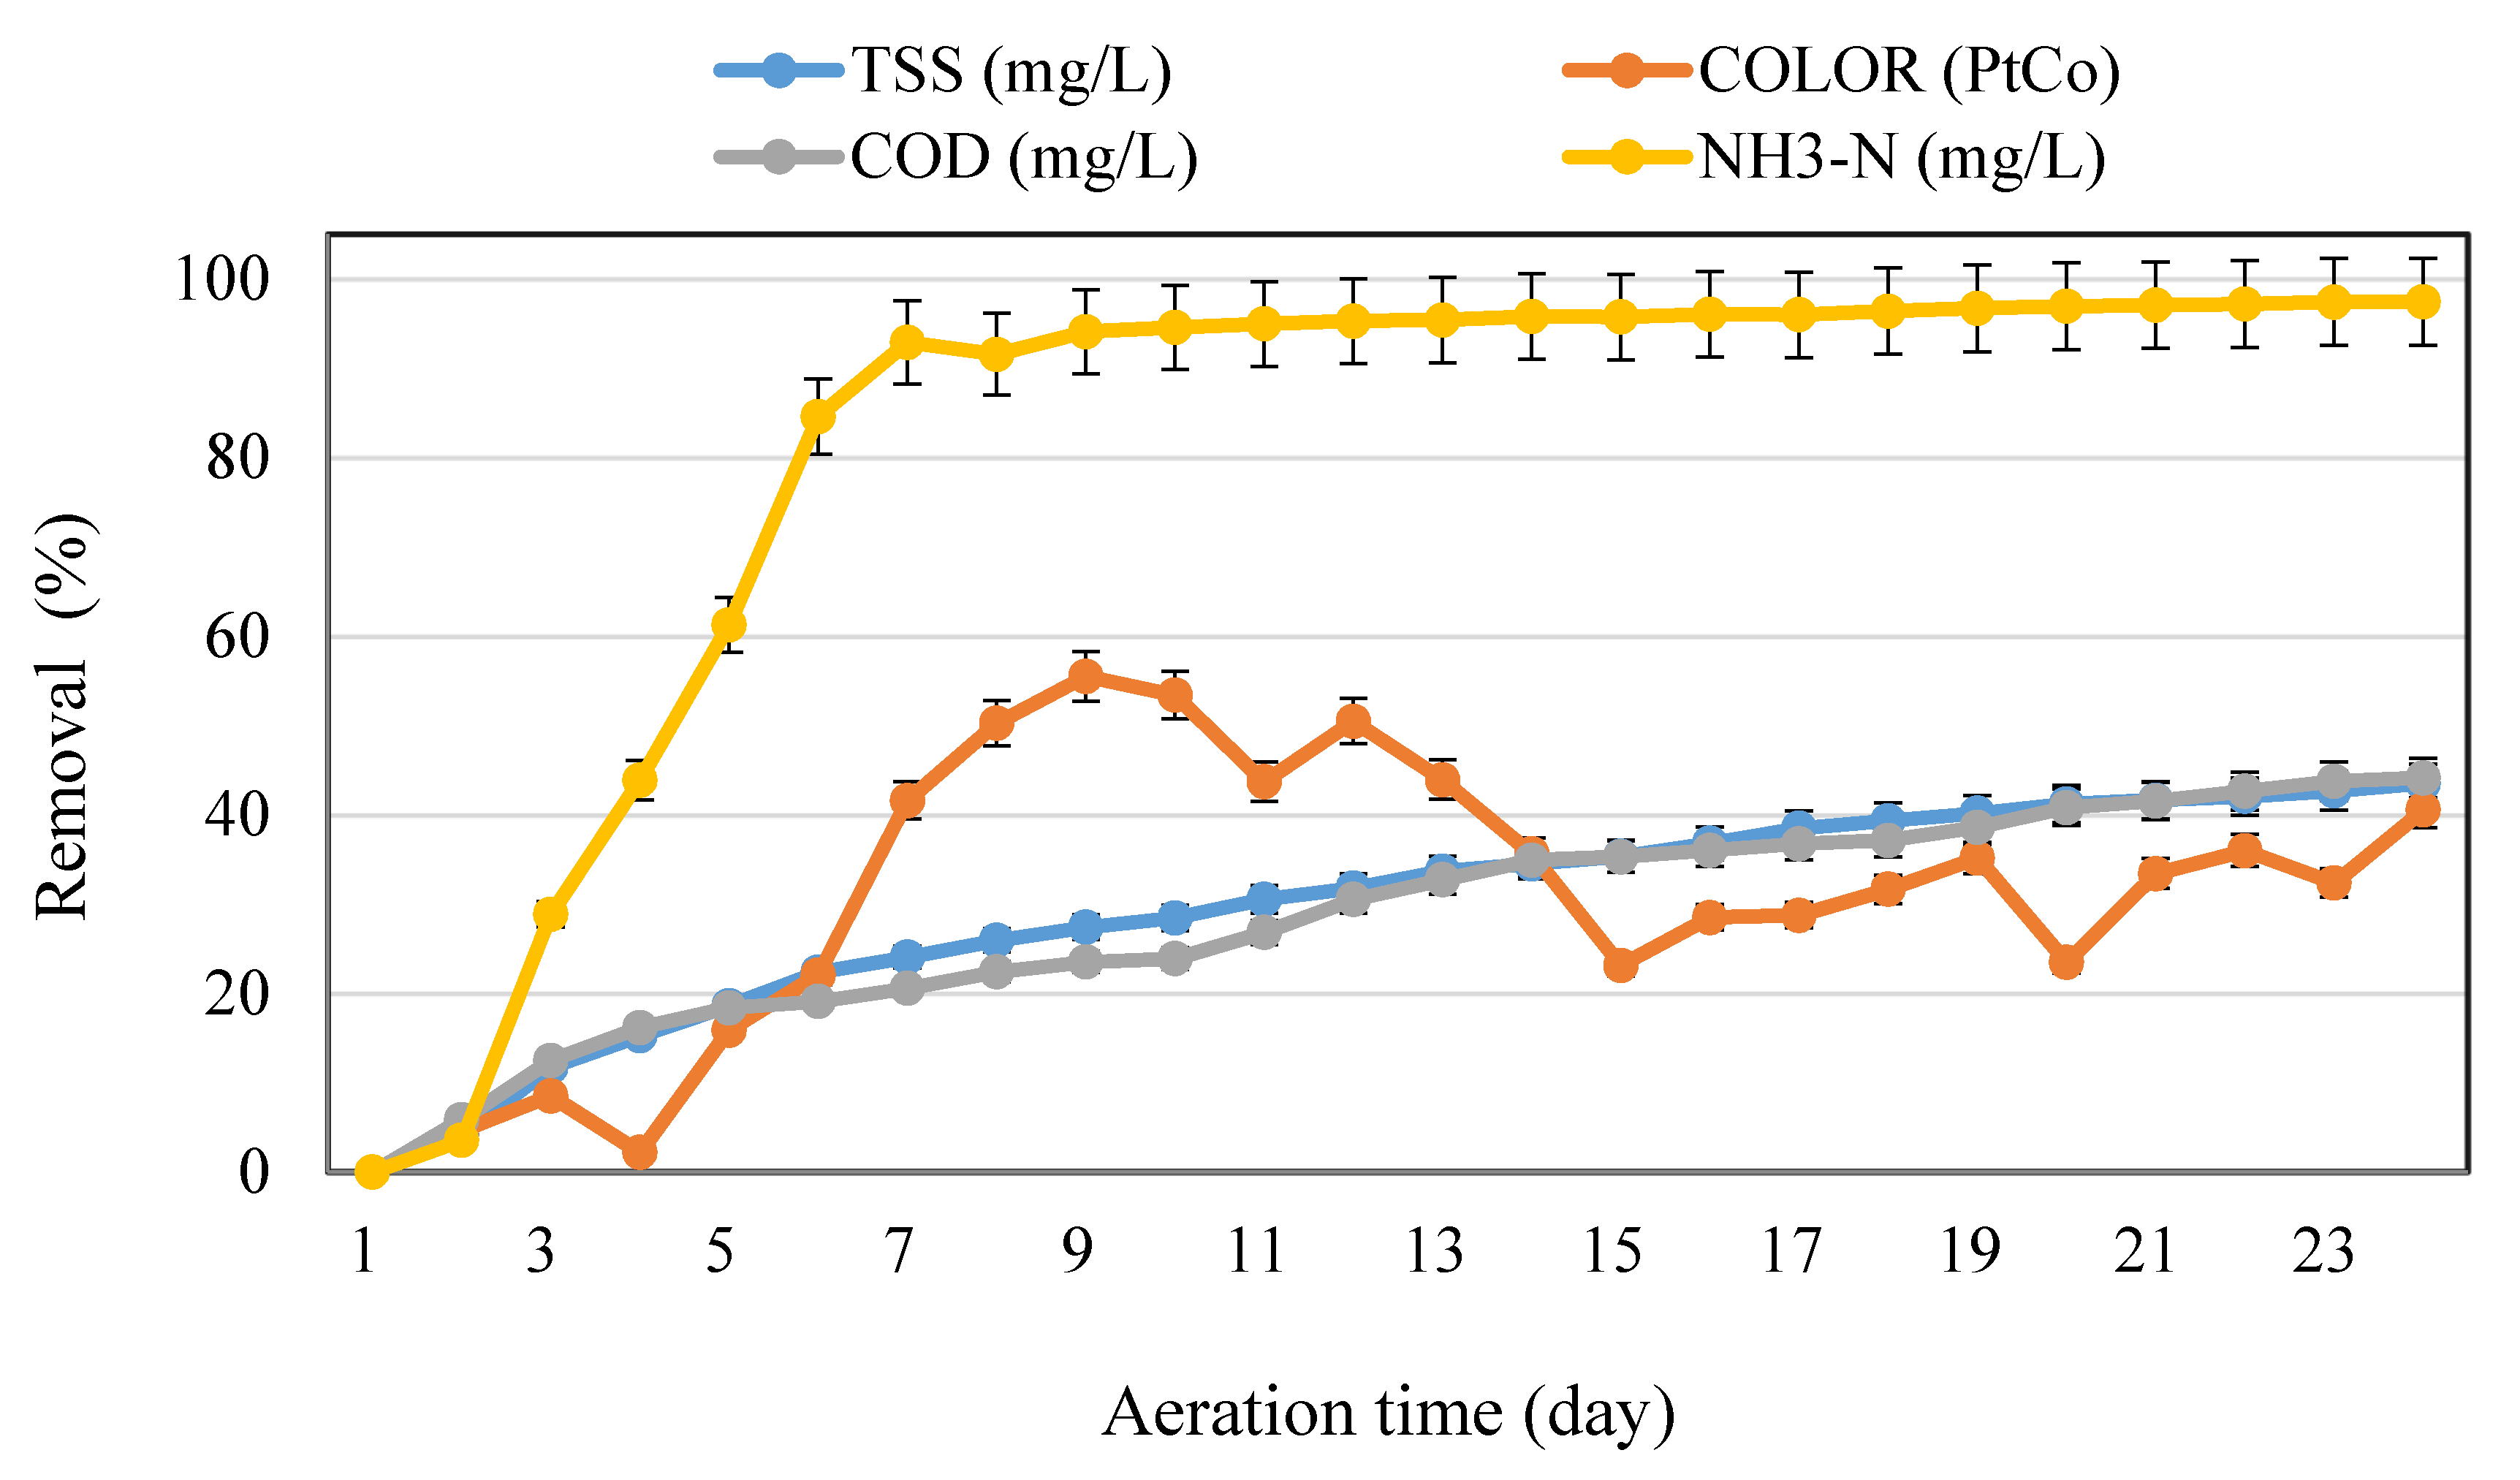
3.1. Effects of Aeration Time Variation on the Removal Efficiency during the Aeration Process of Leachate Treatment

The maximum removal efficiencies in only leachate aeration for COD, TSS, color, and NH3-N reached 44.12%, 43.5%, 55%, and 97%. Figure 1 shows the removal efficiency influenced by the time of reaction for the targeted parameters. The removal efficiencies of both COD and TSS increased slightly in the same way. However, the increased color removal efficiency was characterized by fluctuation, as shown on Figure 1, while the removal efficiency of NH3-N increased sharply in the first week of aeration, reaching 93% on the seventh day; it did not demonstrate a further marked increase in removal efficiency, reaching 97% by the 24th day. This is in line with many studies reporting that NH3-N can be removed under the effect of the gas stripping process during aeration [21], while the removal is significantly improved with aeration time increasing up to a specific point [33] due to the reaction of NH3 with water, as shown in Equation (5).
NH3 + H2O ↔ NH4 + + OH.
From Equation (5), increasing the pH due to the formation of OH will increase the concentration of NH3. The increase in pH enhances the ammonia stripping during aeration [21] and enhances the removal of ammonia, after which, owing to the recarbonation of lime in leachate, the pH begins to decline by absorbing CO2 from the ambient air [34].

3.2. Effects of Reaction Time Variation on the Removal Efficiency during the Aeration Time of Leachate/POME Treatment (Ratio 900 mL Leachate/100 mL POME)

In this stage, the effect of the reaction time on leachate with a ratio of 900 mL leachate/100 mL POME was investigated during the aeration time. The optimum reaction time was reached on the 24th day of aeration, and the maximum removal efficiencies for COD, TSS, color, and NH3-N reached 91%, 54%, 50%, and 98%, respectively. All targeted parameters increased as the aeration time increased (Figure 2).

3.3. Effects of Reaction Time Variation on the Removal Efficiency during the Aeration Time of Leachate/POME Treatment (Ratio 700 mL Leachate/300 mL POME)

In this stage, the effects of reaction time variation on the removal efficiency during the aeration time of leachate/POME treatment with a constant ratio (700 mL leachate/300 mL POME) were investigated for the targeted parameters under the same condition of natural pH and an aeration power of 20 mL/min. The results showed an increase in the removal efficiency of all targeted parameters. The maximum removal of NH3-N, COD, TSS, and color was 96%, 89%, 53%, and 41%, respectively. As shown in Figure 3, there was a higher removal efficiency for NH3-N than COD, but color showed the lowest removal efficiency.

3.4. Effects of Reaction Time Variation on the Removal Efficiency during the Aeration Time of Leachate/POME Treatment (Ratio 500 mL Leachate/500 mL POME)

As shown in Figure 4, the ratio between leachate and POME was 500 mL/500 mL. The effect of reaction time variation on the removal efficiency during the aeration time for targeted parameters was investigated with the same conditions for the other ratios (natural pH, aeration power 20 L/min). The maximum removal efficiencies for COD, TSS, color, and NH3-N were 89%, 21%, 42%, and 94%. The removal efficiency of NH3-N increased sharply in the first 10 days of aeration, reaching 90%, and it did not demonstrate a further marked increase in removal efficiency, reaching 94% by the 24th day.

3.5. Effects of the Leachate/POME Mixing Ratio on the Leachate Aeration Process

The treatment of leachate was implemented using POME in four ratios (leachate only, 900 mL leachate/100 mL POME, 700 mL leachate/300 mL POME, and 500 mL leachate/500 mL POME) with a natural pH and an aeration power of 20 L/min. Accordingly, a limited removal efficiency of COD (43%) was found when treating leachate without any POME dosages. As shown in Figure 5, adding 100 mL, 300 mL, and 500 mL of POME improved the removal efficiency of COD (COD removal of 85%, 88%, and 88%, respectively).
The results of the removal efficiencies for the targeted parameters using several dosages (leachate only, 900 mL leachate/100 mL POME, 700 mL leachate/300 mL POME, and 500 mL leachate/500 mL POME) are illustrated in Figure 5. The maximum removal efficiency was NH3-N, reaching 97% during the aeration process for leachate only and 900 mL leachate/100 mL POME, while the maximum removal for COD reached 88% (700 mL leachate/300 mL POME and 500 mL leachate/500 mL POME ratios). The lowest removal was 51% for TSS, followed by 52% for color for the 700 mL leachate/300 mL POME ratio.

3.6. Analysis of Variance

One of the key objectives of the RSM is to calculate the best value for the control variables that can maximize or minimize a response over a particular area of concern. A good-fitting model is defined to provide a proper representation of the mean response to achieve the optimum value [34]. A total of 13 experiments with different dosages (leachate/POME) and reaction times at room temperature (28 °C) were performed using central composite design (CCD); the outcomes were analyzed using analysis of variance (ANOVA), as shown in Table 3. The POME dosage used to treat stabilized leachate was evaluated in terms of its effectiveness in the removal of COD, TSS, color, and NH3-N.
The coefficient of determination (R2) for COD, TSS, color, and NH3-N was 0.9927, 0.8218, 0.9854, and 0.991, respectively. This mean that the models are good in Equations (6)–(9) due to the coefficient of determination being high and close to 1 (Table 4). Prior to the data analysis, the assumption of normality should be tested. The assumption of normality showed that the data roughly fit a bell-shaped curve for all responses, as presented in Figure 6.
COD removal = +80.18 + 25.81 × A + 8.60 × B − 19.97 × A2 − 4.00 × B2 − 0.98 × A × B;
TSS removal = +49.93 + 4.32 × A + 15.76 × B − 6.39 × A2 − 0.089 × B2 + 1.02 × A × B;
Color removal = +45.74 + 1.35 × A + 16.14 × B − 17.50 × A2 − 7.62 × B2 + 1.20 × A × B;
NH3-N removal = +97.24 − 3.05 × A + 6.72 × B − 1.06 × A2 − 5.17 × B2 + 1.92 × A × B.
The two variables, POME dosage and aeration time, displayed an important impact (p-value < 0.05) for the linear and quadratic models on the targeted factors of COD, color, and NH3-N, as shown in Table 4 for the ANOVA results. On the other hand, a higher-order model like a third-order polynomial model or more complicated model can be used to improve the model for TSS removal.
In addition, the p-values for the interaction effect were 0.4607, 0.7681, and 0.1294 for the removal efficiency of COD, TSS, and color. In other words, the interaction effect between POME dosage and aeration time was insignificant (p-value > 0.05) for the removal efficiency of COD, TSS, and color. That implies that the two factors function independently. Conversely, the p-value (0.0013) for the interaction effect was significant for NH3-N removal efficiency. Figure 7 shows the interaction between the two (variables) factors (POME dosage and aeration time) and their behaviors in terms of removal of the targeted parameters (COD, TSS, color, and NH3-N). The p-values for lack of fit were 0.8314, 0.0523, and 0.0647, which indicates that the lack of fit was insignificant (p-value > 0.05), which means that the model is appropriate for the removal efficiency of COD, color, and NH3-N, while the p-value for lack of fit was significant (p-value < 0.05) for TSS removal efficiency, indicating the model is not appropriate.
The impact of POME dosage and aeration time on the selected responses is illustrated in Figure 8. The descriptions for the behavior of each response for POME dosage and aeration time are shown as the surface of a three-dimensional plot for the maximization of the four targeted responses (COD, TSS, color, and NH3-N) (Figure 8). All response plots demonstrate clear peaks, suggesting that the maximum area of impact is well known with the selected boundaries of the POME dosage and aeration time.

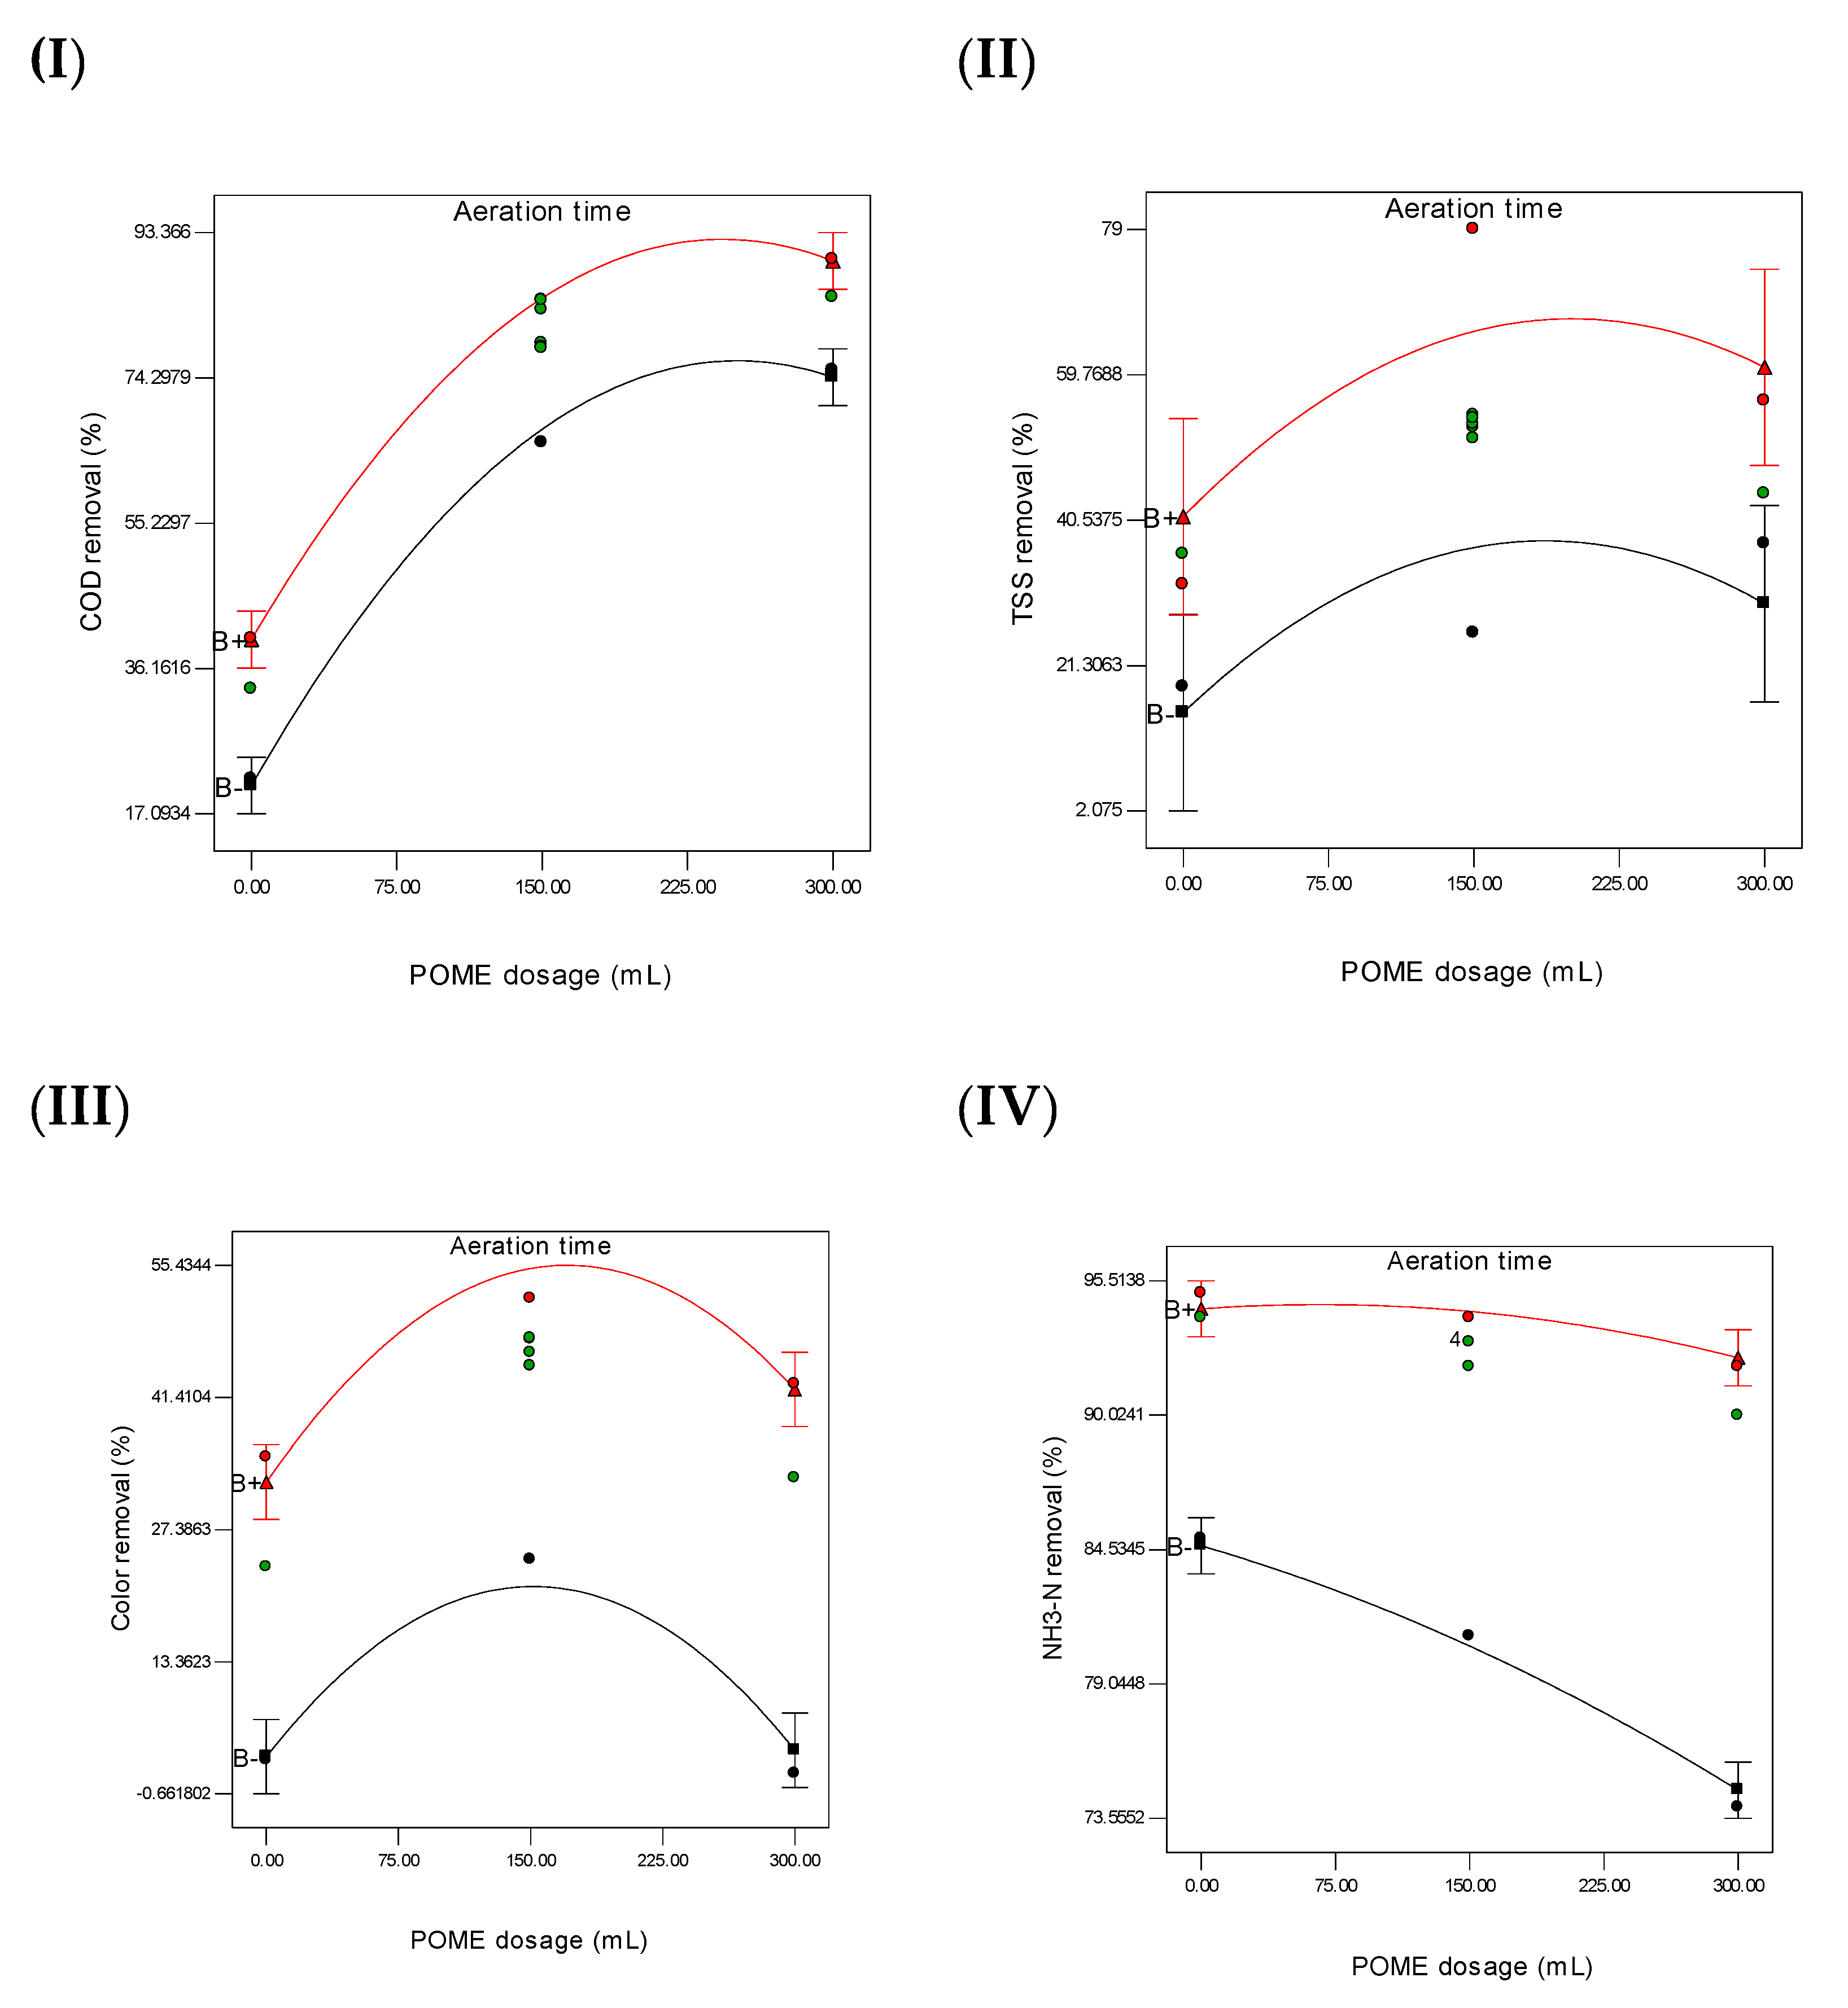
3.7. Optimization of Leachate Treatment Using POME

Design-Expert 6.0.7 software offers strong tools for setting up an optimal experiment of the treatment process to identify the optimum value of removal efficiency for COD, TSS, color, and NH3-N. In accordance with the approach of software optimization, the required target was within the range for each experimental condition (POME dosage and aeration time). To obtain the highest output, the responses (COD, TSS, color, and NH3-N) were described as a maximum value. The program incorporates individual desirability into a single number and then searches on the basis of the response target to optimize this feature. The optimum conditions and respective percentage removal efficiencies were established, and the COD (89.83%), TSS (66.7%), color (91.7%), and NH3-N (94%) removal results are illustrated in Table 5 The desirability function for these optimum conditions was recorded as 0.935. Additional experiments under optimal conditions were performed to verify agreement with the outcome experiments from models and the experiments. The results from the laboratory experiment were 87.51%, 65.62%, 53.10%, and 91.8% for the removal of COD, TSS, color, and NH3-N, respectively (Table 5). There was close agreement between the removal efficiencies for all response parameters gained from the experiments and those estimated by models. These results are more efficient than the result of Banch et al. [8], who conducted tests for the same parameters except for color. Tatsi et al. [35] achieved a color removal of about 100% for partially stabilized leachate. However, the reported residuals for COD, TSS, color, and NH3-N were recorded as 430 mg/L, 1620 mg/L, 1780 Pt-Co, and 66 mg/L, respectively, which are still higher than the effluent discharge limits.

3.8. Heavy Metal Analysis

The removal efficiency of targeted heavy metals from stabilized leachate was evaluated under the achieved optimum experimental conditions, and the results are given in Table 6. The removal efficiency for the targeted heavy metals ranged between 99.00% (Cd2+) and 6.85% (As3+). The order of residuals of heavy metals in leachate was Fe2+ > Mn2+ > As3+ > Zn2+ > Cr2+ > Cu2+ > Co2+ > Pb+ > Cd2+ from highest to lowest concentration. The heavy metal residuals were 1856, 31.72, 16.15, 10.76, 2.80, 1.28, 0.53, 0.28, and 0.23 µg/L for Fe2+, Mn2+, As3+, Zn2+, Cr2+, Cu2+, Co2+, Pb+, and Cd2+, respectively, while the removal efficiency was 90.73%, 34.75%, 6.85%, 96.16%, 93.78%, 96.95%, 95.24%, 93.30%, and 99.00% respectively. Only the concentration of Mn2+ existed out of the limits, while the other targeted heavy metals were within the limits. The removal of heavy metals is attributed to the high level of suspended solids and metal complexes in POME which may act as a natural coagulant. The suspended solids and metal complexes improve the charged exchange and accelerated the adsorption and deposition of dissolved heavy metals in wastewater [36,37,38,39,40]. This study showed more efficient removal than Banch et al. [8] for Fe2+, As3+, Zn2+, Cr2+, Cu2+, Co2+, and Cd2+.

4. Conclusions

The current work evaluated the use of POME as an agro-industrial waste for landfill leachate treatment. Biological treatment using an aeration process for different mixing ratios between leachate and POME was performed. The optimization of the removal efficiencies for COD, TSS, color, and NH3-N for the aeration treatment process of old leachate was investigated in this study. The optimum operational conditions were obtained at 188.32 mL of POME added to 1 L of leachate for 21 days of aeration time. The respective percentage removal efficiencies were 89.83%, 66.7%, 91.7%, and 94% for COD, TSS, color, and NH3-N. Moreover, the treatment process reported an efficient removal of some heavy metals from landfill leachate. The results revealed that POME-based agricultural waste can be effectively used for organic removal from stabilized leachate.

Author Contributions

Formal analysis, T.J.H.B.; writing—original draft preparation, T.J.H.B.; writing—review and editing, M.M.H., S.S.A.A., A.F.M.A., and M.H.; supervision, M.M.H. and S.S.A.A.; funding acquisition, M.M.H. All authors read and agreed to the published version of the manuscript.

Funding

This research was partly funded by UKM research grants (DIP-2019-001 and MI-2020-005).

Acknowledgments

Marlia M. Hanafiah was supported by the Ministry of Education Malaysia (FRGS/1/2018/WAB05/UKM/02/2) and a UKM research grant (DIP-2019-001).

Conflicts of Interest

The authors declare no conflict of interest.

References

  1. Gu, Z.; Chen, W.; Li, Q.; Zhang, A. Treatment of semi-aerobic aged-refuse biofilter effluent from treating landfill leachate with the Fenton method. Process. Saf. Environ. Prot. 2020, 133, 32–40. [Google Scholar] [CrossRef]
  2. Guvenc, S.Y. Optimization of COD removal from leachate nanofiltration concentrate using H2O2/Fe+2/heat-activated persulfate oxidation process. Process. Saf. Environ. Prot. 2019, 126, 7–17. [Google Scholar] [CrossRef]
  3. Renou, S.; Givaudan, J.; Poulain, S.; Dirassouyan, F.; Moulin, P. Landfill leachate treatment: Review and opportunity. J. Hazard. Mater. 2008, 150, 468–493. [Google Scholar] [CrossRef] [PubMed]
  4. Shalini, S.S.; Joseph, K.J. Nitrogen management in landfill leachate: Application of SHARON, ANAMMOX and combined SHARON–ANAMMOX process. Waste Manag. 2012, 32, 2385–2400. [Google Scholar] [CrossRef] [PubMed]
  5. Abdulhasan, M.J.; Hanafiah, M.M.; Satchet, M.S.; Abdulaali, H.S.; Toriman, M.E.; AlRaad, A.A. Combining GIS, fuzzy logic and AHP models for solid waste disposal site selection in Nasiriyah, Iraq. Appl. Ecol. Environ. Res. 2019, 17, 6701–6722. [Google Scholar] [CrossRef]
  6. Adhikari, B.; Dahal, K.R.; Khanal, S.N. A review of factors affecting the composition of municipal solid waste landfill leachate. Int. J. Eng. Sci. Innov. Technol. 2014, 3, 272–281. [Google Scholar]
  7. Hermosilla, D.; Cortijo, M.; Huang, C. Optimizing the treatment of landfill leachate by conventional Fenton and photo-Fenton processes. Sci. Total Environ. 2009, 407, 3473–3481. [Google Scholar] [CrossRef]
  8. Banch, T.J.; Hanafiah, M.M.; Alkarkhi, A.F.; Salem, A.M. Factorial design and optimization of landfill leachate treatment using tannin-based natural coagulant. Polymers 2019, 11, 1349. [Google Scholar] [CrossRef] [Green Version]
  9. Banch, T.J.; Hanafiah, M.M.; Alkarkhi, A.F.; Salem, A.M. Statistical evaluation of landfill leachate system and its impact on groundwater and surface water in Malaysia. Sains Malays. 2019, 48, 2391–2403. [Google Scholar] [CrossRef]
  10. Banch, T.J.; Hanafiah, M.M.; Alkarkhi, A.F.; Salem, A.M.; Nizam, N.U. Evaluation of different treatment processes for landfill leachate using low-cost agro-industrial materials. Processes 2020, 8, 111. [Google Scholar] [CrossRef] [Green Version]
  11. Maslahati Roudi, A.; Chelliapan, S.; Wan Mohtar, W.; Kamyab, H. Prediction and optimization of the fenton process for the treatment of landfill leachate using an artificial neural network. Water 2018, 10, 595. [Google Scholar] [CrossRef] [Green Version]
  12. Amr, S.S.A.; Aziz, H.A.; Adlan, M.N.J. Optimization of stabilized leachate treatment using ozone/persulfate in the advanced oxidation process. Waste Manag. 2013, 33, 1434–1441. [Google Scholar] [CrossRef] [PubMed]
  13. Rada, E.; Istrate, I.; Ragazzi, M.; Andreottola, G.; Torretta, V. Analysis of electro-oxidation suitability for landfill leachate treatment through an experimental study. Sustainability 2013, 5, 3960–3975. [Google Scholar] [CrossRef] [Green Version]
  14. Bashir, M.J.; Aziz, H.A.; Amr, S.S.A.; Sethupathi, S.A.P.; Ng, C.A.; Lim, J. The competency of various applied strategies in treating tropical municipal landfill leachate. Desalin. Water Treat. 2015, 54, 2382–2395. [Google Scholar] [CrossRef]
  15. Mojiri, A. Review on membrane bioreactor, ion exchange and adsorption methods for landfill leachate treatment. Aust. J. Basic Appl. Sci. 2011, 5, 1365–1370. [Google Scholar]
  16. Mussa, Z.H.; Othman, M.R.; Abdullah, M.P. Electrochemical oxidation of landfill leachate: Investigation of operational parameters and kinetics using graphite-PVC composite electrode as anode. J. Braz. Chem. Soc. 2015, 26, 939–948. [Google Scholar] [CrossRef]
  17. Aziz, N.I.H.A.; Hanafiah, M.M. Life cycle analysis of biogas production from anaerobic digestion of palm oil mill effluent. Renew. Energy 2020, 145, 847–857. [Google Scholar] [CrossRef]
  18. Aziz, N.I.H.A.; Hanafiah, M.M.; Ali, M.Y. Sustainable biogas production from agrowaste and effluents—A promising step for small-scale industry income. Renew. Energy 2019, 132, 363–369. [Google Scholar] [CrossRef]
  19. Ma, W.; Han, Y.; Ma, W.; Han, H.; Zhu, H.; Xu, C.; Li, K.; Wang, D. Enhanced nitrogen removal from coal gasification wastewater by simultaneous nitrification and denitrification (SND) in an oxygen-limited aeration sequencing batch biofilm reactor. Bioresour. Technol. 2017, 244, 84–91. [Google Scholar] [CrossRef]
  20. Aziz, N.I.H.A.; Hanafiah, M.M.; Gheewala, S. A review on life cycle assessment of biogas production: Challenges and future perspectives in Malaysia. Biomass Bioenergy 2019, 122, 361–374. [Google Scholar] [CrossRef]
  21. Hao, Y.J.; Ji, M.; Chen, Y.X.; Wu, W.X.; Hao, Y.J.; Zhang, S.G.; Liu, H.Q. The pathway of in-situ ammonium removal from aerated municipal solid waste bioreactor: Nitrification/denitrification or air stripping? Waste Manag. Res. 2010, 28, 1057–1064. [Google Scholar] [CrossRef] [PubMed]
  22. Daud, Z.; Awang, H. Integrated Leachate Treatment Technology. In Waste Management: Concepts, Methodologies, Tools, and Applications; IGI Global: Hershey, PA, USA, 2020; pp. 204–220. [Google Scholar]
  23. Jagaba, A.H.; Latiff, A.A.; Latiff, A.; Umaru, I.; Abubakar, S.; Lawal, I. Treatment of Palm Oil Mill Effluent (POME) by Coagulation-Flocculation using Different Natural and Chemical Coagulants: A Review. IOSR J. Mech. Civ. Eng. 2016, 13, 67–75. [Google Scholar]
  24. Mohamed, A.F.; Yaacob, W.W.; Taha, M.R.; Samsudin, A.R. Groundwater and soil vulnerability in the Langat Basin Malaysia. Eur. J. Sci. Res. 2009, 27, 628–635. [Google Scholar]
  25. Hanafiah, M.M.; Yussof, M.K.M.; Hasan, M.; AbdulHasan, M.J.; Toriman, M.E. Water quality assessment of Tekala River, Selangor, Malaysia. Appl. Ecol. Environ. Res. 2018, 16, 5157–5174. [Google Scholar] [CrossRef]
  26. Thaldiri, N.H.; Hanafiah, M.M.; Halim, A.A. Effect of modified micro-sand, poly-aluminium chloride and cationic polymer on coagulation-flocculation process of landfill leachate. Environ. Ecosyst. Sci. 2017, 1, 17–19. [Google Scholar] [CrossRef]
  27. Banch, T.J.H.; Hanafiah, M.M.; Amr, S.S.A.; Ashraf, M.A. Characterization of leachate from Ampar Tenang closed landfill site, Selangor, Malaysia. AIP Conf. Proc. 2019, 2111, 060009. [Google Scholar]
  28. Yusoff, I.; Alias, Y.; Yusof, M.; Ashraf, M.A. Assessment of pollutants migration at Ampar Tenang landfill site, Selangor, Malaysia. Sci. Asia 2013, 39, 392–409. [Google Scholar] [CrossRef]
  29. US Environmental Protection Agency. Effluent Limitations Guidelines, Pretreatment Standards and New Source Performance Standards for the Landfills Point Source Category. 2000. Available online: https://www.federalregister.gov/documents/2000/01/19/00–1037/effluent-limitations-guidelines-pretreatment-standards-and-new-sourceperformance-standards-for-the (accessed on 7 January 2020).
  30. Environmental Quality (Control of Pollution from Solid Waste Transfer Station and Landfill) Regulations Malaysia; FAO: Rome, Italy, 2009.
  31. APHA-American Public Health Association. 2540 Solids, 2540-D Total Suspended Solids Dried at 103–105 °C; Alpha Analytical, Inc.: Holmes, PA, USA, 2012. [Google Scholar]
  32. US Environmental Protection Agency. Standard Methods for the Examination of Water and Wastewater; American Public Health Association: Washington, DC, USA, 2005; Volume 2.
  33. Feron, P. (Ed.) Absorption-Based Post-Combustion Capture of Carbon Dioxide; Woodhead Publishing: Cambridge, UK, 2016. [Google Scholar]
  34. Bonmatı, A.; Flotats, X. Air stripping of ammonia from pig slurry: Characterisation and feasibility as a pre-or post-treatment to mesophilic anaerobic digestion. Waste Manag. 2003, 23, 261–272. [Google Scholar] [CrossRef]
  35. Tatsi, A.A.; Zouboulis, A.I.; Matis, K.A.; Samaras, P. Coagulation–flocculation pretreatment of sanitary landfill leachates. Chemosphere 2003, 53, 737–744. [Google Scholar] [CrossRef]
  36. Ashraf, M.A.; Balkhair, K.S.; Chowdhury, A.J.K.; Hanafiah, M.M. Treatment of Taman Beringin landfill leachate using the column technique. Desalin. Water Treat. 2019, 149, 370–387. [Google Scholar] [CrossRef]
  37. Manikam, M.K.; Halim, A.A.; Hanafiah, M.M.; Krishnamoorthy, R.R. Removal of ammonia nitrogen, nitrate, phosphorus and COD from sewage wastewater using palm oil boiler ash composite adsorbent. Desalin. Water Treat. 2019, 149, 23–30. [Google Scholar] [CrossRef] [Green Version]
  38. Hanafiah, M.M.; Zainuddin, M.F.; Nizam, N.U.M.; Rasool, A. Phytoremediation of Aluminium and Iron from Industrial Wastewater Using Ipomoea aquatica and Centella asiatica. Appl. Sci. 2020, 10, 3064. [Google Scholar] [CrossRef]
  39. Nizam, N.U.M.; Hanafiah, M.M.; Noor, I.M.; Karim, H.I.A. Efficiency of five selected aquatic plants in phytoremediation of aquaculture wastewater. Appl. Sci. 2020, 10, 1–11. [Google Scholar]
  40. Asman, N.S.; Halim, A.A.; Hanafiah, M.M.; Ariffin, F.D. Determination of rainwater quality from rainwater harvesting system at Ungku Omar College, UKM Bangi. Sains Malays. 2017, 46, 1211–1219. [Google Scholar] [CrossRef]
Figure 1. Effects of reaction time variation on COD, TSS, color, and NH3-N removal efficiency (with natural pH, leachate only, aeration 20 L/min).
Processes 08 00601 g001
Figure 2. Effects of reaction time variation on COD, TSS, color, and NH3-N removal efficiency (with natural pH, leachate/POME (900 mL leachate/100 mL POME), aeration power 20 L/min).
Processes 08 00601 g002
Figure 3. Effects of reaction time variation on COD, TSS, color, and NH3-N removal efficiency (with natural pH, leachate/POME (700 mL leachate/300 mL POME), aeration power 20L/min).
Processes 08 00601 g003
Figure 4. Effects of reaction time variation on COD, TSS, color, and NH3-N removal efficiency (with natural pH, leachate/POME (500 mL leachate/500 mL POME), aeration power 20 L/min).
Processes 08 00601 g004
Figure 5. Effect of the leachate/POME ratios on COD, TSS, color, and NH3-N removal efficiency after 24 days of mixing aeration (with natural pH, aeration power 20 L/min).
Processes 08 00601 g005
Figure 6. Normal probability plots for (I) COD, (II) TSS, (III) color, and (IV) NH3-N removal.
Processes 08 00601 g006
Figure 7. The impact of the POME dose combination and the aeration time for the removal of (I) COD, (II) TSS, (III) color, and (IV) NH3-N.
Processes 08 00601 g007
Figure 8. Response surface plot for (I) COD, (II) TSS, (III) color, and (IV) NH3-N removal.
Processes 08 00601 g008
Table 1. Physico-chemical characteristics and heavy metals of leachate.
ParameterMean and Standard Deviation(USEPA *; DOE **)
pH7.88 ± 0.506–9 **
EC (µS/cm)6565 ± 3241400 *
TDS (mg/L)4671 ± 1741000 *
TSS (mg/L)40.45 ± 850 **
COD (mg/L)893.41 ± 202400 **
BOD5 (mg/L)59.20 ± 1020 **
NH3-N (mg/L)530.7 ± 225 **
DO (mg/L)5.43 ± 25 *
Mg2+ (mg/L)19.72 ± 40.2 *
Ca2+ (mg/L)39.72 ± 340.1 *
Na+ (mg/L)638.80 ± 3030.02 **
Fe2+ (mg/L)0.78 ± 0.65 **
Zn2+ (µg/L)280 ± 162 **
Cu2+ (µg/L)41.87 ± 240.2 **
Cr2+ (µg/L)45.11 ± 170.01 **
Cd2+ (µg/L)0.62 ± 0.70.01 **
Pb+ (µg/L)4.18 ± 2.70.01 **
As3+ (µg/L)17.3 ± 70.05 **
Co2+ (µg/L)11.05 ± 80.05 *
Mn2+ (µg/L)61.40 ± 490.02 **
* [29], ** [30]. Abbreviation. EC: electrical conductivity; TDS: total dissolved solids; TSS: total suspended solids; COD: chemical oxygen demand; BOD5: biochemical oxygen demand; NH3-N: ammoniacal nitrogen; DO: dissolved oxygen; USEPA: U.S. Environmental Protection Agency; DOE: Department of Environment.
Table 2. Physico-chemical characteristics and heavy metals of palm oil mill effluent (POME).
ParameterMean and Standard Deviation(Standard of DOE *)
pH4.40 ± 0.015.0–9.0
EC (µS/cm)8553 ± 114100
Salinity (ppt)4.9 ± 0NA
TDS (mg/L)5713 ± 15NA
TSS (mg/L)3483 ± 76200
Color (Pt/Co)5517 ± 104100
COD (mg/L)17,400 ± 100NA
BOD5 (mg/L)1243 ± 51NA
BOD5/COD0.07 ± 0NA
NH3-N (mg/L)308 ± 58NA
DO (mg/L)6.74 ± 0.05NA
Mg2+ (mg/L)285 ± 5NA
Ca2+ (mg/L)47.34 ± 0.03NA
Fe2+ (mg/L)45.31 ± 0.950
Zn2+ (µg/L)2603 ± 5.7710
Cu2+ (µg/L)2130.00 ± 26.4610
Cr2+ (µg/L)910.00 ± 10NA
Cd2+ (µg/L)90.10 ± 0.03NA
Pb+ (µg/L)54.38 ± 0.31NA
As3+ (µg/L)100.22 ± 0.44NA
Co2+ (µg/L)41.08 ± 0.17NA
Mn2+ (µg/L)80.15 ± 0.2610
* DOE: Department of Environment, Malaysia; NA—not available [30].
Table 3. Response value for different experimental conditions (POME dosages and aeration time).
RunFactor A:
POME (mL)
Factor B:
Aeration Time (day)
COD Removal %Color Removal %TSS Removal %NH3-N Removal %
ActualPredictedResidualActualPredictedResidualActualPredictedResidualActualPredictedResidual
11502184.584.79−0.2951.8955.1−3.217965.5313.479494.26−0.26
21501478.8180.18−1.3747.5846.11.4853.253.57−0.379392.830.17
31501478.3180.18−1.8744.7346.1−1.3751.353.57−2.279392.830.17
4150765.867.58−1.7824.2121.372.8425.636.92−11.328180.60.4
51501478.1880.18−247.6946.11.595453.570.439392.830.17
63001484.986.02−1.1232.930.981.924447.46−3.469088.931.07
701433.4634.4−0.9423.4425.73-2.293630.385.629494.93−0.93
80721.6620.820.842.923.29-0.3718.4615.073.398584.70.3
9300775.3274.390.931.53.97−2.4737.429.477.937474.7−0.7
1002140.0839.980.09935.132.442.663241−99594.370.63
113002189.8389.640.1942.8142.260.5556.360.76−4.469292.37−0.37
121501484.4680.184.2844.7146.1−1.3954.453.570.839392.830.17
131501483.2280.183.0446.1546.10.05252.853.57−0.779292.83−0.83
Table 4. ANOVA for COD, TSS, color, and NH3-N removal. A: POME dosage, B: aeration time.
COD Removal (%)SourceSum of SquaresDFMean SquareF ValueProb > F
Model5981.9751196.39190.7<0.0001
A3996.4213996.42637<0.0001
B444.281444.2870.81<0.0001
A21101.8111101.81175.62<0.0001
B244.26144.267.060.0326
AB3.8213.820.610.4607
Residual43.9276.27
Lack of Fit7.8532.620.290.8314
Pure Error36.0749.02
Cor Total6025.8912
SD: 2.50, R2: 0.9927, mean: 69.12, CV:3.62, Pred R2: 0.9814, Adeq Precision: 40.447.
TSS Removal (%)SourceSum of SquaresDFMean SquareF ValueProb > F
Model2468.265493.656.460.0148
A437.591437.595.720.048
B1228.0811228.0816.060.0051
A2592.461592.467.750.0272
B215.2115.20.20.6691
AB7.1817.180.0940.7681
Residual535.16776.45
Lack of Fit529.333176.44121.020.0002
Pure Error5.8341.46
Cor Total3003.4312
SD: 8.74, R2: 0.8218, mean: 45.73, CV:19.12, Pred R2: −0.7897, Adeq Precision: 8.495.
Color Removal (%)SourceSum of SquaresDFMean SquareF ValueProb > F
Model3328.565665.7194.36<0.0001
A41.34141.345.860.046
B1705.8911705.89241.8<0.0001
A2869.581869.58123.26<0.0001
B2170.81170.824.210.0017
AB20.84120.842.950.1294
Residual49.3977.06
Lack of Fit40.88313.636.410.0523
Pure Error8.542.13
Cor Total3377.9412
SD: 2.66, R2: 0.9854, mean: 34.28, CV: 7.75, Pred R2: 0.8733, Adeq Precision: 28.712.
NH3-N Removal (%)SourceSum of SquaresDFMean SquareF ValueProb > F
Model458.76591.75154.36<0.0001
A5415490.85<0.0001
B280.171280.17471.33<0.0001
A22.2212.223.730.0446
B280.43180.43135.32<0.0001
AB1611626.920.0013
Residual4.1670.59
Lack of Fit3.3631.125.60.0647
Pure Error0.840.2
Cor Total462.9212
SD: 0.77, R2: 0.991, mean: 89.92, CV: 0.86, Pred R2: 0.9238, Adeq Precision: 38.623.
Abbreviation. DF: degrees of freedom; Cor: corrected; CV: coefficient of variation; Pred: predicted; Adeq: adequate.
Table 5. Optimal response results from the model prediction and laboratory.
POMEAeration TimeCOD Removal (%)TSS Removal (%)Color Removal (%)NH3-N Removal
(%)
Desirability
188.3821.0089.8367.1055.1993.950.935
Lab experiment87.1565.5452.7891.75
Table 6. Effect of the POME dosage and aeration time on heavy metal removal (POME dosage 188.32, aeration time 21 days).
Heavy MetalsInitial Concentration in LeachateResidual after Treatment ProcessRemoval (%)
Fe2+ (µg/L)20.04 ± 7.111856 ± 0.5790.73
Zn2+ (µg/L)280.00 ± 19.6310.76 ± 2.1096.16
Cu2+ (µg/L)41.91 ± 20.191.28 ± 0.6496.95
Cr2+ (µg/L)45.11 ± 12.812.80 ± 1.0193.78
Cd2+ (µg/L)22.62 ± 3.510.23 ± 0.2099.00
Pb+ (µg/L)4.18 ± 2.910.28 ± 0.1293.30
As3+ (µg/L)17.34 ± 4.2916.15 ± 2.376.85
Co2+ (µg/L)11.05 ± 5.540.53 ± 0.3995.24
Mn2+ (µg/L)48.61 ± 14.9931.72 ± 7.1634.75

