1. Introduction
In 2020, the Chinese Professional Baseball League (CPBL) remained the only professional sports league in Taiwan. With four teams and a total of approximately 100 professional players, it is a cruel stage of superiority and inferiority and survival of the fittest, on which professional baseball players, each with a short sporting career, face the pressure of “changing jobs” frequently, a process during which players can feel helpless and heavy-hearted. Additionally, CPBL players are the focus of the Taiwanese people and the media. They have been devoted to training and competitions from a very young age and have not been able to acquire skills in other professions; therefore, the employment issues they face after retirement are worthy of attention. Chen [
1], through a questionnaire survey and in-depth interviews, investigated the social movement of 462 retired Taiwanese professional baseball players and found that the vast majority (70%), had a parallel flow of employment, e.g., coaching grassroots teams, but 19% had a downward flow, e.g., working in labor-intensive occupations such as the Public Works Department and Taipei City Government, and only 11% had an upward flow, e.g., having an occupation equal to or above the fifth layer of the occupational hierarchy.
In terms of specific job changes, at the end of 2015, Chang Tai-shan, a player for the Uni-President Lions who have set many records, was asked to retire to take a coaching job under the team’s youthization policy, but opted to leave the team after failing to reach a contract agreement. When interviewed by the media, Chang maintained, “I was asked to serve as a coach in haste, and I don’t know what to teach the young players. I have only played in the CPBL, never in other leagues such as the Major League Baseball or the Nippon Professional Baseball Organization that would allow me to be more knowledgeable. So, I think I should learn something first and then try to become a coach. Right now, it is not appropriate for me to be a coach.” When facing retirement, professional baseball players have to consider job changes, and joining a coaching team has been their first choice. Without a well-developed training plan, is it possible for a professional baseball player to rely on his own efforts to change from a player to a professional baseball coach, from the instructed to the instructor? During the transition, the mindset change, the improvement in coaching expertise, and coping with players and the team are all direct and immediate challenges.
Is a player, after retiring and becoming a coach, more successful than other coaches? Whether an ex-professional player has better coaching performance has been extensively studied from the perspective of efficiency [
2,
3,
4,
5,
6]. In terms of methodology, Alsasua et al. [
7] used a log-linear analysis to investigate their efficiency in elite basketball because the aim was to analyze the strength of associations with a dependent variable. However, with a series of independent variables, other techniques, such as logistic regression analysis or data envelopment analysis (DEA), are more appropriate. Empirically, as long as there is complete job-transfer education or training, retired outstanding players-turned coaches can achieve effective training outcomes in most sports events. Similarly, retired professional baseball players can help a team achieve good performance after accumulating enough coaching experience by training and practicing by coaching games. Kahn [
8] investigated the coaching efficiency of head coaches in Major League Baseball (MLB) and found that coaches with a better record as a player are more likely to improve a team’s performance. For example, Yeh Chun-chang, current head coach of the Wei Chuan Dragons, after retiring as a player, spent three years with the Cleveland Indians of the MLB, at his own expense, to serve as a coach, and then returned to Taiwan to take a coaching job. After being well prepared in the required abilities, he has earned a good reputation and has made outstanding achievements in improving players’ technical and psychological performance.
Given the presence of baseball playing styles (e.g., “American style” and “Japanese style”) and the phenomenon that “a prophet is not honored in his own country” in Taiwan’s baseball world, foreigners have been hired to take important coaching positions in the CPBL. To understand the roles of Taiwanese coaches and foreign coaches and the ways of improving the scientific management of professional baseball sports, in this study, we investigated the role-change for professional baseball players who retire in droves each year, under the intensive competitive environment in Taiwan and regard coaching baseball as their first career choice when retiring. How does a player transform into a coach? What are the requirements and qualifications for a professional baseball player to become a coach? It is of great significance to establish a model so that the management, current coaches, and players who are about to retire can follow their respective goals and directions. Therefore, the objectives of this study were as follows: (1) to investigate the efficiencies of various indicators of the CPBL such as defensive, offensive, and integration performance; and (2) investigate the key factors affecting the efficiency of CPBL teams and analyze the performance of retired professional baseball players-turned coaches. By analyzing the operation efficiency of CPBL teams and the performance of retired Taiwanese professional baseball players-turned coaches, we examined the effect of various environmental variables such as coaching experience, age, years of playing, advanced coaching training, educational background, and aboriginal status, and constructed the optimal efficiency model taking into account the above-described aspects and issues. This study’s conclusions can provide the likely implications for the players, coaches, and management of Taiwan’s professional baseball teams and new ideas for coaching science and sports management.
1.1. Data Science and Efficiency Management Model for Professional Baseball
Lin et al. [
9] studied information technology innovations and current data science topics that have become increasingly more important. More researchers have been interested in integrating the concepts and approaches of data science to discover useful information for their domain. How and what types of innovative value and useful information data science can provide for research and training programs, including data mining, big data, and machine learning, has become an essential topic addressed by researchers. Is big data suitable for use in baseball? The statistical analysis of “Money-ball,” “Curse of the Bambino,” and “Curse of the Billy Goat” in MLB are clear examples. Lin et al. [
9] also explored three myths of the CPBL: (1) yellow shirts did not influence winning percentages during the 2014 season; (2) aboriginal players did not perform better than other players during the 2014 season; and (3) using a 95% confidence interval (CI), 19 minor league fielders (19.19%) were promoted and utilized in the CPBL regular-season rotation. Using a 95% CI, there were 14 minor league pitchers (16.67%) promoted and utilized in the 2014 CPBL regular season.
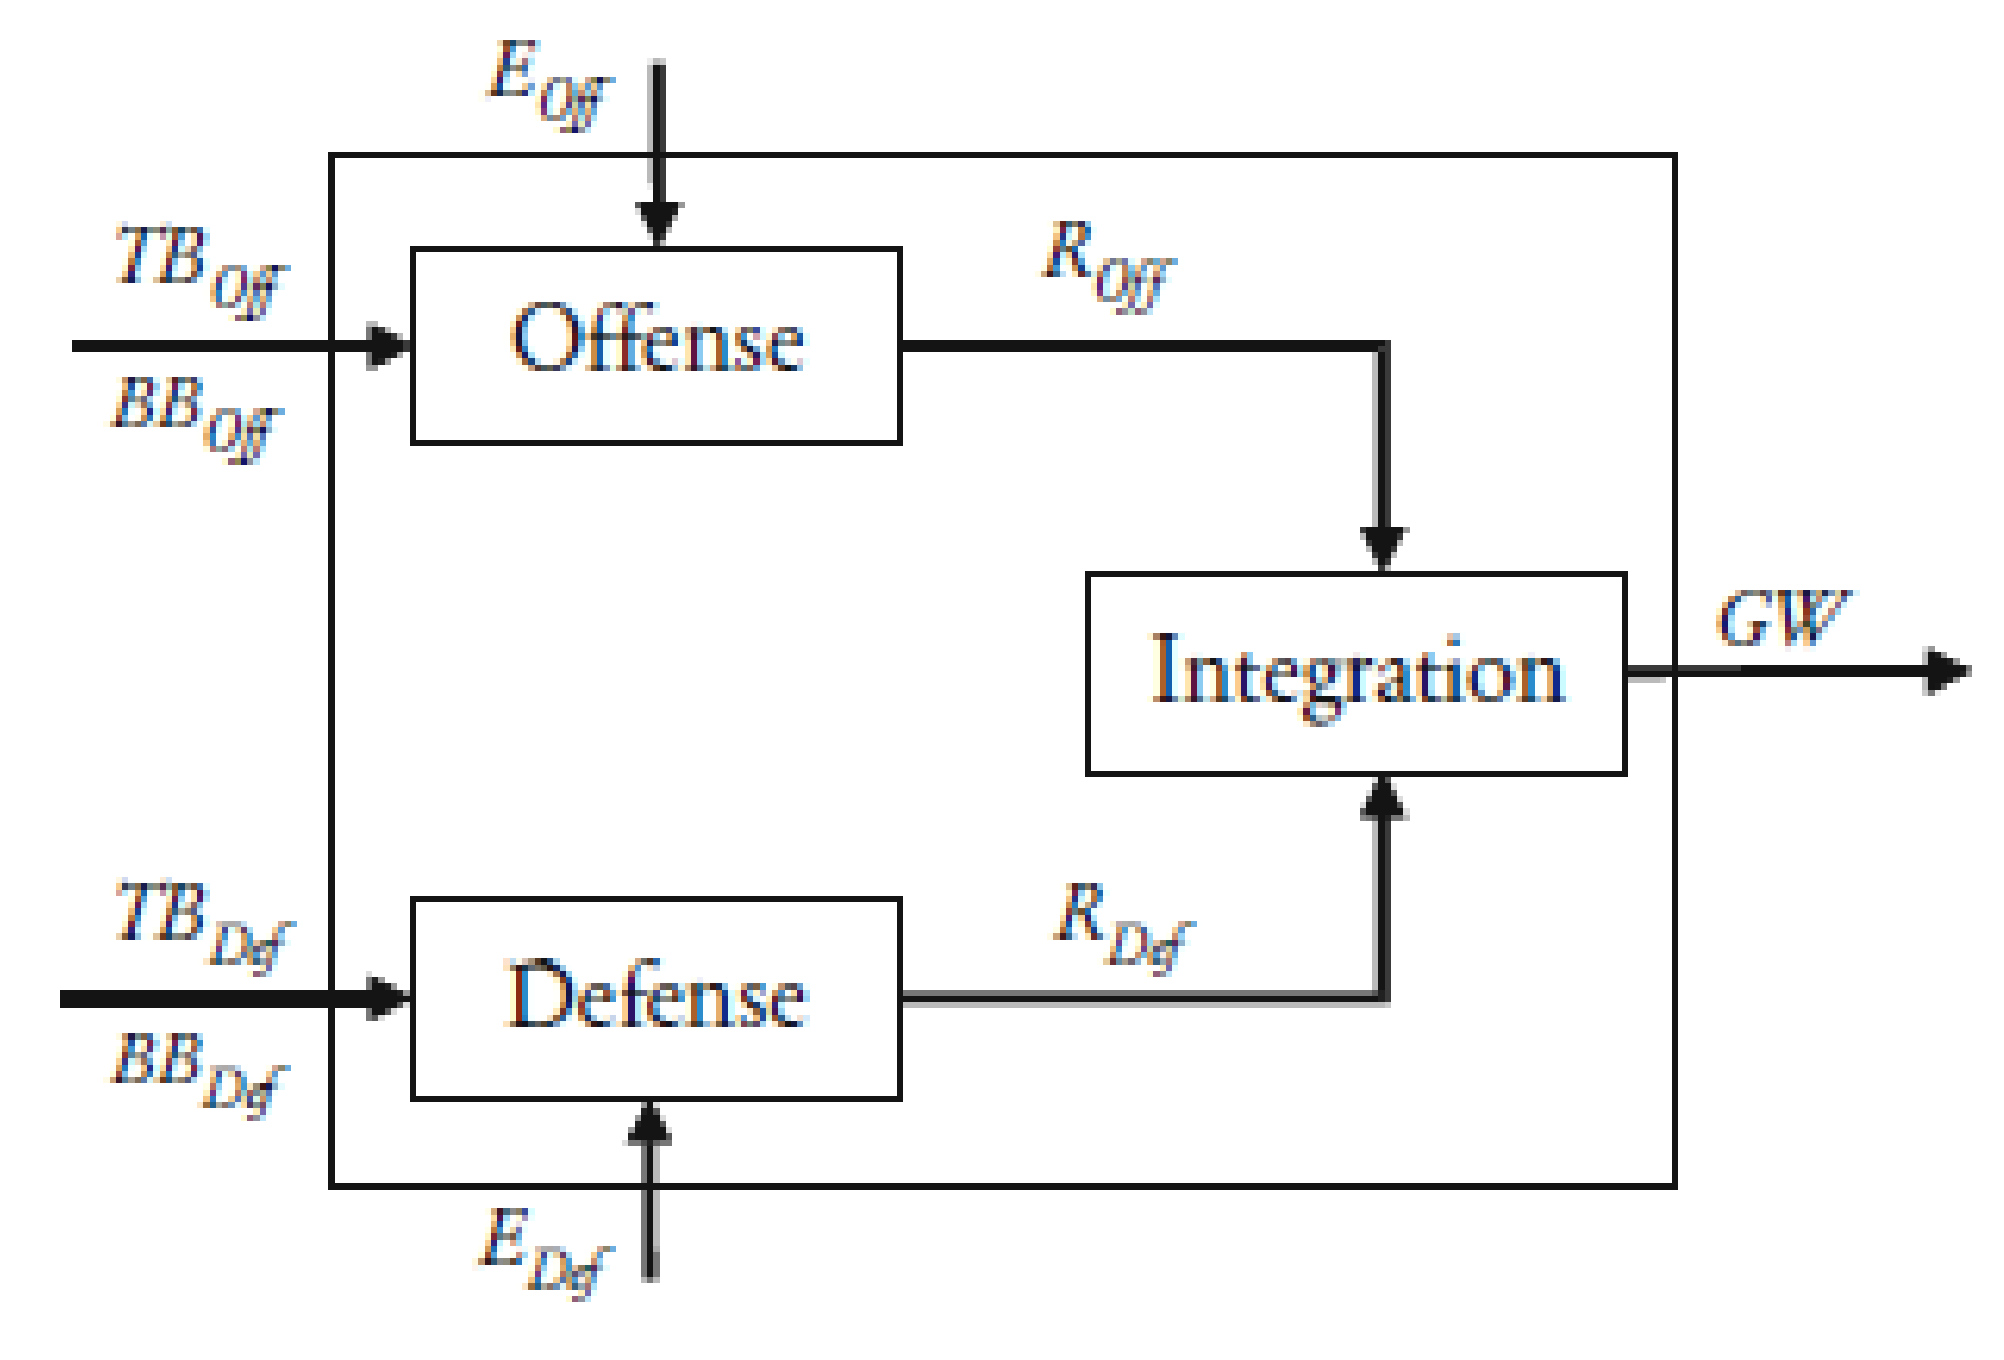
Lewis et al. [
10] constructed models for key factors affecting the winning of regular-season games (long-term performance) and playoff games (short-term performance), and analyzed the efficiencies of MLB teams in the regular season games (1934 teams) and playoff series (284 teams) from 1901 to 2002. A network DEA method was used, through an architecture consisting of three major factors, i.e., offense, defense and integration (
Figure 1); the results showed that while organizational ability and organizational efficiency were both important factors for winning during the regular season, the former was more important.
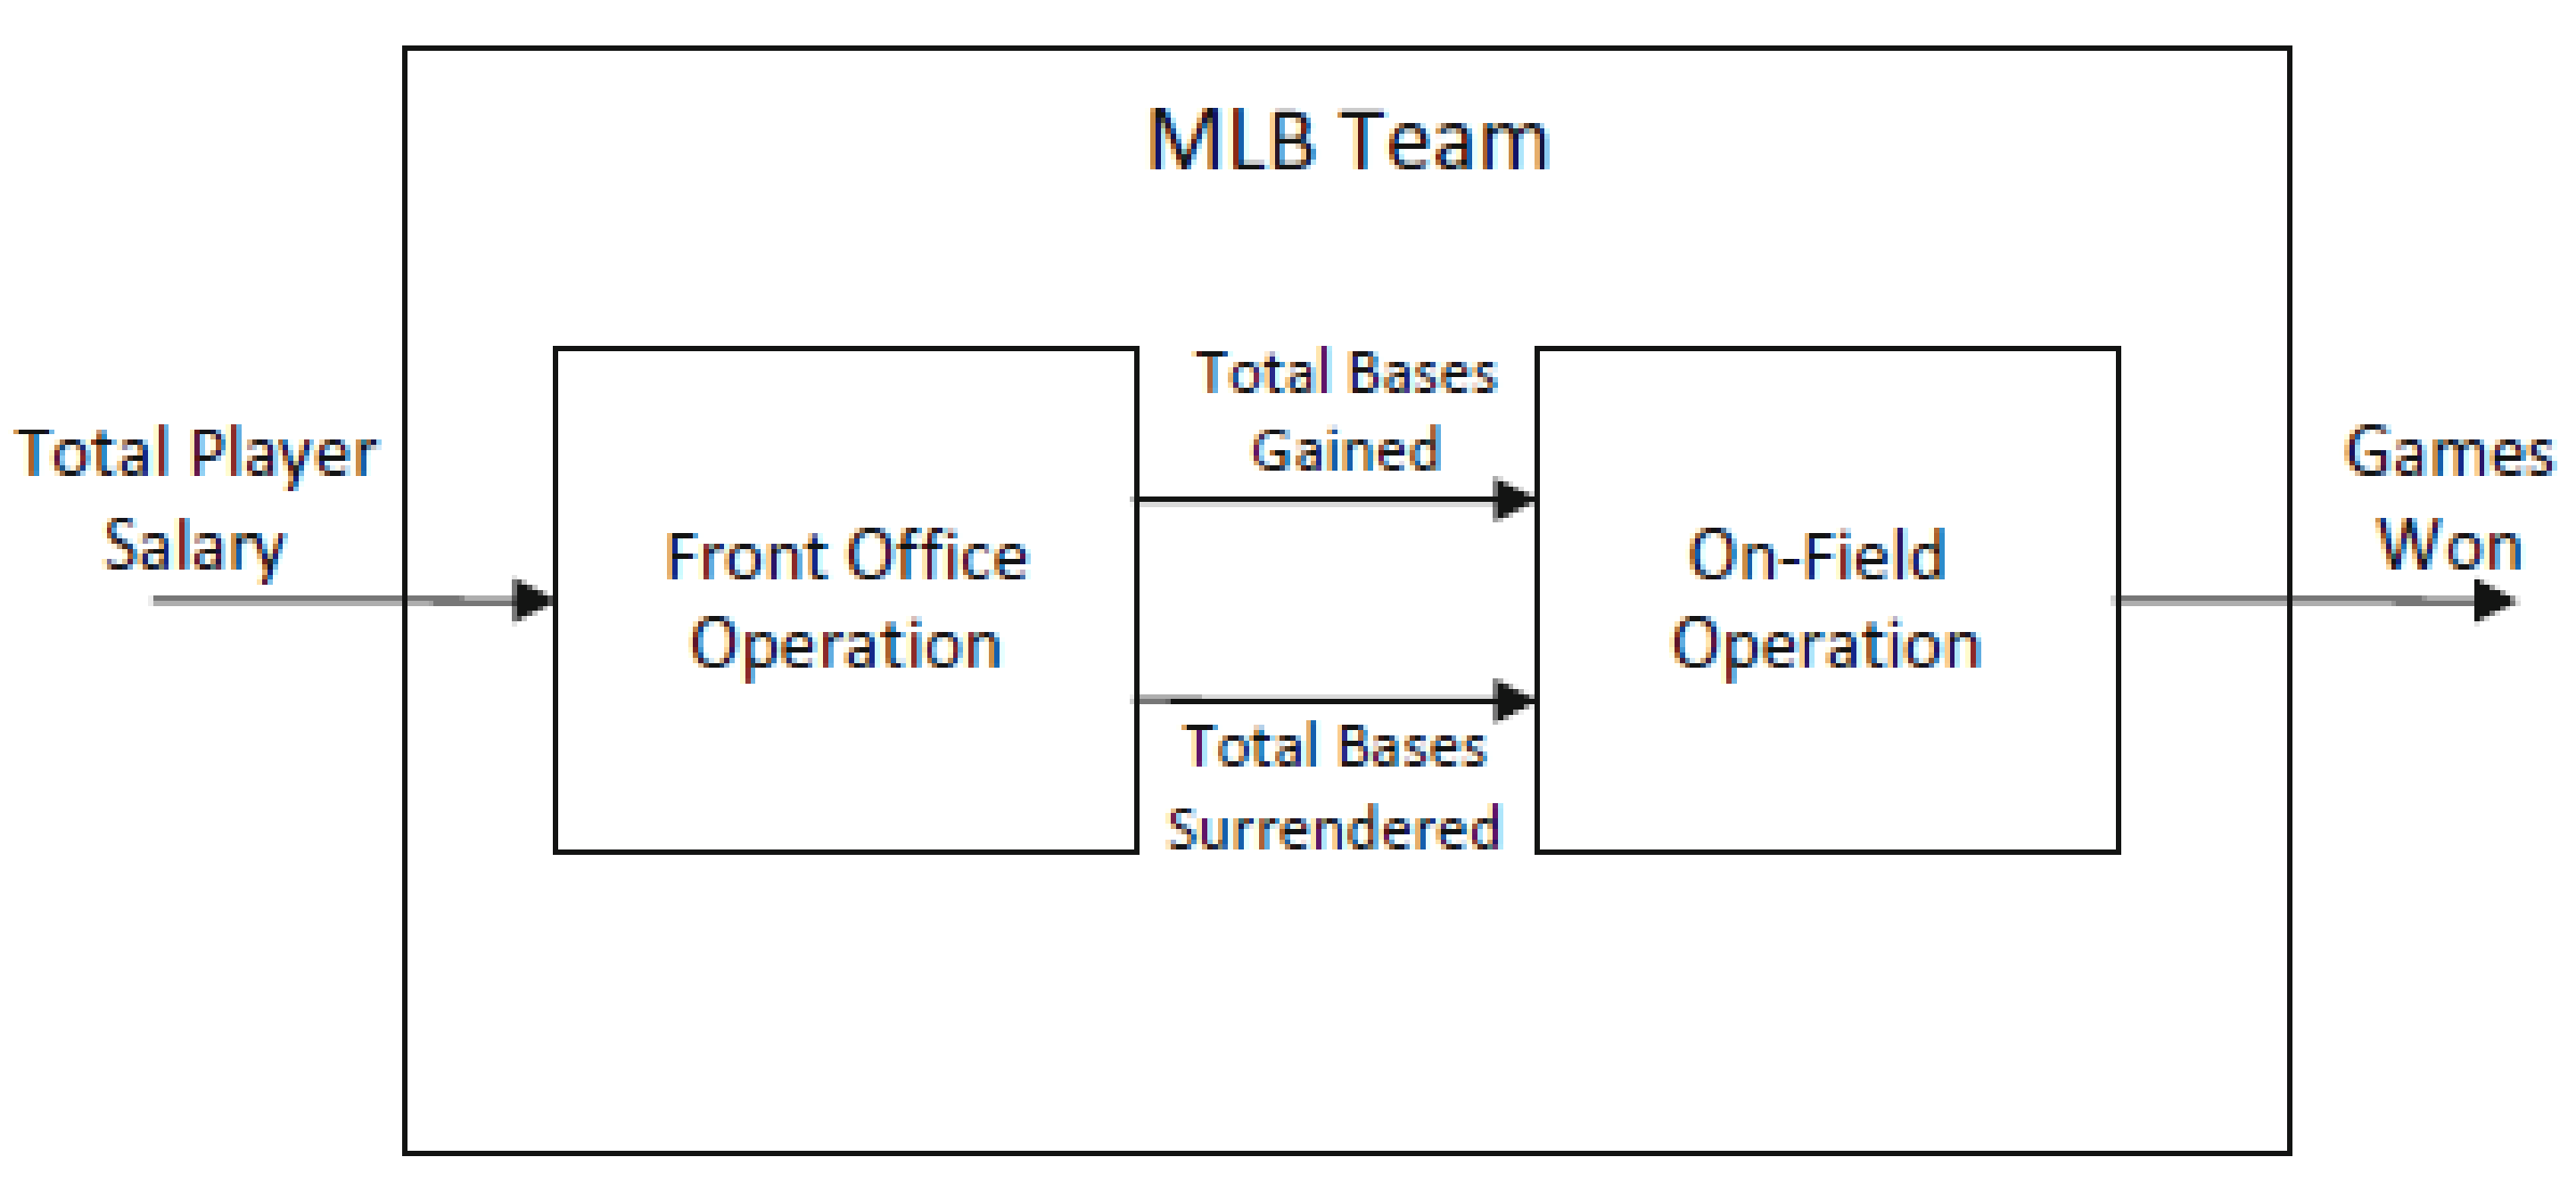
Lewis et al. [
11] studied the efficiencies of MLB teams in 2009 using the unoriented two-stage DEA methodology (
Figure 2). In the first stage (front office operation), the teams’ operating efficiency was investigated through the total salary of the players, the total bases gained, and the total bases surrendered; in the second stage (on-field operation), the teams’ efficiency performance in the MLB arena was examined, and the output items of the first stage became the input items of the second stage (total bases gained and total bases surrendered); the outcome item of the second stage was the number of games won.
Here, the efficient operation of the second stage was examined solely based on the performance in the arena without considering economic factors, which can be interpreted as the coaching ability of a coaching team through the players’ offensive and defensive performance, ultimately reflected by the team’s wins.
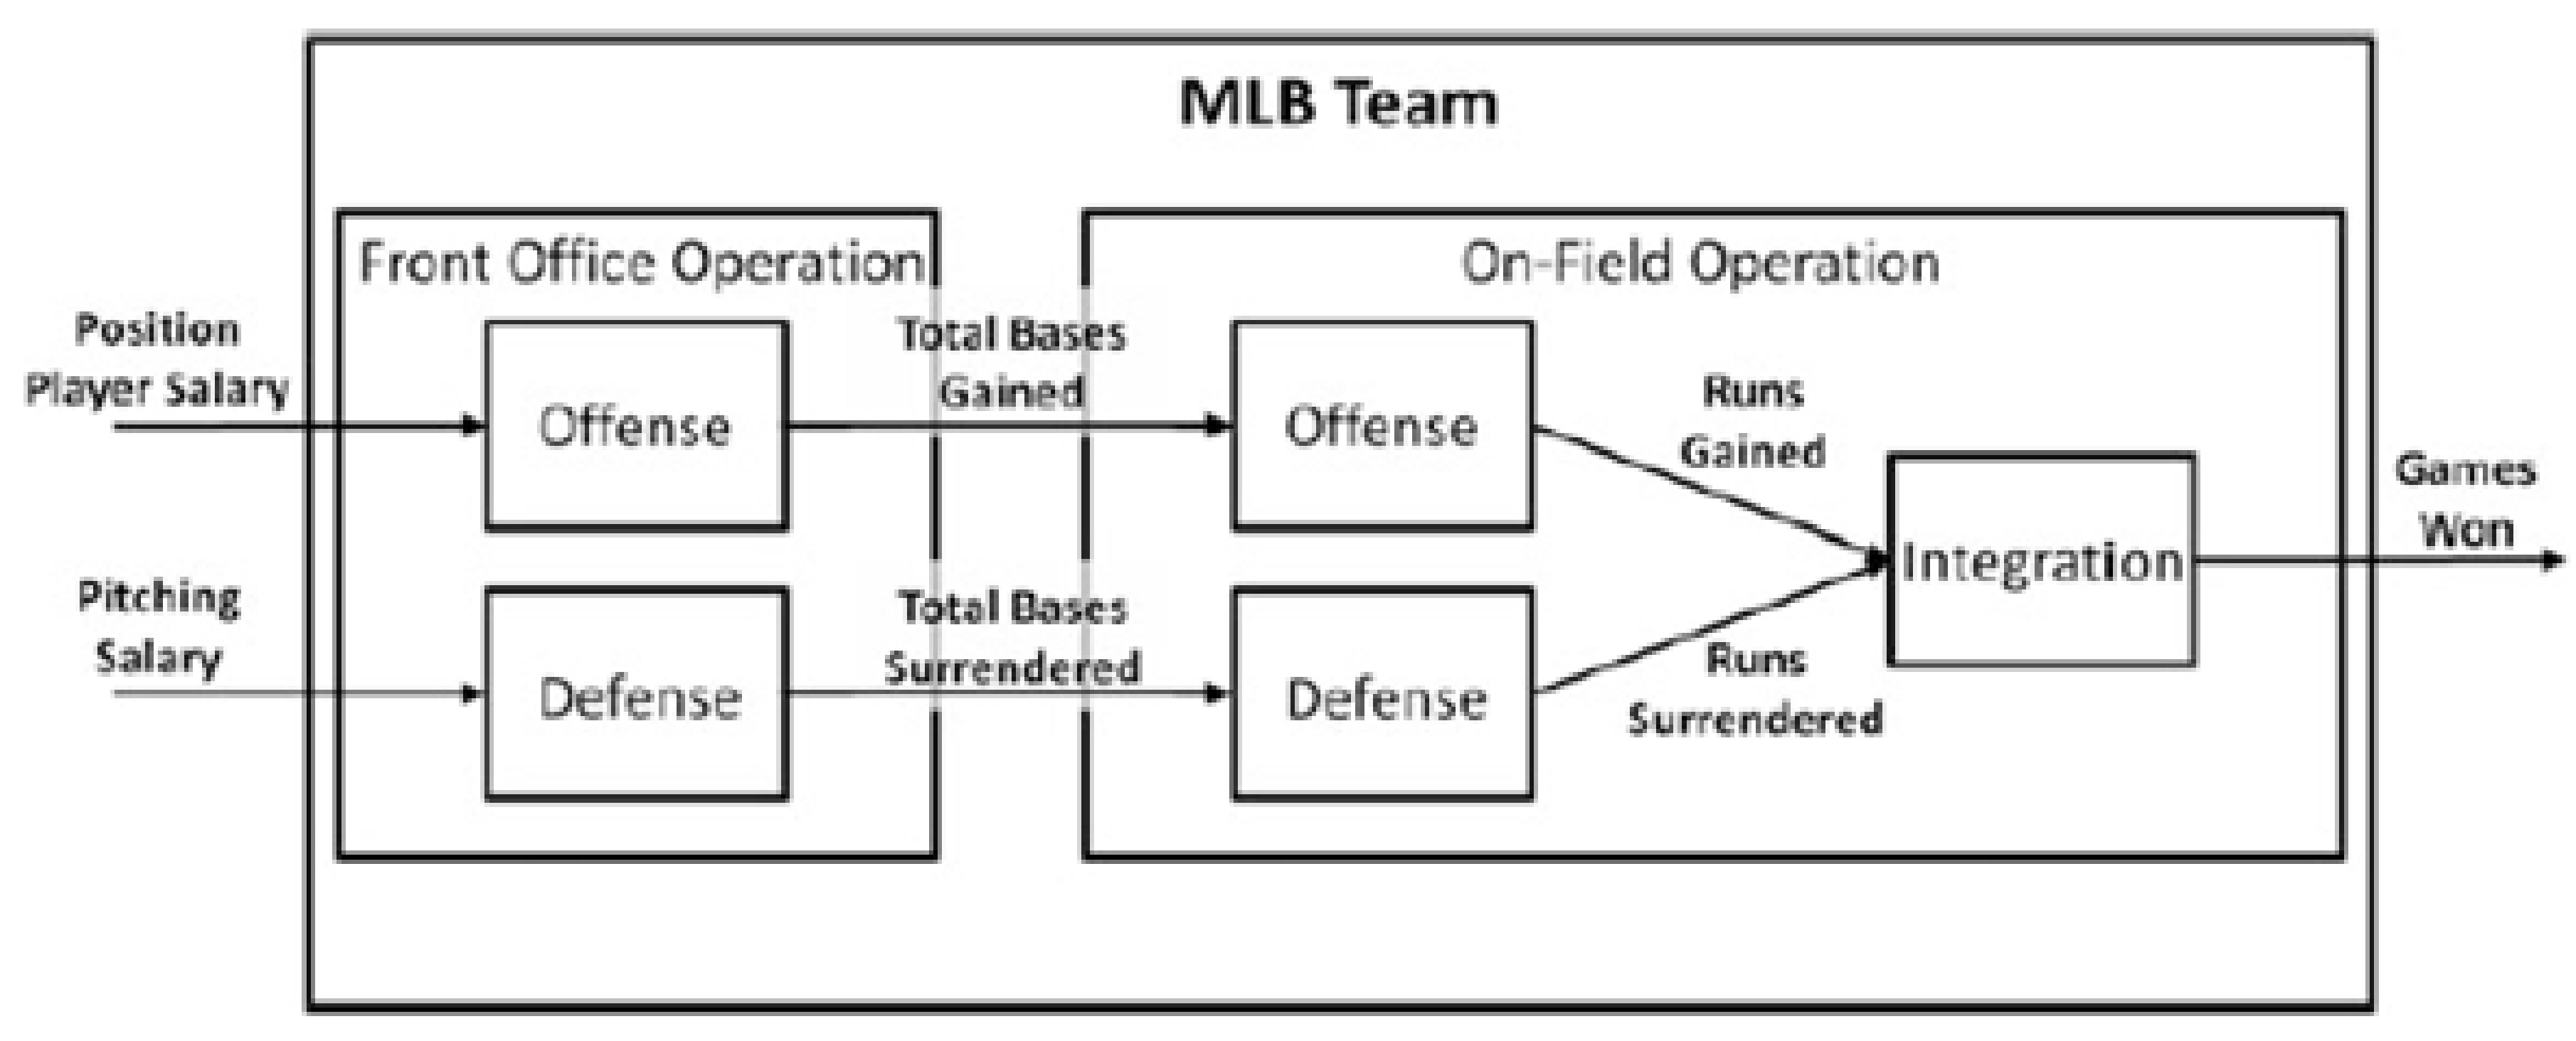
Cook and Zhu [
12] proposed a more complete network DEA efficiency model for MLB teams. The salaries of pitchers and fielders (front office operation) were separated to examine the players’ offensive and defensive performance, talent, and competitive operations in the arena; the players’ offensive and defensive performance in the first stage enabled the teams to attain the most bases gained and the least bases surrendered, ultimately leading to the most wins (
Figure 3). The arena operations aspect of this study has been verified and is fully in line with the idea of this study through which coaching performance is examined.
1.2. Studies on Coaching
We performed a literature survey and found that the efficiency of former professional athlete-turned coaches has been long studied through various methods (DEA and SFA), mostly focusing on basketball [
2,
4,
13,
14] and football [
3,
5,
15,
16], while this issue has rarely been studied for baseball.
With respect to the efficiency of basketball coaching, Goodall et al. [
4] investigated the correlation between outstanding players and the team’s winning percentage in National Basketball Association (NBA) teams, from the perspective of controlling a team’s salary. Lee [
13] examined financial problems faced by teams using the stochastic frontier analysis method from a financial point of view; Lee and Berri [
14] studied the accurate efficiency of the “SuperManager” through the concept of the production function using the Official Fantasy League, an official online game sponsored by the Spanish League of Professional Basketball (Liga ACB), from the perspective of games, without breaking away from the essence of sports elements, and measured the quality and performance of the players.
With respect to the efficiency of football coaching, Bridgewater et al. [
2] studied British football games through similar information and concepts to understand how good coaching can elevate teams with poor technical performance to a higher level in the league. González-Gómez et al. [
16] examined the budget of teams in the first division of the Spanish football league and found that foreign coaches outperformed Spaniard coaches, with statistically significant differences. Through stochastic frontier analysis, del Corral et al. [
15] investigated the efficiency performance of each of the 18 teams of the Spanish professional basketball league (ACB) from 2008 to 2012 using a variety of input-output items, such as victories, total budget, “guards”, “forwards”, “centers”, “guards + forwards + centers”. Then, using ordinary least square (OLS) regression analysis, they examined whether former professional basketball players-turned coaches were more effective in winning games, by focusing on four environmental variables (ex-professional player, Spanish, team experience, and age).
3. Results
3.1. Efficiencies of the Offensive, Defensive, and Integration Performances of CPBL Teams
Professional baseball is highly competitive. Every year, a large number of players retire and face job changes. Turning to coaching in professional baseball is the first choice for most retiring professional players. How can a retired player transform into a coach? What conditions and qualifications are required in order to make the transformation? Establishing appropriate conditions and specific situations is crucial for the management, current coaches, and players who are about to retire to have goals and directions that can be pursued.
In reference to Lewis et al. [
10,
11] and Cook and Zhu [
12], we used the network DEA method to examine the efficiency model of MLB teams, focussing on the on-field operation aspects in the second stage while the economic and cost factors and front office operation aspects, such as the players’ salaries, were not taken into account, and the number of games won through gaining the maximal bases and the minimal bases surrendered was obtained through the offensive and defensive performance of the players in the first stage. The on-field operation aspects of this research concept are fully in line with the concept and setting for the study of coaches’ coaching performance in this study.
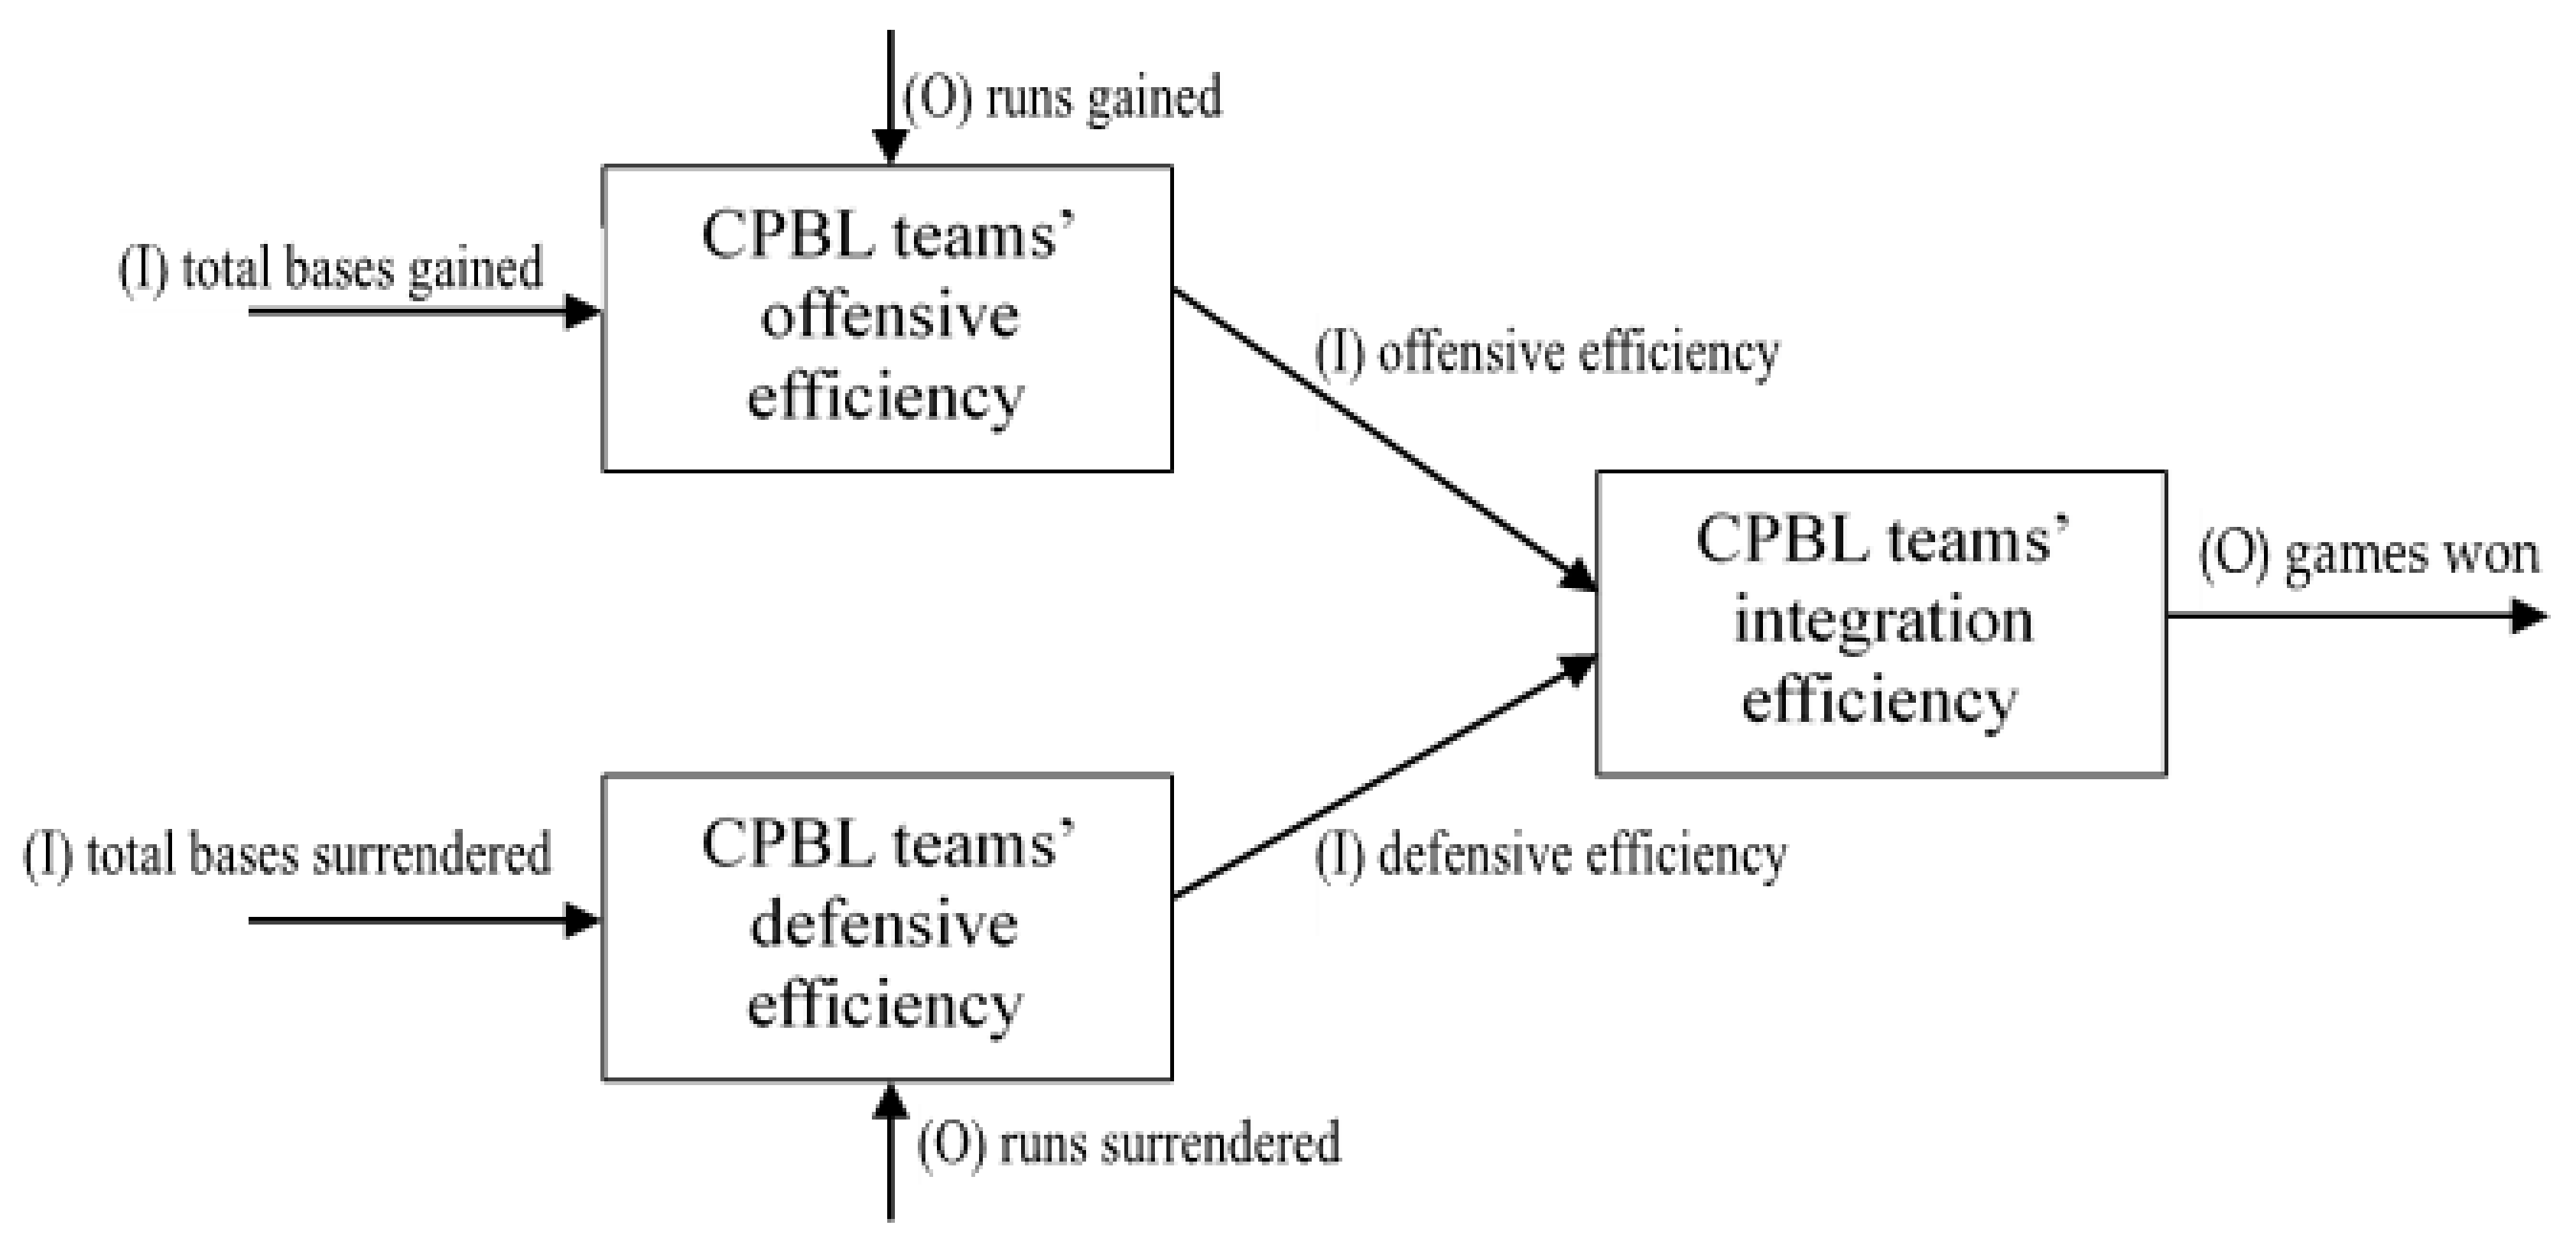
In 2019, the CPBL had four baseball clubs (Lamigo Monkeys, EDA Rhinos, Chinatrust Brothers, and Uni-President Lions), with a first-string and second-string system, for a total of eight teams. The baseball season spans from March to October, in which the first-string games last 30 weeks, and each team plays a total of 240 games in the regular season, in two half-seasons. In 2020, the Wei Chuan Dragons played for one year in second-string games before being formally accepted to the first-string system in 2021, when the CPBL will have five clubs (a total of 10 teams, half first-string teams, and half second-stringer teams). The CPBL is unique in that in order to be in the championship, a team must qualify by winning the top or bottom half of the regular games. Accordingly, in this study, the CPBL regular games of the 2014 to 2016 seasons were divided into top and bottom seasons, giving rise to a total of 24 teams (4 teams × 2 half-seasons × 3 years), i.e., 24 DMUs, to examine the relative efficiency, in which the performances in runs gained (RG) and runs surrendered (RS) were obtained through the TBG and the TBS of each team. In addition, we used the concept of indicator reversal from Lewis et al. [
10,
11] to convert the number of bases into 1/number of bases to reflect the opposite characteristics of pitchers while satisfying the isotropic requirements of the DEA. The descriptive statistics of the performance of team operations efficiency, i.e., the input-output indicators of team offensive performance, the input-output indicators of team defensive performance, and the CPBL team offensive and defensive efficiencies and rankings, are shown in
Table 1,
Table 2 and
Table 3, respectively.
In this study, the efficiency performance of MLB teams was examined through its “on-field operation” efficiency in regular-season games, in which the output items of the first stage became the input items (offensive efficiency and defensive efficiency), and the output item of the second stage was games won. Here, the on-field operation efficiency in the second stage was examined solely based on the on-field performance, without taking into account the financial factors, which can also be interpreted as coaching performance through the offensive and defensive performance of the players, designed and strategized by the coaches and manifested in the games won by the team. The descriptive statistics of the input-output indicators of the integration performance of the team and the ranking of the CPBL teams’ integration efficiencies are shown in
Table 4 and
Table 5, respectively.
The results showed that seven teams, i.e., Lamigo Monkeys (top season, 2014), Chinatrust Brothers (bottom season, 2014), Lamigo Monkeys (top season, 2015), EDA Rhinos (top season, 2015), Lamigo Monkeys (bottom season, 2015), Uni-President Lions (bottom season, 2015) and Chinatrust Brothers (top season, 2016), reached the relatively efficient level relative to other teams in the CPBL regular seasons of 2014 to 2016. The team’s technical efficiency (TE) in the regular seasons was used as the dependent variable for factors affecting coaching performance in the next stage.
3.2. Key Coaching Factors Affecting the Efficiency of CPBL Teams and the Performance of Retired Professional Baseball Players-Turned Coaches
In this study, we also investigated the coaching performance of retired CPBL players-turned coaches and their main influencing factors. In order to find the key coaching factors that affected the efficiency of teams, we needed to know whether factors related to coaches, such as aboriginal status, age, coaching experience, ex-member experience, ex-professional player, advanced studies, Taiwanese coach status, and education, were the main influencing factors. Based on the CPBL situation, eight major factors affecting the efficiency of teams during the regular season were examined. The descriptive statistics of the input-output indicators of the integration performance of CPBL teams are shown in
Table 6. Truncated regression analysis, in which 2000 repeated samplings were performed in the bootstrapping to reduce bias, was conducted in this study, and the main factors affecting the integration performance of the coaches of CPBL teams are shown in
Table 7.
The results showed that two indicators, “ex-member” and “ex-professional player”, were statistically significant. The “ex-member” indicator was negatively significant, indicating that in the CPBL regular seasons in 2014 to 2016, coaching teams with coaches of different backgrounds or with experience had a more profound impact on team performance in the regular season. Empirical data confirmed that since the inception of the CPBL, the Uni-President Lions have adopted the “pure-blood policy”, i.e., coaches are mainly retired players from its own team, and has set the record for winning the most championships among the CPBL teams. However, in the last three years, the Lions have not won a championship, which does not further validate the effectiveness of the above policy, mainly because with the development of communication and the internet and the increasing number of coaches and players returning from abroad, new ideas and training methods have been continuously introduced into Taiwan’s professional baseball environment, leading to the rapid evolution of modern baseball concepts. The Lions’ practice of hiring its own retiring players as coaches has been practiced for 28 years; in the long run, with the trend of rapidly evolving baseball knowledge, the Lions’ policy, relative to the diversified composition of the coaches for the other three teams, seems to be decreasing their competitive edge, which warrants a more in-depth examination.
Moreover, the indicator “ex-professional player” was statistically significant, indicating that the valuable experience of retired professional baseball players definitely has value in the professional baseball arena. If supplemented with appropriate advanced studies to promote more technical exchange and to accumulate coaching experience, coaches can carry on and develop the positive growth force of professional baseball and become important human assets of the CPBL.
4. Discussion
Is it efficient for a retired professional baseball player to become a coach? Is there a decisive factor in the performance of Taiwanese coaches? What are the key coaching factors that affect a team’s performance in the regular season? From the perspective of efficiency and productivity, in this study, we investigated the efficiency of CPBL teams and the most important coaching factors using network DEA, truncated regression analysis, and bootstrapping methods and made some recommendations. The management and the operators of baseball clubs should have the courage to break the rules and actively seek out the influencing factors of game rules through implementing data and efficiency management to improve management efficiency.
Professional baseball is highly competitive. Every year, a large number of players retire and face job changes, and transitioning to a coaching position in professional baseball is the first choice for most retiring players. How can a retired player transform into a coach? What conditions and qualifications are required in order to make the transformation? Establishing appropriate conditions and specific situations is crucial for the management, current coaches, and players who are about to retire to have goals and directions that can be pursued. Based on the findings in this study, we make the following recommendations.
From the perspective of efficiency, the professional players-turned coaches have better coaching performance [
2,
3,
4,
5,
6]. In the majority of sports, professional athletes-turned coaches can achieve the training outcomes with the highest efficiency given adequate advanced education or training. Similarly, retired professional baseball players can help a team achieve good performance after proper training and accumulating practical coaching experience [
6,
8]. The importance of sports coaches is self-evident, and the increasing number of publications on coaching indicates that coaching efficiency issues in sports is getting more attention.
By surveying the literature regarding coaching, we found that previous studies have focused on basketball and football, while coaching in baseball has rarely been addressed, representing a research gap. Furthermore, quantitative studies on the role change for professional baseball players-turned coaches have been lacking in terms of efficiency, posing another research gap. The proposed model, after appropriate correction according to practical needs, can be used to comprehensively track baseball clubs, coaching ability, and players’ technical capability and efficiency, which can help to implement recommended improvements in all aspects of baseball and enhance the national level of baseball development so that sports coaching human resources can be fully utilized [
6], ultimately affecting creativity regarding the development and practice of baseball.
Former professional players-turned coaches, having abundant expertise and skill, are well received and recognized by the management, coaches, players, fans, and supporters of current CPBL clubs, a situation that has also been adopted in the coaching team for the Chinese National Baseball Team. However, being likely affected by countries such as the United States and Japan and baseball clubs with more developed baseball programs, CPBL clubs still hire a large number of foreign coaches based on their respective game styles, as well as different coaching styles, such as “American style” baseball that emphasizes strength, and “Japanese style” baseball that emphasizes the delicate division of players. In this study, we found that “Taiwanese coaches” that have been trained locally can assume the coaching responsibility of CPBL teams well. From the perspective of efficiency and productivity, the question of whether they have met clubs’ performance requirements has not been answered and is worthy of further investigation.
In terms of efficiency and productivity, DEA and SFA are the most commonly used tools. Relative to DEA, SFA includes noise and can test hypotheses through traditional statistical methods, but it has disadvantages in that it must assume the distribution in inefficient terms and set the function type for production function or cost function. In the case of CPBL, there are some new challenges, such as a small economic scale and a small number of teams and players (i.e., small sample size) that require different research ideas and methods (e.g., window analysis and Malmquist productivity index).
The investigation of coaches’ efficiency has evolved from games won to coaches’ ability to improve a team and, further, to two-stage efficiency and productivity studies that examine environmental variables. Research ideas and methods pertaining to environmental variables are rich, interesting, and diverse. With the two-stage efficiency calculation, after the stage-one efficiencies are obtained, different methods can be employed to further obtain results. In fact, multi-objective decision theory-related tools, such as artificial neural networks, fuzzy theory, and grey correlations, can be used at stage two to obtain more accurate and applicable results, thereby creating diversified research directions.
Investigations from the perspective of sports coaching expertise and sports industry practices, setting up appropriate input-output indicators and calculations that introduce various DEA models are in line with the characteristics and needs of baseball, helping to achieve the optimal expected benefits with respect to improving baseball coaching and management effectiveness, resource allocation and the operation of baseball-related industries.
The findings of this study have implications for the comprehensive tracking of CPBL clubs and the technical analysis and efficiency performance of professional baseball teams and coaches. The establishment of institutionalized management of CPBL teams and coaches at the technical level to achieve scientific management of baseball, with the objective of applying scientific management to improve the performance and growth of coaches, can be achieved through strengthening the “control” function of management, implementing “efficiency management” and improving the concept of “effective use of resources”.
5. Conclusions
Is it efficient for a retired professional baseball player to become a coach? Is there a decisive factor in the performance of Taiwanese coaches? What are the key coaching factors that affect a team’s performance in the regular season? From the perspective of efficiency and productivity, in this study, we investigated the efficiency of CPBL teams and the most important coaching factors by referencing network DEA models for the efficiency of MLB teams by Lewis et al. [
10,
11] and Cook and Zhu [
12], in which the economic and cost factors and front office operations (e.g., player salary) are neglected and the game aspects in the arena of the second stage are the focus, and through the offensive and defensive performance of the players in the first stage, teams win the most games by gaining the most points and allowing the least points.
Given the uniqueness of the CPBL game system, i.e., that a team qualifies for the championship by winning the top half or the bottom half of the regular season, we divided the regular season games of the 2014 to 2016 seasons into top and bottom seasons, for a total of 24 teams (DMUs) to examine relative efficiency, and drew the following conclusions:
In the CPBL regular-season games of 2014 to 2016, seven teams, i.e., Lamigo Monkeys (top season, 2014), Chinatrust Brothers (bottom season, 2014), Lamigo Monkeys (top season, 2015), EDA Rhinos (top season, 2015), Lamigo Monkeys (bottom season, 2015), Uni-President Lions (bottom season, 2015) and Chinatrust Brothers (top season, 2016), reached relatively efficient levels relative to other teams.
The “ex-member” indicator was statistically but negatively significant, indicating that in the CPBL regular season games of 2014 to 2016, coaching teams with coaches of different backgrounds or with experience had a more profound impact on the outcome of games during the regular season.
The “ex-professional player” indicator was statistically significant, indicating that the valuable experience of retired professional baseball players definitely has value in the professional baseball arena, verifying the original intention of this study


