Article

Rapid Quality Control of Woodchip Parameters Using a Hand-Held Near Infrared Spectrophotometer

1
Department of Agricultural, Food and Environmental Sciences, Università Politecnica delle Marche, via Brecce Bianche, 60131 Ancona, Italy
2
Department of Food Science, University of Copenhagen, Rolighedsvej 26, DK-1958 Frederiksberg, Denmark
*
Author to whom correspondence should be addressed.
Processes 2020, 8(11), 1413; https://doi.org/10.3390/pr8111413
Submission received: 6 October 2020 / Revised: 29 October 2020 / Accepted: 3 November 2020 / Published: 5 November 2020

Abstract

:
Near infrared spectroscopy is a non-invasive and rapid technique to support the analysis of solid biofuels such as woodchip, which is considered as a suitable alternative for energy production, according to European goals for fossil fuel reduction. Chemical and physical properties of the woodchip influence combustion performance, so the most discriminant parameters such as moisture and ash content and gross calorific value were constantly monitored. The aim of this study was the development of prediction models for these three parameters with the use of a hand-held NIR spectrometer. Laboratory analyses were carried out to evaluate the quality of several Italian samples from a power plant, and PLS regression models were developed to test prediction accuracy. Moreover, the most relevant wavelengths were investigated to discriminate chemical compounds influence. Prediction models demonstrated the capacity of handheld MicroNIR instrument to be considered a practical tool for solid biofuel quality assessment. As a consequence, NIR spectroscopy improved real-time analysis and made it suitable for practical and industrial applications, as supported by the recent Italian standard UNI/TS 11765.

1. Introduction

In the last decade, within Europe, improved energy efficiency and the reduction of fossil fuel consumption were some of the most important targets to minimize environmental impact and to ensure energy provision. The EU has termed ambitious goals for 2030 (27% of final energy consumptions to come from renewable energy), so increasing energy efficiency has taken on particular significance [1,2]. Due to economic and energetic advantages, woodchip has been considered an alternative and suitable solid biofuel for power production and it is linked to different sectors, such as dedicated plantations, residues from traditional forestry, agricultural crops or industrial residues [3]. Physical properties and chemical composition affect combustion performance and the consequent energy production and emissions, so that it is very important to implement an adequate system to monitor and discriminate the quality of solid biofuel used in power plants [4] with a recent study highlighting the difficulty associated with this activity [5].
Gross calorific value (GCV) and ash content (AC) represent fundamental parameters to discriminate the quality of solid biofuel. GCV plays an essential role to define biomass price but also for power plant management, while AC is more relevant for tuning combustion operation [6]. The presence of lignin increases GCV while moisture content (MC) reduces net calorific value (NCV) [7]. High AC contributes to decreasing GCV and thus energy production [8]. In parallel, AC influences combustion performance and environmental and energetic efficiency due to its inorganic content [9].
Near infrared (NIR) spectroscopy, if compared with conventional techniques, is considered a rapid and more practical method. NIR spectroscopy is less expensive, more intuitive, more user-friendly and non-destructive [10,11,12]. It is based on the absorption of radiation in the near infrared region of the electromagnetic spectrum and the related vibrations of fundamental chemical bonds. Chemometrics is the key to extract useful information and to develop prediction and classification models essential for practical applications of the technique [12,13]. The practical implementation of NIR instruments in the solid biofuel sector finds support with the recent establishment of Standard UNI/TS 11765:2019. In fact, among the procedures listed in the Standard is prediction model development [14].
The MicroNIR spectrometer is a robust, hand-held instrument based on miniaturization of the NIR spectrometer. It is simple, fast (a few seconds for each scan) and it allows testing a large number of samples, even without required preparation [13,15,16]. A further important advantage consists in obtaining the results in real time, reducing time and cost, and it could operate directly on site even in different environmental conditions [17,18].
MicroNIR has been already used in various fields, such as agrifood and seafood sectors, microbiological, petrochemical and pharmaceutical sectors, and bioenergy along with forestry and wood industry. In the agrifood and seafood sectors, portable NIR spectroscopy plays a fundamental role in continuous and rapid quality control of products [18,19,20,21]. Likewise, the increasing of NIR spectroscopy in industrial applications, for instance in the microbiological, petrochemical and pharmaceutical sectors, is determined by the possibility to analyze a significant amount of samples quickly and cost-effectively [22,23]. In addition, NIR spectroscopy in the bioenergy sector is gaining more importance, especially to improve industry control by monitoring and predicting qualitative and quantitative biofuel properties [13,24,25]. For example, different authors have taken advantage of the feasibility and potential of online NIR spectroscopy measurement to improve biofuel analyses and biodiesel production [22,23].
Several reports using NIR spectroscopy have reported the prediction of the properties of wood, such as chemical properties, MC or physical and mechanical characteristics [26]. Furthermore, the major components of biomass (lignin, cellulose, xylan) were investigated by different authors via NIR spectroscopy in order to analyze structural combinations and modifications during chemical or physical processing [27]. The parameter of bound water content (BWC), considered as the portion of water bound by hydroxyl groups of cellulose molecules [28], is also an interesting indicator of physical behavior in terms of drying energy (fiber-water interaction) of solid biofuel [29]. For example, research on bamboo wood demonstrated that it could be considered as renewable resources due to its chemical and physical properties investigated by NIR spectroscopy [30]. Moreover, different studies have employed the MicroNIR instrument in industrial pulp production [31] and in forestry sector for assessing the economic value of wood and forest management [32], taking advantages of its portability.
At present, some studies investigated the prediction of GCV and AC parameters with NIR spectroscopy using benchtop instruments [9,16,33], but no studies were conducted using a handheld NIR spectrometer. For example, GCV, AC and MC have been predicted with NIR spectroscopy for different herbaceous varieties assessing the consequent improvement of feedstock management due to biomass classification [4]. Another study regarding GCV and AC prediction was carried out on woodchip samples and reported the efficiency of NIR spectroscopy to provide a quality division of biofuel in different classes based on these discriminant parameters, suggesting potential in-line application for the industry sector [6]. Research on the combustion performance of ground bamboo wood was carried out with the specific use of MicroNIR and chemical components as carbon (C), nitrogen (N), hydrogen (H) and oxygen (O) contents were predicted, although it was related to a single specific species [34].
The purpose of this study is to develop prediction models for BWC, GCV and AC parameters of woodchip samples using a hand-held NIR spectrometer, useful for a practical application of UNI/TS 11765. Several samples, coming from Italian power plants, were analyzed and multivariate regression models were subsequently developed using chemometric techniques. The aim of this is to improve the evaluation of biofuel quality and to enhance time and cost efficiency of laboratory analysis with the use of portable NIR instrument, which allows rapid and accurate investigation of biomass characteristics.

2. Materials and Methods

2.1. Sample Collection and Preparation of Woodchip Samples

The woodchip samples (n = 209) were obtained from several Italian power plants during 2018–2019. A subset of the woodchip samples was received directly to the lab in hermetically sealed plastic bags (170 samples); another subset of the samples were collected directly in the biomass power plant of Bando d’Argenta (Italy) during a monitoring plan (39 samples). In order to maintain their representativeness, these samples have been collected according to the sampling procedure defined by the technical standard EN ISO 18135:2017—Sampling of solid biofuels.
The samples were prepared for already stated above laboratory analysis according to technical standard ISO 14780:2015. It consists of stabilizing part of the samples at least for 24 h at 40 °C and, after the first MicroNIR analysis, successively grinding them to 1 mm of particle size using a cutting mill (mod. SM 2000, RETSCH). The samples were stored in a plastic falcon tube for successive laboratory and MicroNIR analysis.

2.2. Laboratory Analysis

Ash content of air-dried material (ACad) and its related bound water content (BWC) have been calculated according to ISO 18122:2015. The procedure consists of heating the sample in air under controlled temperature (550 ± 10 °C) and calculating its residual mass. In detail, the mass of the sample is monitored over time as a function of cycles of constant temperature using the thermogravimetric analyzer (Mod. TGA701, Leco). The ash content on a dry basis (ACdb) was calculated for each sample from the ACad and the related BWC in percentage. Each sample was analyzed in duplicate.
Gross calorific value of air-dried woodchip material (GCVad) was measured according to ISO 18125:2017. The procedure consists of burning the sample in a high-pressure oxygen atmosphere in a bomb calorimeter (mod. C2000 basic, IKA). The calorimeter is calibrated by combustion of certified benzoic acid standard (IKA Benzoic Acid C723) under the same analysis conditions of the samples. The gross calorific value on a dry basis (GCVdb) was calculated based on the GCVad and the related BWC in percentage. Each sample was analyzed in duplicate.
The AC was performed on all the samples (n = 209), whereas the GCV was performed on a subset of samples (n = 188).

2.3. Near-Infrared Spectral Acquisition

NIR spectral acquisition was performed using a MicroNIR™ OnSite instrument (Viavi Solutions Inc., Santa Rosa, CA, USA). The instrument operates in the range between 950 and 1650 nm; it is equipped with two small vacuum tungsten lamps (ø ≈ 4 mm) as radiation source and a linear-variable filter (LVF) as a dispersing element with detection on a 128 pixel indium gallium arsenide (InGaAs) photodiode array detector.
The acquisition was carried out in the reflectance mode; the integration time was 6.7 ms and each spectrum was the average of 100 scans. Ten replicates were acquired for each woodchip sample after it was stabilized (hereafter WDst), before and after the grinding process. In detail, five replicates were acquired on each ground sample (hereafter shorten as WDgr). The different number of replicates between the two materials is related to the dissimilar particle size distribution and the reduced scattering effect during spectra acquisition of the WDgr samples with respect to the WDst samples [9].
In order to remove the instrument and environment effects, a dark reference (0% transmittance) and a blank spectrum have been acquired every hour using a 99% reflectance reference standard (Spectralon). The MicroNIR spectra were collected at room temperature (30 ± 1 °C).

2.4. Data Processing and Partial Least Square Regression

Different Partial Least Square (PLS) regression models were developed for the prediction of AC and GCV, both on dry basis and air-dried on WDst and WDgr material and for the prediction of BWC on WDst and WDgr material. The models were validated using venetian-blind cross-validation (10 segments) and an external test set. The dataset was divided into a training set and a test set, by sorting the samples in accordance with the y-reference values and taking out every fifth sample, so as to cover the entire response range. For GCV prediction, 150 samples were used as a training set and 38 as an external test set; for AC and BWC, 167 samples were used as a training set and 42 as an external test set. The spectra replicates were kept together and placed into the training or test sets. Before the computation of the PLS regression models, different pre-treatments were applied to test the prediction performance of the different models and the spectral measurements were averaged. In detail, both scatter correction pre-treatments (Standard Normal Variate—SNV—and Multiplicative Scatter Correction—MSC) and derivatives (Savitzky-Golay, 9, 13 or 21-points window, 2nd order polynomial filter) were considered. For each developed PLS model, regression plot, PLS score plot and X and Y influence (residual vs. leverage) plots were analyzed to detect possible outlier samples, both spectral and chemical.
The statistics of each model were assessed; in detail, R2cv, RMSECV, R2val, RMSEP, bias and slope have been reported. Range to error ratio (RER) and the ratio of standard error of prediction to standard deviation (RPD) indices have been also calculated to compare the different PLS regression models developed. The two indices are related to the performance of the models prediction. According to [4,35,36], RER values should be between 7 and 20 to have a model that can be used for quality screening applications and greater than 20 for a model to be used in any quality control applications. RPD values gave similar indications, in particular, RPD values should be greater than 3 for screening applications and greater than 5 for quality control applications [37,38].
All the computations were performed in MATLAB environment (ver. 7.10.0, The MathWorks, Natick, MA, USA) using in-house functions on existing algorithms.
In addition, a general statistical analysis was performed on BWC, AC and GCV values. For each parameter, average, standard deviation, minimum (min) and maximum (max) values were calculated both on the whole dataset and also on training and test set.

3. Results

3.1. Spectra

Figure 1 shows the average spectra of all WDst and WDgr samples. Two relevant peaks were detected at 1199 nm (1) and 1466 nm (2). According to [39], the first peak was related to the presence of the main wood component as lignin, cellulose and hemicellulose. In particular, the 2nd overtone of C-H stretching bonds was confirmed at 1193 nm [40]. The range between 1430 and 1520 nm was related to water content, in particular to the 1st overtone of O-H stretching bonds (1466 nm) [10,41]. The only difference between WDst and WDgr was detected in absorbance value, which was higher for WDst samples than WDgr samples.

3.2. General Statistical Analysis

The results of the general descriptive statistics of all the woodchip samples analyzed were summarized in Table 1. Mean values of air-dried materials were different from dry basis ones, both for AC (3.65% and 4.05%, respectively) and for GCV (17766 J/g and 19706 J/g, respectively). For each parameter, the mean value of the whole dataset and of training and test sets have been calculated. The values were similar to each other and the maximum and minimum values of the test set is contained in the range of the training set values. The samples variability could be related to the different biomass quality, coming both from dedicated and residual streams. The large difference between minimum and maximum values of AC parameter (rangead = 16.18% and rangedb = 17.64%) is an example of the biomass variability.

3.3. Prediction of Bound Water Content

PLS regression models for the prediction of BWC were developed on WDst and WDgr samples pretreating the spectra with different techniques. Table 2 reports the prediction results of WDst and WDgr.
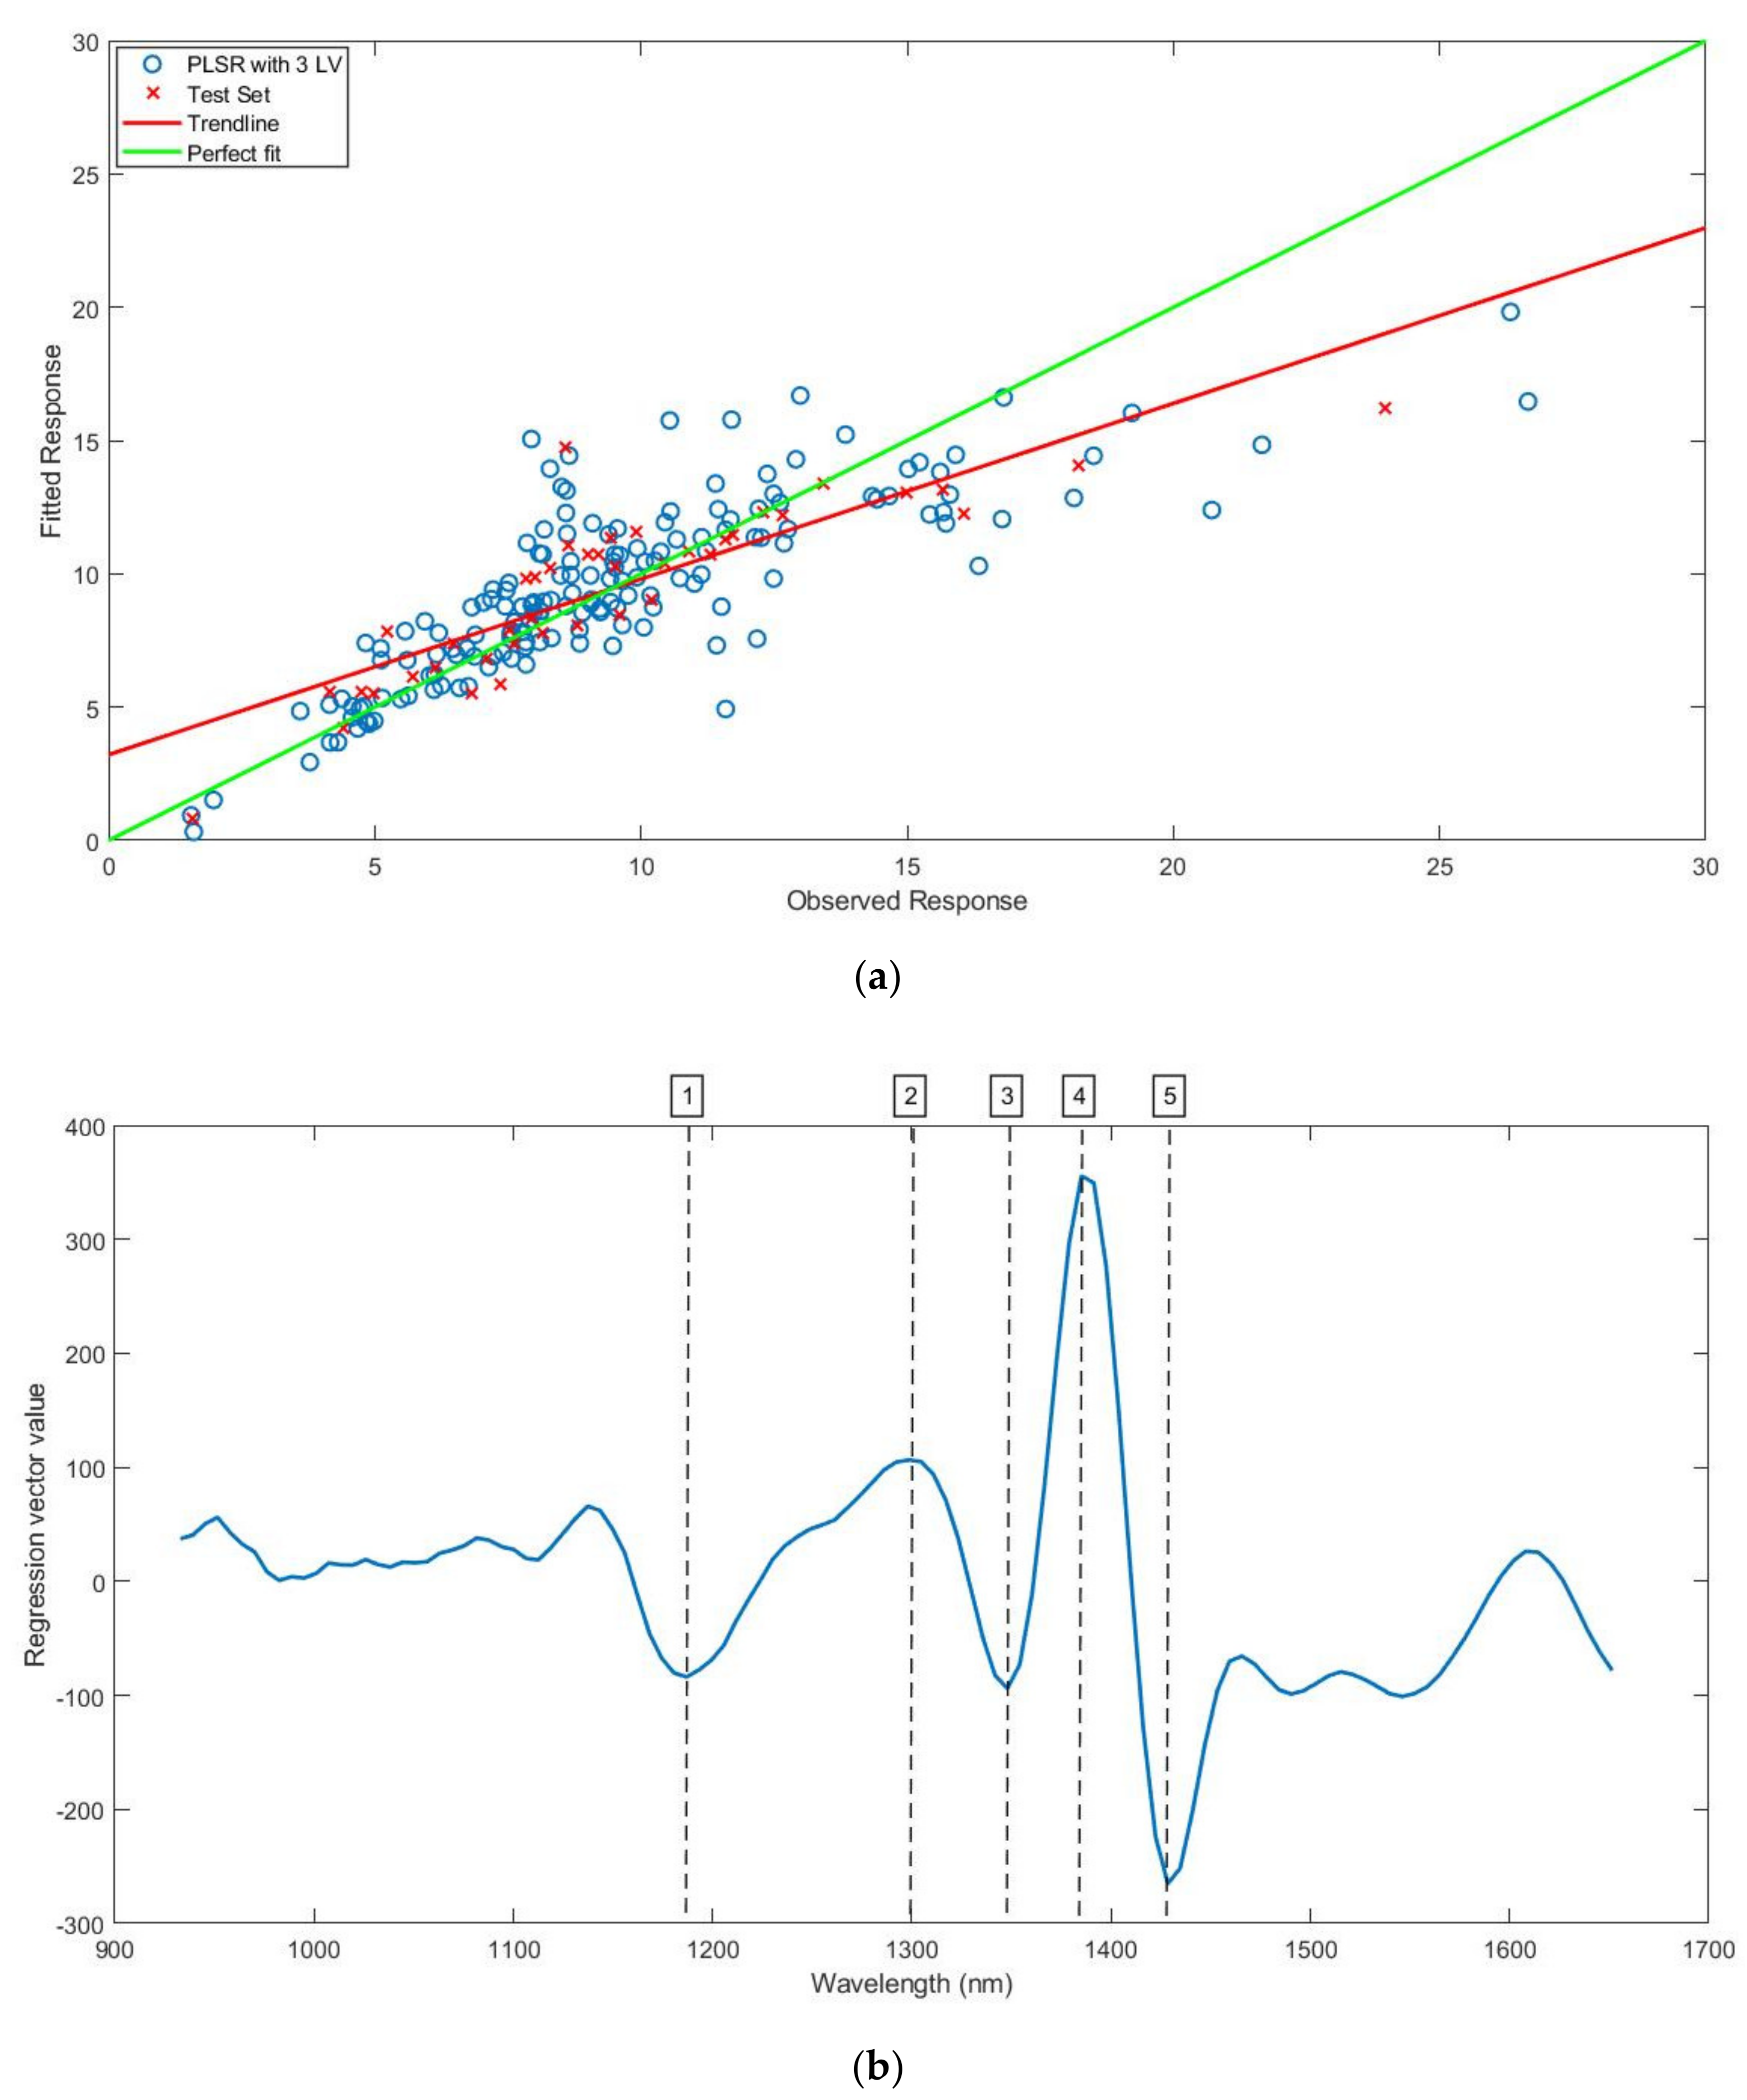
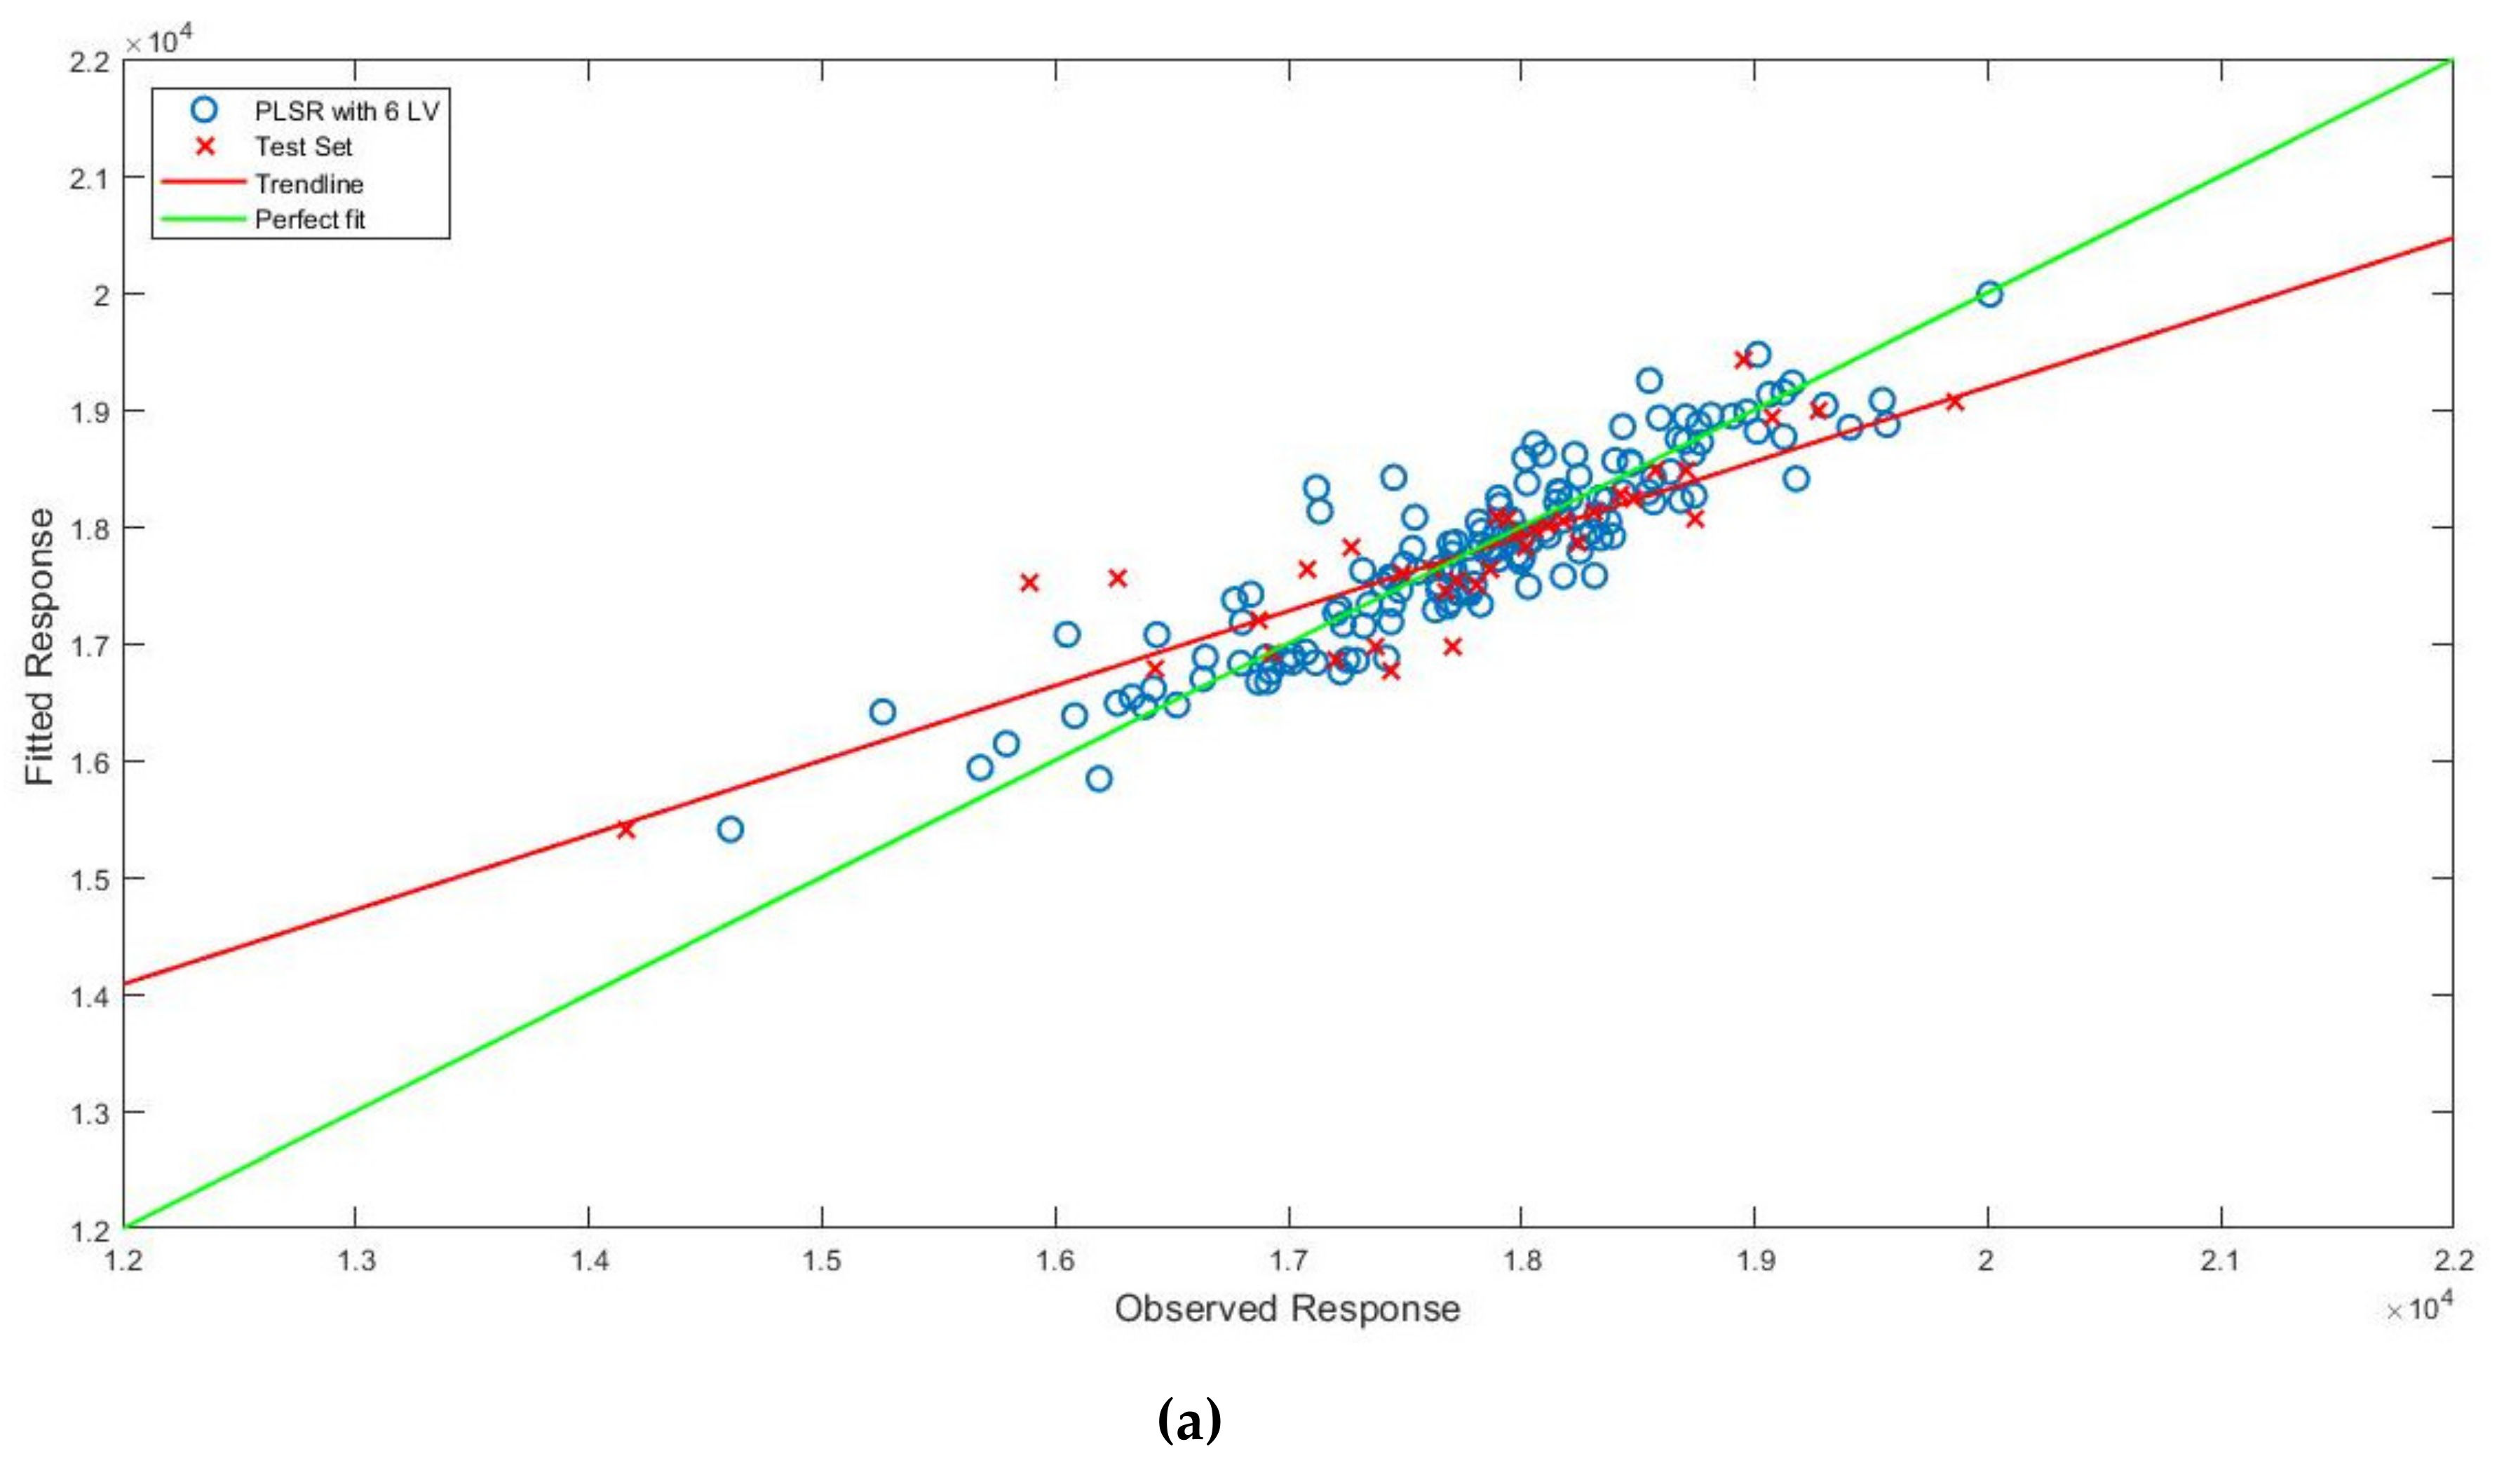
The best model for the prediction of BWC on WDst was developed pretreating the spectra with first derivative (Savitzky-Golay filter, 9-points window, second-order polynomial). One measurement outlier was deleted before model computation by visual assessment of the plot of spectra, while one sample outlier was removed from the training set before PLS computation by investigating residual vs. leverage, observed vs. predicted response and PLS score plots. The model uses three LVs and returned RMSECV = 2.4%; R2cv = 0.65; RMSEP = 2.1% and R2val = 0.74. RER = 10.55 and RPD = 1.94 confirming fair predictive performance of the developed model.
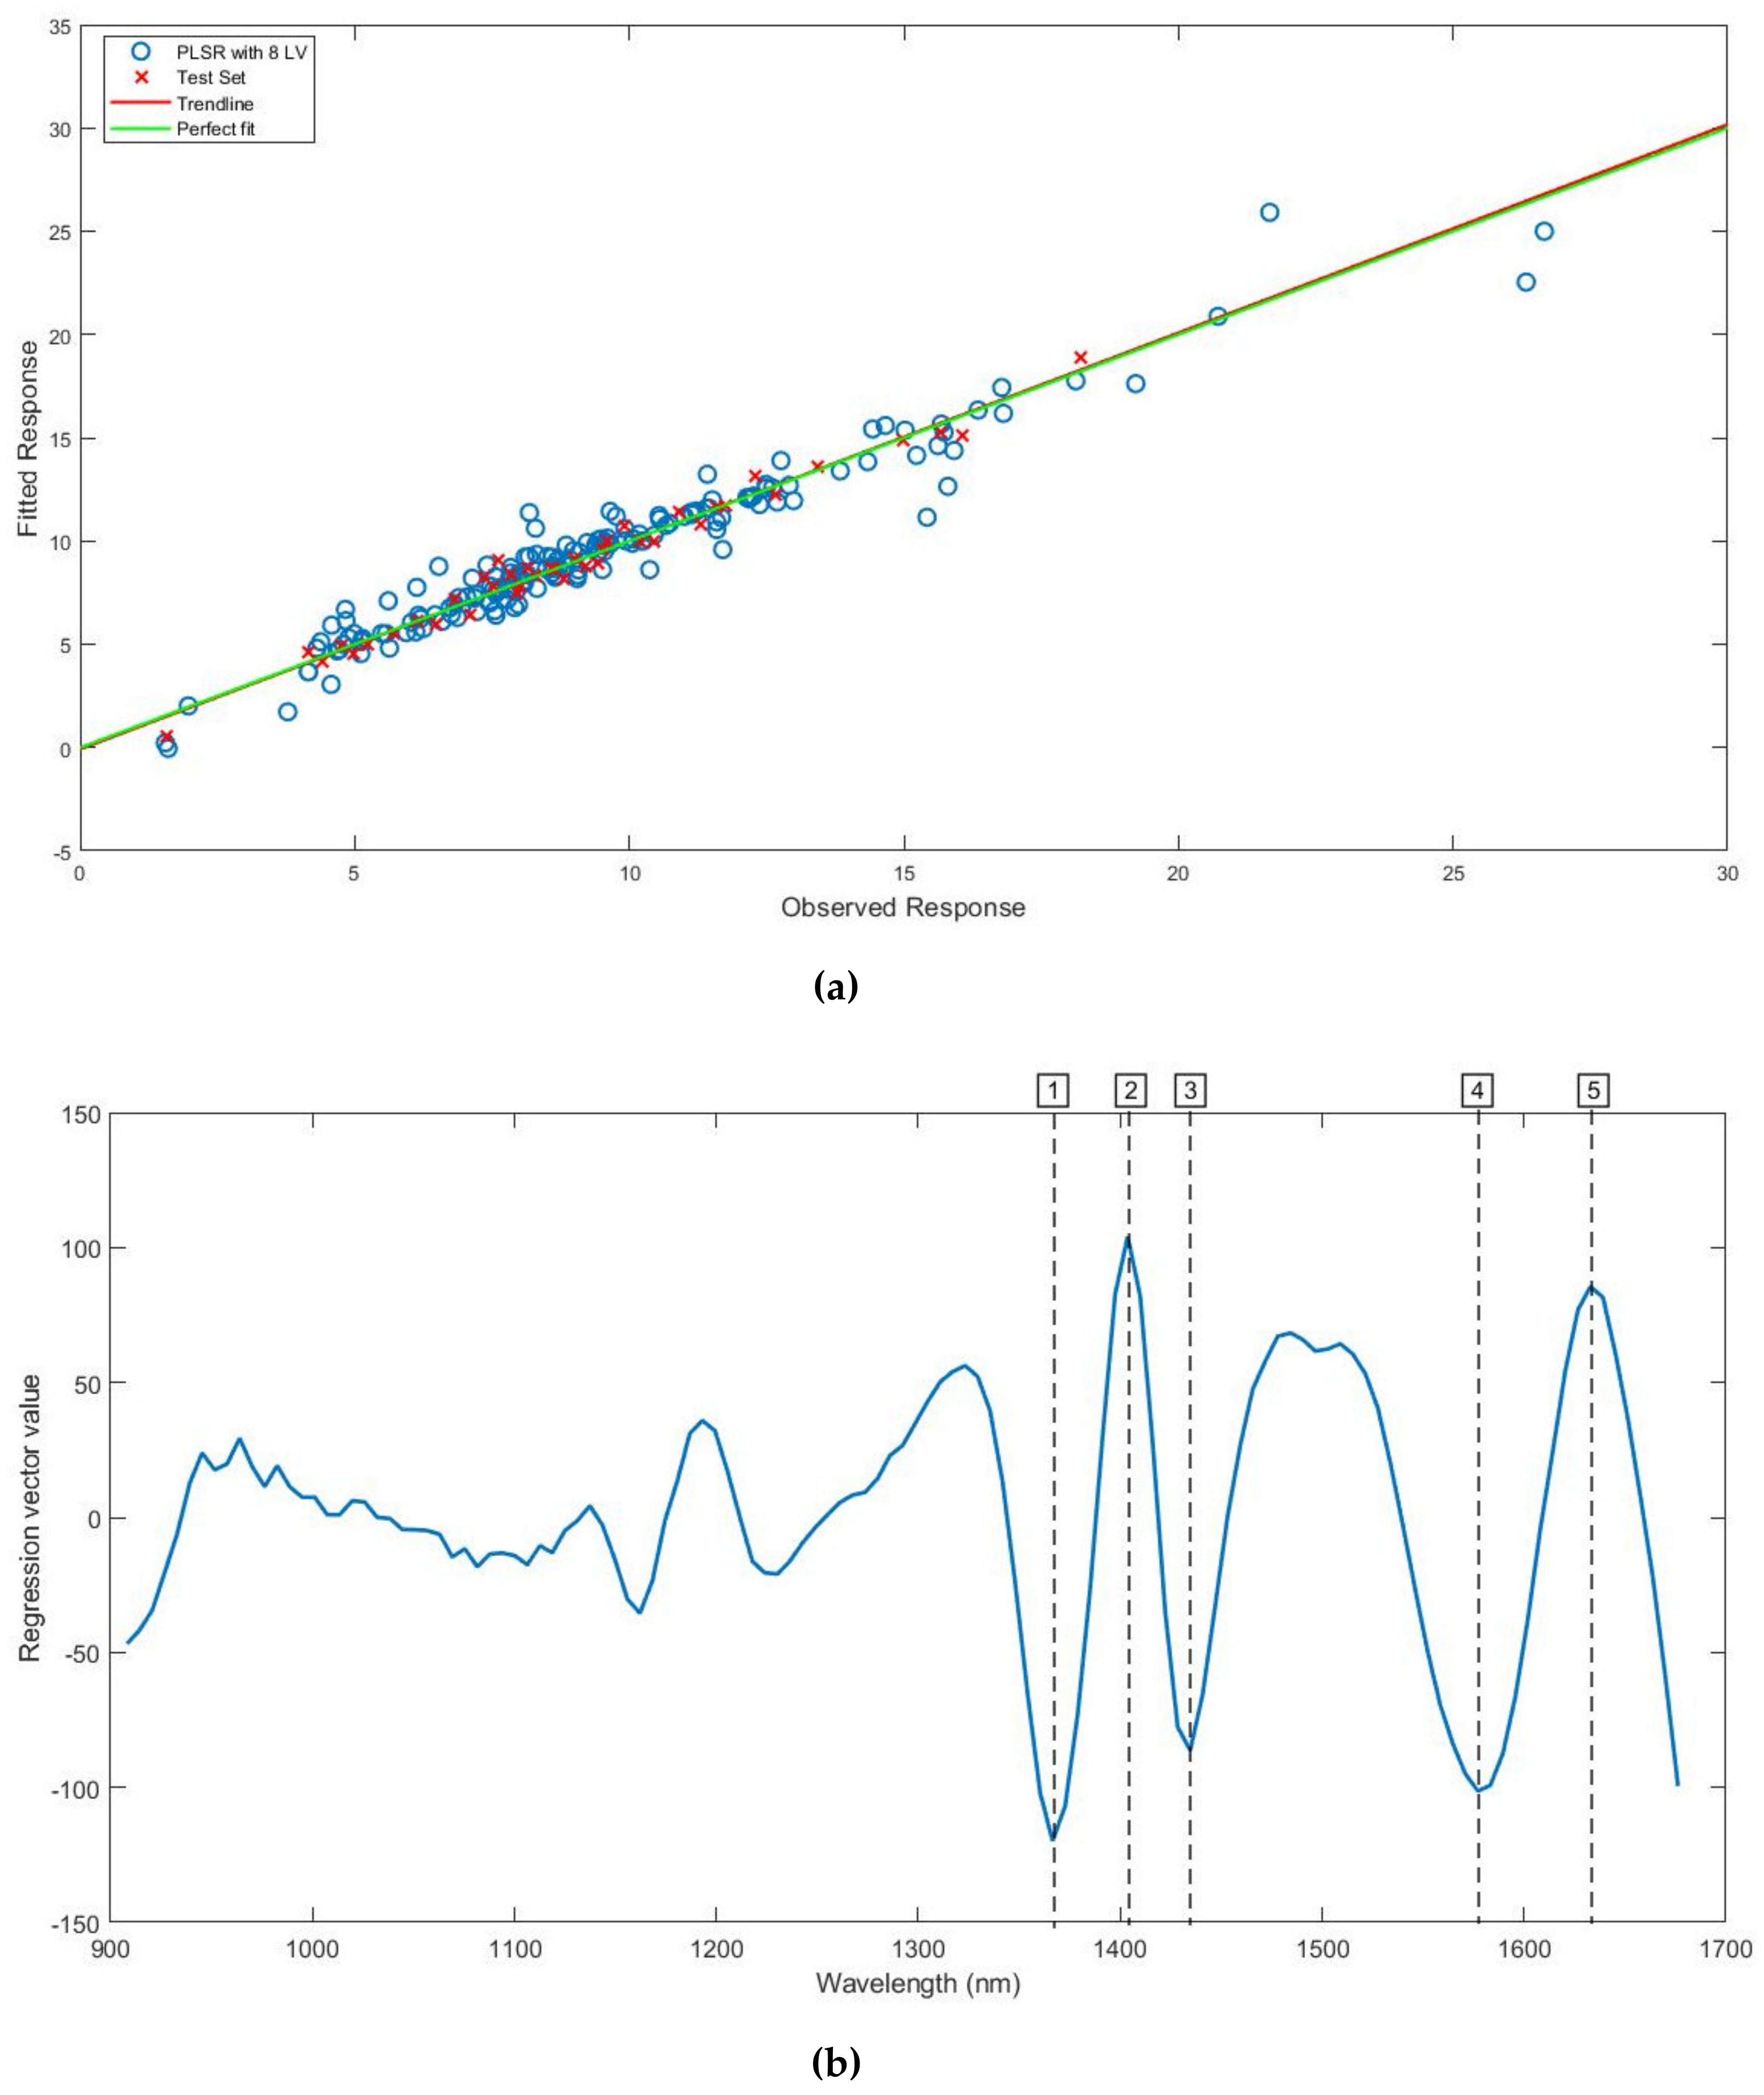
Instead, the best model for the prediction of BWC on WDgr dataset was developed using no pretreatments. As for WDst dataset, one replicate outlier and one sample were removed from the training set for the PLS computation. The model uses eight LVs and returned RMSECV = 0.9%; R2cv = 0.95; RMSEP = 1.0%; R2val = 0.96; RER = 23.17 and RPD = 4.26. All the values confirm the best prediction performance of the WDgr model with respect to WDst model. This could be easily explained as the woodchip material has a higher inherent variability with respect to the ground woodchip; in fact, the grinding process reduced the heterogeneity and the scattering effect during the spectral acquisition. In addition, RER and RPD values confirmed the great predictive performance and the model can be used for quality control applications.
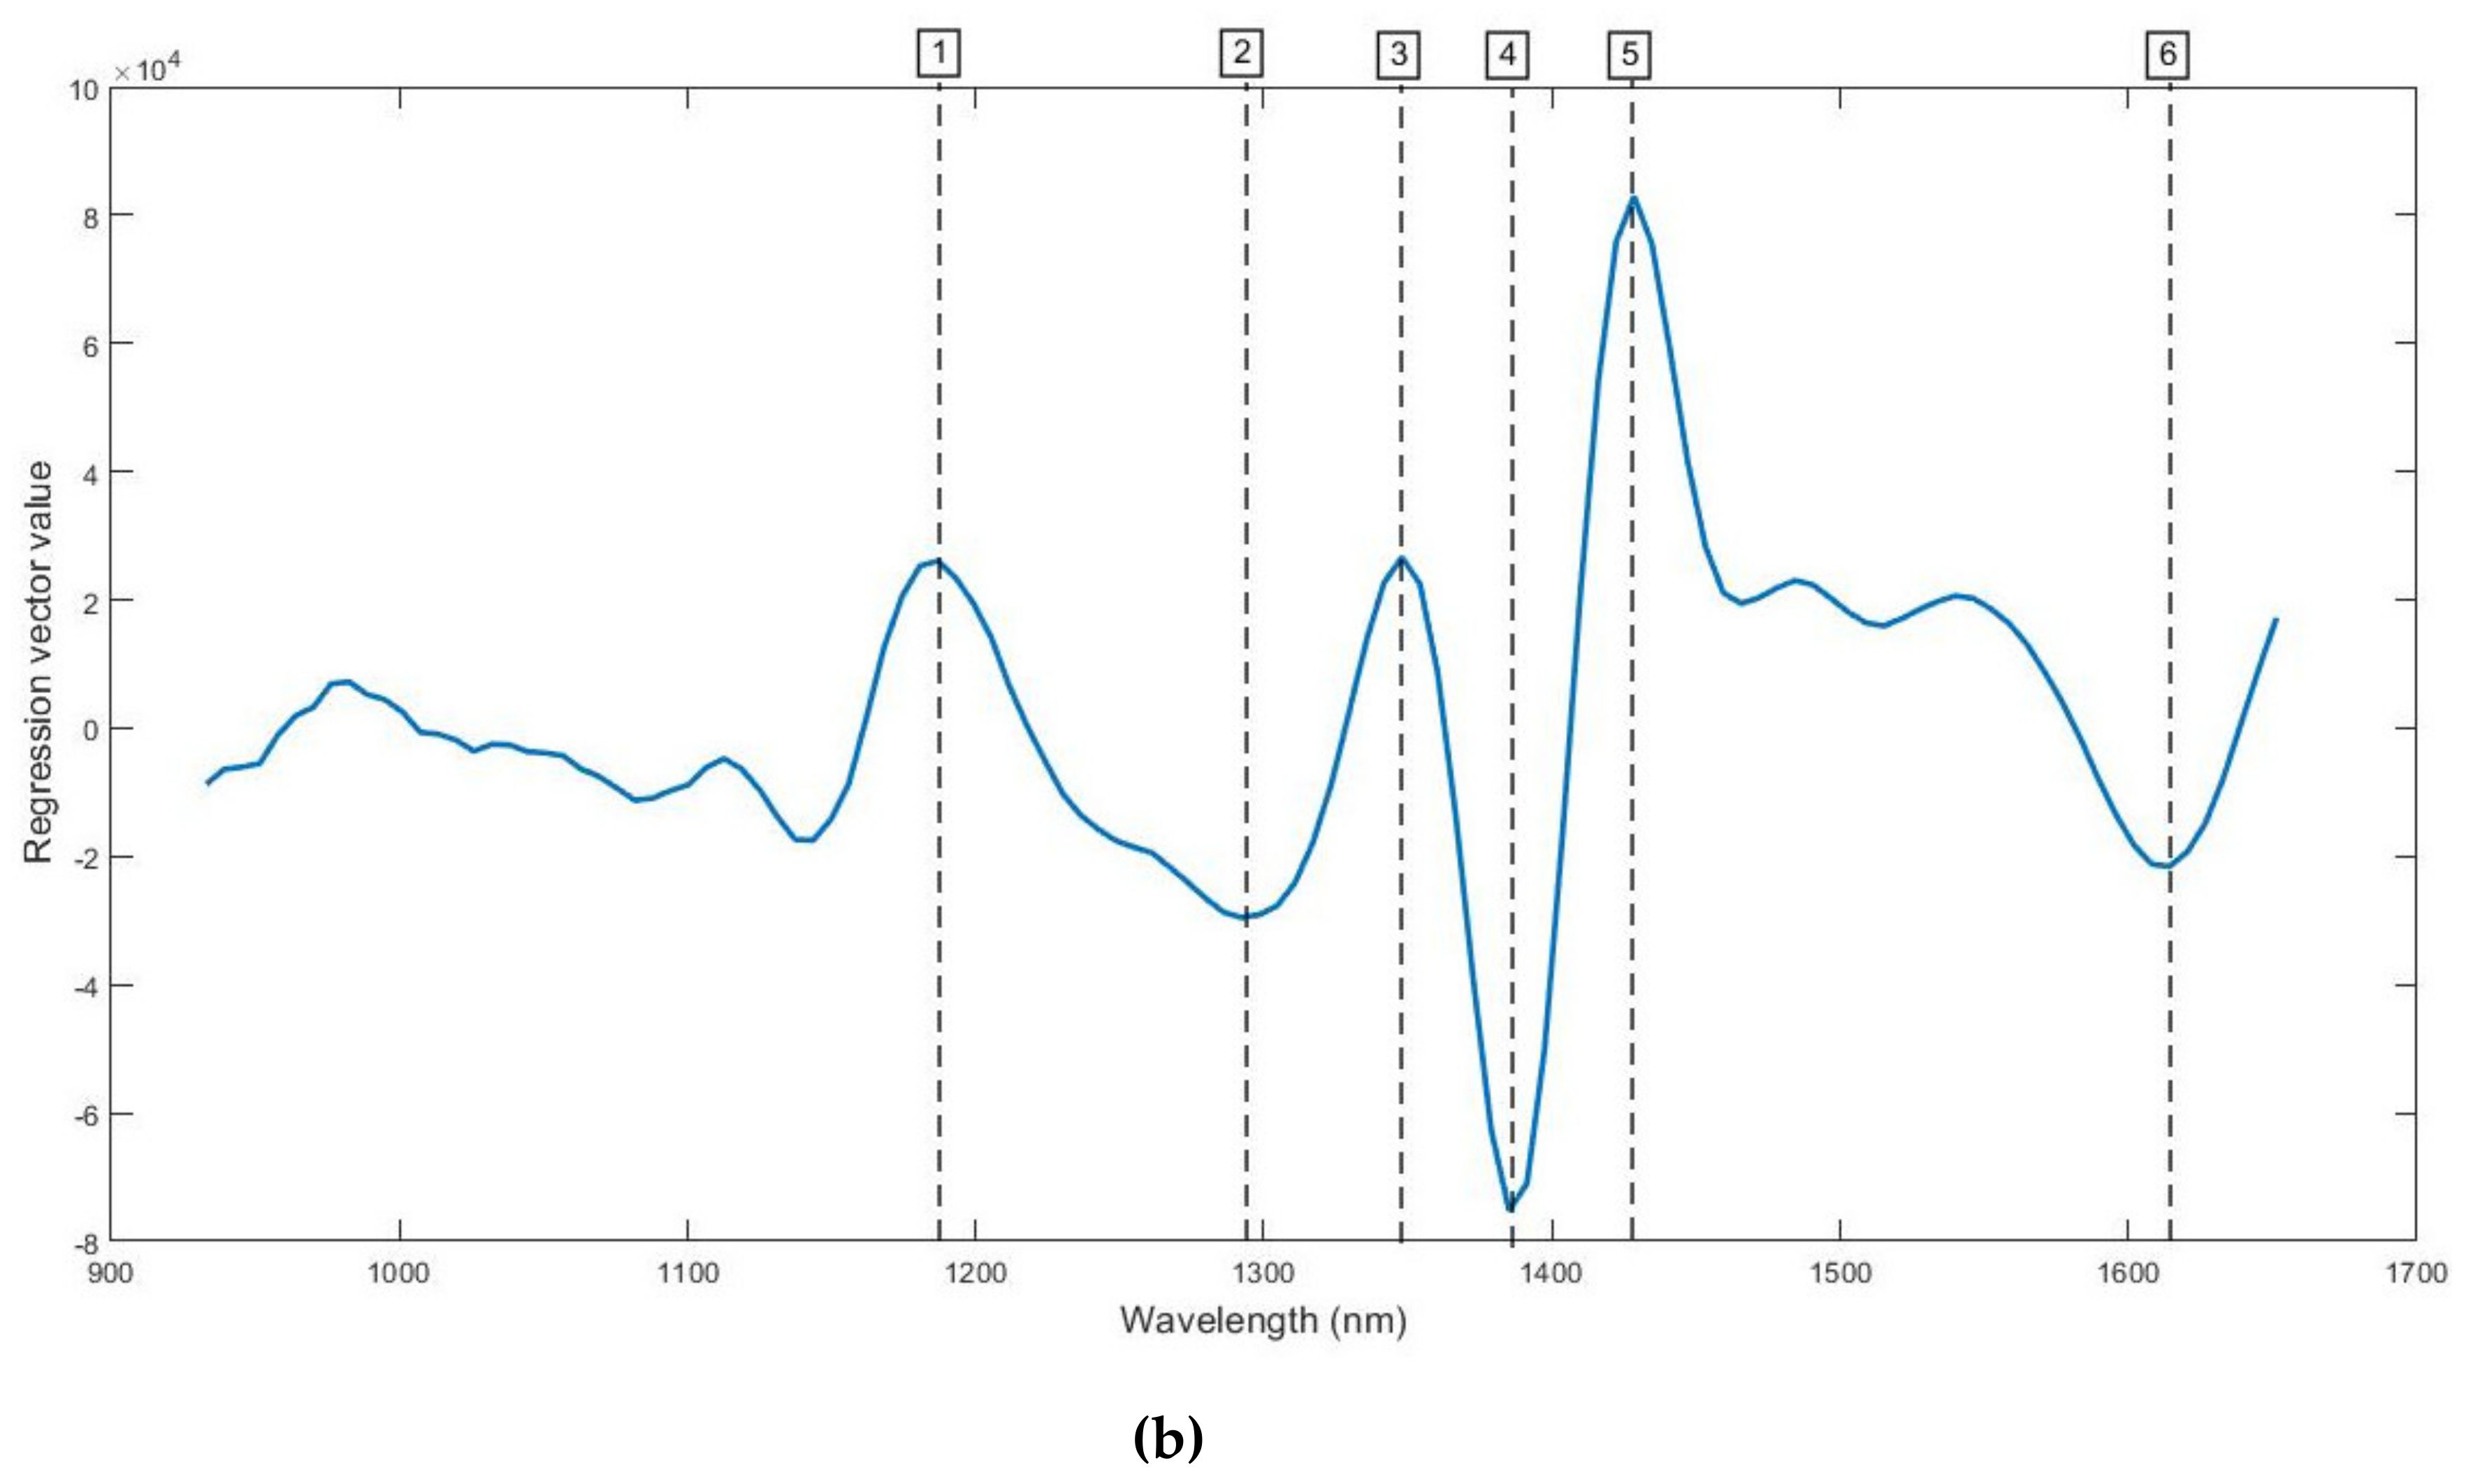
Figure 2a shows the regression plot while Figure 2b shows the corresponding regression vector plot with the most relevant wavelengths highlighted for the prediction of BWC on WDst. With the same structure, Figure 3a shows the regression plot while Figure 3b shows the corresponding regression vector plot of BWC on WDgr.
The peak at 1187 (1st) nm was related to the 2nd overtone of C-H stretching vibrations [39], while the peak at 1298 (2st) nm was likely related to cellulose, corresponding to C-H bending [27]. The peak at 1348 (3st) nm corresponded to the 1st overtone of C-H stretching vibrations and it was related to hemicellulose, while the peak at 1385 (4st) nm was related to water adsorption, corresponding to the 1st overtone of O-H stretching vibrations [39]. The last relevant peak at 1428 (5st) nm was related to lignin presence and corresponded to C-H deformations [27].
Looking at Figure 3b, there are no relevant peaks between 900 and 1360 nm. Peaks near 1200 and 1320 nm could be related to CH3 groups of lignin and hemicellulose [39], but, according to specific regression vector plot, were considered less detectable than peaks between 1366 and 1633 nm. The first more relevant peak at 1366 (1gr) nm was related to methyl groups of cellulose and corresponded to the 1st overtone of C-H stretching and deformation vibrations [42,43]. As reported by [15], moisture prediction could be influenced also by the presence of cellulose. The peak at 1404 (2gr) nm was assigned to water presence and corresponded to the 1st overtone of O-H stretching vibration [9]. Even the peak at 1435 (3gr) nm was related to water, corresponding to the 1st overtone of O-H stretching vibrations, while the peak at 1577 (4gr) nm was related to interchain O-H bonds of cellulose. The last significant peak at 1633 (5gr) nm was related to the 1st overtone of O-H stretching vibrations of cellulose [39].

3.4. Prediction of Ash Content

PLS regression models for the prediction of AC were developed on WDst and WDgr samples pretreating the spectra with different techniques. The PLS models for the ACad prediction on WDst are weaker compared to the prediction models on WDgr. This is also confirmed by the lower R2 and higher RMSEP values. The best model for the prediction of ACad on WDst was developed pretreating the spectra with second derivative (Savitzky-Golay filter, 21-points window, second-order polynomial). The model uses four LVs and returned RMSECV = 1.54%; R2cv = 0.38; RMSEP = 1.42% and R2val = 0.51. RER = 6.94 and RPD = 1.43 confirmed the low predictive performance of the developed model. Likewise, the PLS models for ACdb prediction on WDst are weaker than prediction models on WDgr. In this case, the best model was developed using SNV pretreatment and returned RMSECV = 1.95%; R2cv = 0.39; RMSEP = 1.57% and R2val = 0.55, using six LVs. RER = 7.63 and RPD = 1.49 confirmed the limited predictive performance of the model. The prediction models for AC on WDst turned out to be weak due to higher heterogeneity; such heterogeneity decreased with grinding process.
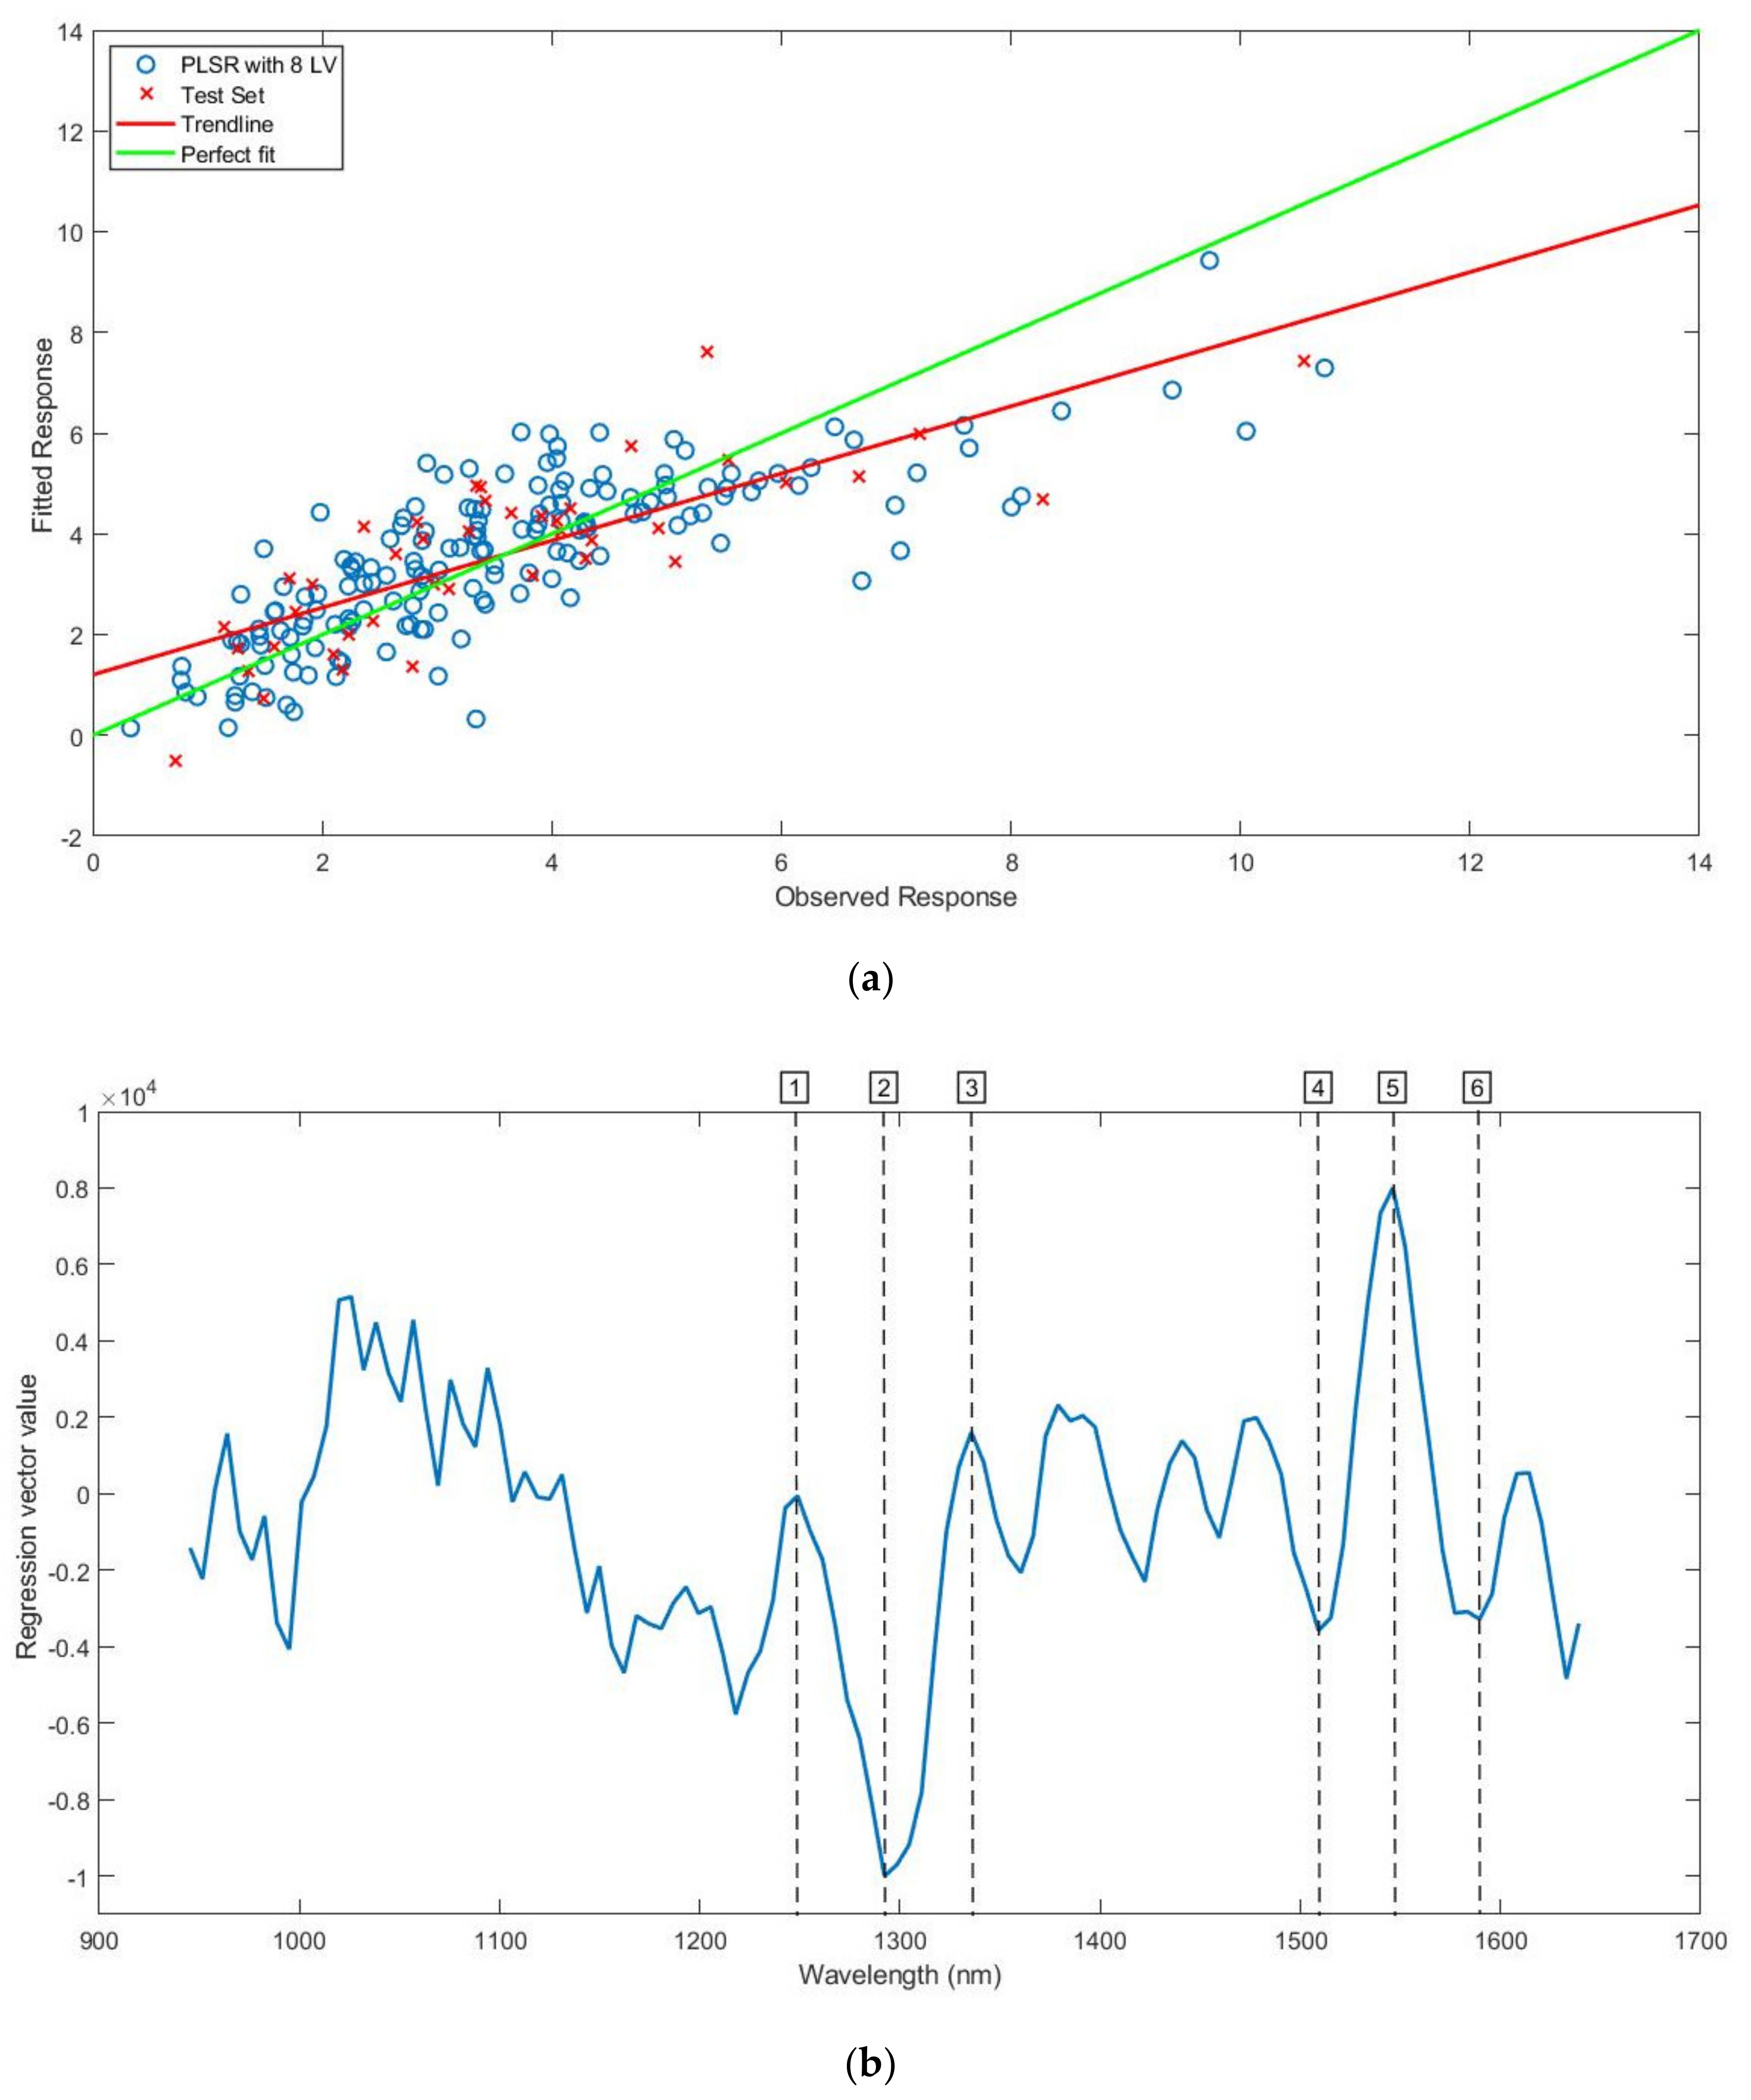
With respect to the prediction of ACad on WDgr dataset the results are reported in Table 3. The best model was also developed removing the replicate outlier detected for BWC model on WDgr. A second derivative with 13 smoothing points (Savitzky-Golay filter, second-order polynomial) was selected as the best pretreatment. In this case, an outlier sample was removed from the training set before PLS computation by looking at the plot of spectra and observed vs. predicted response plot. This model uses eight LVs and returned RMSECV = 1.19%; R2cv = 0.62; RMSEP = 1.23%; R2val = 0.62; RER = 7.98 and RPD = 1.64. As already reported for BWC prediction model, the results confirmed the best prediction performance of the WDgr model compared to WDst model.
Figure 4 shows the regression plot (Figure 4a) and the corresponding regression vector plot (Figure 4b) with the most important wavelengths for the ACad prediction on WDgr marked with dotted lines. In detail, wavelength at 1249 (1) nm was related to cellulose and corresponded to the 2nd overtone of C-H stretching vibrations [39]. The peak at 1292 (2) nm was related to crystalline part of cellulose and corresponded to C-H bending vibrations, while the peak at 1336 (3) nm was related to cellulose and lignin and corresponded to the 1st overtone of C-H stretching and O-H bending vibrations [27]. The peak at 1546 (5) nm was related to cellulose and corresponded to the 1st overtone of C-H stretching vibrations [42]; instead, peaks at 1509 (4) nm and 1589 (6) nm were mainly related to cellulose and corresponded to aromatic ring vibrations [27].
Instead, the best model for ACdb on WDgr was developed removing the same replicate outlier of ACad model and pretreating the spectra using MSC with five LVs (data not shown). Results returned RMSECV = 1.53%; R2cv = 0.53; RMSEP = 1.17% and R2val = 0.75. RER = 10.22 and RPD = 1.99 confirmed the possibility to use the model for rough prediction.
In general, dry basis woodchip samples could easily re-adsorb a small portion of moisture lost due to their empty cells space. As a consequence, the sample is less stable than air-dried woodchip sample, where cell rooms are not completely available and equilibrium moisture content is reached [44]. This is in line with our results.
It is important to underline that the prediction performance of AC model resulted to be less effective than BCW or GCV because ash is the inorganic part of the biomass [6]. Indeed, the chemical bonds associated to inorganic matter are not affected by the radiation source in the NIR region and ash model results to be an indirect prediction [45,46].

3.5. Prediction of Gross Calorific Value

As for AC prediction, different PLS regression models have been developed for the prediction of GCV both on WDst and WDgr samples pretreating the spectra with SNV, MSC and derivatives. Table 4 reports the prediction statistics of the models developed on WDst and WDgr.
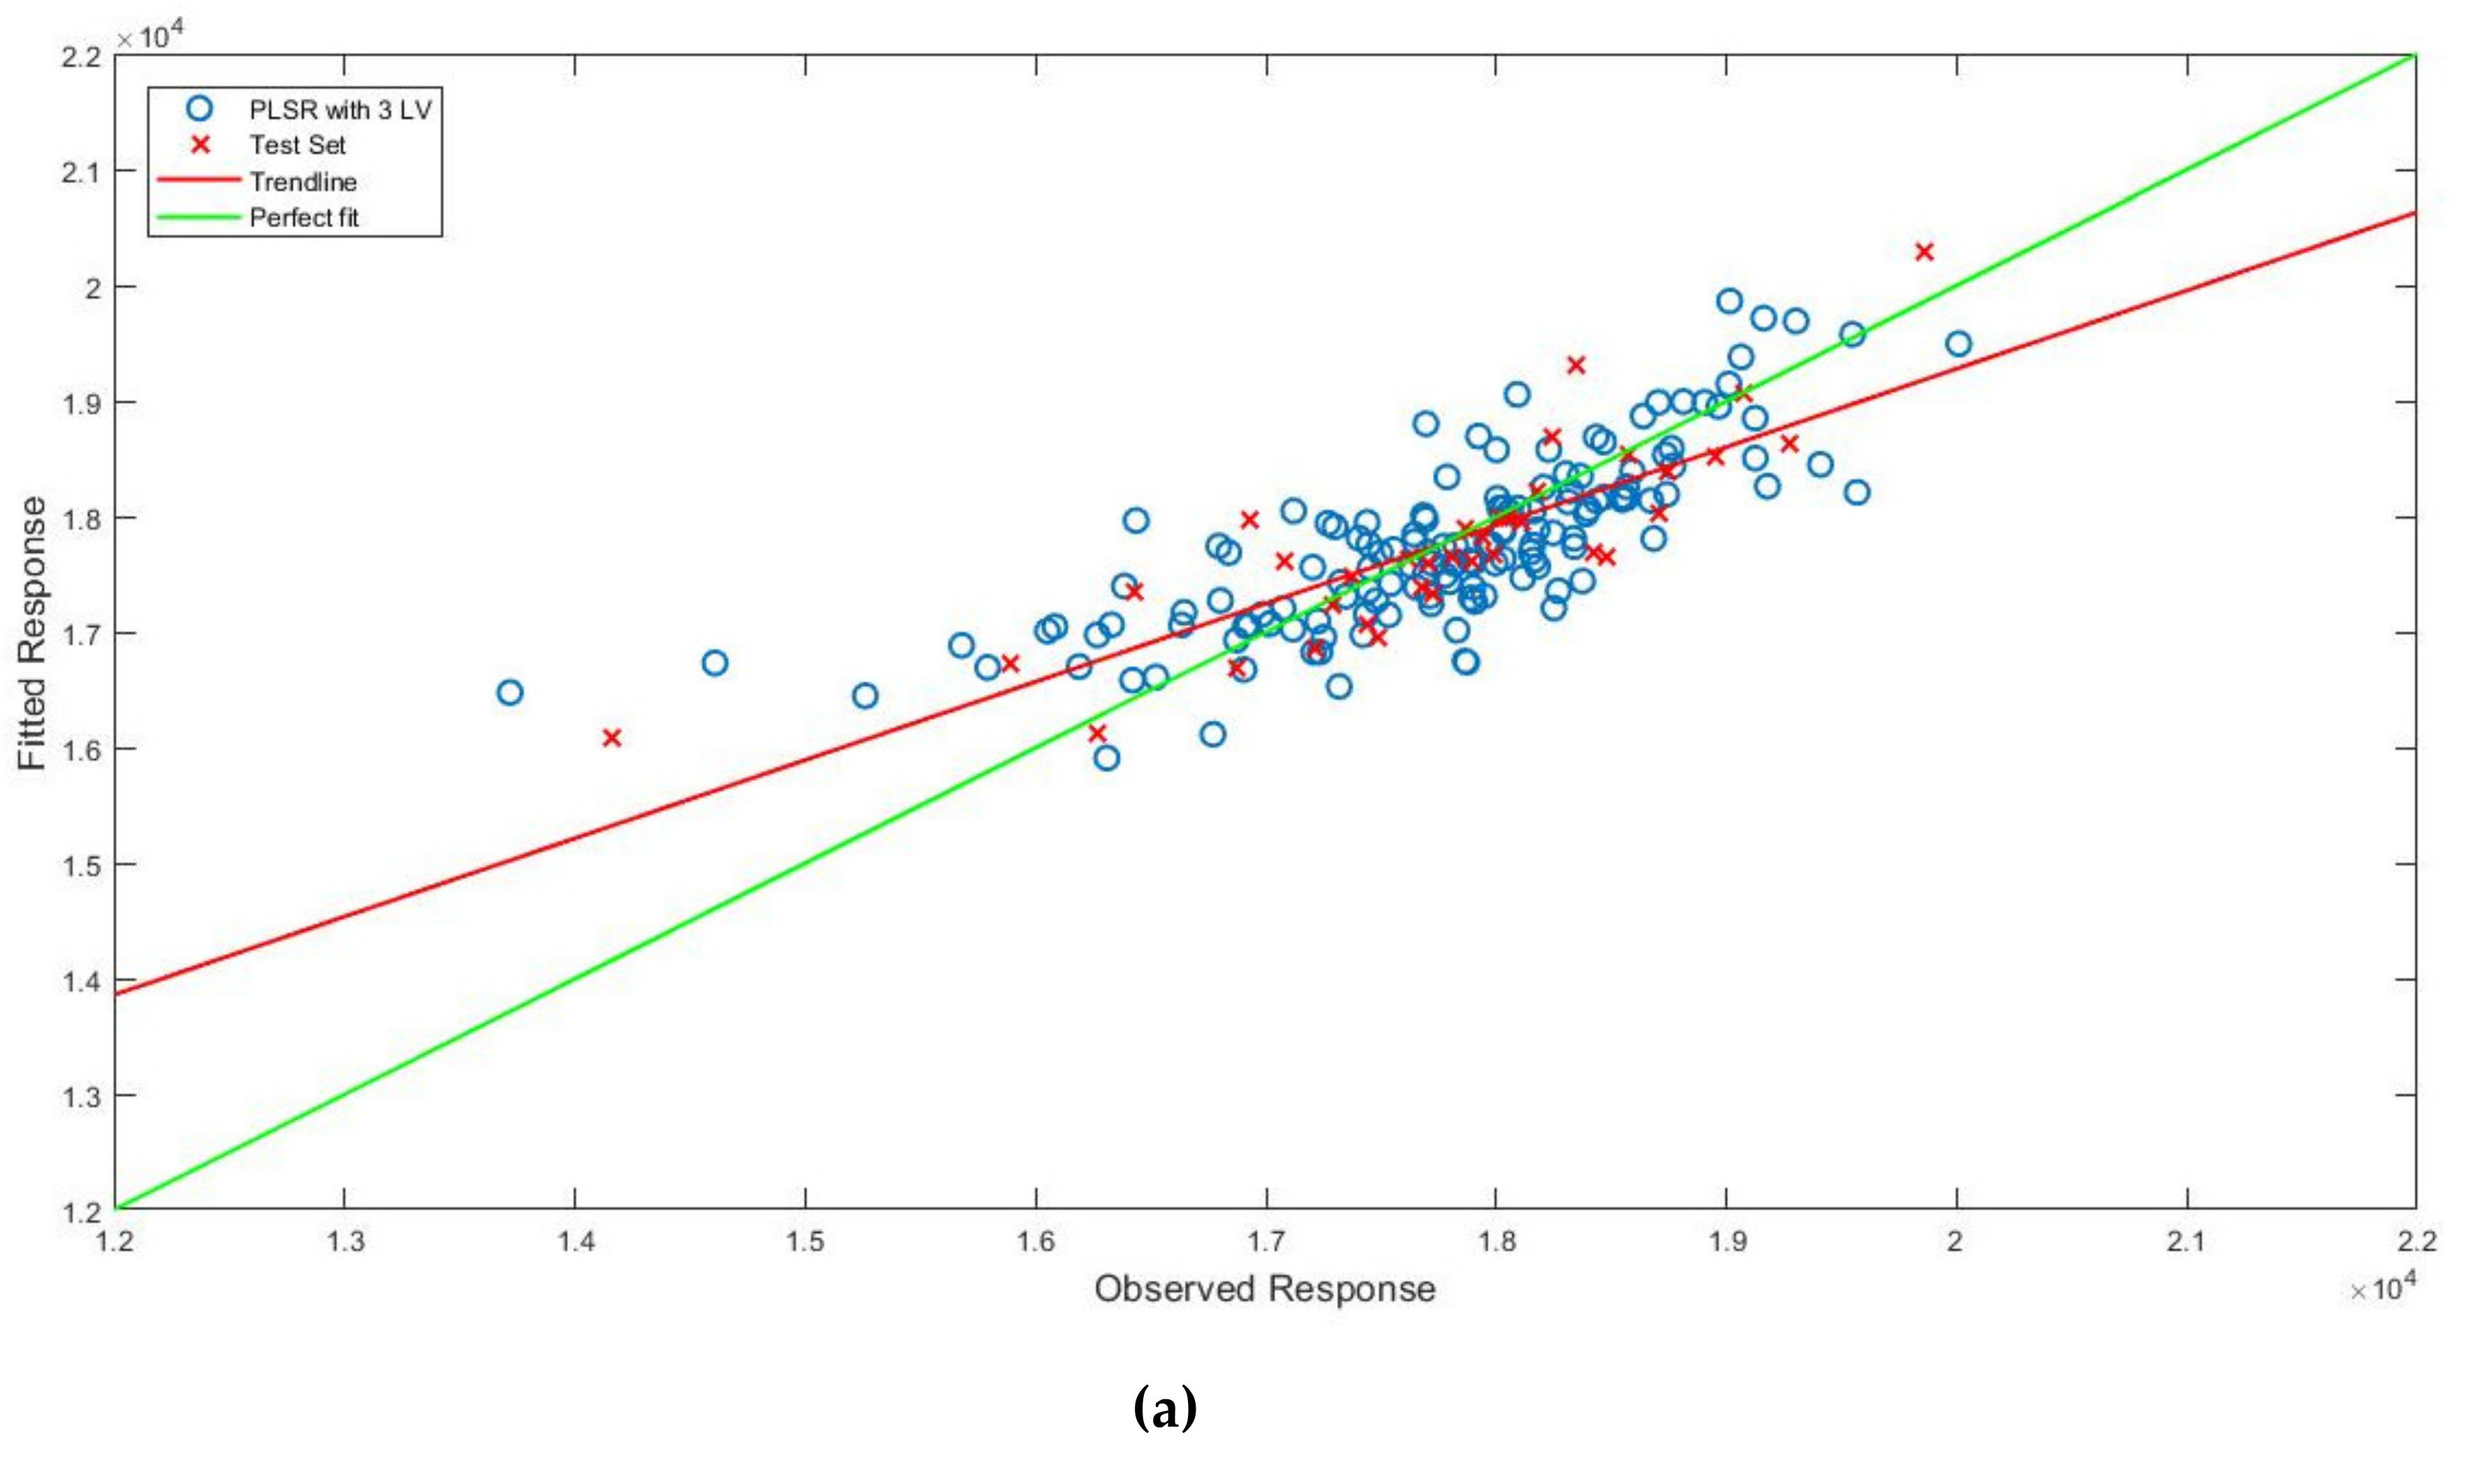
The best model for GCVad prediction on WDst was developed using first derivative (Savitzky-Golay filter, 9-points window, second-order polynomial). Three sample outliers were removed from the dataset; in detail, one sample from the training set and two samples from the test set by visual assessment of the plot of spectra, observed vs. predicted response plot and influence plot. The model gave back RMSECV = 596 J/g; R2cv = 0.59; RMSEP = 563 J/g; R2val = 0.70 and uses three LVs. Considering the RER = 10.12 and RPD = 1.84 the PLS model could be used only for rough quality control applications.
Instead, the best PLS model for the prediction of GCVad on WDgr was developed using the second derivative (Savitzky-Golay filter, 13-points window, second-order polynomial) as pretreatment. Two samples were removed from the training set and two samples from the test set by visual assessment of the plot of spectra and observed vs. predicted response plot. The six LVs model returned RMSECV = 360 J/g; R2cv = 0.83; RMSEP = 528 J/g and R2val = 0.75. RER = 10.78 and RPD = 1.97 values confirmed the possibility to use the model for screening quality control applications.
GCVdb prediction models (data not shown) are worst compared to GCVad. In detail, the best model for GCVdb prediction on WDst was developed using the same pretreatment of GCVad. Two outliers were removed from the training set and one outlier from the test set. The model used four LVs and returned RMSECV = 415 J/g; R2cv = 0.50; RMSEP = 458 J/g and R2val = 0.49. RER = 6.82 and RPD = 1.43 confirmed the less efficient prediction performance.
As for BWC and ACad, the prediction performance is higher for WDgr than for WDst. In detail, the best model for GCVdb on WDgr was developed after removing the same replicate outlier of GCVad on WDgr and using second derivative (Savitzky-Golay filter, 9-points window, second-order polynomial) as pre-treatment. Three sample outliers were removed from the training set before PLS computation. The model used five LVs and returned RMSECV = 402 J/g; R2cv = 0.54; RMSEP = 458 J/g and R2val = 0.48. RER = 5.16 and RPD = 1.41 confirmed that GCVad prediction performance is more efficient than GCVdb.
Figure 5 shows the regression plot (Figure 5a) and corresponding regression vector plot (Figure 5b) with the relevant wavelengths for the GCVad prediction on WDst samples marked with dotted lines. While Figure 6a,b show the regression plot and the regression vector plot for GCVad on WDgr.
The bands for the prediction of GCV were mostly related to C-H bonds (more energetic than C-C bonds) and to O-H bonds; in fact, it is well known the negative correlation between GCV and moisture content [47]. Thus, the first peak at 1187 (1st) nm is related to the 2nd overtone of C-H stretching vibrations of lignin, while the peak at 1385 (4st) nm was related to the 1st overtone of O-H stretching and C-H stretching and deformation vibrations [39]. The band located at 1292 (2st) nm was related to C-H bending vibrations of the crystalline region of cellulose [27], the band at 1348 (3st) nm to the 1st overtone of C-H stretching and deformation of hemicellulose [39], while the peak at 1428 (5st) nm was related to C-H deformation of lignin [27]. Lastly, the peak at 1614 (6st) nm was related to CH2 groups, corresponding to the 1st overtone of C-H stretching vibrations [38].
As for GCV on WDst, a major part of the peaks was related to C-H bonds. The first peak at 1168 (1gr) nm was related to the 2nd overtone of C-H stretching vibrations of lignin, while the peak at 1205 (2gr) nm was related to the 2nd overtone of C-H stretching vibrations of cellulose. Instead, the band at 1497 (5gr) nm was related to the 1st overtone of O-H stretching vibrations of hemicellulose [39]. The peak at 1342 (3gr) nm corresponds to C-H combination bands [9] and the peak at 1379 (4gr) nm to C-H bending vibrations [27]. Lastly, the peak at 1546 (6gr) nm was related to C-H stretching vibrations of cellulose [42].

4. Discussion

The use of handheld MicroNIR spectroscopy to woodchip characterization could be considered as an innovative result. As already stated, several authors demonstrated the possibility to apply NIR spectroscopy for the assessment of quality characteristics, and the advantages of a non-invasive and faster instrument is well-known. For example, different reviews provided several studies about the chemical and physical properties of wood and lignocellulosic biomass in general, including moisture content investigation and bioenergy applications, using benchtop NIR instruments [26,27]. The performance of prediction models was also investigated by different authors, mainly on biofuels from dedicated crops [4,16].
The prediction results of this study could be compared with some studies that investigated the same biofuel quality parameters using benchtop NIR spectroscopy. This is due to the lack of studies on a handheld NIR spectroscopy application on solid biofuel and the fact that this portable instrument is not used in the bioenergy sector. Moreover, few studies could be compared with the current work because they deal with different parameters and/or different solid biofuel typology. For example, a study on Net Calorific Value (NCV) reported a prediction model on stabilized woodchip showing better results (R2cv = 0.92 and RMSECV = 370 J/g), although a lower number of samples was investigated. Nevertheless, in the same study, the ash content prediction model was considered not suitable for quality control and this result is in line with ours [2].
Another study [6] established prediction models for GCV and AC on ground woodchip samples (R2cv = 0.81, RMSECV = 289 J/g and R2cv =0.77 and RMSECV = 0.47 respectively) in line with our performance (R2cv = 0.83 and RMSECV=360 J/g for GCV and R2cv = 0.62 and RMSECV = 1.19 for AC). In this case as well, it is confirmed a lower model performance for AC parameter.

5. Conclusions

This study demonstrated the suitability of NIR spectroscopy and multivariate data analysis for the prediction of three different parameters of woodchip samples. In addition, it provides a remarkable contribution to promote the advantages of NIR as a rapid and non-invasive instrument for predicting woodchip properties. Various prediction models were obtained and their associated regression vector plots were investigated to detect the more important wood components for the assessment of biomass quality, such as cellulose and lignin. Models returned to be acceptable for gross calorific value (R2val = 0.70; RMSEP = 563 J/g on WDst and R2val = 0.75; RMSEP = 528 J/g on WDgr) and good for bound water content (R2val = 0.74; RMSEP = 2.1% on WDst and R2val = 0.96; RMSEP = 1.0% on WDgr). Models show suitable prediction for screening applications. Instead, the prediction model of ash content on WDgr is far from being employed and it could be used in rough and limited quality application (R2val = 0.62; RMSEP = 1.23%).
The results are promising and underline the possibility to develop efficient models for the prediction of woodchip quality parameters, enabling real time analysis and supporting the application of the recent standard UNI/TS 11765. MicroNIR is a handheld instrument and, with respect to benchtop devices, it has the great advantage to be used for on-site utilization. It means that, for example, constant quality evaluation could be ensured by integrating different control points along the biomass conveyor, allowing continuous quality control thanks to precise, on point measurements.
The applications of MicroNIR could represent a strength point in the monitoring of biofuel quality especially in big power plants still struggling with the evaluation of properties of the solid biofuel supplied. The lower cost of NIR analyses and its fast performance allow applying very accurate sampling procedures, resulting in a series of significant advantages, e.g., more accurate commercial evaluation of the solid biofuel and better management in power plant.

Author Contributions

Conceptualization, G.T. and D.D.; methodology, E.L. and M.M.; software, E.L.; validation, E.L.; formal analysis, E.L.; investigation, E.L., D.D. and M.M.; resources, G.T.; data curation, E.L.; writing—original draft preparation, E.L. and M.M.; writing—review and editing, E.L., D.D. and M.M.; visualization, E.L.; supervision, G.T.; project administration, G.T.; funding acquisition, G.T. All authors have read and agreed to the published version of the manuscript.

Funding

This research received no external funding.

Conflicts of Interest

The authors declare no conflict of interest.

References

  1. PricewaterhouseCoopers. Sustainable and Optimal Use of Biomass for Energy in the EU beyond 2020; VITO: Mol, Belgium; Utrecht University: Utrecht, The Netherlands; TU Vienna: Vienna, Austria; INFRO: Celle, Germany; Rütter Soceco & PwC: Rüschlikon, Switzerland, 2017. [Google Scholar]
  2. Mancini, M.; Duca, D.; Toscano, G. Laboratory customized online measurements for the prediction of the key-parameters of biomass quality control. J. Near Infrared Spectrosc. 2019, 27, 15–25. [Google Scholar] [CrossRef]
  3. Manzone, M.; Calvo, A. Woodchip transportation: Climatic and congestion influence on productivity, energy and CO2 emission of agricultural and industrial convoys. Renew. Energy 2017, 108, 250–259. [Google Scholar] [CrossRef]
  4. Fagan, C.C.; Everard, C.D.; McDonnell, K. Prediction of moisture, calorific value, ash and carbon content of two dedicated bioenergy crops using near-infrared spectroscopy. Bioresour. Technol. 2011, 102, 5200–5206. [Google Scholar] [CrossRef]
  5. Toscano, G.; Leoni, E.; Feliciangeli, G.; Duca, D.; Mancini, M. Application of ISO standards on sampling and effects on the quality assessment of solid biofuel employed in a real power plant. Fuel 2020, 278, 118142. [Google Scholar] [CrossRef]
  6. Mancini, M.; Rinnan, Å.; Pizzi, A.; Toscano, G. Prediction of gross calorific value and ash content of woodchip samples by means of FT-NIR spectroscopy. Fuel Process. Technol. 2018, 169, 77–83. [Google Scholar] [CrossRef]
  7. Toscano, G.; Duca, D.; Pedretti, E.F.; Pizzi, A.; Rossini, G.; Mengarelli, C.; Mancini, M. Investigation of woodchip quality: Relationship between the most important chemical and physical parameters. Energy 2016, 106, 38–44. [Google Scholar] [CrossRef]
  8. Demirbas, A. Relationships between Heating Value and Lignin, Moisture, Ash and Extractive Contents of Biomass Fuels. Energy Explor. Exploit. 2002, 20, 105–111. [Google Scholar] [CrossRef]
  9. Mancini, M.; Toscano, G.; Rinnan, Å. Study of the scattering effects on NIR data for the prediction of ash content using EMSC correction factors. J. Chemom. 2019, 33, e3111. [Google Scholar] [CrossRef]
  10. Kelley, S.S.; Rials, T.G.; Snell, R.; Groom, L.H.; Sluiter, A. Use of near infrared spectroscopy to measure the chemical and mechanical properties of solid wood. Wood Sci. Technol. 2004, 38, 257–276. [Google Scholar] [CrossRef]
  11. Georgieva, M.; Nebojan, I.; Mihalev, K.; Yoncheva, N. Application of NIR spectroscopy and chemometrics in quality control of wild berry fruit extracts during storage. Croat. J. Food Technol. Biotechnol. Nutr. 2013, 8, 67–73. [Google Scholar]
  12. Mancini, M.; Taavitsainen, V.-M.; Toscano, G. Comparison of three different classification methods performance for the determination of biofuel quality by means of NIR spectroscopy. J. Chemom. 2019, 33, e3145. [Google Scholar] [CrossRef]
  13. Blanco, M.; Villarroya, I. NIR spectroscopy: A rapid-response analytical tool. TrAC Trends Anal. Chem. 2002, 21, 240–250. [Google Scholar] [CrossRef]
  14. UNI. Biocombustibili Solidi—Linee Guida per la Determinazione della Qualità Mediante Spettrometria nel Vicino Infrarosso; UNI/TS 11765:2019; Ente Nazionale Italiano di Unificazione: Milano, Italy, 2019. [Google Scholar]
  15. Posom, J.; Sirisomboon, P. Evaluation of the moisture content of Jatropha curcas kernels and the heating value of the oil-extracted residue using near-infrared spectroscopy. Biosyst. Eng. 2015, 130, 52–59. [Google Scholar] [CrossRef]
  16. Everard, C.D.; McDonnell, K.P.; Fagan, C.C. Prediction of biomass gross calorific values using visible and near infrared spectroscopy. Biomass Bioenergy 2012, 45, 203–211. [Google Scholar] [CrossRef]
  17. Pasquini, C. Near infrared spectroscopy: A mature analytical technique with new perspectives—A review. Anal. Chim. Acta 2018, 1026, 8–36. [Google Scholar] [CrossRef]
  18. Correia, R.M.; Domingos, E.; Cáo, V.M.; Araujo, B.R.; Sena, S.; Pinheiro, L.U.; Fontes, A.M.; Aquino, L.F.M.; Ferreira, E.C.; Filgueiras, P.R.; et al. Portable near infrared spectroscopy applied to fuel quality control. Talanta 2018, 176, 26–33. [Google Scholar] [CrossRef] [PubMed]
  19. Basri, K.N.; Hussain, M.N.; Bakar, J.; Sharif, Z.; Khir, M.F.A.; Zoolfakar, A.S.; Basri, K.N. Classification and quantification of palm oil adulteration via portable NIR spectroscopy. Spectrochim. Acta Part A Mol. Biomol. Spectrosc. 2017, 173, 335–342. [Google Scholar] [CrossRef]
  20. Yan, H.; Lu, D.-L.; Chen, B.; Hansen, W.G. Development of a Hand-Held near Infrared System Based on an Android OS and MicroNIR, and its Application in Measuring Soluble Solids Content in Fuji Apples. NIR News 2014, 25, 16–19. [Google Scholar] [CrossRef]
  21. Mancini, M.; Mazzoni, L.; Gagliardi, F.; Balducci, F.; Duca, D.; Toscano, G.; Mezzetti, B.; Capocasa, F. Application of the Non-Destructive NIR Technique Quality Parameters. Foods 2020, 9, 441. [Google Scholar] [CrossRef] [Green Version]
  22. Sun, Z.; Li, C.; Li, L.; Nie, L.; Dong, Q.; Li, D.; Gao, L.; Zang, H. Study on feasibility of determination of glucosamine content of fermentation process using a micro NIR spectrometer. Spectrochim. Acta Part A Mol. Biomol. Spectrosc. 2018, 201, 153–160. [Google Scholar] [CrossRef]
  23. Alcalà, M.; Blanco, M.; Moyano, D.; Broad, N.W.; O’Brien, N.; Friedrich, D.; Pfeifer, F.; Siesler, H.W. Qualitative and Quantitative Pharmaceutical Analysis with a Novel Hand-Held Miniature near Infrared Spectrometer. J. Near Infrared Spectrosc. 2013, 21, 445–457. [Google Scholar] [CrossRef] [Green Version]
  24. Yu, H.; Zhao, R.; Fu, F.; Fei, B.; Jiang, Z. Prediction of mechanical properties of Chinese fir wood by near infrared spectroscopy. Front. For. China 2009, 4, 368–373. [Google Scholar] [CrossRef]
  25. Pasquini, C. Near Infrared Spectroscopy: Fundamentals, practical aspects and analytical applications. J. Braz. Chem. Soc. 2003, 14, 198–219. [Google Scholar] [CrossRef] [Green Version]
  26. Tsuchikawa, S.; Kobori, H. A review of recent application of near infrared spectroscopy to wood science and technology. J. Wood Sci. 2015, 61, 213–220. [Google Scholar] [CrossRef] [Green Version]
  27. Feng, X.; Jianming, Y.; Tesfaye, T.; Floyd, D.; Donghai, W. Qualitative and quantitative analysis of lignocellulosic biomass using infrared spectroscopy. Appl. Energy 2013, 40, 1–10. [Google Scholar] [CrossRef]
  28. Nakamura, K.; Hatakeyama, T.; Hatakeyama, H. Studies on bound water of cellulose by differential scanning calorimetry. Text. Res. J. 1981, 51. [Google Scholar] [CrossRef]
  29. Park, S.; Venditti, R.A.; Jameel, H.; Pawlak, J.J. Hard to remove water in cellulose fibers characterized by high resolution thermogravimetric analysis—Methods development. Cellulose 2006, 13, 23–30. [Google Scholar] [CrossRef]
  30. Li, X.; Wei, Y.; Xu, J.; Xu, N.; He, Y. Quantitative visualization of lignocellulose components in transverse sections of moso bamboo based on FTIR macro- and micro-spectroscopy coupled with chemometrics. Biotechnol. Biofuels 2018, 11, 263. [Google Scholar] [CrossRef] [Green Version]
  31. Diniz, C.P.; Grattapaglia, D.; Mansfield, S.D.; Figueiredo, L.F.D.A. Near-infrared-based models for lignin syringyl/guaiacyl ratio of Eucalyptus benthamii and E. pellita using a streamlined thioacidolysis procedure as the reference method. Wood Sci. Technol. 2019, 53, 521–533. [Google Scholar] [CrossRef] [Green Version]
  32. Sandak, J.; Sandak, A.; Zitek, A.; Hintestoisser, B.; Picchi, G. Development of Low-Cost Portable Spectrometers for Detection of Wood Defects. Sensors 2020, 20, 545. [Google Scholar] [CrossRef] [Green Version]
  33. Huang, C.; Han, L.; Yang, Z.; Liu, X. Ultimate analysis and heating value prediction of straw by near infrared spectroscopy. Waste Manag. 2009, 29, 1793–1797. [Google Scholar] [CrossRef] [PubMed]
  34. Posom, J.; Saechua, W. Prediction of elemental components of ground bamboo using micro-NIR spectrometer. IOP Conf. Series Earth Environ. Sci. 2019, 301, 012063. [Google Scholar] [CrossRef] [Green Version]
  35. Williams, P.; Norris, K. Near-Infrared Technology in the Agricultural and Food Industries; American Association of Cereal Chemists, Inc.: St. Paul, MN, USA, 1987; ISBN 091325049X. [Google Scholar]
  36. Fagan, C.; Everard, C.; O’Donnell, C.P.; Downey, G.; Sheehan, E.; Delahunty, C.; O’Callaghan, D.J. Evaluating Mid-infrared Spectroscopy as a New Technique for Predicting Sensory Texture Attributes of Processed Cheese. J. Dairy Sci. 2007, 90, 1122–1132. [Google Scholar] [CrossRef]
  37. Sørensen, L.K. Application of reflectance near infrared spectroscopy for bread analyses. Food Chem. 2009, 113, 1318–1322. [Google Scholar] [CrossRef]
  38. Davrieux, F.; Baillères, H.; Ham-Pichavant, F. Near infrared analysis as a tool for rapid screening of some major wood characteristics in a eucalyptus breeding program. Ann. For. Sci. 2002, 59, 479–490. [Google Scholar] [CrossRef] [Green Version]
  39. Schwanninger, M.; Rodrigues, J.C.; Fackler, K. A Review of Band Assignments in near Infrared Spectra of Wood and Wood Components. J. Near Infrared Spectrosc. 2011, 19, 287–308. [Google Scholar] [CrossRef]
  40. Alves, A.; Santos, A.J.; Rozenberg, P.; Pâques, L.E.; Charpentier, J.-P.; Schwanninger, M.; Rodrigues, J. A common near infrared—Based partial least squares regression model for the prediction of wood density of Pinus pinaster and Larix × eurolepis. Wood Sci. Technol. 2010, 46, 157–175. [Google Scholar] [CrossRef]
  41. Sandak, A.; Różańska, A.; Sandak, J.; Riggio, M. Near infrared spectroscopic studies on coatings of 19th century wooden parquets from manor houses in South-Eastern Poland. J. Cult. Heritage 2015, 16, 508–517. [Google Scholar] [CrossRef] [Green Version]
  42. Sandak, J.; Sandak, A.; Pauliny, D.; Krasnoshlyk, V.; Hagman, O. Near Infrared Spectroscopy as a Tool for Estimation of Mechanical Stresses in Wood. Adv. Mater. Res. 2013, 778, 448–453. [Google Scholar] [CrossRef] [Green Version]
  43. Fujimoto, T.; Kurata, Y.; Matsumoto, K.; Tsuchikawa, S. Feasibility of near-infrared spectroscopy for online multiple trait assessment of sawn lumber. J. Wood Sci. 2010, 56, 452–459. [Google Scholar] [CrossRef]
  44. Glass, S.V.; Zelinka, S.L. Physical Properties and Moisture Relations of Wood. Wood Handbook: Wood as an engeneering material. In General Technical Report FPL; US Department of Agriculture, Forest Service, Forest Products Laboratory: Madison, WI, USA, 2010. [Google Scholar]
  45. Andrés, J.M.; Bona, M. Analysis of coal by diffuse reflectance near-infrared spectroscopy. Anal. Chim. Acta 2005, 535, 123–132. [Google Scholar] [CrossRef]
  46. Stuart, B.H. Inorganic molecules. In Infrared Spectroscopy: Fundamentals and Applications; John Wiley & Sons Inc.: Hoboken, NJ, USA, 2005; pp. 95–111. ISBN 9780470011140. [Google Scholar]
  47. Gillespie, G.D.; Everard, C.D.; McDonnell, K.P. Prediction of biomass pellet quality indices using near infrared spectroscopy. Energy 2015, 80, 582–588. [Google Scholar] [CrossRef]
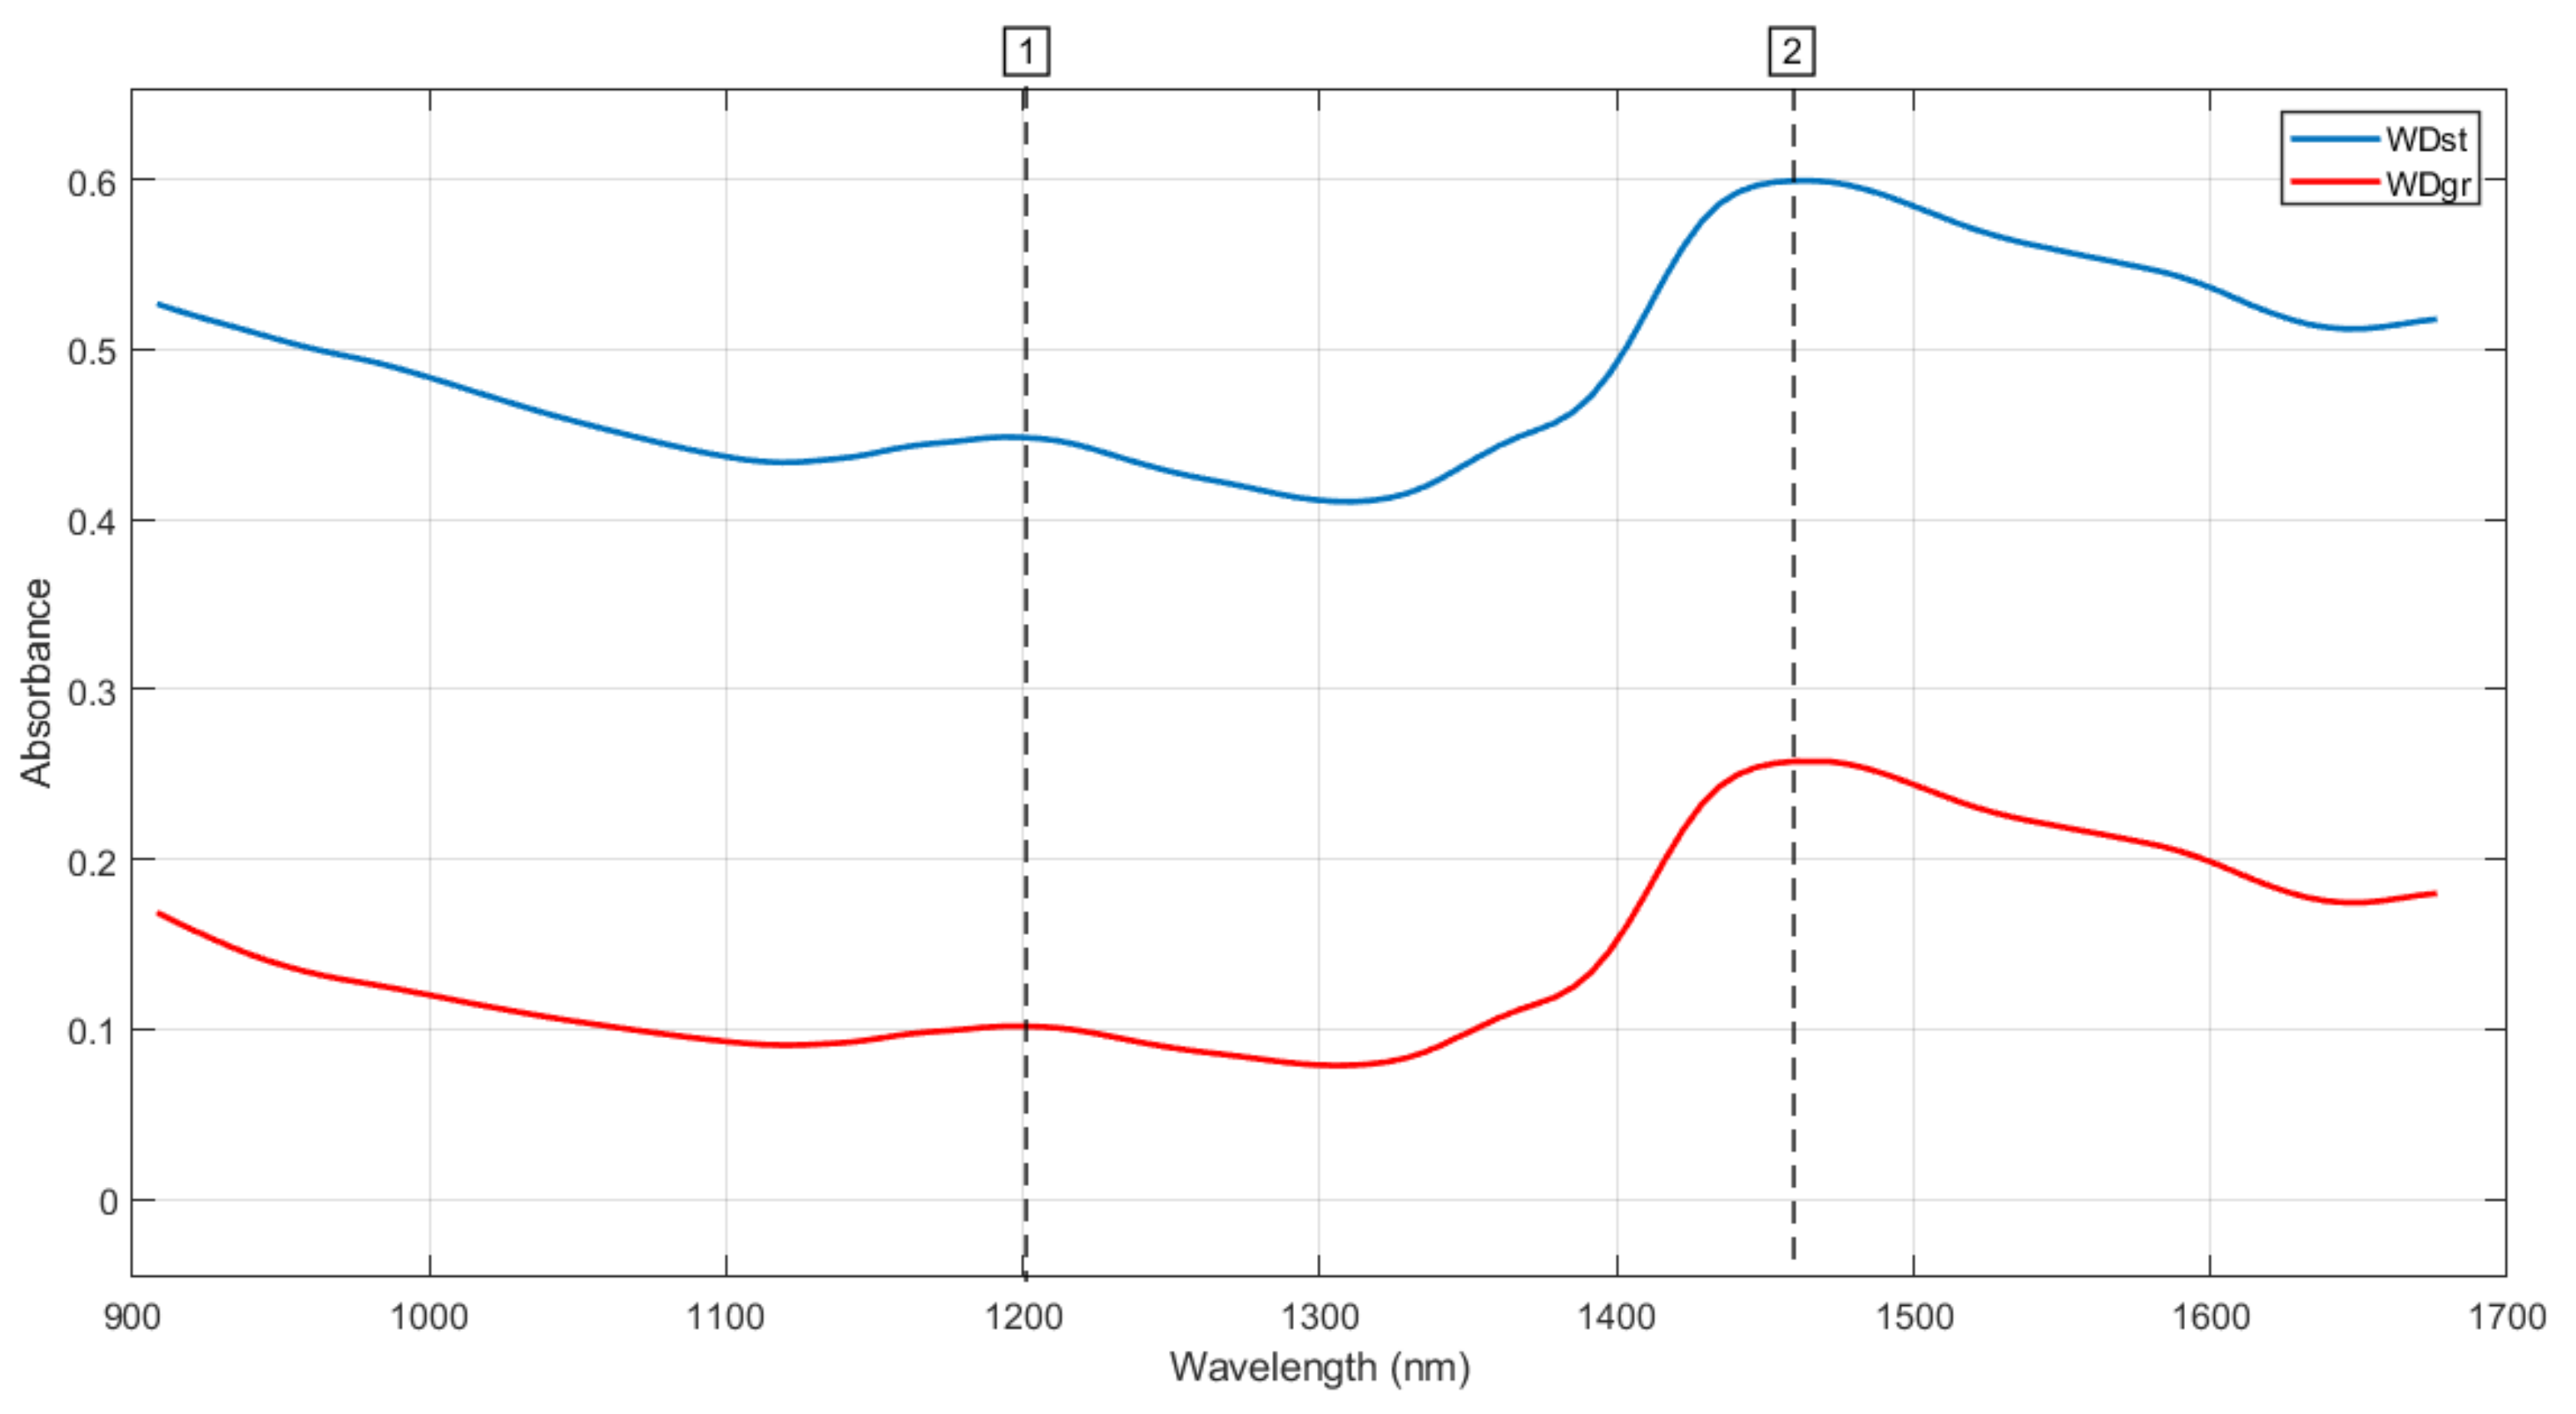
Figure 1. Average spectra of WDst samples (blue line) and WDgr samples (red line). The most important spectra peaks are highlighted with lines and corresponding numbers.
Processes 08 01413 g001
Figure 2. (a) Partial least squares regression plot for the prediction of BWC on WDst. Spectra were pre-processed by first order derivation using the Savitzky-Golay algorithm with nine smoothing points and three latent variables; (b) Corresponding regression vector plot using vertical lines and numbers to highlight the most important wavelengths.
Processes 08 01413 g002
Figure 3. (a) Partial least squares regression plot for the prediction of BWC on WDgr. Raw spectra were pre-processed with no pretreatments using eight latent variables; (b) Corresponding regression vector plot using vertical lines and numbers to highlight the most important wavelengths.
Processes 08 01413 g003
Figure 4. (a) Partial least squares regression plot for the prediction of ACad on WDgr. Spectra were pre-processed by second order derivation using the Savitzky-Golay algorithm with 13 smoothing points and 8 latent variables; (b) Corresponding regression vector plot using vertical lines and numbers to highlight the most important wavelengths.
Processes 08 01413 g004
Figure 5. (a) Partial least squares regression plot for the prediction of GCVad on WDst. Spectra were pre-processed using first derivative (Savitzky-Golay filter, 9-points window, second-order polynomial) using three latent variables; (b) Corresponding regression vector plot using vertical lines and numbers to discriminate the most important wavelengths.
Processes 08 01413 g005aProcesses 08 01413 g005b
Figure 6. (a) Partial least squares regression plot for the prediction of GCVad on WDgr. Spectra were pre-processed using second derivative (Savitzky-Golay filter, 13-points window, second-order polynomial) using six latent variables; (b) Corresponding regression vector plot using vertical lines and numbers to discriminate the most important wavelengths.
Processes 08 01413 g006aProcesses 08 01413 g006b
Table 1. Descriptive statistics results of gross calorific value (GCV), ash content (AC) and bound water content (BWC) of WDst and WDgr samples both on air-dried (ad) and dry basis material (db).
GCVad (J/g)GCVdb (J/g)ACad (%)ACdb (%)BWC (%)
DataTrainTestDataTrainTestDataTrainTestDataTrainTestDataTrainTest
MEAN1776617770177541970619707197013.653.663.614.054.064.029.59.59.4
STD195493710306346346452.152.182.032.452.482.344.14.14.1
MIN1371713717141631774217742180440.330.330.720.360.360.801.61.61.6
MAX20008200081985622138221382116516.5116.5110.5618.0018.0012.8026.726.724.0
RANGE62916291569343964396312116.1816.189.8417.6417.6412.0025.125.122.4
1 Standard deviation.
Table 2. Summary of the PLS regression models developed for the prediction of BWC on WDst (A) and WDgr (B). The best models are highlighted in bold. The vertical line in bold is used to divide calibration (on the left) and validation (on the right) results.
NLVs5R2cvRMSECVNLVsR2valRMSEPBiasSlopeRERRPD
Mean (A)16650.622.54250.732.22.99 × 10−140.64210.401.91
SNV116730.502.94230.722.2−1.61 × 10−150.62910.121.86
MSC216730.433.14230.772.27.32 × 10−150.58110.431.92
9der1316630.652.44230.742.11.69 × 10−160.65910.551.94
13der116630.542.84230.732.2−5.92 × 10−160.58310.061.85
21der116650.622.54250.752.1−4.23 × 10−160.65510.771.98
9der2416630.652.44230.722.2−4.23 × 10−170.63310.141.87
13der216520.662.44220.702.3−6.34 × 10−160.6409.931.83
21der216520.632.54220.692.38.88 × 10−160.6199.731.79
Mean (B)16680.950.94280.961.01.27 × 10−150.83723.174.26
SNV116670.911.24270.970.7−4.63 × 10−151.01632.643.55
MSC216580.941.04280.941.4−1.07 × 10−141.18316.072.96
9der1316660.950.94260.961.09.31 × 10−160.82422.334.11
13der116650.941.04250.901.4−1.90 × 10−150.79916.593.05
21der116650.911.24250.871.57.61 × 10−160.77014.582.68
9der2416660.950.94260.921.3−5.29 × 10−150.78017.463.21
13der216660.950.94260.931.2−2.96 × 10−150.80318.553.41
21der216660.950.94260.951.1−8.46 × 10−160.81320.363.75
1 Standard normal variate; 2 multiplicative scatter correction; 3 Xder1: first derivative with X number of smoothing points; 4 Xder2: second derivative with X number of smoothing points; 5 number of latent variables.
Table 3. Summary of the PLS regression models developed for the prediction of ash content on air-dried ground woodchip material (WDgr). The best model is highlighted in bold. The vertical line in bold is used to divide calibration (on the left) and validation (on the right) results.
NLVs5R2cvRMSECVNLVsR2valRMSEPBiasSlopeRERRPD
Mean16660.571.284260.521.39−3.40 × 10−150.5267.081.46
SNV116680.621.204280.541.37−3.64 × 10−150.4997.201.48
MSC216650.591.244250.511.41−2.24 × 10−150.4616.981.44
9der1316690.611.214290.531.382.45 × 10−150.5467.151.47
13der116690.611.224290.551.35−1.48 × 10−150.5467.311.51
21der116670.601.234270.541.35−1.71 × 10−150.5307.271.50
9der2416690.651.144290.551.36−3.72 × 10−150.6557.221.49
13der216680.621.194280.621.23−1.12 × 10−150.6667.981.64
21der216680.611.224280.571.31−5.29 × 10−150.5967.491.54
1 Standard normal variate; 2 multiplicative scatter correction; 3 Xder1: first derivative with X number of smoothing points; 4 Xder2: second derivative with X number of smoothing points; 5 number of latent variables.
Table 4. Summary of the PLS regression models developed for the prediction of gross calorific value on air-dried woodchip material (WDst) (A) and on air-dried ground woodchip material (WDgr) (B). The best models are highlighted in bold. The vertical line in bold is used to divide calibration (on the left) and validation (on the right) results.
NLVs5R2cvRMSECVNLVsR2valRMSEPBiasSlopeRERRPD
Mean (A)14950.586043650.70561−1.21 × 10120.66110.141.85
SNV115030.506623830.51713−1.77 × 10−120.5427.571.44
MSC214940.546343740.507324.57 × 10−120.5137.781.43
9der1314930.595963630.70563−3.54 × 10−130.67810.121.84
13der114930.586053730.626222.26 × 10−120.6509.151.65
21der114930.556283730.626241.52 × 10−120.6299.131.65
9der2414930.605893630.68579−2.02 × 10−130.6879.841.79
13der214930.595963630.69570−1.01 × 10−130.6689.991.82
21der214930.586043730.616311.72 × 10−120.6389.031.63
Mean (B)14960.784343760.64624−9.34 × 10−130.7449.121.65
SNV115050.833883750.71550−3.44 × 10−130.72310.351.87
MSC215060.843743760.715449.83 × 10−140.70810.471.89
9der1314970.843783770.69571−3.44 × 10−130.7859.961.80
13der114970.823953770.67603−1.97 × 10−130.7879.441.70
21der114980.824003780.646298.36 × 10−130.7689.061.63
9der2414860.833583660.745331.97 × 10−120.64110.681.95
13der214860.833603660.755281.92 × 10−120.63910.781.97
21der214970.833843770.715455.90 × 10−130.75710.451.89
1 Standard normal variate; 2 multiplicative scatter correction; 3 Xder1: first derivative with X number of smoothing points; 4 Xder2: second derivative with X number of smoothing points; 5 number of latent variables.
Publisher’s Note: MDPI stays neutral with regard to jurisdictional claims in published maps and institutional affiliations.