Article

Numerical and Experimental Study on the Internal Flow of the Venturi Injector

1
Research Center of Fluid Machinery Engineering and Technology, Jiangsu University, Zhenjiang 212013, China
2
Farmland Irrigation Research Institute, Chinese Academy of Agricultural Sciences, Xinxiang 453002, China
3
School of Agricultural Engineering and Food Science, Shandong University of Technology, Zibo 255049, China
*
Authors to whom correspondence should be addressed.
Processes 2020, 8(1), 64; https://doi.org/10.3390/pr8010064
Submission received: 30 October 2019 / Revised: 26 December 2019 / Accepted: 27 December 2019 / Published: 2 January 2020
(This article belongs to the Special Issue Smart Flow Control Processes in Micro Scale)

Abstract

:
To study the appropriate numerical simulation methods for venturi injectors, including the investigation of the hydraulic performance, mixing process, and the flowing law of the two internal fluids, simulations and experiments were conducted in this study. In the simulations part, the cavitation model based on the standard k–ε turbulence and mixture models was added, after convergence of the calculations. The results revealed that the cavitation model has good agreement with the experiment. However, huge deviations occurred between the experimental results and the ones from the calculation when not considering the cavitation model after cavitation. Thus, it is inferred that the cavitation model can exactly predict the hydraulic performance of a venturi injector. In addition, the cavitation is a crucial factor affecting the hydraulic performance of a venturi injector. The cavitation can ensure the stability of the fertilizer absorption of the venturi injector and can realize the precise control of fertilization by the venturi injector, although it affects the flow stability and causes energy loss. Moreover, this study found that the mixing chamber and throat are the main areas of energy loss. Furthermore, we observed that the internal flow of the venturi injector results in the majority of mixing taking place at the diffusion and outlet sections.

1. Introduction

Fertigation is becoming increasingly common, and fertilizer devices are becoming increasingly important [1]. A venturi injector, a commonly used device for fertilizer application, uses the turbulent diffusion of the jet to transfer energy and mass. This injector is broadly applied in fertigation systems because of its advantages such as simple structure, convenient operation, low cost, and no need for external power [2,3,4]. However, the internal flow involves the mixing of two flows with different pressures, although the internal structure of the venturi injector is simple with no moving parts. Thus, the internal flow is complex, energy loss is large, and the mass transfer energy efficiency is low [5], making it necessary to assess the flow characteristics of the venturi injector.
To date, venturi injectors have been studied widely, especially focusing on fertilizer absorption performance [6,7,8]. Neto and Porto [9] observed that the area ratio of a venturi injector exerts a major impact on the fertilizer suction efficiency; the authors also presented a simple methodology for the design and construction of low-cost ejectors from PVC, to reduce costs and enhance the fertilizer suction performance of fertigation systems. Ozkan et al. [10] investigated venturi injectors’ structure parameters, including the impact of the inlet diameter, the diameter of the suction pipe, and the ratio of the throat diameter to the inlet diameter. In a field experiment, Parish et al. [11] investigated the injection methods, injection rate, and solution volume on the fertigation uniformity and reported that venturi injectors have a better fertilizer distribution and that the injection rate exerts a significant impact on the fertilizer distribution uniformity. Li et al. [12] investigated the performance of three different fertilization devices (venturi injector, proportional pump, and differential pressure tank) in laboratory and field experiments of a micro-irrigation system; they reported that the type of fertilization device and the manufacturing variability of emitters exert a considerable impact on the fertilizer distribution uniformity.
Using dynamics theory [13,14] for model analysis and modern testing and signal processing technology [15,16] has become a common research tool these days. With the technological advancement of computers and computational fluid dynamics (CFD), complex flows that could previously only be acquired by experimental methods can be simulated precisely [17,18,19], especially the internal flow fields in fluid machinery and microfluidics [20,21], such as two-phase flow [22,23,24], pressure fluctuation [25], energy loss [26,27,28], and so on. Other studies have mainly focused on the flow inside venturi injectors. Huang et al. [29,30] numerically analyzed the influence of the structural parameters on the absorption capacity. Yan et al. [31] used a high-speed video camera to investigate the development of the cavitation inside a venturi injector. Zwart et al. [32] presented a new multiphase flow algorithm to predict cavitation and validate the transient cavitation in a venturi. Simpson and Ranade [33] developed CFD models to simulate the cavitating flow in various venturi injectors. Shi et al. [34] established a semi-empirical model to predict cavitation in different venturi injectors. Furthermore, Dastane et al. [35] developed a CFD modeling scheme to successfully simulate flows in a cavitating venturi. Various study reports on venturi injectors revealed that CFD methods have been used extensively to investigate the impact of key structure and working parameters on the performance, including the diffusion, shape of the nozzle, ratio of the throat length to diameter, and contraction ratio [36,37,38,39]. However, few studies have focused on the effect of the mixing process between water and fertilizer liquid. Of note, the mixing process seriously affects the uniformity of the water and fertilizer distribution in the irrigation system, necessitating further investigation. Hence, this study aims to extend the solution method and test the reliability of calculated models. Moreover, this study investigates the mixing of two flows with different pressures.

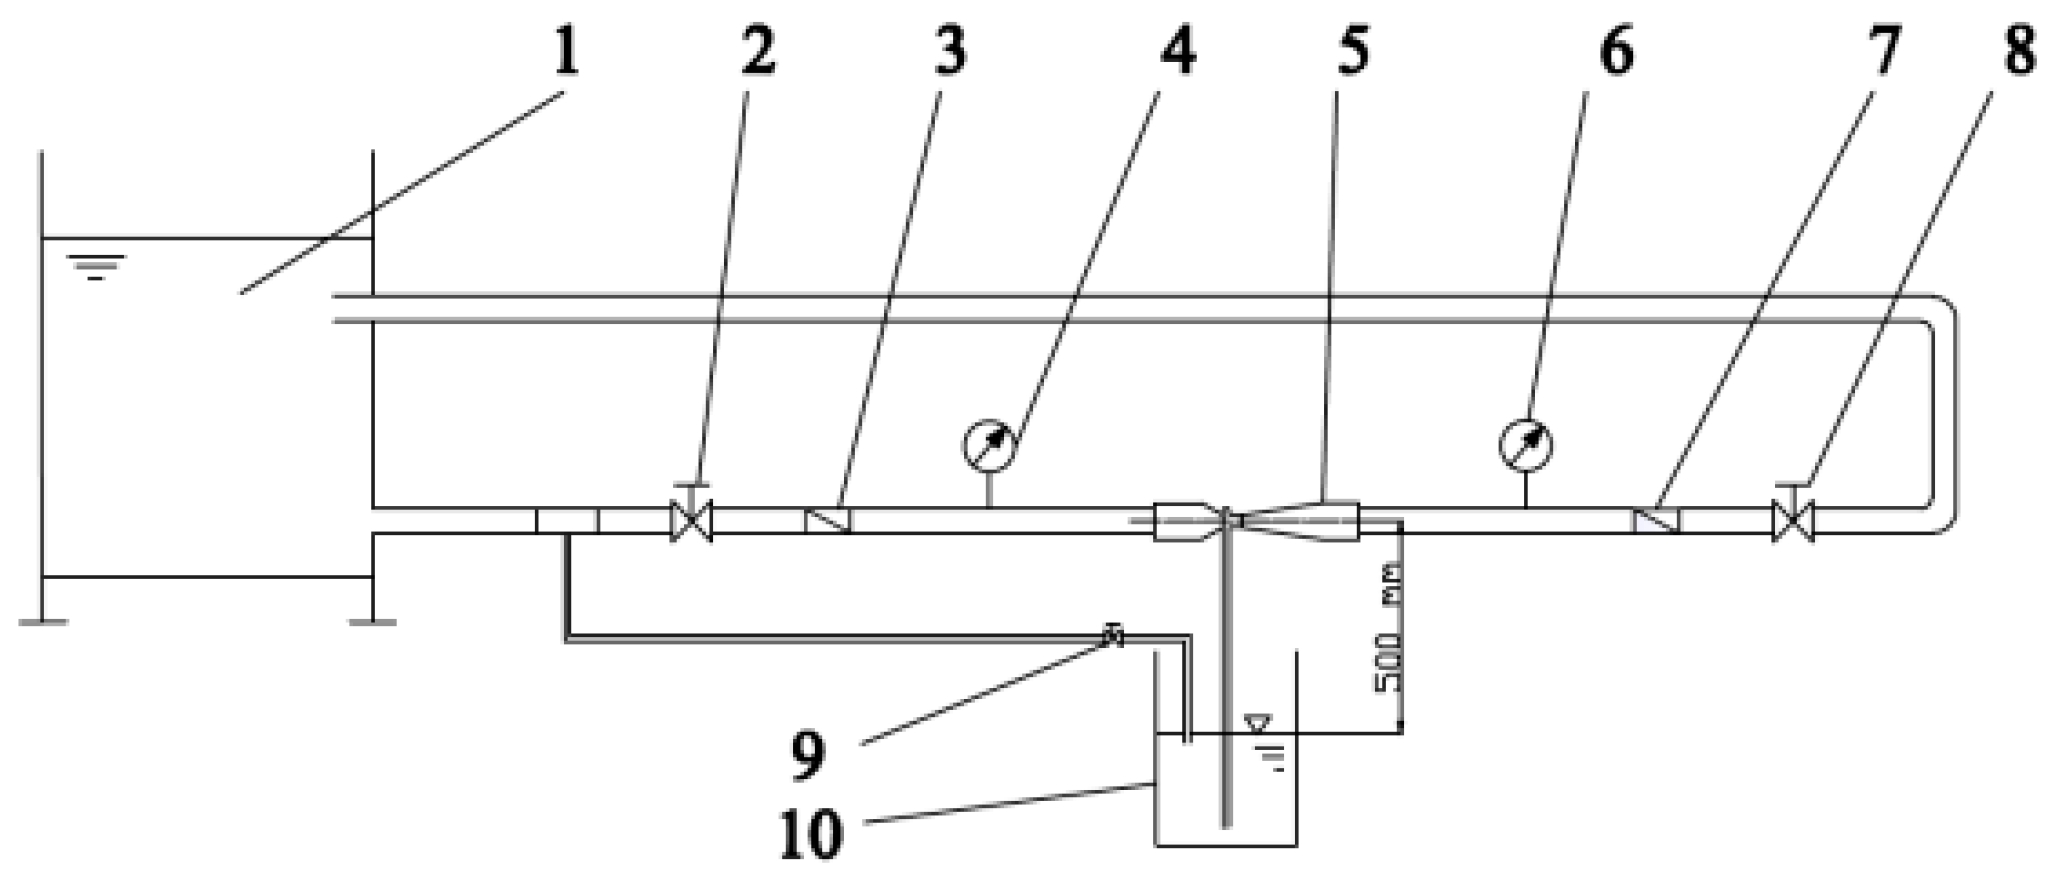
2. Experimental Setup
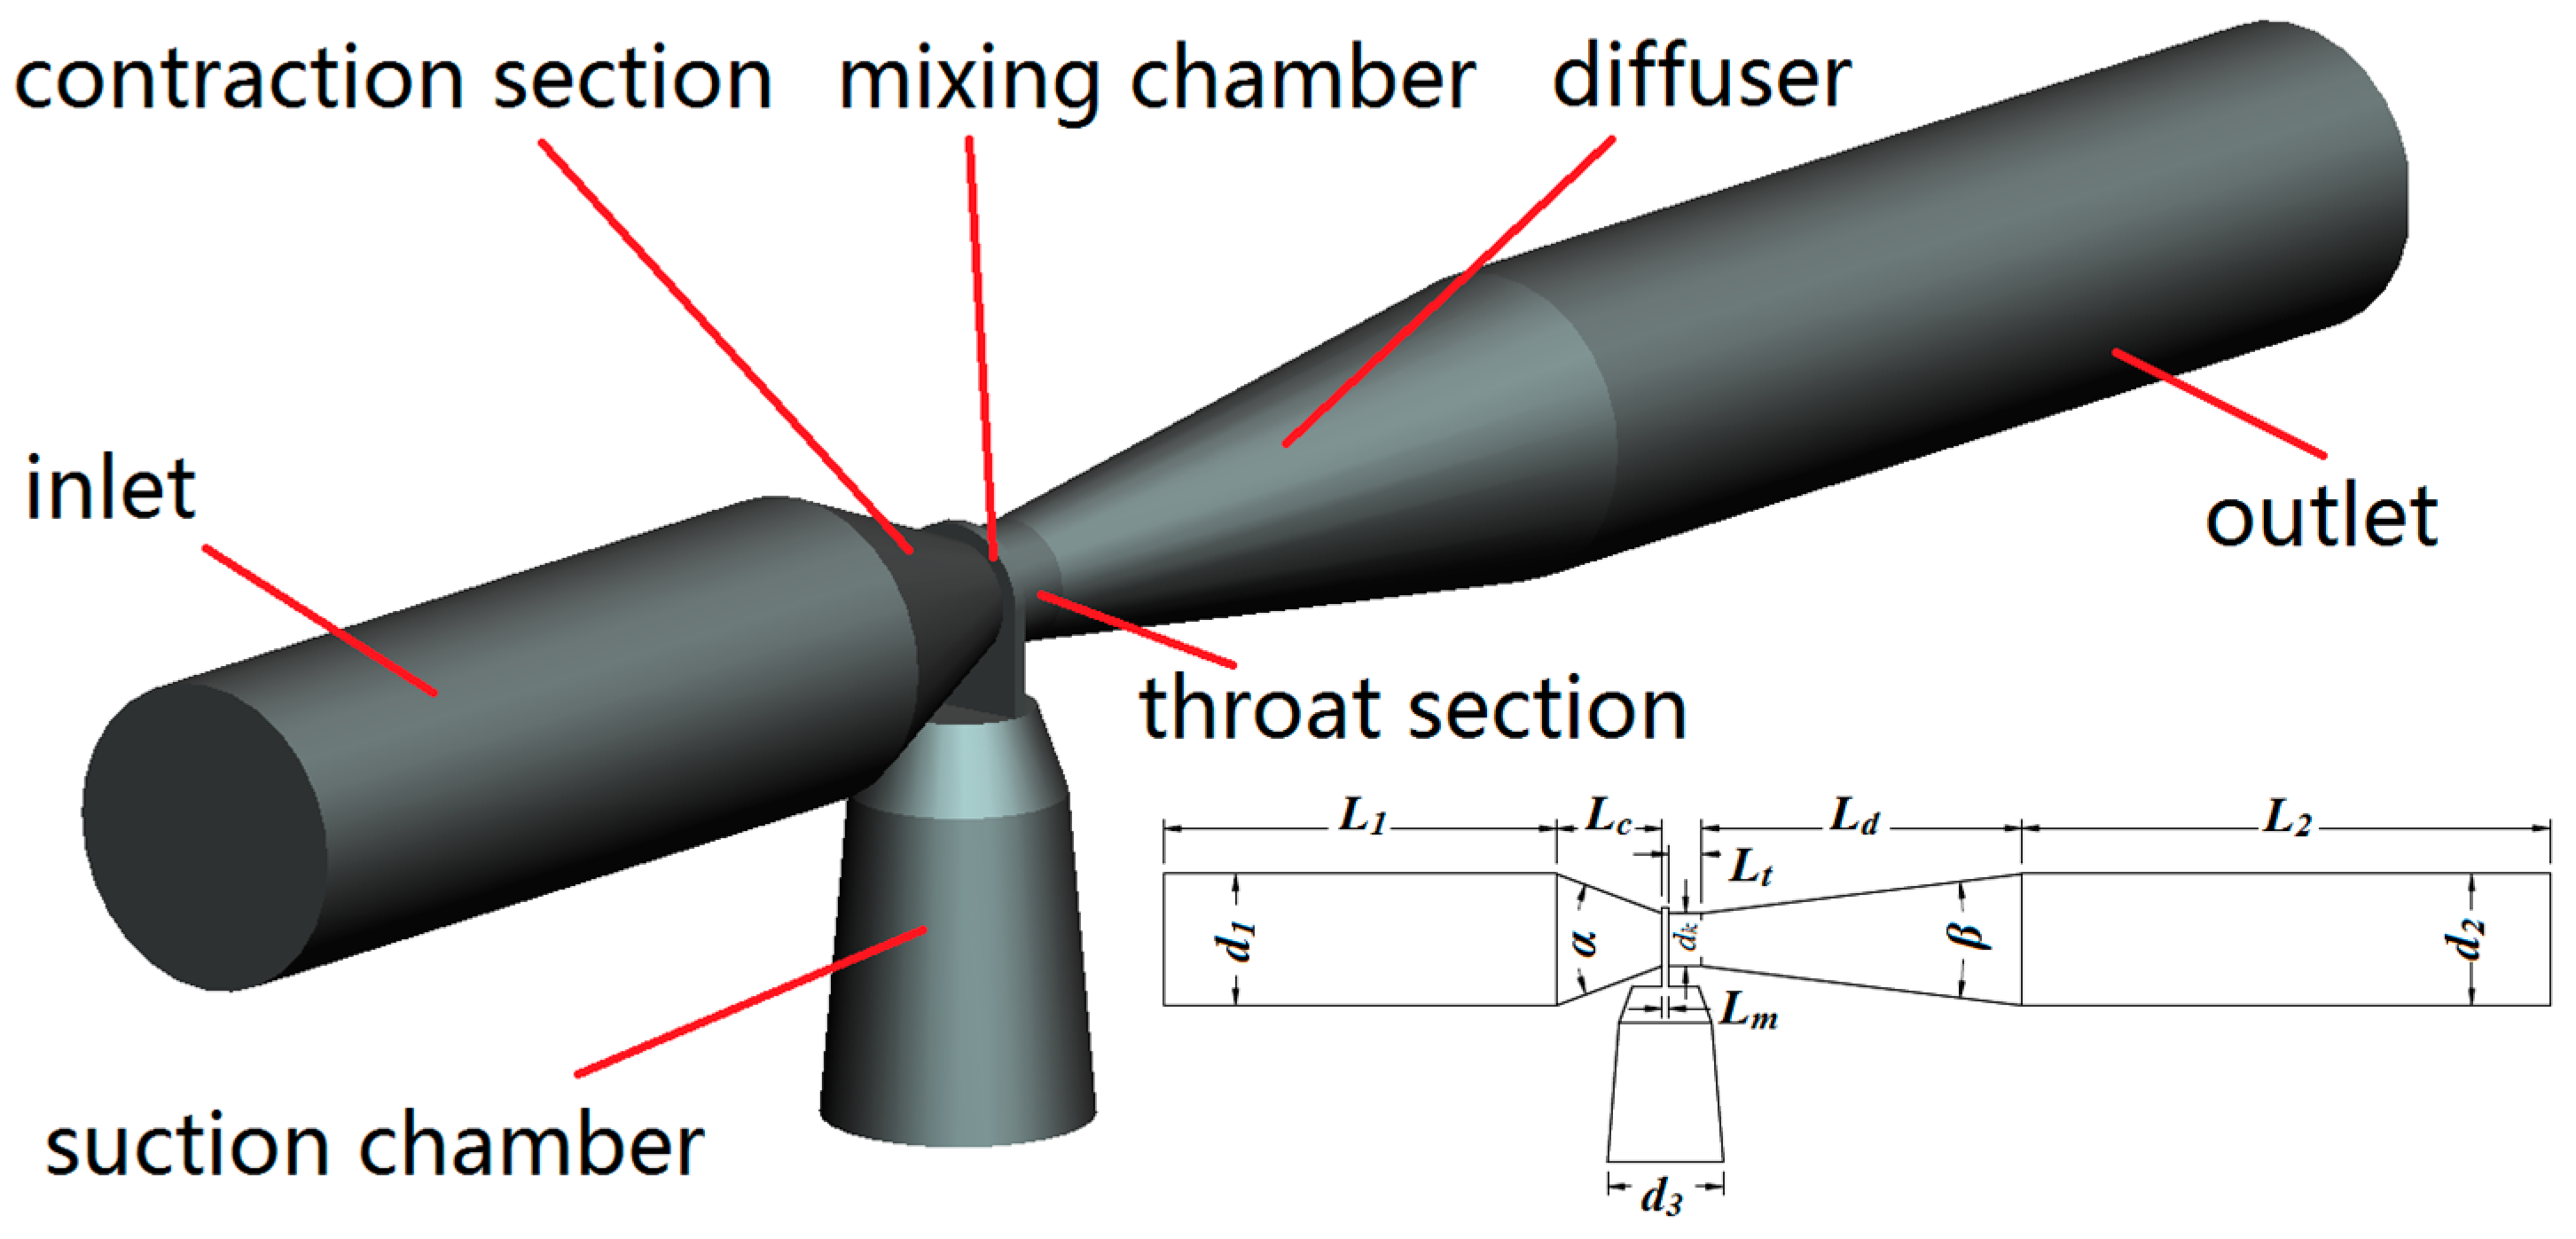
We studied the working process and the fertilizer suction/hydraulic performance in a venturi injector using water as a working fluid. In this study, a closed-loop system was considered to assess the venturi injector. The system contained water circulation and measuring subsystems. Figure 1 presents the configuration of the closed-loop system.
In the experiment, water was driven by a variable-frequency, constant-pressure water supply device. We mounted two pressure gauges (precision: 0.4%) on the inlet and outlet lines of the venturi injector to measure the local pressures accurately. Likewise, the flow rates at the inlet and outlet lines of the venturi injector were measured by two turbine flowmeters (precision: 0.2%). In addition, valves of the main pipeline were used to regulate the flow rate of the experimental system and control the import and export pressures of the venturi injector. The tank’s water level was maintained constant to isolate the suction flow rate from the water level impact. Accordingly, a water pipe was set from the main pipeline to the water tank. Notably, the vertical distance between the water level and the venturi injector axis was 500 mm.

3. Analysis Model

Figure 2 shows the configuration and dimensions of the venturi injector; it contains the following seven parts: entrance, exit, contraction section, throat, mixing chamber, diffuser, and suction chamber. Table 1 presents the geometric parameters of the venturi injector.

4. Mesh and Boundary Conditions

4.1. Mesh Independence Study

To ensure a mesh-independent solution, we used four mesh sizes for the simulation. Table 2 shows the results under the P1 = 350 kPa and P2 = 100 kPa flow conditions. We found that the solution was mesh-independent beyond 400K elements; hence, this mesh was used for all further simulations.

4.2. Comparison of Turbulence Models

We constructed four turbulence models—standard k–ε model, RNG k–ε model, realizable k–ε model, and standard k–ω model—to select the optimum turbulence model for the interflow simulations and compared their results with the experimental results to arrive at the most suitable turbulence model. Table 3 presents numerical and experimental results of the venturi with different turbulence models under the flow conditions of P1 = 350 kPa and P2 = 100 kPa. We found that the standard k–ε model offered better accuracy among these models; hence, this model was selected in this study.

4.3. Boundary Conditions

Structured meshing with hexahedral elements was generated using ANSYS ICEM CFD software (ANSYS, Inc., Commonwealth of Pennsylvania, USA) to calculate the flow of the computation domain more effectively. In addition, numerical simulations for the venturi injector were executed in ANSYS FLUENT 17.2 software (ANSYS, Inc., Commonwealth of Pennsylvania, USA). The separation solver and the absolute velocity formula were used to deal with the steady-state problem. The conventional fluid dynamics were computed by solving the Reynolds-averaged Navier–Stokes equations. We applied the SIMPLE algorithm to solve the coupling velocity and pressure problems. Furthermore, the finite volume method was used to discretize the governing equations.
In addition, we used the standard k–ε turbulence model in the simulations. The mixture model was selected as a multiphase model to assess the flow law of the fertilizer solution in the working process of the venturi injector. Besides this, the Zwart–Gerber–Belamri model, based on the Rayleigh–Plesset equation, was added after the numerical calculation was convergent to attain a more accurate and appropriate simulation method. Moreover, non-slip wall boundary conditions were applied. The pressure inlet and pressure outlet boundary conditions were applied at the two inlets (Inlet 1 and Inlet 2 denote the inlet and suction chamber, respectively) and outlet boundaries. In the mixture model, the calculation medium is Newtonian fluid, and the water liquid model was applied for the primary phase, while the urea liquid model was applied for the secondary phase. Residuals of <10−5 were set as the convergence criterion. Based on the experiment, different pressures for Inlet 1 were set in the simulations. Different outlet pressures corresponding to different pressure points were set at the outlet to assess the hydraulic performance under different working conditions of the venturi injector. Figure 3 shows grid details and boundary conditions for the whole domain.

5. Results and Discussion

5.1. Comparison of the Numerical and Experimental Results

In this study, the experiments were conducted at the Center of Water-Saving Irrigation Equipment Quality Inspection, Ministry of Water Resources. We considered four inlet pressures in the experiment (range: 50–350 kPa). Meanwhile, numerical calculations for the venturi injectors were implemented with the same working conditions. Figure 4 presents the results obtained from the experiment and numerical simulation. In this study, we conducted two sets of numerical simulations. The cavitation model was applied in the first simulation, while the other simulation was performed without the cavitation model.
Typically, applying the cavitation model results in predictions which are in better agreement with the results from the experiment. It is feasible to use CFD simulation based on the mixture model to estimate the performance of a venturi injector, whereas the cavitation model could make the simulation results more reliable.
The numerical and experimental results corroborate each other well for cases with low inlet pressure (i.e., P1 = 50 kPa) or low pressure difference. However, in other conditions, the deviations between experimental values and calculations are large due to ignoring cavitation. Moreover, each performance curve of the simulation that considered the cavitation model had a bending point; they all tended to flatten when the amount of absorbed fluid reached approximately 0.2 m3/h after the bending point; this is because when the venturi injector works with a large inlet pressure and pressure difference, the cavitation is more intense. Affected by cavitation, the mixing of the working fluid and the absorbed liquid becomes increasingly complicated. Of note, cavitation occurs when the internal local pressure is lower than the saturated vapor pressure of the working fluid at the corresponding temperature. The occurrence of cavitation leads to stability in the amount of fertilizer absorbed by the venturi injector applicator. Thus, the amount of fertilizer absorbed can be controlled in cavitation conditions to provide precise fertilization in terms of quantity.

5.2. Analysis of the Mixing Process

We used two parameters to indicate the performance and thereby study the mixing process of two fluids in a venturi injector. The parameters were the local pressure ratio (px) and the flow ratio (q), which are defined as follows:
p x = P ( x ) P s P 1 P s
q = Q s Q 1
where x is the position along the flow and P(x), P1, Ps, Qs, and Q1 are the local pressure at x section, inlet pressure, suction inlet pressure, suction flow, and workflow, respectively.
The local pressure ratio (px) is the ratio between energy surplus with the absorbed fluid and the energy loss with the working fluid at the x cross section. In addition, the flow ratio (q) presents the ratio of the suction flow to the working flow.
We used five different working conditions at P1 = 350 kPa in the calculations to study the characteristics of the internal flow field of the venturi injector upstream and downstream of the cavitation zone. Table 4 shows the performance obtained from the numerical simulation with the cavitation model in different flow conditions (i.e., P2 = 50, 100, 150, 200, and 250).

5.3. Development of Cavitation Distributions

Notably, the occurrence of cavitation depends on the local pressure. We assessed the cavitation creation for fixed inlet pressure P1 = 350 kPa, as shown in Figure 5. No cavitation occurred under the pressure conditions of P2 = 250 and 200 kPa. The cavitation primarily occurred in the throat and diffuser sections. In addition, the cavitation intensity increased as the outlet pressure decreased. Figure 5 shows that the most intense cavitation takes place for P2 = 50 kPa.
Table 2 shows that the flow ratio exhibited a small change when cavitation occurred for the pressure points of P2 = 50, 100, and 150 kPa. These changes were similar for P2 = 50–150 kPa, and there was a peak in the operating point under 100 kPa. Thus, the suction flow and flow ratio exhibited a minor fluctuation when the cavitation was created. Notably, the cavitation was critical to the suction flow and flow ratio, where both increased as the cavitation degree increased. Conversely, both parameters decreased when the cavitation reached a certain extent.

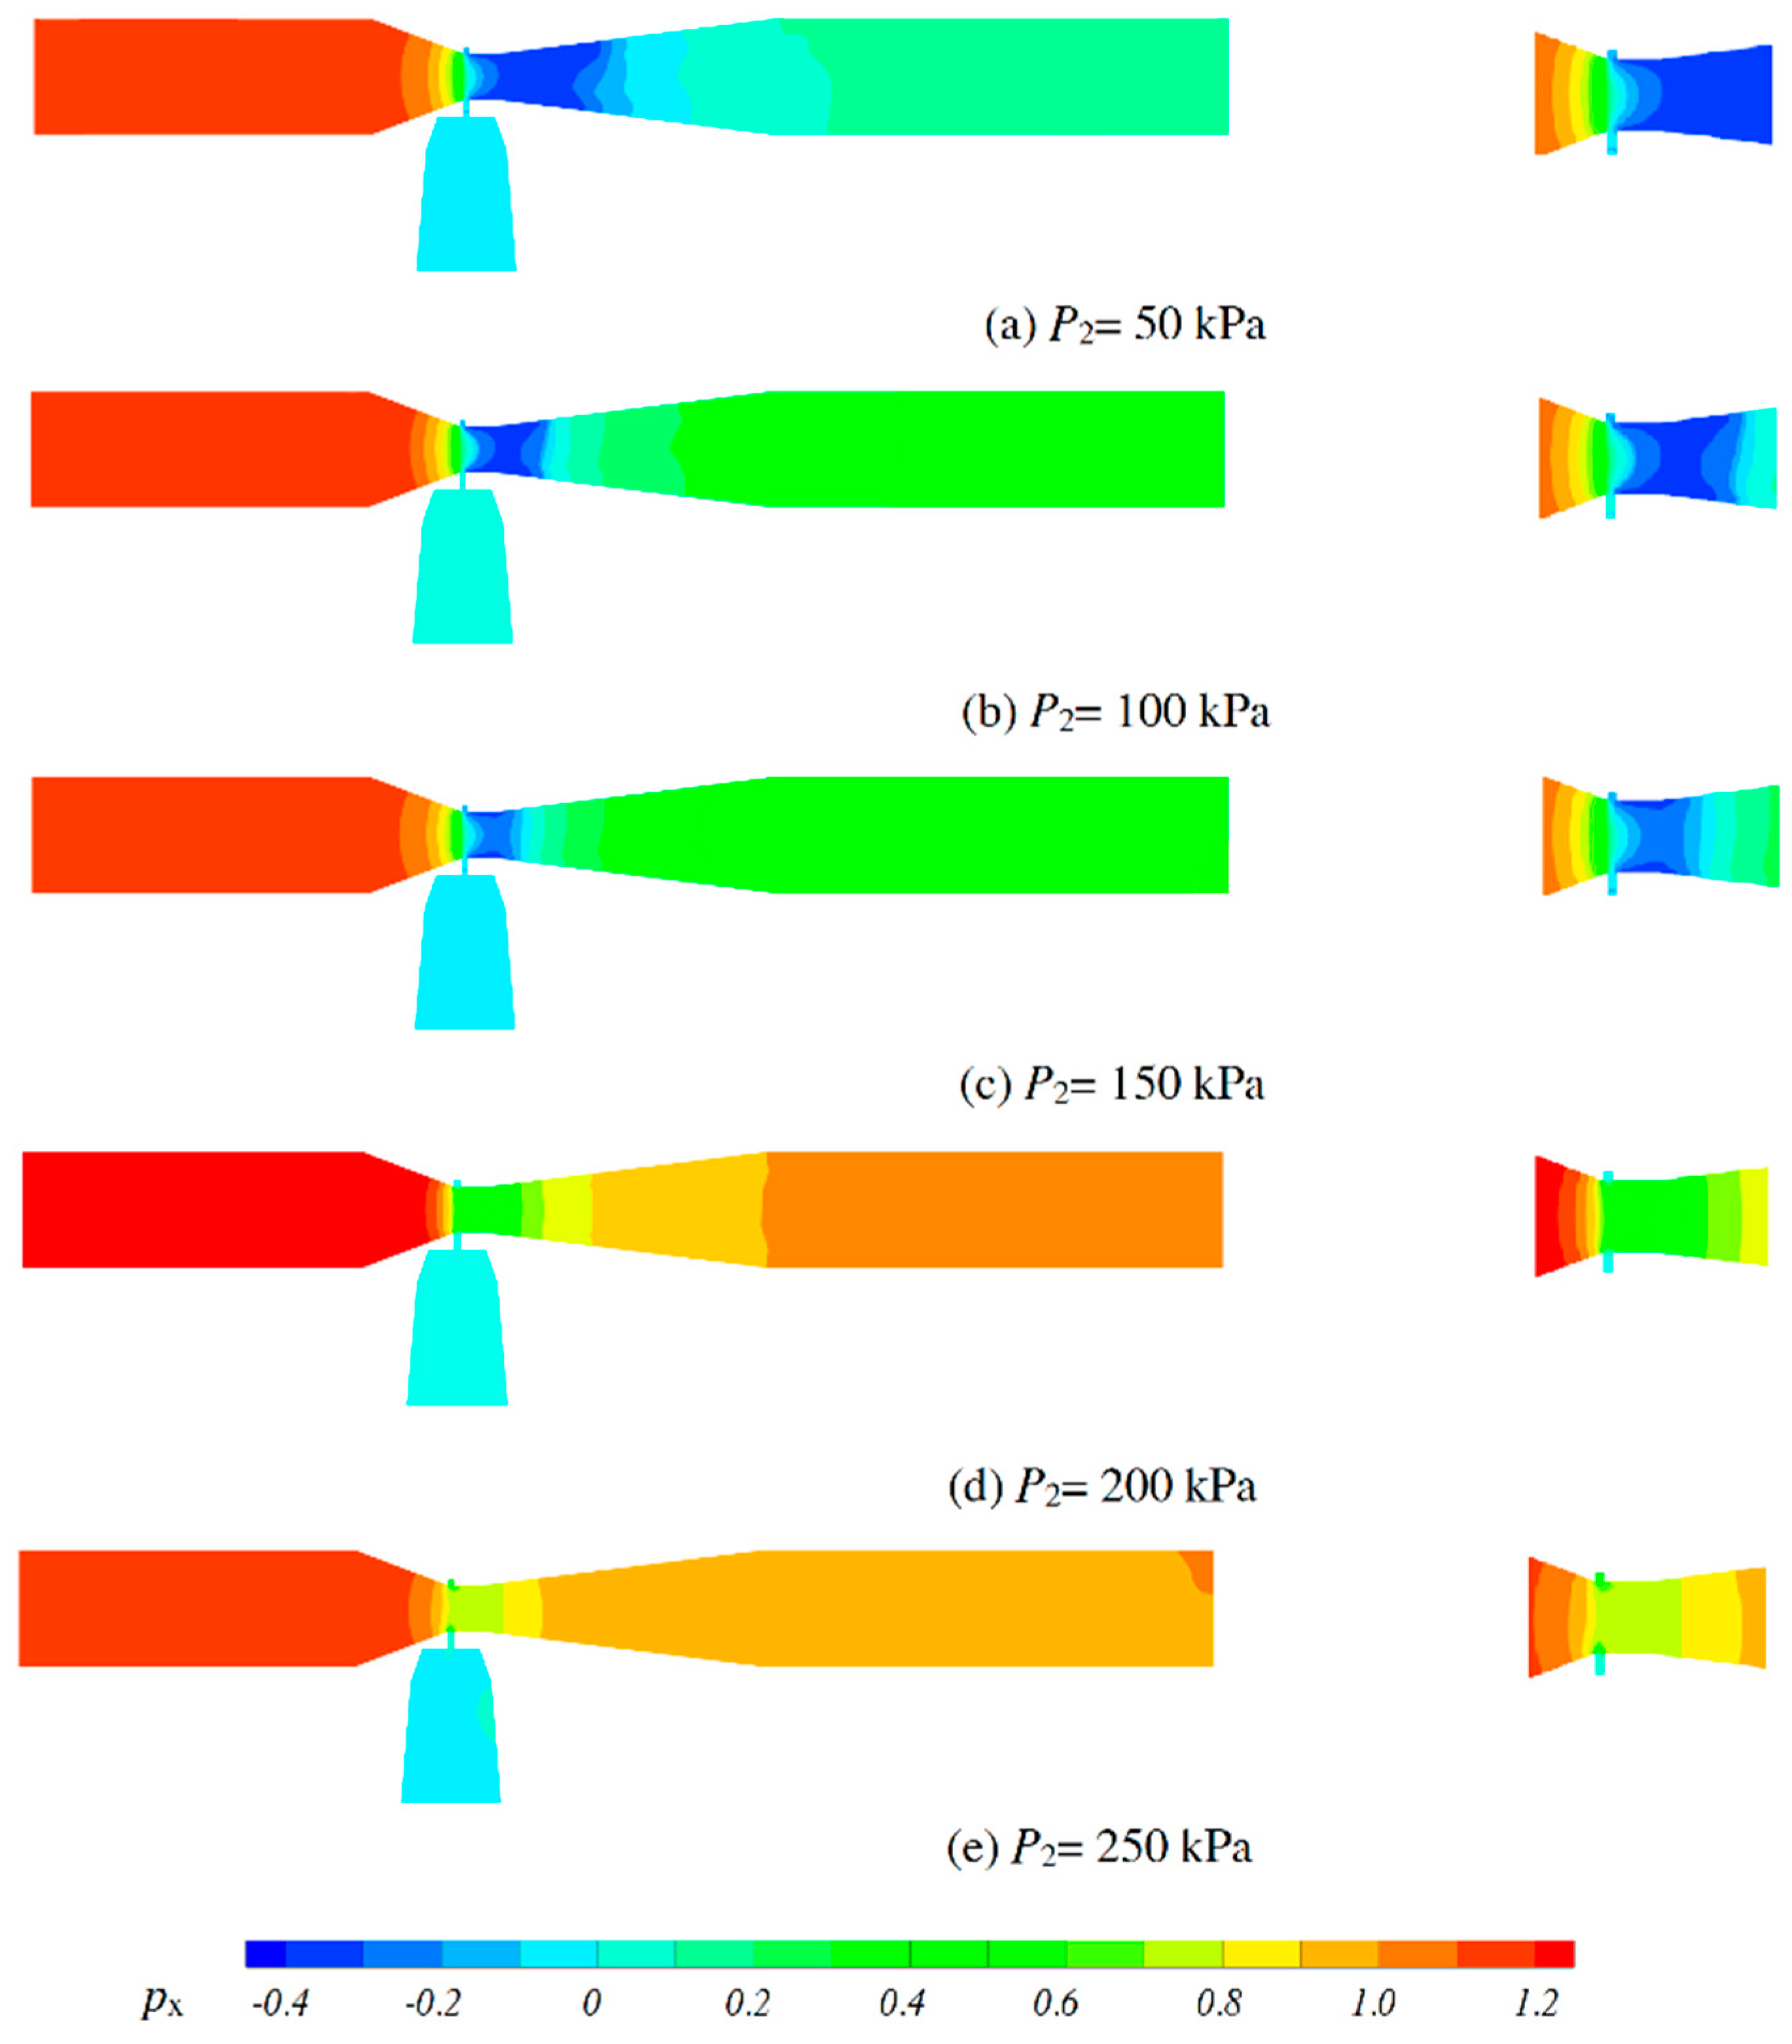
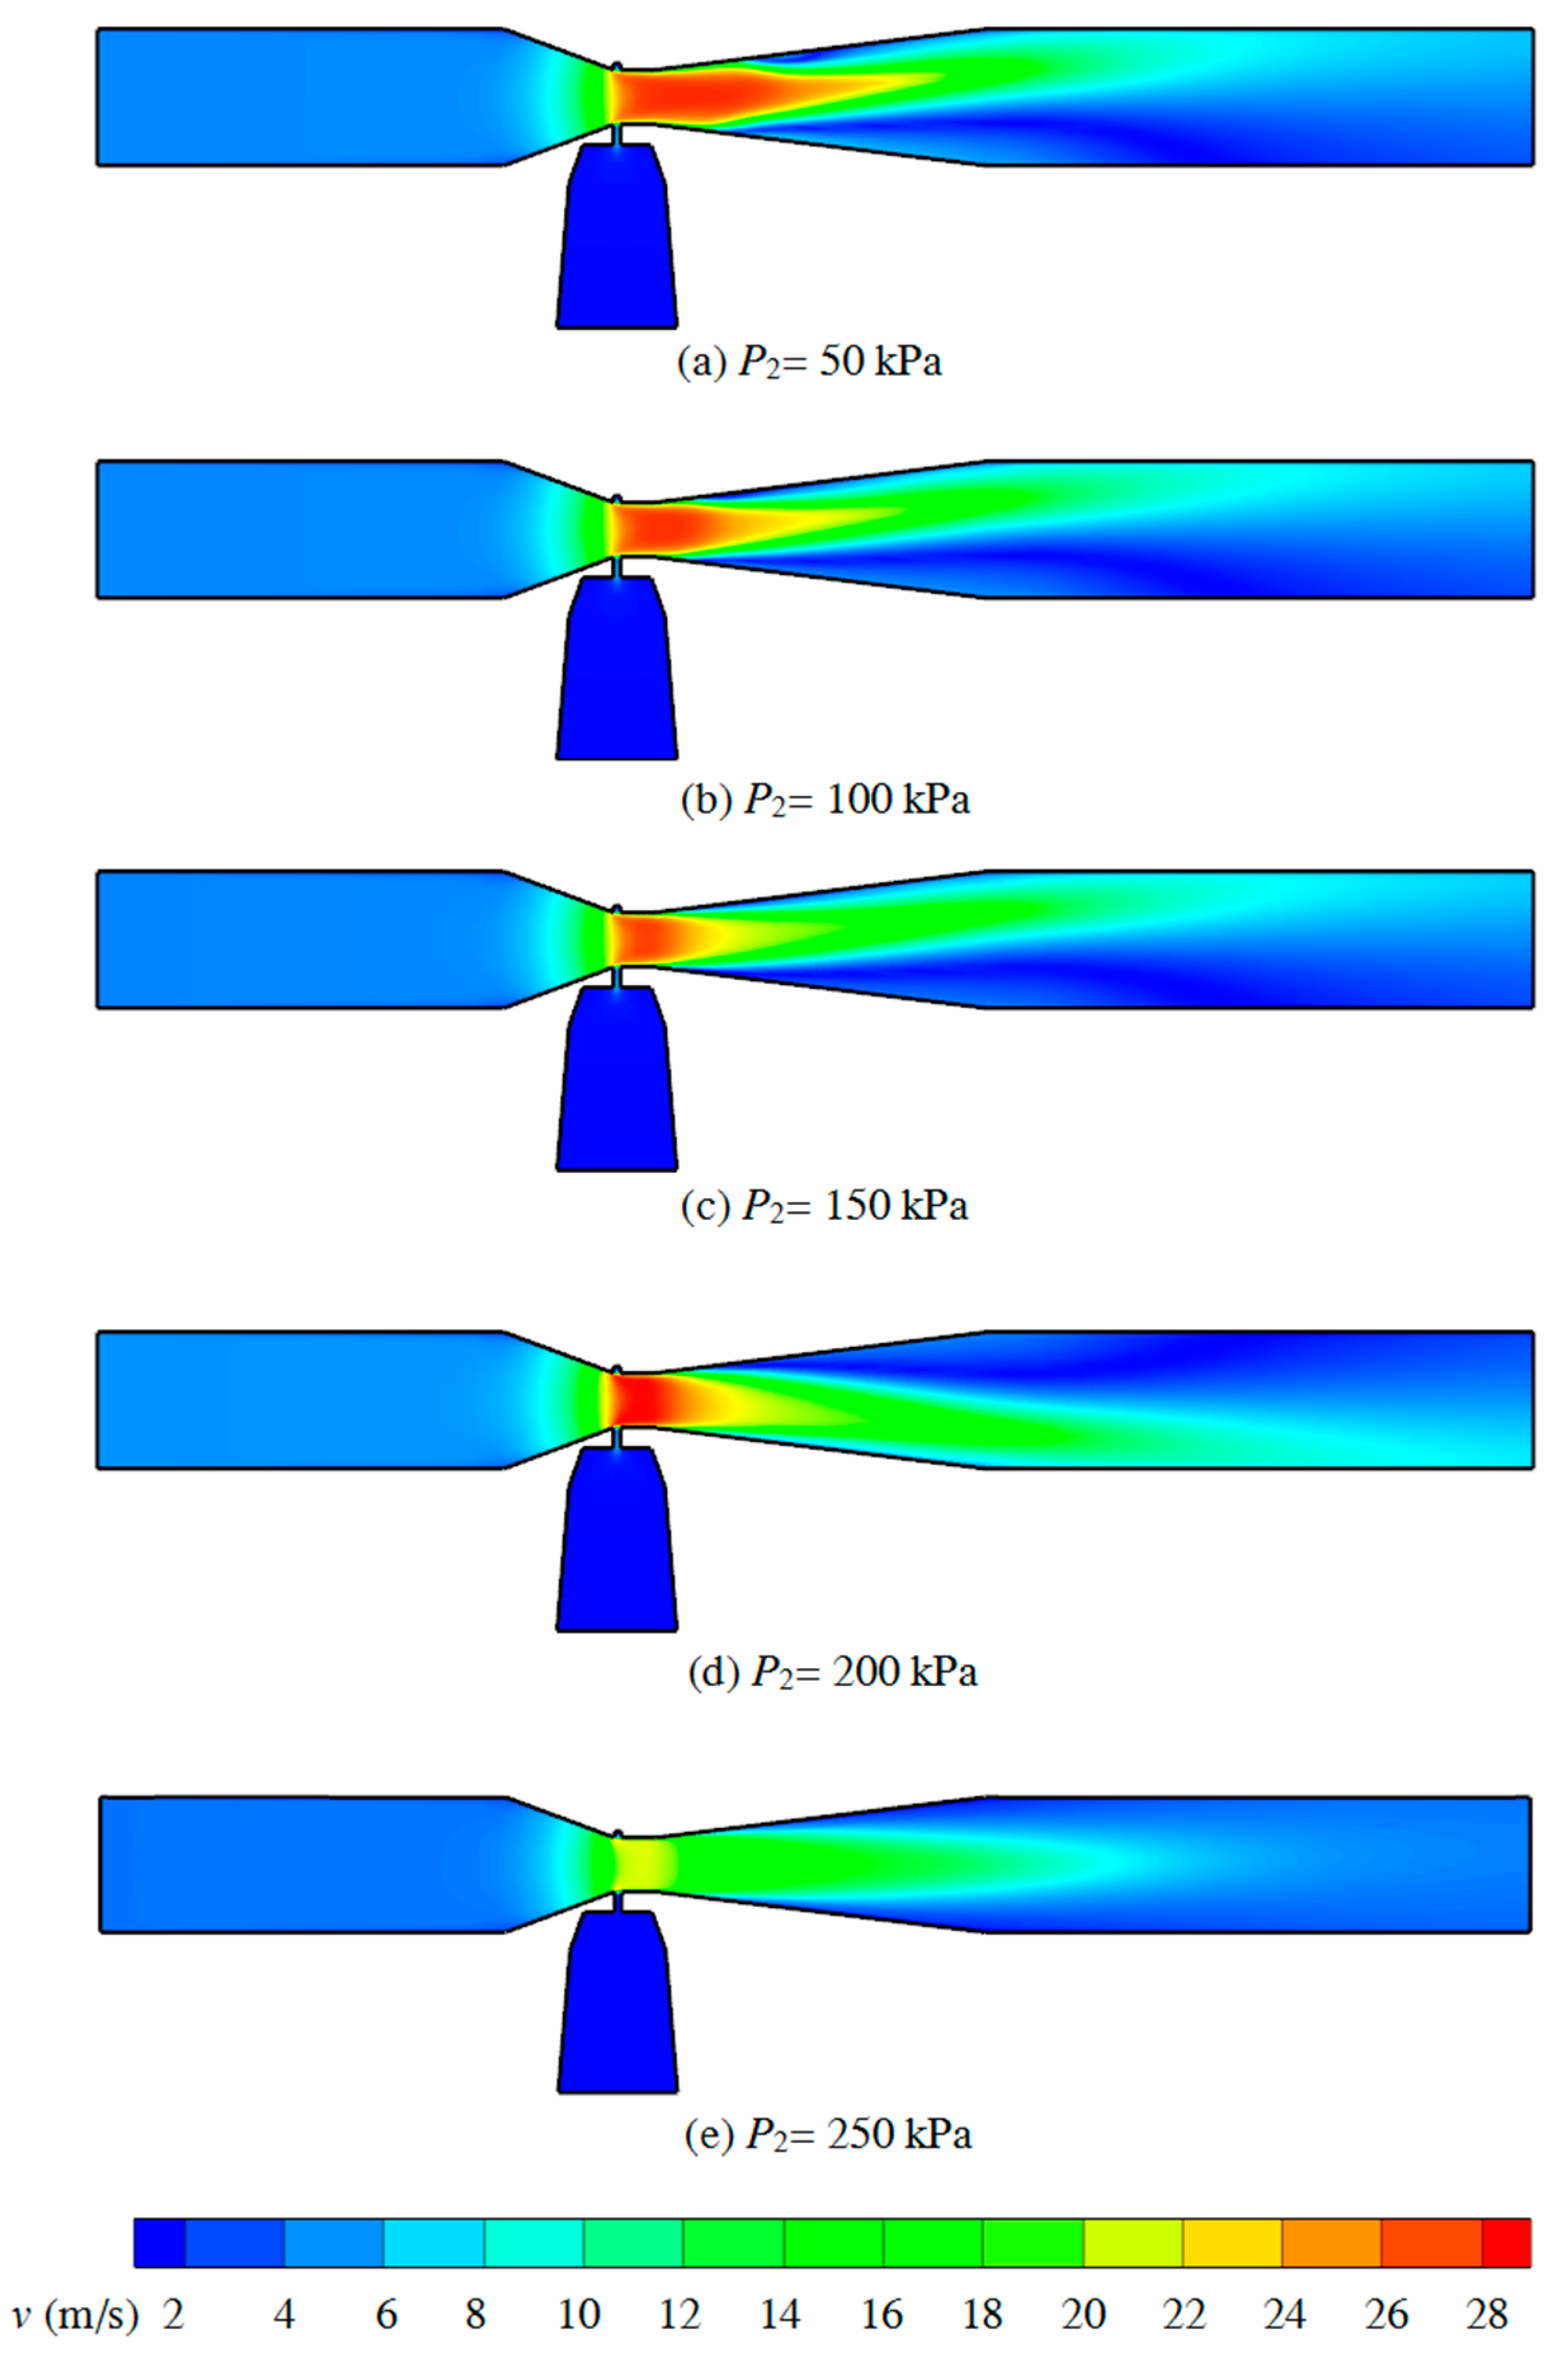
5.4. Development of Pressure and Velocity Distributions

We simulated the pressure and velocity distributions to analyze the flow structure inside the venturi injector. Figure 6 and Figure 7 show the pressure and velocity distributions of the venturi injector at the z = 0 section for P1 = 350 kPa. Figure 6 shows that the pressure decreased at the beginning but then increased along the flow direction. Negative pressure was formed at the throat, where the pressure reached its minimum value. Figure 6a–c indicates that for cases with a high pressure difference, low pressure areas were present in the throat, diffuser, and mixing chamber, where the suction liquid enters the venturi injector; in other words, there was pressure loss at these places, proving the distribution of cavitation (Figure 5).
Figure 7 illustrates that the velocity changed abruptly from the contraction to diffuser sections; it increased steadily in the contraction section and reached its peak at the throat. During flow in the diffuser and outlet, a reduction trend was observed owing to the impact of the suction flow and the variability of the flow cross-sectional area. In addition, the velocity presented different variation trends under different outlet pressures.
Of note, the velocity distribution is symmetric only for the outlet pressure P2 = 250 kPa. For lower outlet pressures (P2 ≤ 150 kPa), the velocity near the upper wall was higher than that in the other areas of the diffuser and outlet; however, this was reversed for P2 = 200 kPa.
Figure 8 presents the streamlines in the z = 0 section for different outlet pressures; it shows that the flow was steady only for the outlet pressure P2 = 250 kPa, and there were vortices at other outlet pressures. Among these conditions, the difference is the position of the vortex; the presence of vortices near the side of the suction tubes for low outlet pressures is contrary to their absence at higher outlet pressure. This could be attributed to the nonuniformity of the flow and the velocity distribution after the throat section. Conversely, when the second fluid was absorbed into the working fluid, an energy conversion occurred between them, which led to the different velocity field near the suction side of the diffuser compared with those in other regions. Thus, the vortex was formed in a different area, suggesting that the formation of a vortex inevitably leads to energy loss. This phenomenon correlates with the structure of the suction chamber. Owing to the lateral inlet, the suction fluid flows around the nozzle. In addition, the flow at the throat entrance is absorbed asymmetrically into the throat, which then becomes different in different regions. Thus, a symmetric suction chamber is necessary and preferred.

5.5. Analysis of the Local Pressure Ratio

Figure 9 illustrates the local pressure ratio along the length of the venturi injector under different outlet pressure conditions, suggesting that the local pressure ratio increased gradually as the outlet pressure increased. In addition, the curves revealed that the local pressure ratio began to decrease in the contraction section. We observed that the local pressure ratio markedly decreased in the throat, as the outlet pressure decreased. Furthermore, the curves were almost coincident in the throat, and the outlet pressure was <150 kPa. With the mixing of two flows, the energy of the suction fluid increased gradually. Finally, in the diffuser, the energy obtained by the suction flow reached a maximum in the unit volume; in other words, the pressure ratio of the mixture reached a peak value and then tended to be stable.
After contrasting with Figure 6, we found that cavitation occurred for small outlet pressures. The cavitation region occupied a wide range of the diffuser, and the phenomenon of cavitation was higher when the outlet pressure was 50 kPa. Hence, we infer a certain impact of cavitation on fertilizer absorption performance.

5.6. Development of the Turbulent Kinetic Energy

Reportedly, the turbulent kinetic energy is a key parameter to illustrate cavitation [40]. When cavitation occurs, there is strong disturbance in the flow, and the turbulent kinetic energy increases rapidly. In addition, the variation of the turbulent kinetic energy depicts the cavitation intensity [41].
Figure 10 describes the trend of the turbulent kinetic energy at different outlet pressures along the venturi injector, also illustrating that the turbulent kinetic energy remained constant from the contraction to the throat sections, while it increased in the diffuser section, where the position of the turbulent kinetic energy was approximately the same as that of the cavitation. We observed that the turbulent kinetic energy reached its maximum value after a sharp increase in the diffuser, but then gradually decreased to its ultimate value (about 2 m2 s−2) in the outlet. Furthermore, the effect of the turbulent kinetic energy was enhanced as the pressure difference increased, which could be attributed to the presence of cavitation in this region.

5.7. Development of the Volume Fraction of the Suction Flow

Figure 11 illustrates the development of the volume fraction of the suction flow in different conditions. Accordingly, the curves present three distinct trends in different conditions along the venturi injector. Initially, there were plenty of similarities in the curves for low outlet pressure. The volume fractions showed a considerable increase in the diffuser, and their rate of increase decreased in the outlet but reached a high point at 3.5%. Moreover, the curve exhibited the same trend in the diffuser for outlet pressure equal to 200 kPa; however, the volume fraction tended to rise first but then decrease in the outlet. Finally, Figure 11 shows that the volume fraction only grew after the diffuser for P2 = 250 kPa.
Accordingly, the flow inside the venturi injector is a non-negligible factor. The flow did not completely mix in the throat because of its large velocity. Furthermore, the variation in the velocity gradient in the diffusion section made the suction flow spread rapidly in the working flow. Thus, the velocity and flow ratio can be considered to be the major factors that affect the mixing speed.

6. Conclusions

This study obtained the following conclusions. Numerical simulation can precisely depict the hydraulic performance of a venturi injector. To ensure the reliability of numerical results, it is key to select a suitable calculation model based on the flow characteristics of the internal flow field. For cases with cavitation, the results calculated without considering the cavitation model presented a significant error when compared with the experimental results, where the maximum error exceeded 50%. However, the largest deviation between the calculated results obtained from the cavitation model and the experiment results was just 3%. Thus, CFD methods with an appropriate computational model can be used to reliably estimate the hydraulic performance and the flow field of a venturi injector. This study offers information that could be used to perfect the numerical simulation method for venturi injectors.
The internal flow field analysis revealed that cavitation is a key factor affecting the hydraulic performance of the venturi injector. The occurrence of cavitation makes the flow of the absorbed liquid remain steady at around 0.23 m3/h for different working pressures. In conclusion, cavitation might enhance the performance of a venturi injector in applications such as agricultural irrigation and engineering. In addition, the flow field inside the venturi injector could be adjusted according to the inlet condition. For fixed entrance conditions, the suction flow and the flow ratio increase as the pressure difference increases. However, the two flows do not mix well inside the throat because the flow ratio value is relatively small. When liquid enters the diffuser, the flow speed decreases. Meanwhile, the complex flow in the mixing chamber and the throat, as well as the flow area of the abrupt change, results in a drastic change in the velocity gradient, causing the reduction of the local pressure ratio. Hence, the main energy loss correlates with the region.

Author Contributions

H.L. (Hao Li) and H.L. (Hong Li) conceived and designed the experiments; Y.Y. and Q.H. performed the experiments and simulation; B.Q. analyzed the data; H.L. (Hao Li) wrote the paper; X.H. funding acquisition. All authors have read and agreed to the published version of the manuscript.

Funding

This research was funded by National Key R&D Program of China (2016YFC0400202, 2016YFC0400104) and Central Public-Interest Scientific Institution Basal Research Fund (Y2019PT72, FIRI2016-19, FIRI2016-22, FIRI2017-22).

Conflicts of Interest

The authors declare no conflict of interest.

References

  1. Ryan, J.; Saleh, M. Use of phosphorus fertilizers in pressurized irrigation systems: Problems and possible solutions. In Natural Resource Management Program; Alexandria University: Alexandria, Egypt, 1998. [Google Scholar]
  2. Kong, L.; Fan, X. Analysis on the influencing factors of throat negative pressure for Venturi injector. Agric. Res. Arid Areas 2013, 31, 78–82. [Google Scholar]
  3. Li, J.; Hong, T.; Feng, R.; Yue, X.; Luo, Y. Design and experiment of Venturi variable fertilizer apparatus based on pulse width modulation. Trans. Chin. Soc. Agric. Eng. 2012, 28, 105–110. [Google Scholar]
  4. Jin, Y.; Xia, C.; Fang, B. Research and Development of Venturi Fertilizer Applicator Series. China Rural Water Hydropower 2006, 5, 14–16. [Google Scholar]
  5. Fan, X.; Kong, L. Relationship of energy conversion for Venturi injector. J. Drain. Irrig. Mach. Eng. 2013, 31, 528–533. [Google Scholar]
  6. Han, Q.; Huang, X.; Liu, H.; Wu, W.; Fan, Y. Comparative Analysis on Fertilization Performance of Six Venturi Injectors. Trans. Chin. Soc. Agric. Mach. 2013, 44, 113–117. [Google Scholar]
  7. Yan, H.; Chu, X.; Wang, M.; Ma, Z. Injection performance of Venturi injector in micro-irrigation system. J. Drain. Irrig. Mach. Eng. 2010, 28, 251–255, 264. [Google Scholar]
  8. Feitosa Filho, J.C.; Botrel, T.A.; Pinto, J.M. Performance of the venturi type injectors joined to pipe under free and pressurized flow. Eng. Agric. 1998, 17, 20–35. [Google Scholar]
  9. Lima Neto, I.E.; de Melo Porto, R. Performance of Low-Cost Ejectors. J. Irrig. Drain. Eng. 2004, 130, 122–128. [Google Scholar] [CrossRef]
  10. Ozkan, F.; Ozturk, M.; Baylar, A. Experimental investigations of air and liquid injection by venturi tubes. Water Environ. J. 2006, 20, 114–122. [Google Scholar] [CrossRef]
  11. Parish, R.L.; Rosendale, R.M.; Bracy, R.P. Fertigation Uniformity Affected by Injector Type. Horttechnology 2003, 13, 103–105. [Google Scholar]
  12. Li, J.; Meng, Y.; Li, B. Field evaluation of fertigation uniformity as affected by injector type and manufacturing variability of emitters. Irrig. Sci. 2007, 25, 117–125. [Google Scholar] [CrossRef]
  13. Ye, S.; Zhang, J.; Xu, B.; Zhu, S. Theoretical investigation of the contributions of the excitation forces to the vibration of an axial piston pump. Mech. Syst. Signal Process 2019, 129, 201–217. [Google Scholar] [CrossRef]
  14. Zhu, Y.; Qian, P.; Tang, S.; Jiang, W.; Li, W.; Zhao, J. Amplitude-frequency characteristics analysis for vertical vibration of hydraulic AGC system under nonlinear action. AIP Adv. 2019, 9, 035019. [Google Scholar] [CrossRef] [Green Version]
  15. Zhu, Y.; Tang, S.; Wang, C.; Jiang, W.; Yuan, X.; Lei, Y. Bifurcation Characteristic research on the load vertical vibration of a hydraulic automatic gauge control system. Processes 2019, 7, 718. [Google Scholar] [CrossRef] [Green Version]
  16. Zhu, Y.; Tang, S.; Quan, L.; Jiang, W.; Zhou, L. Extraction method for signal effective component based on extreme-point symmetric mode decomposition and Kullback-Leibler divergence. J. Braz. Soc. Mech. Sci. Eng. 2019, 41, 100. [Google Scholar] [CrossRef]
  17. Yan, H.; Chen, Y.; Chu, X.; Xu, Y.; Wang, Z. Effect of structural optimization on performance of Venturi injector. In Conference Series: Earth and Environmental Science; IOP Publishing: Bristol, UK, 2012; Volume 15, p. 072014. [Google Scholar]
  18. Sun, Y.; Niu, W. Simulating the Effects of Structural Parameters on the Hydraulic Performances of Venturi Tube. Model. Simul. Eng. 2012, 2012, 1–7. [Google Scholar] [CrossRef] [Green Version]
  19. Baylar, A.; Aydin, M.C.; Unsal, M.; Ozkan, F. Numerical modeling of venturi flows for determining air injection rates using FLUENT V6. 2. Math. Comput. Appl. 2009, 14, 97–108. [Google Scholar]
  20. Qian, J.Y.; Chen, M.R.; Liu, X.L.; Jin, Z.J. A numerical investigation of the flow of nanofluids through a micro Tesla valve. J. Zhejiang Univ. Sci. A 2019, 20, 50–60. [Google Scholar] [CrossRef]
  21. Nguyen, T.; Devaraj, V.D.M.; Albert, V.D.B.; Eijkel, J.C.T. Investigation of the effects of time periodic pressure and potential gradients on viscoelastic fluid flow in circular narrow confinements. Microfluid. Nanofluid. 2017, 21, 37. [Google Scholar] [CrossRef] [Green Version]
  22. Wang, C.; Hu, B.; Zhu, Y.; Wang, X.; Luo, C.; Cheng, L. Numerical study on the gas-water two-phase flow in the self-priming process of self-priming centrifugal pump. Processes 2019, 7, 330. [Google Scholar] [CrossRef] [Green Version]
  23. Wang, C.; He, X.; Zhang, D.; Hu, B.; Shi, W. Numerical and experimental study of the self-priming process of a multistage self-priming centrifugal pump. Int. J. Energy Res. 2019, 43, 4074–4092. [Google Scholar] [CrossRef]
  24. Lu, Y.; Zhu, R.; Wang, X.; Wang, Y.; Fu, Q.; Ye, D. Study on the complete rotational characteristic of coolant pump in the gas-liquid two-phase operating condition. Ann. Nucl. Energy 2019, 123, 180–189. [Google Scholar]
  25. Wang, C.; Chen, X.; Qiu, N.; Zhu, Y.; Shi, W. Numerical and experimental study on the pressure fluctuation, vibration, and noise of multistage pump with radial diffuser. J. Braz. Soc. Mech. Sci. Eng. 2018, 40, 481. [Google Scholar] [CrossRef]
  26. Wang, C.; He, X.; Cheng, L.; Luo, C.; Xu, J.; Chen, K.; Jiao, W. Numerical simulation on hydraulic characteristics of nozzle in waterjet propulsion system. Processes 2019, 7, 915. [Google Scholar] [CrossRef] [Green Version]
  27. He, X.; Jiao, W.; Wang, C.; Cao, W. Influence of surface roughness on the pump performance based on Computational Fluid Dynamics. IEEE Access 2019, 7, 105331–105341. [Google Scholar] [CrossRef]
  28. Nguyen, T.; Tran, T.; De Boer, H.; Albert, V.D.B.; Eijkel, J.C. Rotary-atomizer electric power generator. Phys. Rev. Appl. 2015, 3, 034005. [Google Scholar] [CrossRef]
  29. Huang, X.; Li, G.; Wang, M. CFD simulation to the flow field of Venturi injector. In Proceedings of the International Conference on Computer and Computing Technologies in Agriculture II, Volume 2, Beijing, China, 18–20 October 2009; pp. 805–815. [Google Scholar]
  30. Wang, M.; Huang, X.; Li, G. Numerical simulation of characteristics of Venturi Injector. Trans. Chin. Soc. Agric. Eng. 2006, 22, 27–31. [Google Scholar]
  31. Yan, H.; Wang, Z.; Chen, Y. High-speed photography analysis on cavitation of Venturi injector. J. Drain. Irrig. Mach. Eng. 2014, 32, 901–905, 920. [Google Scholar]
  32. Zwart, P.J.; Andrew, G.G.; Thabet, B. A two-phase flow model for predicting cavitation dynamics. In Proceedings of the Fifth international conference on multiphase flow, Yokohama, Japan, 30 May–4 June 2004; p. 152. [Google Scholar]
  33. Simpson, A.; Ranade, V.V. Modeling hydrodynamic cavitation in venturi: Influence of venturi configuration on inception and extent of cavitation. AIChE J. 2019, 65, 421–433. [Google Scholar] [CrossRef]
  34. Shi, H.; Li, M.; Nikrityuk, P.; Liu, Q. Experimental and numerical study of cavitation flows in venturi tubes: From CFD to an empirical model. Chem. Eng. Sci. 2019, 207, 672–687. [Google Scholar] [CrossRef]
  35. Dastane, G.G.; Thakkar, H.; Shah, R.; Perala, S.; Raut, J.; Pandit, A.B. Single and multiphase CFD simulations for designing cavitating venturi. Chem. Eng. Res. Des. 2019, 149, 1–12. [Google Scholar] [CrossRef]
  36. Brinkhorst, S.; Lavante, E.V.; Wendt, G. Experimental and numerical investigation of the cavitation-induced choked flow in a herschel venturi-tube. Flow Meas. Instrum. 2017, 54, 56–67. [Google Scholar] [CrossRef]
  37. Bashir, T.A.; Soni, A.G.; Mahulkar, A.V.; Pandit, A.B. The CFD driven optimisation of a modified venturi for cavitational activity. Can. J. Chem. Eng. 2011, 89, 1366–1375. [Google Scholar] [CrossRef]
  38. Ashrafizadeh, S.M.; Ghassemi, H. Experimental and numerical investigation on the performance of small-sized cavitating venturis. Flow Meas. Instrum. 2015, 42, 6–15. [Google Scholar] [CrossRef]
  39. Saharan, V.K. Computational study of different venturi and orifice type hydrodynamic cavitating devices. J. Hydrodyn. Ser. B 2016, 28, 293–305. [Google Scholar]
  40. Wang, C.; Wang, M.; Yu, Y.; Wang, L.; Wei, W. CFD Simulation of Venturi Tube Hydraulic Cavitation. Pipeline Tech. Equip. 2013, 1, 10–12. [Google Scholar]
  41. Wang, Y.; Zhao, L.; Deng, C.; Zhu, M.; Chen, P.; Su, H.; You, X. Numerical simulation of cavitation effect of the composite cavitation generator based on the Orifice plate and Venturi tube. Environ. Eng. 2012, S2, 458–460. [Google Scholar]
Figure 1. Schematic of the experimental system. 1. Variable-frequency, constant-pressure water supply device; 2. Valve 1; 3. Turbine flowmeter; 4. Pressure gauge; 5. Venturi injector; 6. Pressure gauge; 7. Turbine flowmeter; 8. Valve 2; 9. Valve 3; 10. Tank.
Processes 08 00064 g001
Figure 2. Configuration of the venturi injector.
Processes 08 00064 g002
Figure 3. Computational grids and boundary conditions.
Processes 08 00064 g003
Figure 4. Comparison of experimental and numerical simulation results.
Processes 08 00064 g004
Figure 5. Cavitation contours in the z = 0 section.
Processes 08 00064 g005
Figure 6. Local pressure ratio contours in the z = 0 section.
Processes 08 00064 g006
Figure 7. Velocity contours in the z = 0 section.
Processes 08 00064 g007
Figure 8. Streamlines in the z = 0 section.
Processes 08 00064 g008
Figure 9. Local pressure ratios at different flow ratios.
Processes 08 00064 g009
Figure 10. Turbulent kinetic energy at different outlet pressures.
Processes 08 00064 g010
Figure 11. The volume fraction of suction flow at different outlet pressures.
Processes 08 00064 g011
Table 1. Basic geometric parameters of the venturi injector.
Geometric ParameterValueGeometric ParameterValue
Inlet diameter d1 (mm)20Inlet length L1 (mm)59.5
Outlet diameter d2 (mm)20Outlet length L2 (mm)80
Throat diameter dt (mm)8Contraction section length Lc (mm)16
Suction diameter d3 (mm)17.5Mixing chamber length Lm (mm)1
Contraction angle α (°)41Throat length Lt (mm)5
Diffusion angle β (°)14Diffuser length Ld (mm)48.5
Table 2. Grid independence test of the venturi injector under the flow conditions of P1 = 350 kPa and P2 = 100 kPa.
Grid No.1234
Number of grid cells/10420304060
Q1/(m3/h)4.1704184.2008374.3066054.320276
Qs/(m3/h)0.1669500.1866850.2395190.243264
Table 3. Numerical and experimental results with different turbulence models under P1 = 350 kPa and P2 = 100 kPa flow conditions.
Grid No.Standard k–εRNG k–εRealizable k–εStandard k–ωTest Value
Q1/(m3/h)4.3066054.3224364.3054574.3527214.32
Qs/(m3/h)0.2395190.1866850.185060.1652610.21
Table 4. Simulation results under conditions of P1 = 350 kPa.
P1 (kPa)P2 (kPa)ΔP (kPa)Q1 (m3/h)Qs (m3/h)q
350503004.30660.23760.0552
1002504.30660.23960.0556
1502004.30570.23720.0551
2001504.06510.19120.0470
2501003.71820.02840.0076

