Abstract
Environmental protection pressures and green energy strategies have created major challenges for a cleaner production of China’s coal-fired power generation. Although China’s electric power dispatching department has tried to prioritize clean energy, the current dispatching models lack environmental indicators related to coal-fired power generation. The main purpose of this paper is to provide a comprehensive environmental indicator for the cleanliness evaluation of coal-fired power plants. In this paper, the (Emergy-based Life Cycle Assessment) Em-LCA method is used to measure and analyze environmental related resource consumption, socio-economic investment, and emissions in the whole life cycle of coal-fired power plants. At the same time, based on the above three environmental impacts in the whole life cycle, this paper constructs the (Em-LCA based Cleaner Production Comprehensive Evaluation) ECPCE index to guide a green dispatching plan. By comparing the calculation results of the index, this paper finds that there are differences in the environmental advantages of different generating units in green dispatching, which are closely related to the process management of coal-fired power plants in production and the environment.
1. Introduction
China has always been an active participant in the global response to green development and cleaner production. Over the last two decades, China’s CO2 emissions per unit of GDP has dropped by 46.85%, which basically reversed the rapid growth of China’s greenhouse gas emissions [1]. The forest coverage rate is 22.96%, and the forest stock volume was increased by 4.5 billion cubic meters. Also, by the end of 2018, China’s renewable energy power installed capacity exceeded 700 million kilowatts, of which hydropower, wind power, and photovoltaic installed capacity reached 350 million, 180 million, and 170 million kilowatts, while nuclear power installed capacity reached 44.64 million kilowatts [1].
However, according to Global Energy and CO2 Status Report published by International Energy Agency (IEA) in 2019, energy-related CO2 emissions rose by 1.7% to a historic high of 33.1 Gt CO2 [2]. While emission from all fossil fuels increased, the power sector accounted for nearly two-thirds of emissions growth. Coal-fired power generation is the single largest emitter, accounting for 30% of all energy-related carbon dioxide emissions. China, India and the United States accounted for 85% of the net increase in emissions. In addition, sulfur dioxide, nitrogen oxides, and soot produced by coal-fired power generation are also the main sources of atmospheric pollutants.
By the end of 2018, the installed capacity of coal-fired power was 1.14 billion KW, accounting for 60.00% of China’s national installed capacity [1]. In addition, due to current economic and technical constraints, non-fossil energy power generation in China still cannot completely replace coal-fired power generation. Therefore, it is necessary to strengthen the green power dispatching of coal-fired power generation. In the traditional sense, the green dispatching of coal-fired power generation in China refers to the priority dispatching of units with stable operation of desulfurization, denitrification, and dust removal facilities, and reducing the power generation load of units that do not meet the requirements of desulfurization and denitrification measures as well as whose pollutant discharge is not up to standard. It is not only an effective management method, but also a tool to promote green, low-carbon, and sustainable development.
Traditional power dispatching mainly relies on economic cost as the basis for decision-making, which is also called economic dispatch [3]. With the requirements of green development, environmental aspects are more and more commonly considered in power dispatching areas. King et al. proposed a multi-objective dispatching model in order to minimize both the cost function and the emission functions simultaneously and took SO2 and NOx as the main environmental constraints [4]. Sáenz et al. proposed a two-stage economic and environmental load dispatching framework to fulfill the demand reliably at the lowest possible cost and to minimize emissions and other environmentally adverse effects [5]. Kerl et al. integrated fluctuating pollutant information into electricity dispatching plan to encourage power plant including environmental impacts into cost-base decisions [6]. Liang X et al. emphasized the importance of grid energy saving and environmental protection dispatching by constructing an energy saving and environmental protection (ESEP) model [7]. Goudarzi et al. proposed a combined environmental economic dispatch model which used NOx emissions as the environmental variable [8]. Zhang X et al. proposed to prioritize the generator sets according to the energy consumption level, and then dispatch fossil energy generator sets according to the pollutant discharge level [9]. However, the existing green power dispatching focuses on emission reduction and energy conservation, while economic costs are the main decision support factors. When considering environmental factors, only the final governance results are considered, and the analysis of the environmental impact of the whole process is commonly ignored.
One of the tools widely used in process management of coal-fired power production is the life cycle assessment (LCA). LCA methodology is based on the axiom that all phases in the life of a product cause environmental impacts and must therefore be analyzed, including raw material acquisition, product manufacturing, transportation, installation, operation and maintenance, and ultimately recycling and waste management [10]. Spath et al. performed LCA on coal-fired power production and examined the environmental aspects of current and future pulverized coal boiler systems [11]. Wu et al. compared three typical pollution control processes in coal-fired power plants by applying LCA and considered the energy consumption, resource consumption, and pollutant emissions of each process [12]. Say et al. assessed the environmental impacts of a coal-fired power plant in Turkey [13]. Steinmann et al. presented a novel method of Monte Carlo simulation for differentiating uncertainty from variability in LCAs of coal-fired power generation in the United States [14]. Babbitt and Lindner quantitatively and qualitatively compared the contributions of different types of pollution, including air pollution, water pollution, solid waste pollution, and heavy metal pollution by applying LCA [15]. Henriksson et al. used LCA to calculate unit process data for Chinese coal-fired power generation at both the national and the provincial level [16]. However, dealing with non-commensurate units with varying environmental impacts (kilograms of CO2 emissions, kcals of energy consumption) and socio-economic costs is a major challenge when using LCA for coal-fired power production.
In the early 1980s, Odum and co-workers proposed and developed the groundbreaking idea of emergy as a way of understanding the behavior of self-organized systems, valuing ecological products and services, and analyzing ecological and economic systems together [17]. Emergy analysis is a method based on thermodynamic laws, general system theories [18], energetics [19], and measuring both the productivity of natural resources and human socio-economic resources. To develop emergy analysis, a system is converted into a network of energy streams and a measure of solar emergy is assigned to energy flows. Solar emergy represents the total amount of available solar energy that was directly or indirectly used in order to generate or support a given product or service, and it is calculated in solar equivalent joules (sej) [20]. Some attempts have been made to analyze the power generation production system by using emergy analysis. Wang et al. applied emergy analysis to systematic evaluation of a combined heat and power plant eco-industrial park (CHP plant EIP), considering both material circulation and energy cascade utilization and clean energy technology aspects [21]. Zhang et al. conducted an emergy evaluation and an economic analysis to find out why China’s tidal power generation industry has been largely lagging behind other renewable energy alternatives [22]. Wang and Zhang proposed new emergy indices for material circulation utilization and energy cascade utilization to evaluate the emergy of a power plant eco industrial park [23]. Zhang et al. combined the characteristics of emergy and exergy analysis in order to evaluate the sustainable development level of three thermal power plants [24]. Sha and Herme used an energy-focused environmental accounting method based on the embodied solar energy (emergy) principle to evaluate biomass and coal-based combined heat and power (CHP) cogeneration processes [25].
Some attempts have been made to combine LCA method and emergy analysis. Jiang et al. applied emergy-based LCA (Em-LCA) methodology to investigate the sustainability of laser engineered net shaping (LENS) by comparing that of the computer numerical control (CNC) machining for gear manufacturing [26]. Reza et al. applied emergy-based LCA (Em-LCA) to facilitate an informed decision making process for different asset management scenarios by identifying and quantifying the attributes of TBL impacts over the life cycle of a civil infrastructure system [27]. Duan et al. employed emergy-based LCA to investigate a typical urban wetland park, the Green Lake Urban Wetland Park (GLUWP) of Beijing in terms of its environmental and capital inputs, ecosystem services and organic matter yields, environmental support, and sustainability [28]. Wang et al. used emergy-based LCA to explore the ecological and economic effects of the wheat-maize double-cropping system on large-scale grain production compared with small-scale production [29]. The Emergy analysis method can solve the problem of unit inconsistency between different material flows, and the method is widely used in comprehensive environmental evaluation. However, this method is less commonly used in the field of power dispatching.
In summary, the current power dispatch field has the following problems: (i) When considering the environmental advantages of units, power dispatching takes the final environmental treatment results (whether pollutant emission reaches the standard or not) as the criterion, and lacks the attention needed to process environmental management performance. (ii) The reference indicators for power dispatching decisions are mainly based on economic costs and a lack of independent environmental indicators. (iii) Due to the complexity of environmental factors, the environmental contribution or impact of inputs and outputs of different processes cannot be directly compared horizontally.
The main purpose of this study is to provide a process-based environmental decision-making reference for clean power dispatching by enabling a cleaner production evaluation of coal-fired power generation. The main contributions of this paper are as follows: (i) This paper extends the life cycle boundary of coal-fired power generation. In addition to the production process itself, all upstream and downstream stages that may contain environmental impacts were also considered. (ii) The emergy analysis method was used to calculate and compare the resource consumption, socio-economic investment, and emissions during the whole life cycle of coal-fired power generation, thus achieving a direct horizontal comparison of different life cycle stages. (iii) This paper constructs the (Em-LCA based Cleaner Production Comprehensive Evaluation) ECPCE index to provide a separate environmental indicator for clean power dispatching.
The rest of the paper is organized as follows: The second section introduces the method used in this paper and the background of the case study; the third section shows the results of the case study and relevant discussions; the fourth section is the conclusion.
2. Materials and Methods
In this paper, the representative coal-fired power plants in China were selected as the research object, and the Em-LCA method was used to quantify the resource consumption, socio-economic investment, and emissions of coal-fired units in the whole life cycle, while a comprehensive cleaner production evaluation index reflecting the above quantitative results was designed to comprehensively evaluate the cleaner production level of different units. The power dispatching organization could arrange the units with a high cleaner production level to generate power preferentially according to the ranking results of the above indexes.
2.1. Background and Materials
We selected the Cangdong Power Plant as a research target, located in Hebei Province, China. The Cangdong Power Plant is a coal-fired combined heat and power (CHP) power plant, mainly supplying electricity for heating in North China and Southern Hebei. The Cangdong power plant has two 600 MW subcritical units and two 660 MW supercritical units. It is a large and modern power plant with management with extensive experience. The power plant uses Shenfu low-sulfur coal and has a high-efficiency electrostatic precipitator, and synchronously uses a flue gas desulfurization device to reduce its impacts on the environment.
The main data of this paper were obtained from the 2019 Environmental Protection Operation and Pollutant Discharge Statistics Report, Environmental Statement, and Production Telecommunications Express provided by Cangdong Power Plant. Data on pollutant emissions were tested and certified by external environmental companies and monitored by the local environmental protection department. Financial data and production data were audited by Klynveld Peat Marwick Goerdeler (KPMG). The CO2 emission data were calculated by a third-party organization according to the Requirements of the Greenhouse Gas Emission Accounting and Reporting (Part 1: Power generation enterprise).
2.2. Em-LCA Method
In this research, to meet the challenges of the cleaner production evaluation of coal-fired power generation, an emergy-base life cycle assessment (Em-LCA) method was proposed. Em-LCA aims to offer a more quantitative and comprehensive technique than the existing LCA method. The Emergy concept has been applied as a valuable complement, rather than an alternative to existing LCA, as standard LCA is an important part of this method. By applying Em-LCA, it is possible to transform all life cycle inputs and outputs throughout the life cycle of the coal-fired power generation. In this study, the Em-LCA method consisted of the following steps: Em-LCA scope and boundary identification; inventory analysis; and emergy quantification.
2.2.1. Em-LCA Scope and System Boundary Identification
This paper divides the life cycle of coal-fired power generation into five stages. In addition to power generation and waste treatment, we also considered coal mining, coal washing, and coal transportation, as shown in Figure 1. The benefit of this is that it expanded the system boundary of coal-fired power generation and laid the foundation for a more comprehensive cleaner production assessment. At each stage of the life cycle, the following three types of environmental impacts should be considered:
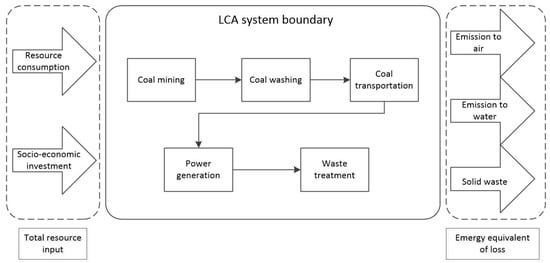
Figure 1.
The emergy-base life cycle assessment (Em-LCA) methodology for coal-fired power generation.
- resource consumption including renewable and non-renewable resources,
- socio-economic investment including monetary costs and purchased labor and services,
- emissions including solid waste, atmospheric pollutants, and water pollutants.
2.2.2. Inventory Analysis
After the system boundary was established, the second step was to do an inventory analysis. Inventory analysis requires collecting data for all process units and life cycle stages, and their associated mass flows, as well as data on emissions and discharges into the receiving waters, soil, and air. The life cycle inventories according to the collected data of four power generation units are listed in Table 1, Table 2, Table 3 and Table 4.

Table 1.
Life cycle inventory of a 600 MW coal-fired generating unit (Unit 1).
Table 2.
Life cycle inventory of a 600 MW coal-fired generating unit (Unit 2).
Table 3.
Life cycle inventory of a 660 MW coal-fired generating unit (Unit 3).
Table 4.
Life cycle inventory of a 660 MW coal-fired generating unit (Unit 4).
2.2.3. Emergy Quantification
In step 1, for determining the scope and system boundary, this paper divides the environmental impacts in the life cycle into three categories: resource consumption, socio-economic investment, and emissions. The purpose of Emergy quantification was to translate these three types of environmental impact into a uniform emergy unit. The following sections explain how to calculate the emergy values of these three types of environmental impacts.
Resource Consumption
This paper divides resource consumption into two types: renewable resources and non-renewable resources. Renewable resources refer to material resources that can be naturally generated, grown, multiplied, or increased in reserves through natural or artificial activities at a certain time (one year or several decades) after being exploited by humans. It includes surface water, soil, plants, animals, aquatic organisms, micro-organisms, forests, grasslands, air, sunlight (solar), climate resources, and marine resources. Non-renewable resources are material resources that cannot be naturally formed or produced over a long period of time (within millions of years) after being exploited by humans. It includes various metal minerals, non-metallic minerals, rocks, solid fuels (coal, stone coal, peat), liquid fuel (petroleum), gaseous fuel (natural gas), etc. The emergy quantification method of resource consumption was shown in Equation (1):
where denotes the emergy value of the i-th resource, is the amount of i-th resource consumed and is the transformity of the i-th resource.
Socio-Economic Investment
Socio-economic investments usually include monetary costs, such as purchased labor and services. This paper further divides socio-economic investment into four categories: resource consumption costs, air pollution costs, water pollution cost and solid waste pollution cost. One of the differences between the Em-LCA approach and the traditional LCA approach is the concern for socio-economic factors. The emergy quantification method of socio—economic investment in different life cycle stages is shown in Equation (2):
where denotes emergy value of the i-th kind of socio-economic investment, was the monetary amount of i-th socio-economic investment (expressed in national currency), it should normally be converted to dollars by multiplying and exchange rate (USD:CNY = 7.067 in this article) and is the transformity of socio-economic investment.
Emissions
The consequences of airborne and water borne emissions and solid waste generation can be quantified based on the natural and human capital losses or preliminary damage (e.g., acidification, eutrophication of laces, ecotoxicity, and human health) that can harm the ecosystem, people’s health, and the economy.
In this research, the approach of Eco-indicator 99 was used to evaluate the preliminary damage due to natural and human capital losses. According to Eco-indicator 99, emission impacts on ecosystem quality and human health can be expressed by two indicators:
- (1)
- Potentially disappeared fraction (PDF) of species in the affected ecosystem
- (2)
- Disability adjusted life years per unit emission (DALY).
Then these two indicators can be converted to a corresponding emergy equivalent of loss (EL) as proposed by Liu et al. [30,31] The emergy equivalent of loss in support of local ecological resources can be measured by Equation (3):
where denotes the emergy equivalent of loss of regional natural resources due to given emissions, is the amount of i-th emission released was calculated as , and represents the unit of annual emergy allocated to regional natural capital, here 1.39 1022 was used [32].
The emergy equivalent of loss in support of human resources can be calculated using Equation (4):
where represents the emergy equivalent of human health loss due to given emissions , DALY represents the disability adjusted life years per unit emission (yr ), and was the total annyal emergy per population, here 1.83 1015 was used [33].
In addition, damage associated with solid waste generation can be quantified based on land occupation for landfill and disposal using Equation (5):
where represents emergy equivalent of natural loss due to discharge of solid waste on land, is the given solid waste total mass, represents the land occupation factor, and is the emergy value of land restoration per area (sej/ha).
2.3. Em-LCA Based Cleaner Production Comprehensive Evaluation (ECPCE) Index
In order to comprehensively reflect the cleaner production level of different units/power plants, this paper includes an Em-LCA based cleaner production comprehensive evaluation (ECPCE) index based on the above quantified emergy values. The intrinsic logic of the index was to weight and sum the three types of environmental impacts at different stages of the life cycle. The basic idea of the quantitative approach to environmental impact was to measure the emergy value of the ecosystem of resource consumption, socio-economic investment, and emissions in the context of cleaner production. Therefore, the smaller the index, the less emergy was consumed by production, that is, it occupies less resources and consumes less environmental resources to dilute pollution emissions, and the cleaner production level is higher.
On the one hand, the calculation process of the index can be used as a management tool for power plant process management, and the calculation results of the index can provide a reference for the cleaner dispatching of China’s coal-fired power generation industry. The dispatching department can sort the cleaner production level according to the calculation result of the index, and provides priority to the generation unit with a high cleaning level. The calculation method of the ECPCE index is shown as Equation (6):
where the represents the Em-LCA based cleaner production comprehensive evaluation index of n-th generation unit, is the weight of the j-th environmental impact of the i-th stage, and is the emergy of the j-th environmental impact of the i-th stage.
3. Results and Discussion
3.1. Em-LCA Environmental Impacts Analysis
Table 5, Table 6, Table 7 and Table 8 shows the life cycle resource consumption of four generating units by multiplying the data in Table 1, Table 2, Table 3 and Table 4 by the corresponding emergy transformities. The transformities used in this paper come from the research of Odum [34] and his coworkers [23,35,36,37,38,39].
Table 5.
Life cycle resource consumption of Unit 1.
Table 6.
Life cycle resource consumption of Unit 2.
Table 7.
Life cycle resource consumption of Unit 3.
Table 8.
Life cycle resource consumption of Unit 4.
The results in Figure 2 show that the consumption of renewable resources is greater than the consumption of non-renewable resources. Similar results have been reported by Wang et al. [40]. The results of this article further explain the results of the consumption of renewable resources. Figure 3 demonstrates life cycle resources consumption of the whole power plant. The main source of renewable resource consumption is steel on the coal mining stage and water resources, power resources, and liquid ammonia consumed in the waste treatment stage. China’s coal exploration is mainly based on mine mining, which is more difficult than open pit mining and therefore requires more resources. The coal of the power plant studied in this paper is mainly imported from Shanxi Province of China and the vast majority of coal in that region use mine mining methods. The renewable resources consumed in the waste treatment stage are mainly due to the operation of desulfurization, denitrification, and dust removal devices. Due to the policy requirements of the environmental regulation department, coal-fired power plants have generally carried out ultra-low emissions modification to control the emission concentrations of atmospheric pollutants such as SO2 and NOx. Although these devices effectively reduce pollution emissions and improve air quality, their resource consumption should be taken seriously by management departments. Wang et al. [40] believe that the main renewable resource consumed in coal-fired power generation is water. However, a further analysis of the composition of renewable resource consumption in this paper found that in addition to water resources, the use of steel and environmental protection materials is also an important consumption area. These consumptions are mainly related to the coal mining and waste treatment stages. This means that in addition to improving power generation efficiency, transforming coal mining methods and developing more energy-efficient environmental protection technologies are also crucial for cleaner production of coal-fired power plants.
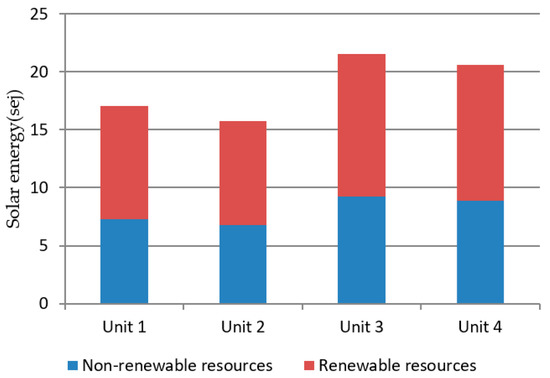
Figure 2.
Comparisons of renewable and non-renewable resource consumption (×1024).
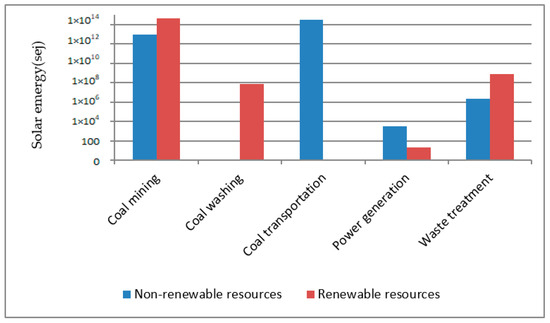
Figure 3.
Life Cycle renewable and non-renewable resource consumption (×1011).
Table 9 shows the life cycle socio-economic investment for four power generation units expressed in emergy. Figure 4 shows the total emergy consumption of socio-economic investment of four generating units at different life cycle stages. The results show that socio-economic investment is consumed the most at the generation stage.
Table 9.
Life cycle socio-economic investment for four power generation units.
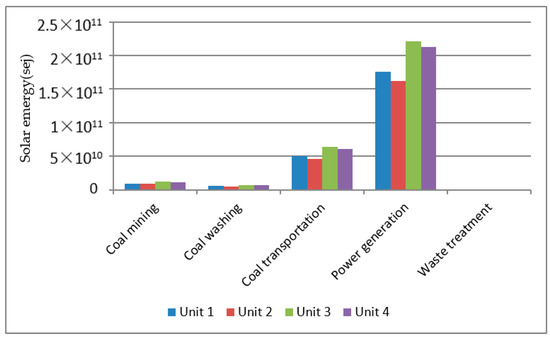
Figure 4.
Life Cycle socio-economic investment.
Although the investment consumed in the generation stage is large, this paper pays more attention to the investment in the waste treatment stage, as shown in Figure 5, because it is closely related to environmental issues. Xie et al. [41] analyzed the environmental protection costs of coal-fired power generation in China and found that they accounted for about 12% of the total costs, including the cost of equipment as well as operation and maintenance costs of power generation plants to reduce pollutant emissions, and the sewage charges paid to relevant departments. Most of these environmental protection costs occur at the waste disposal stage. This article analyzed the environmental cost components of the waste treatment stage in detail from a material perspective.
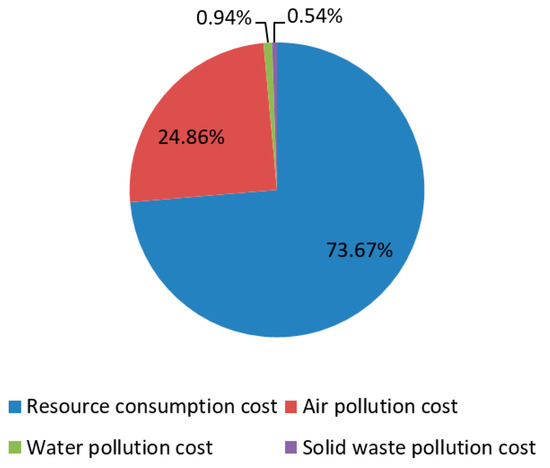
Figure 5.
Socio-economic investment of waste treatment stage.
Through further analysis of the basic components of socio-economic investment in the waste treatment stage, this paper finds that the socio-economic investment in the waste treatment stage is mainly caused by the cost of resource consumption, followed by the cost of air pollutant control. Water pollution costs and solid waste pollution costs account for only about 1.5 percent of the total. This shows that most of the socio-economic investment in power plants is spent on purchasing environmental protection materials and air pollution control, while little attention is paid to water pollution control and solid waste pollution control. The reason for this is that, in the first place, the liquid ammonia used in denitration is expensive. The average price of liquid ammonia used in the power plant in this paper is about 3150 CNY per ton. Moreover, because China has clear limits on the concentration of atmospheric pollutants emitted by coal-fired power plants, power plants often seek to reduce the concentration of atmospheric pollutants, which in turn results in substantial investment in technology and equipment.
Table 10 shows the result of emergy equivalent of loss of regional natural resources, human health loss due to given emission, and the emergy equivalent of natural loss due to discharge of solid waste on land of four power generating units. Figure 6 shows the life cycle emission emergy of whole coal-fired power plants.
Table 10.
Life cycle emission for four power generation units.
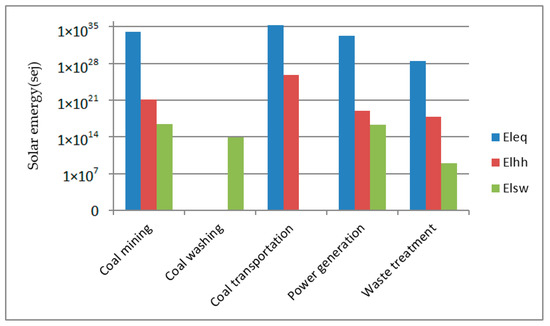
Figure 6.
Life cycle emission emergy of whole coal-fired power plant.
According to Figure 6, the coal transportation stage causes more natural and human capital losses due to emissions into the air and water, and discharge of solid waste on land. In addition, we found that the three phases associated with coal as a whole cause more natural and human capital losses than the two phases inside the coal-fired power plant. Reza et al. [42] referred to this type of environmental impact as upstream impact and downstream impact. From this perspective, the upstream impact of coal-fired power plants is greater than the downstream impact. This tells us that although the environmental management facilities inside coal-fired power plants can greatly reduce the emission of terminal pollutants, if we do not pay attention to the resource and environmental management of the upstream environmental management, then coal-fired power generation is still a burden to the ecological environment of the whole society.
3.2. Calculation Results of ECPCE Index
In this paper, Delphi expert scoring method is used to assign weights to different environmental impact categories in life cycle stages. The results of the weighting are shown in Table 11.
Table 11.
Life cycle weightings of environmental impact categories.
Figure 7 shows the results from the ECPCE index of four generating units. Generating unit 4 ranked first while generating unit 3 ranked last. In addition, generating unit 4 was slightly better than unit 2. Therefore, unit 4 has an environmental advantage in the cleaning dispatching plan, followed by unit 1 and unit 2, and unit 3 has the smallest environmental advantage in the cleaning dispatching plan.
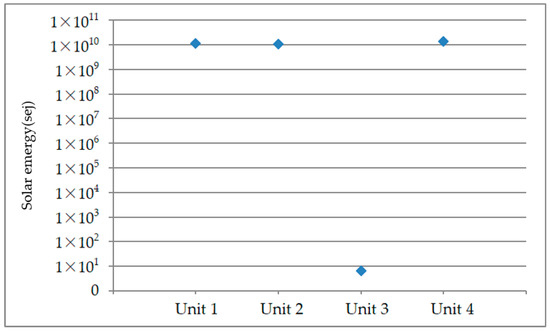
Figure 7.
The ECPCE index of four generating units.
4. Conclusions
With the requirement of green development and the urgent need for clean energy, the green dispatching of coal-fired power has become an important issue for the development of green and sustainable power and energy. However, the existing green dispatching plans are mainly based on economic indicators, and lack of attention to environmental process management. The main purpose of this study is to provide a process based environmental indicator for clean power dispatching.
In this paper, the environmental impact of coal-fired power plants is divided into three categories: resource consumption, socio-economic investment and emissions. The above three categories of environmental impact in the whole life cycle from coal mining stage to waste disposal stage are analyzed. In terms of resource consumption, the consumption of renewable resources is greater than that of non-renewable resources, and the main consumption of renewable resources comes from the coal mining stage and waste disposal stage. The consumption of renewable resources in the stage of coal mining is mainly related to the method of coal mining, while the consumption of renewable resources in the stage of waste treatment mainly comes from the consumption of raw materials for desulfurization, denitrification, and other environmental technologies. For the aspect of socio-economic investment, although the socio-economic investment in the waste treatment stage is relatively small, this paper obtains a meaningful conclusion related to environmental regulation by analyzing its proportion. Most of the socio-economic investment in power plants is spent on environmental protection materials and air pollution control, while little attention is paid to water pollution control and solid waste pollution control. This shows that when there is a clear environmental regulation standard, management of the power plants will increase input and investment to help control emissions in this area (such as air pollution), while the power plant lacks attention towards areas with relatively loose regulation policies such as water pollution and solid waste pollution. In terms of emissions, the three phases associated with coal as a whole cause more natural and human capital losses than the two phases inside a coal-fired power plant. This tells us that although the environmental management facilities inside the coal fired power plants can substantially reduce the emission of terminal pollutants, if we do not pay attention to the resource and environmental management of the input side management, then coal fired power generation still can be a burden to the broader ecological environment. Finally, three kinds of environmental impacts in the whole life cycle of four generating units in the case are calculated, and the ECPCE index is obtained. The result of the index shows that the environmental advantages of the four units are different for the aspect of green dispatching. The environmental advantages of unit 4 are the most obvious, and it can enjoy a priority power generation right in the green dispatching plan, while the ECPCE index of unit 3 is obviously smaller than the other three units, which suggests a relatively inferior position in the green dispatching plan.
The policy implications of this article are that the green development of China’s power industry cannot ignore traditional power generation. In the context that new energy power generation cannot completely replace coal-fired power generation in the short term, the government should pay attention to the environmental effects of coal-fired power generation, encourage coal-fired power with environmental advantages by giving them priority access to the grid, and thus promote the coordinated green development of clean energy and coal-fired power generation.
The limitations of this paper are: (i) This paper measures the environmental impacts of coal-fired power plants from the perspective of material input-output, but because the power plant’s environmental accounting is relatively simple, some materials that have an impact on the environment may be omitted. (ii) The evaluation index constructed in this paper using the emergy analysis method should theoretically be used to evaluate the production cleanliness of all power generation methods. However, this paper only studies the applicability of coal-fired power plants. (iii) Due to the lack of relevant data, this study did not track the flow of waste after leaving the system boundary. Future research can be conducted based on the following areas: (i) In the process of data collection, researchers should perform more detailed accounting of the material flow of coal-fired power plants to increase the completeness and accuracy of the evaluation results. (ii) Expand this model to renewable energy generation such as hydropower and wind power. By comprehensively evaluating the production cleanliness of different power generation types, different methods for green dispatching plans of regional power grids could be created. (iii) Future research should continue to track where emissions go until they are completely absorbed by the environment.
Author Contributions
T.L. and Y.M.S. designed the research; Y.M.S. and A.L. completed the calculations and analyzed the data; Y.M.S. wrote the original draft; A.L. and J.S. reviewed and edited the paper. C.L. and M.G. provided the resources of the case study. All authors have read and agreed to the published version of the manuscript.
Funding
This research was funded by the Fundamental Research Funds for the Central Universities (NO. 003-JB2019138).
Acknowledgments
The authors wish to acknowledge the anonymous reviewers for their suggestions that have improved our paper.
Conflicts of Interest
The authors declare no conflict of interest.
Abbreviations
| Em-LCA | Energy-based life cycle assessment |
| Sej | Solar equivalent joules |
| Potentially disappeared fraction of species in the affected ecosystem | |
| DALY | Disability adjusted life years per unit emission |
| Energy equivalent of loss of regional natural resources due to given emission | |
| Energy equivalent of human health loss due to given emission | |
| Energy equivalent of natural loss due to discharge of solid waste on land | |
| The unit of annual emergy allocated to regional natural capital | |
| Total annual emergy per population | |
| Energy value of land restoration per area |
References
- Huo, T.; Ren, H.; Zhang, X.; Cai, W.; Feng, W.; Zhou, N.; Wang, X. China Statistical Yearbook 2018; China Statistics Press: Beijing, China, 2018. [Google Scholar]
- National Development and Reform Commission. Available online: http://www.ndrc.gov.cn/fzgggz/fzgh/ghwb/gjjgh/201706/t20170605_849994.htmlhttp://www.ndrc.gov.cn/fzgggz/fzgh/ghwb/gjjgh/201706/t20170605_849994.html (accessed on 19 November 2019).
- Bostan, V.; Li, L. A decision model for reducing active power losses during electric power dispatching. Comput. Oper. Res. 2003, 30, 833–849. [Google Scholar] [CrossRef]
- King, T.D.; El-Hawary, M.E.; El-Hawary, F. Optimal environmental dispatching of electric power systems via an improved hopfield neural network model. IEEE Trans. Power Syst. 1995, 10, 1559–1565. [Google Scholar] [CrossRef]
- Sáenz, J.P.; Celik, N.; Xi, H. Two-stage economic and environmental load dispatching framework using particle filtering. Int. J. Electr. Power Energy Syst. 2013, 48, 93–110. [Google Scholar] [CrossRef]
- Kerl, P.Y.; Zhang, W.; Moreno-Cruz, J.B.; Nenes, A.; Realff, M.J.; Russell, A.G. New approach for optimal electricity planning and dispatching with hourly time-scale air quality and health considerations. Proc. Natl. Acad. Sci. USA 2015, 112, 10884–10889. [Google Scholar] [CrossRef] [PubMed]
- Liang, X.; Ma, J.; Li, D.; Wang, J. Grid dispatching of energy saving and environmental protection based on thermodynamic system model with flow dimension. In Proceedings of the 2nd International Conference on Mechatronics and Automatic Control, Beijing, China, 20–21 September 2014. [Google Scholar] [CrossRef]
- Goudarzi, A.; Swanson, A.G.; Van Coller, J.; Siano, P. Smart real-time scheduling of generating units in an electricity market considering environmental aspects and physical constraints of generators. Appl. Energy 2017, 189, 667–696. [Google Scholar] [CrossRef]
- Zhang, X.; Wang, H. Optimal Dispatch Method of Transmission and Distribution Coordination for Power Systems with High Proportion of Renewable Energy. Autom. Electr. Power Syst. 2019, 43, 67–75. [Google Scholar] [CrossRef]
- Lippiatt, B. BEES 2.0: Building for Environmental and Econominc Sustainability, Technical Manual and User Guide; National Institute of Standards and Technology: Gaithersburg, MD, USA, 2000.
- Spath, P.L.; Mann, M.K.; Kerr, D.R. Life Cycle Assessment of Coal-Fired Power Production; Topical; Office of Scientific & Technical Information Technical Reports: Golden, CO, USA, 1999. [CrossRef]
- Wu, X.; Wu, K.; Zhang, Y.; Hong, Q.; Cen, K. Comparative life cycle assessment and economic analysis of typical flue-gas cleaning processes of coal-fired power plants in china. J. Clean. Prod. 2016, 142, 3236–3242. [Google Scholar] [CrossRef]
- Say, N.P.; Yucel, M.; Yilmazer, M. A computer-based system for environmental impact assessment (EIA) applications to energy power stations in Turkey: CEDINFO. Energy Policy 2016, 35, 6395–6401. [Google Scholar] [CrossRef]
- Steinmann, Z.J.N.; Hauck, M.; Karuppiah, R.; Laurenzi, I.J.; Huijbregts, M.A.J. A methodology for separating uncertainty and variability in the life cycle greenhouse gas emissions of coal-lueled power generation in the USA. Int. J. Life Cycle Assess. 2014, 19, 1146–1155. [Google Scholar] [CrossRef]
- Bannitt, C.W.; Lindner, A.S. A life cycle inventory of coal used for electricity production in Florida. J. Clean. Prod. 2005, 13, 903–912. [Google Scholar] [CrossRef]
- Henriksson, P.J.G.; Zhang, W.; Guinee, J.B. Updated unit process data for coal-based energy in China including parameters for overall dispersions. Int. J. Life Cycle Assess. 2014, 20, 185–195. [Google Scholar] [CrossRef]
- Hau, J.L.; Bakshi, B.R. Promise and problems of emergy analysis. Ecol. Model. 2004, 178, 215–225. [Google Scholar] [CrossRef]
- Bertalanffy, L.V. General System Theory; George Braziller: New York, NY, USA, 1973. [Google Scholar]
- Lotka, A.J. The Law of Evolution as a maximal Principle. Hum. Biol. 1945, 17, 167–194. [Google Scholar]
- Pulselli, R.M.; Simoncini, E.; Marchettini, N. Energy and emergy based cost–benefit evaluation of building envelopes relative to geographical location and climate. Build. Environ. 2009, 44, 920–928. [Google Scholar] [CrossRef]
- Wang, L.; Ni, W.; Li, Z. Emergy evaluation of combined heat and power plant eco-industrial park (CHP plant EIP). Resour. Conserv. Recycl. 2006, 48, 56–70. [Google Scholar] [CrossRef]
- Zhang, L.X.; Tang, S.J.; Hao, Y. Integrated emergy and economic evaluation of a case tidal power plant in China. J. Clean. Prod. 2018, 182, 38–45. [Google Scholar] [CrossRef]
- Wang, L.; Zhang, J. Emergy evaluation of power plant eco-industrial park. Chin. J. Appl. Ecol. 2004, 15, 1047. [Google Scholar] [CrossRef]
- Zhang, Y.; Qin, F.; Shao, S. An Evaluation of the Sustainability of Thermal Power Plants Based on Emergy and Exergy Theory. Energy Sources Part A Recovery Util. Environ. Eff. 2012, 34, 1249–1258. [Google Scholar] [CrossRef]
- Sha, S.; Hurme, M. Emergy evaluation of combined heat and power plant processes. Appl. Therm. Eng. 2012, 43, 67–74. [Google Scholar] [CrossRef]
- Jiang, Q.; Liu, Z.; Li, T. Emergy-based life-cycle assessment (Em-LCA) for sustainability assessment: A case study of laser additive manufacturing versus CNC machining. Int. J. Adv. Manuf. Technol. 2019, 102, 4109–4120. [Google Scholar] [CrossRef]
- Reza, B.; Sadiq, R.; Hewage, K. Emergy-based life cycle assessment (Em-LCA) for sustainability appraisal of infrastructure systems: A case study on paved roads. Clean. Technol. Environ. Policy 2014, 16, 251–266. [Google Scholar] [CrossRef]
- Duan, N.; Liu, X.D.; Dai, J. Evaluating the environmental impacts of an urban wetland park based on emergy accounting and life cycle assessment: A case study in Beijing. Ecol. Model. 2011, 222, 351–359. [Google Scholar] [CrossRef]
- Wang, X.; Chen, Y.; Sui, P. Emergy analysis of grain production systems on large-scale farms in the North China Plain based on LCA. Agric. Syst. 2014, 128, 66–78. [Google Scholar] [CrossRef]
- Liu, G.; Yang, Z.; Chen, B.; Ulgiati, S. Monitoring trends of urban development and environmental impact of Beijing, 1999–2006. Sci. Total. Environ. 2011, 409, 3295–3308. [Google Scholar] [CrossRef] [PubMed]
- Liu, G.; Yang, Z.; Chen, B.; Zhang, L. Analysis of resource and imission impacts: An emergy-based multiple spatial scale framework for urban ecological and economic evaluation. Entropy 2011, 13, 720. [Google Scholar] [CrossRef]
- Na, L. Eco-Efficiency Assessment of Remanufactured Truck Engines Based on a Hybrid Approach of Emergy and Life Cycle Assessment; Dalian University of Technology: Dalian, China, 2016. [Google Scholar]
- Kaicheng, X.; Yu, G.; Pu, W. Emergy analysis of planting economic ecosystem in intensive agricultural region of North China plain: A case study in Cangzhou of Hebei province. Ecol. Environ. Sci. 2015, 2, 592–597. [Google Scholar] [CrossRef]
- Odum, H.T. Emergy evaluation of an OTEC electrical power system. Energy Econ. 2000, 2, 389–393. [Google Scholar] [CrossRef]
- Pan, H.; Zhang, X.; Wu, J.; Zhang, Y.Z.; Lin, L.L.; Yang, G.; Deng, S.H.; Li, L.; Yu, X.Y.; Qi, H. Sustainability evaluation of a steel production system in China based on emergy. J. Clean. Prod. 2015, 112, 1498–1509. [Google Scholar] [CrossRef]
- Jiang, M.M.; Zhou, J.B.; Chen, B.; Chen, G.Q. Emergy-based ecological account for the Chinese economy in 2004. Commun. Nonlinear Sci. Numer. Simul. 2008, 13, 2337–2356. [Google Scholar] [CrossRef]
- Ma, F.; Eneji, A.E.; Wu, Y. An Evaluation of Input–Output Value for Sustainability in a Chinese Steel Production System Based on Emergy Analysis. Sustainability 2018, 10, 4749. [Google Scholar] [CrossRef]
- Liping, J.; Bin, C.; Zhifeng, Y. Emergy analysis for the whole biodiesel production process with jatropha curcas oil as raw materials. Acta Ecol. Sin. 2009, 30, 5646–5652. [Google Scholar]
- Brandt-Williams, S. Handbook of Emergy Evaluation Folio 4; Emergy of Florida Agriculture, Center for Environmental Policy, University of Florida: Gainesville, FL, USA, 2002. [Google Scholar]
- Wang, J.; Wang, R.; Zhu, Y.; Li, J. Life cycle assessment and environmental cost accounting of coal-fired power generation in china. Energy Policy 2018, 115, 374–384. [Google Scholar] [CrossRef]
- Xie, Y.; Tan, Z.; Cheng, J.; Hu, Q.; Wang, Z. Generation Cost Analysis of Coal-Fired Power Plant in Environment of Energy Saving and Emission Reduction Dispatching. Power Syst. Technol. 2011, 35, 143–148. [Google Scholar]
- Reza, B.; Sadiq, R.; Hewage, K. Emergy-based life cycle assessment (Em-LCA) of multi-unit and single-family residential buildings in Canada. Int. J. Sustain. Built Environ. 2014, 3, 207–224. [Google Scholar] [CrossRef]
© 2020 by the authors. Licensee MDPI, Basel, Switzerland. This article is an open access article distributed under the terms and conditions of the Creative Commons Attribution (CC BY) license (http://creativecommons.org/licenses/by/4.0/).