Digitalizing the Paints and Coatings Development Process

Abstract
1. Introduction
2. Methods
- te—expected time
- to—optimistic time
- tm—most probable time
- tp—pessimistic time.
- the waiting time—time spent waiting for a resource to become available. It is possible to measure the waiting time for each activity or for the whole case; attributes specify the wait time accrued for process folders as a rule;
- the service (processing) time—the actual work time put into the case. In the case of concurrency, the total service time (the sum of the time spent on the execution of various activities) may exceed the execution time. However, the service time is usually only part of the execution time; attributes specify the duration of time that may elapse between the start time and end time of a task;
- the orientation time—attributes specify the orientation times required for a function or resource based on the last simulation run;
- the lead (throughput) time—the total time from beginning to end of an individual case of process execution. The average execution time can also be measured, while the level of variance is important: it is not the same if all the cases last for about two weeks or if the individual lasts only a few hours and others for more than one month. The total time for carrying out a function one time should be the sum of the processing time and the orientation time, excluding the wait time.
- static simulation—static models include the linear programming technique, which is an example of an analytical mathematical approach that can be used to solve management decision-making problems. A computer spreadsheet is an example of a numerical static model in which relationships can be constructed and the system behavior studied for different scenarios.
- dynamic simulation—a dynamic mathematical model allows changes in system attributes to be derived as a function of time. The derivation may be made with an analytical solution or with a numerical computation, depending upon the complexity of the model (process). Models that are of a dynamic nature and cannot be solved analytically must use the simulation approach. A classification is made between continuous and discrete event simulation model types. A discrete system changes only at discrete points in time. In practice, most continuous systems can be modeled as discrete at different levels of abstraction.
- defining simulation objectives;
- identifying the system/process;
- collecting and analyzing system/process data;
- preparation of the simulation model and program;
- simulation model evaluation;
- simulation execution;
- analysis of simulation results;
- simulation conclusion.
3. Results
- development of a new product without ICT support (classical process),
- development of a new product with ICT support and local database use.
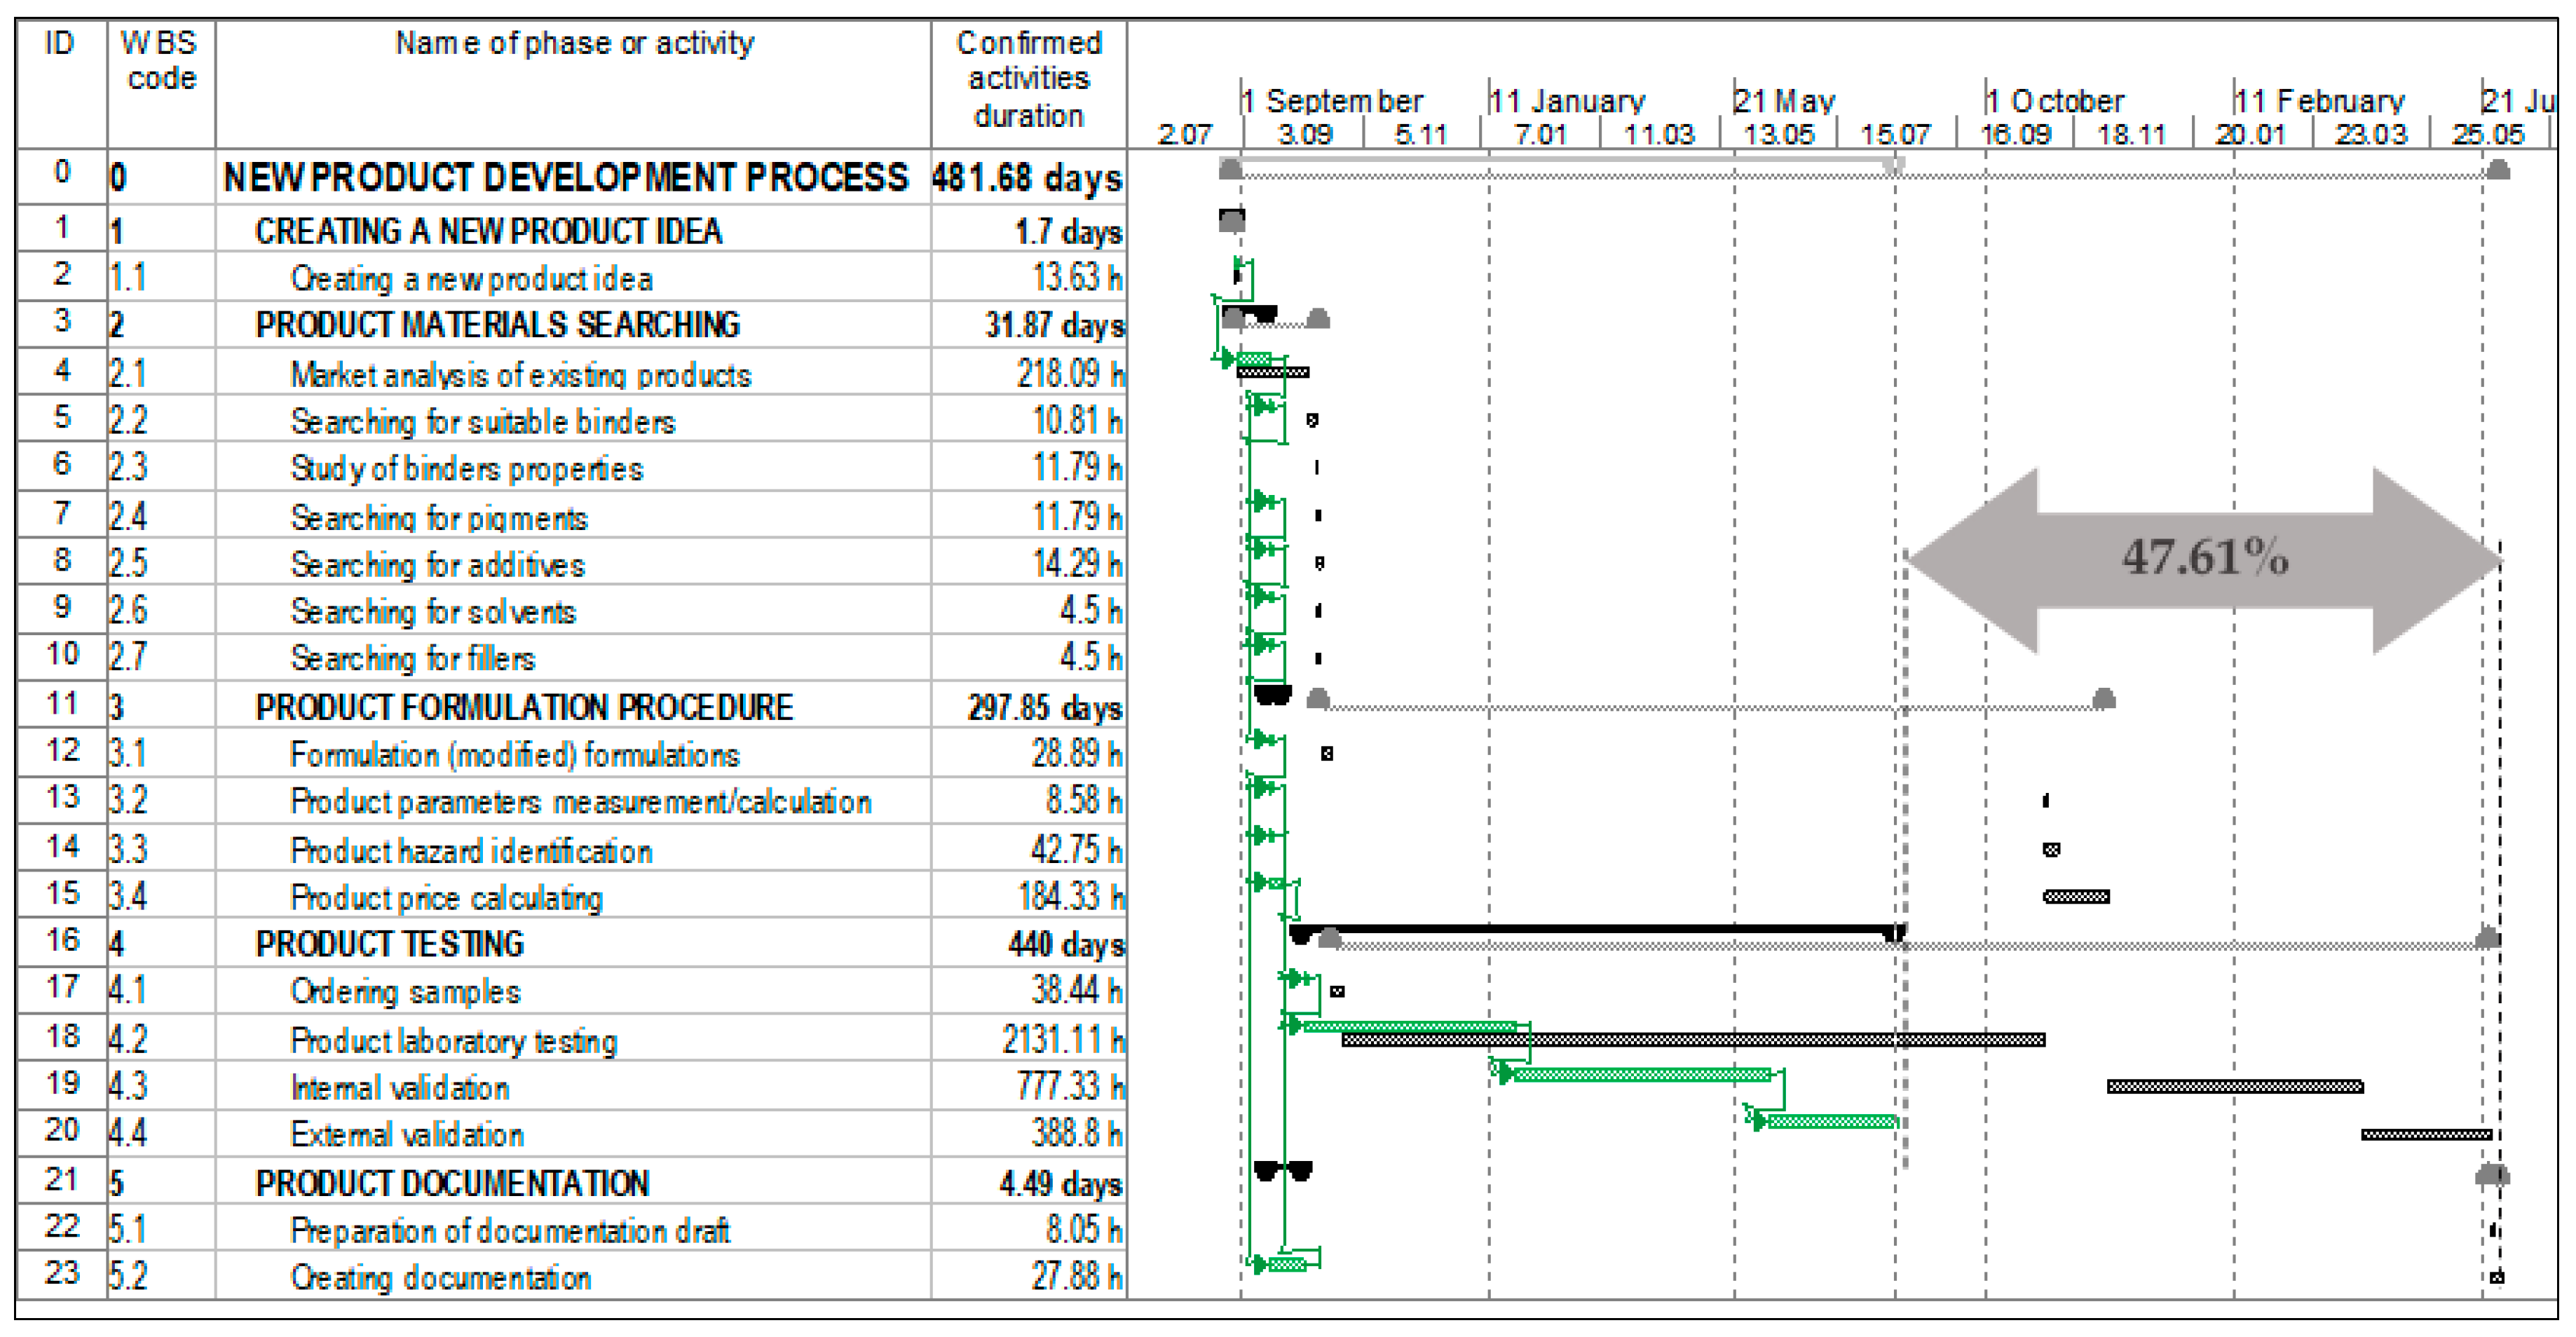
- the entire development process throughput time was reduced by 47.61% (1835 out of 3853 h) as is shown in Figure 7,
- the activity throughput time on which the cloud-based ICT has impact was reduced by 69.88% (1726 out of 2469 h),
- surprisingly, even the activity throughput time on which the cloud-based ICT has no impact, due to relevant information from the previous activities, was reduced by 7.88% (109 out of 1384 h).
4. Discussion and Conclusions
Author Contributions
Funding
Acknowledgments
Conflicts of Interest
Appendix A


Appendix B


References
- Nurioglu, A.G.; Esteves, A.C.C. Non-toxic, non-biocide-release antifouling coatings based on molecular structure design for marine applications. J. Mater. Chem. B 2015, 3, 6547–6570. [Google Scholar] [CrossRef]
- Akafuah, N.K.; Poozesh, S.; Salaimeh, A.; Patrick, G.; Lawler, K.; Saito, K. Evolution of the automotive body coating process—A review. Coatings 2016, 6, 24. [Google Scholar] [CrossRef]
- Staring, E.; Dias, A.A.; Van Benthem, R.A. New challenges for R&D in coating resins. Prog. Org. Coat. 2002, 45, 101–117. [Google Scholar] [CrossRef]
- Cole, I.S.; Hughes, A.E. Designing molecular protection: New paradigm for developing corrosion resistant materials uniting hightroughput studies, multiscale modelling and self-repair. Corros. Eng. Sci. Technol. 2014, 49, 109–115. [Google Scholar] [CrossRef]
- Bohorquez, S.J.; van den Berg, P.; Akkerman, J.; Mestach, D.; van Loon, S.; Repp, J. High-throughput paint optimisation by use of a pigment-dispersing polymer. Surf. Coat. Int. 2015, 98, 85–89. [Google Scholar]
- Björklund, S.; Goel, S.; Joshi, S. Function-dependent coating architectures by hybrid powder suspension plasma spaying: Injectordesign, processing and concept validation. Mater. Des. 2018, 142, 56–65. [Google Scholar] [CrossRef]
- Coatingstech, Coatings Xperience: Accelerating Coatings Development with High Troughput Technology. Available online: https://www.paint.org/article/accelerating-coatings-development-high-throughput-technology/ (accessed on 29 October 2018).
- Langille, M.; Izmitli, A.; Lan, T.; Agrawall, A.; Liu, C.; Henderson, K.; Lu, Y.J. Balancing performance of slip/mar additives using a high throughput approach. Coatingstech 2018, 14, 52–56. [Google Scholar]
- Nameer, S.; Johansson, M. Fully bio-based aliphatic thermoset polyesters via self-catalyzed self-condensation of multifunctional epoxy monomers directly extracted from natural sources. J. Coat. Technol. Res. 2017, 14, 757–765. [Google Scholar] [CrossRef]
- Taylor, S.R.; Contu, F.; Calle, L.M.; Curran, J.P.; Li, W. Predicting the long-term field performance of coating systems on steel using a rapid electrochemical test: The damage tolerance test. Corros. J. Sci. Eng. 2012, 68. [Google Scholar] [CrossRef]
- Wu, L.; Baghdachi, J. Functional Polymer Coatings: Principles, Methods, and Applications, 1st ed.; John Wiley & Sons: Hoboken, NJ, USA, 2015. [Google Scholar]
- Qureshi, S.A.; Shafeeq, A.; Ijaz, A.; Butt, M.M. Development and regression modeling dirt resistive latex façade paint. Coatings 2019, 9, 150. [Google Scholar] [CrossRef]
- Javierre, E. Modeling self-healing mechanisms in coatings: Approaches and perspectives. Coatings 2019, 9, 122. [Google Scholar] [CrossRef]
- Dennis, R.V.; Patil, V.; Andrews, J.L.; Aldinger, J.P.; Yaday, G.D.; Banarjee, S. Hybrid nanostructured coatings for corrosion protection of base materials: A sustainability perspective. Mater. Res. Express 2015, 2. [Google Scholar] [CrossRef]
- Prat, D.; Wells, A.; Hayler, J.; Sneddon, H.; McElroy, R.; Abou-Shehada, S.; Dunn, P.J. CHEM21 selection guide of classical- and less-classical-solvents. Green Chem. 2016, 18. [Google Scholar] [CrossRef]
- DKE Deutsche Kommission Elektrotechnik Elektronik Informationstechnik in DIN und VDE, German Standardization Roadmap, Industrie 4.0. Available online: https://www.din.de/blob/65354/57218767bd6da1927b181b9f2a0d5b39/roadmap-i4-0-e-data.pdf (accessed on 30 November 2018).
- Gartner, the 2019 CIO Agenda: Securing a New Foundation for Digital Business. Available online: https://www.gartner.com/doc/3891665/cio-agenda-securing-new-foundation (accessed on 30 November 2018).
- Challener, C. The paint and coatings industry in the age of digitalization. Jct Coat. 2018, 15, 54–60. [Google Scholar]
- Aguilar-Savén, R.S. Business process modelling: Review and framework. Int. J. Prod. Econ. 2004, 90, 129–149. [Google Scholar] [CrossRef]
- Weske, M. Business Process Management: Concepts, Languages, Architectures, 1st ed.; Springer: Berlin, Germany, 2007. [Google Scholar]
- Cheng, C. Complexity and Usability Models for Business Process Analysis. Doctoral Dissertation, The Graduate School College of Engineering, Pennsylvania State University, PA, USA, 21 August 2008. [Google Scholar]
- Urh, B.; Kern, T.; Roblek, M. Business Process Modification Management, In Encyclopedia of Networked and Virtual Organizations, 1st ed.; Putnik, G., Cunha, M.M., Eds.; Information Science Reference: Hershey, CA, USA; New York, NY, USA, 2008; pp. 112–120. [Google Scholar]
- Davis, R. ARIS Design Platform: Advanced Process Modelling and Administration, 1st ed.; Springer: Berlin, Germany, 2008. [Google Scholar]
- Ljubič, T. Operational Management of Production, 1st ed.; Modern organization: Kranj, Slovenia, 2006. [Google Scholar]
- Cottrell, W.D. Simplified Program Evaluation and Review Technique (PERT). J. Constr. Eng. Manag. 1999, 125, 16–22. [Google Scholar] [CrossRef]
- Scheer, A.W. ARIS—Business Process Framework, 2nd ed.; Springer: Berlin, Germany, 1998. [Google Scholar]
- Pavlović, I.; Kern, T.; Miklavčič, D. Comparison of paper-based and electronic data collection process in clinical trials: Costs simulation study. Contemp. Clin. Trials 2009, 30, 300–316. [Google Scholar] [CrossRef]
- Sánchez González, L.; García Rubio, F.; Ruiz González, F.; Piattini Velthuis, M. Measurement in business processes: A systematic review. Bus. Process Manag. J. 2010, 16, 114–134. [Google Scholar] [CrossRef]
- Frederiksen, H.; Mathiassen, L. A Contextual Approach to Improving Software Metrics Practices. IEEE Trans. Eng. Manag. 2008, 55, 602–616. [Google Scholar] [CrossRef]
- Sharma, A. Implementing Balance Scorecard for Performance Measurement. ICFAI J. Bus. Strategy 2009, 6, 7–16. [Google Scholar]
- Valiris, G.; Glykas, M. Business analysis metrics for business process redesign. Bus. Process Manag. J. 2004, 10, 445–480. [Google Scholar] [CrossRef]
- van der Aalst, W.M.P. Business process management: A comprehensive survey. ISRN Softw. Eng. 2013, 2013. [Google Scholar] [CrossRef]
- Rolón, E.; Ruiz, F.; Garcia, F.; Piatiini, M. Applying Software Metrics to evaluate Business Process Models. CLEI Electron. J. 2006, 9, 1–15. [Google Scholar] [CrossRef]
- Mendling, J.; Moser, M.; Neumann, G.; Verbeek, H.M.W.; Van Dongen, B.F.; van der Aalst, W.M.P. A Quantitative Analysis of Faulty EPCs in the SAP Reference Model. BPM Rep. 2006, 0608, 1–49. [Google Scholar]
- Cardoso, J.; Mendling, J.; Neumann, G.; Reijers, H.A. A discourse on complexity of process models. In Business Process Management Workshop, 1st ed.; Eder, J., Dustdar, S., Eds.; Springer: Berlin, Germany, 2006; pp. 117–128. [Google Scholar]
- Cardoso, J. Business Process Control-Flow Complexity: Metric, Evaluation and Validation. Int. J. Web Serv. Res. 2008, 5, 49–76. [Google Scholar] [CrossRef]
- Determine Your Process Costs and Times (Klein, E.). Available online: https://www.ariscommunity.com/users/eva-klein/2011-01-17-determine-your-process-costs-and-times (accessed on 4 December 2018).
- Banks, J.; Carson, J.S.; Nelson, B.L.; Nicol, D.M. Discrete-Event System Simulation, 5th ed.; Pearson Prentice Hall: Upper Saddle River, NJ, USA, 2010. [Google Scholar]
- Greasley, A. The case for the organisational use of simulation. J. Manuf. Technol. Manag. 2004, 15, 560–566. [Google Scholar] [CrossRef]
- Lanner Group Ltd, What Is Predictive Simulation? Available online: https://www.lanner.com/en-gb/pages/what-is-predictive-simulation.html (accessed on 25 October 2018).
- Allchemist. Available online: https://allchemist2018.av-studio.agency/ (accessed on 16 January 2019).
- ECHA, European Chemicals Agency. Available online: https://echa.europa.eu/regulations/reach/legislation (accessed on 25 January 2019).
- Eurostat, Industry by Employment Size Class—Economical Indicator for Structural Business Statistics—Enterprises Number. Available online: https://ec.europa.eu/eurostat/data/database (accessed on 25 January 2019).


| New Product Development Process without ICT Support (The Classic Process) | New Product Development Process with ICT Support and Using a Local Database | ||||
|---|---|---|---|---|---|
| ## | Process Activity | ICT | ## | Process Activity | ICT |
| 10 | Creating a new product idea | 10 | Creating a new product idea | ||
| 20 | Market analysis of existing products | 20 | Market analysis of existing products | ||
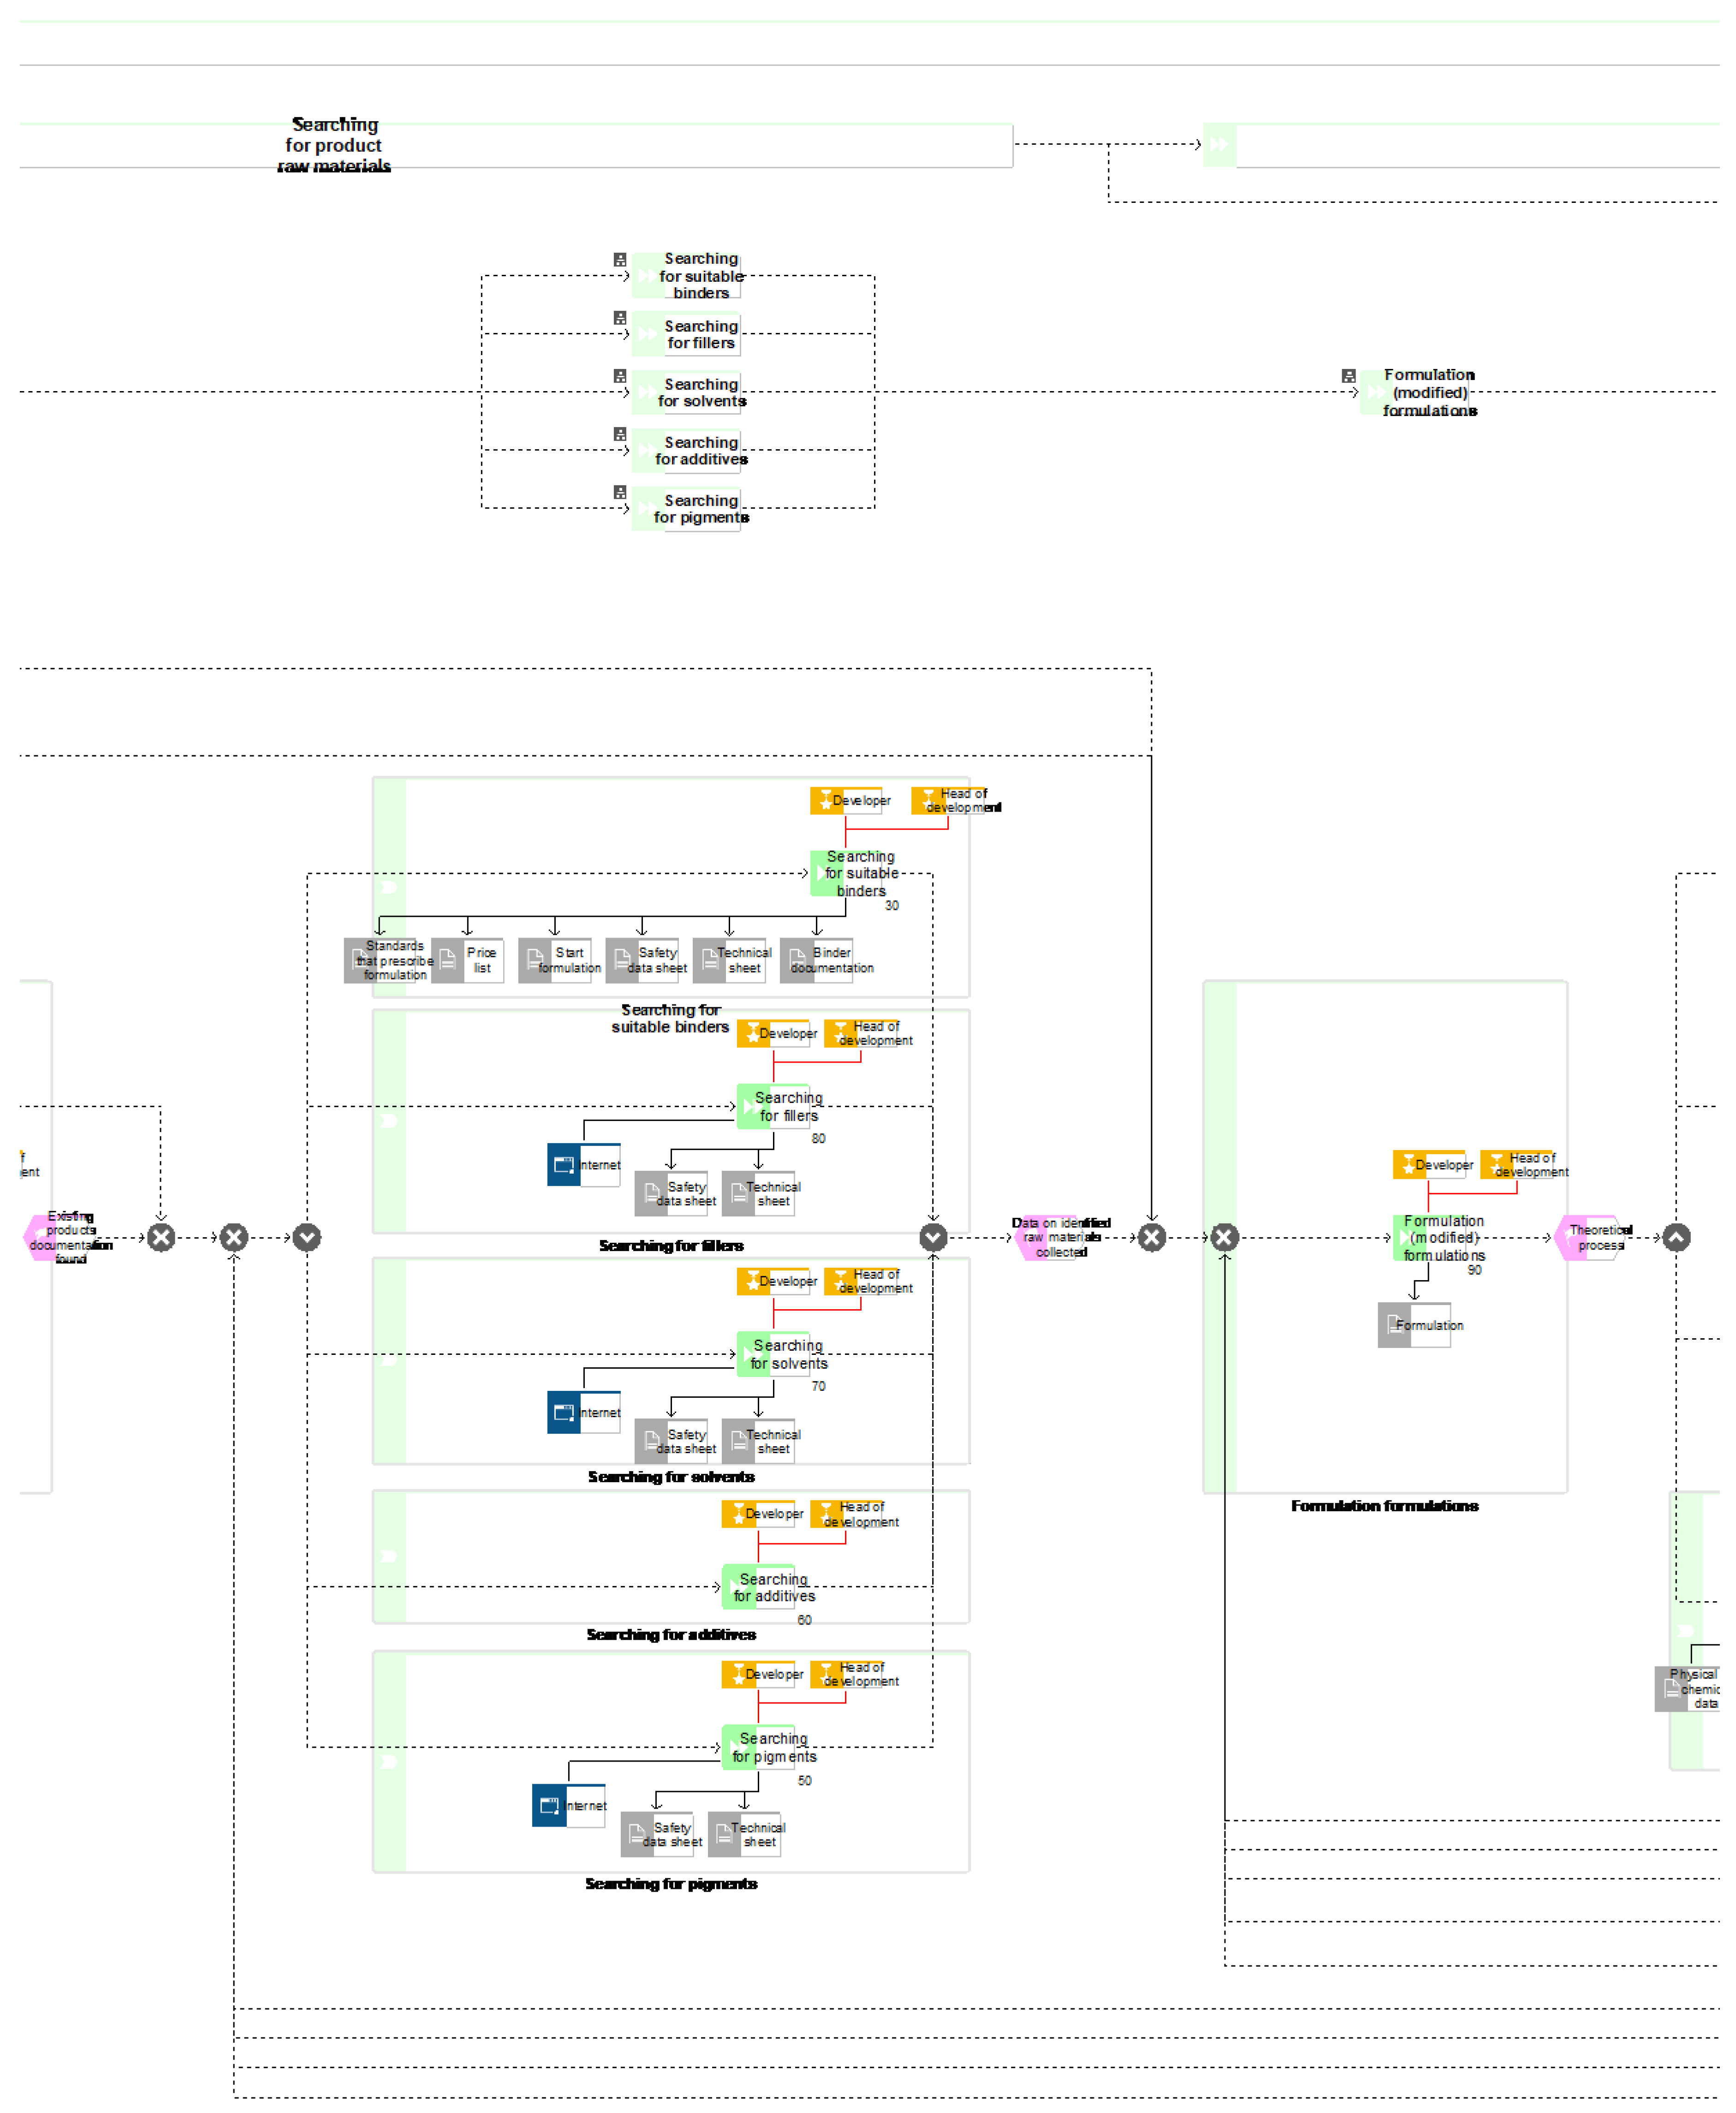
| 30 | Searching for suitable binders | 30 | Searching for suitable binders | ✓ | |
| 40 | Study of binders’ properties | 40 | Study of binders’ properties | ✓ | |
| 50 | Searching for pigments | 50 | Searching for pigments | ✓ | |
| 60 | Searching for additives | 60 | Searching for additives | ✓ | |
| 70 | Searching for solvents | 70 | Searching for solvents | ✓ | |
| 80 | Searching for fillers | 80 | Searching for fillers | ✓ | |
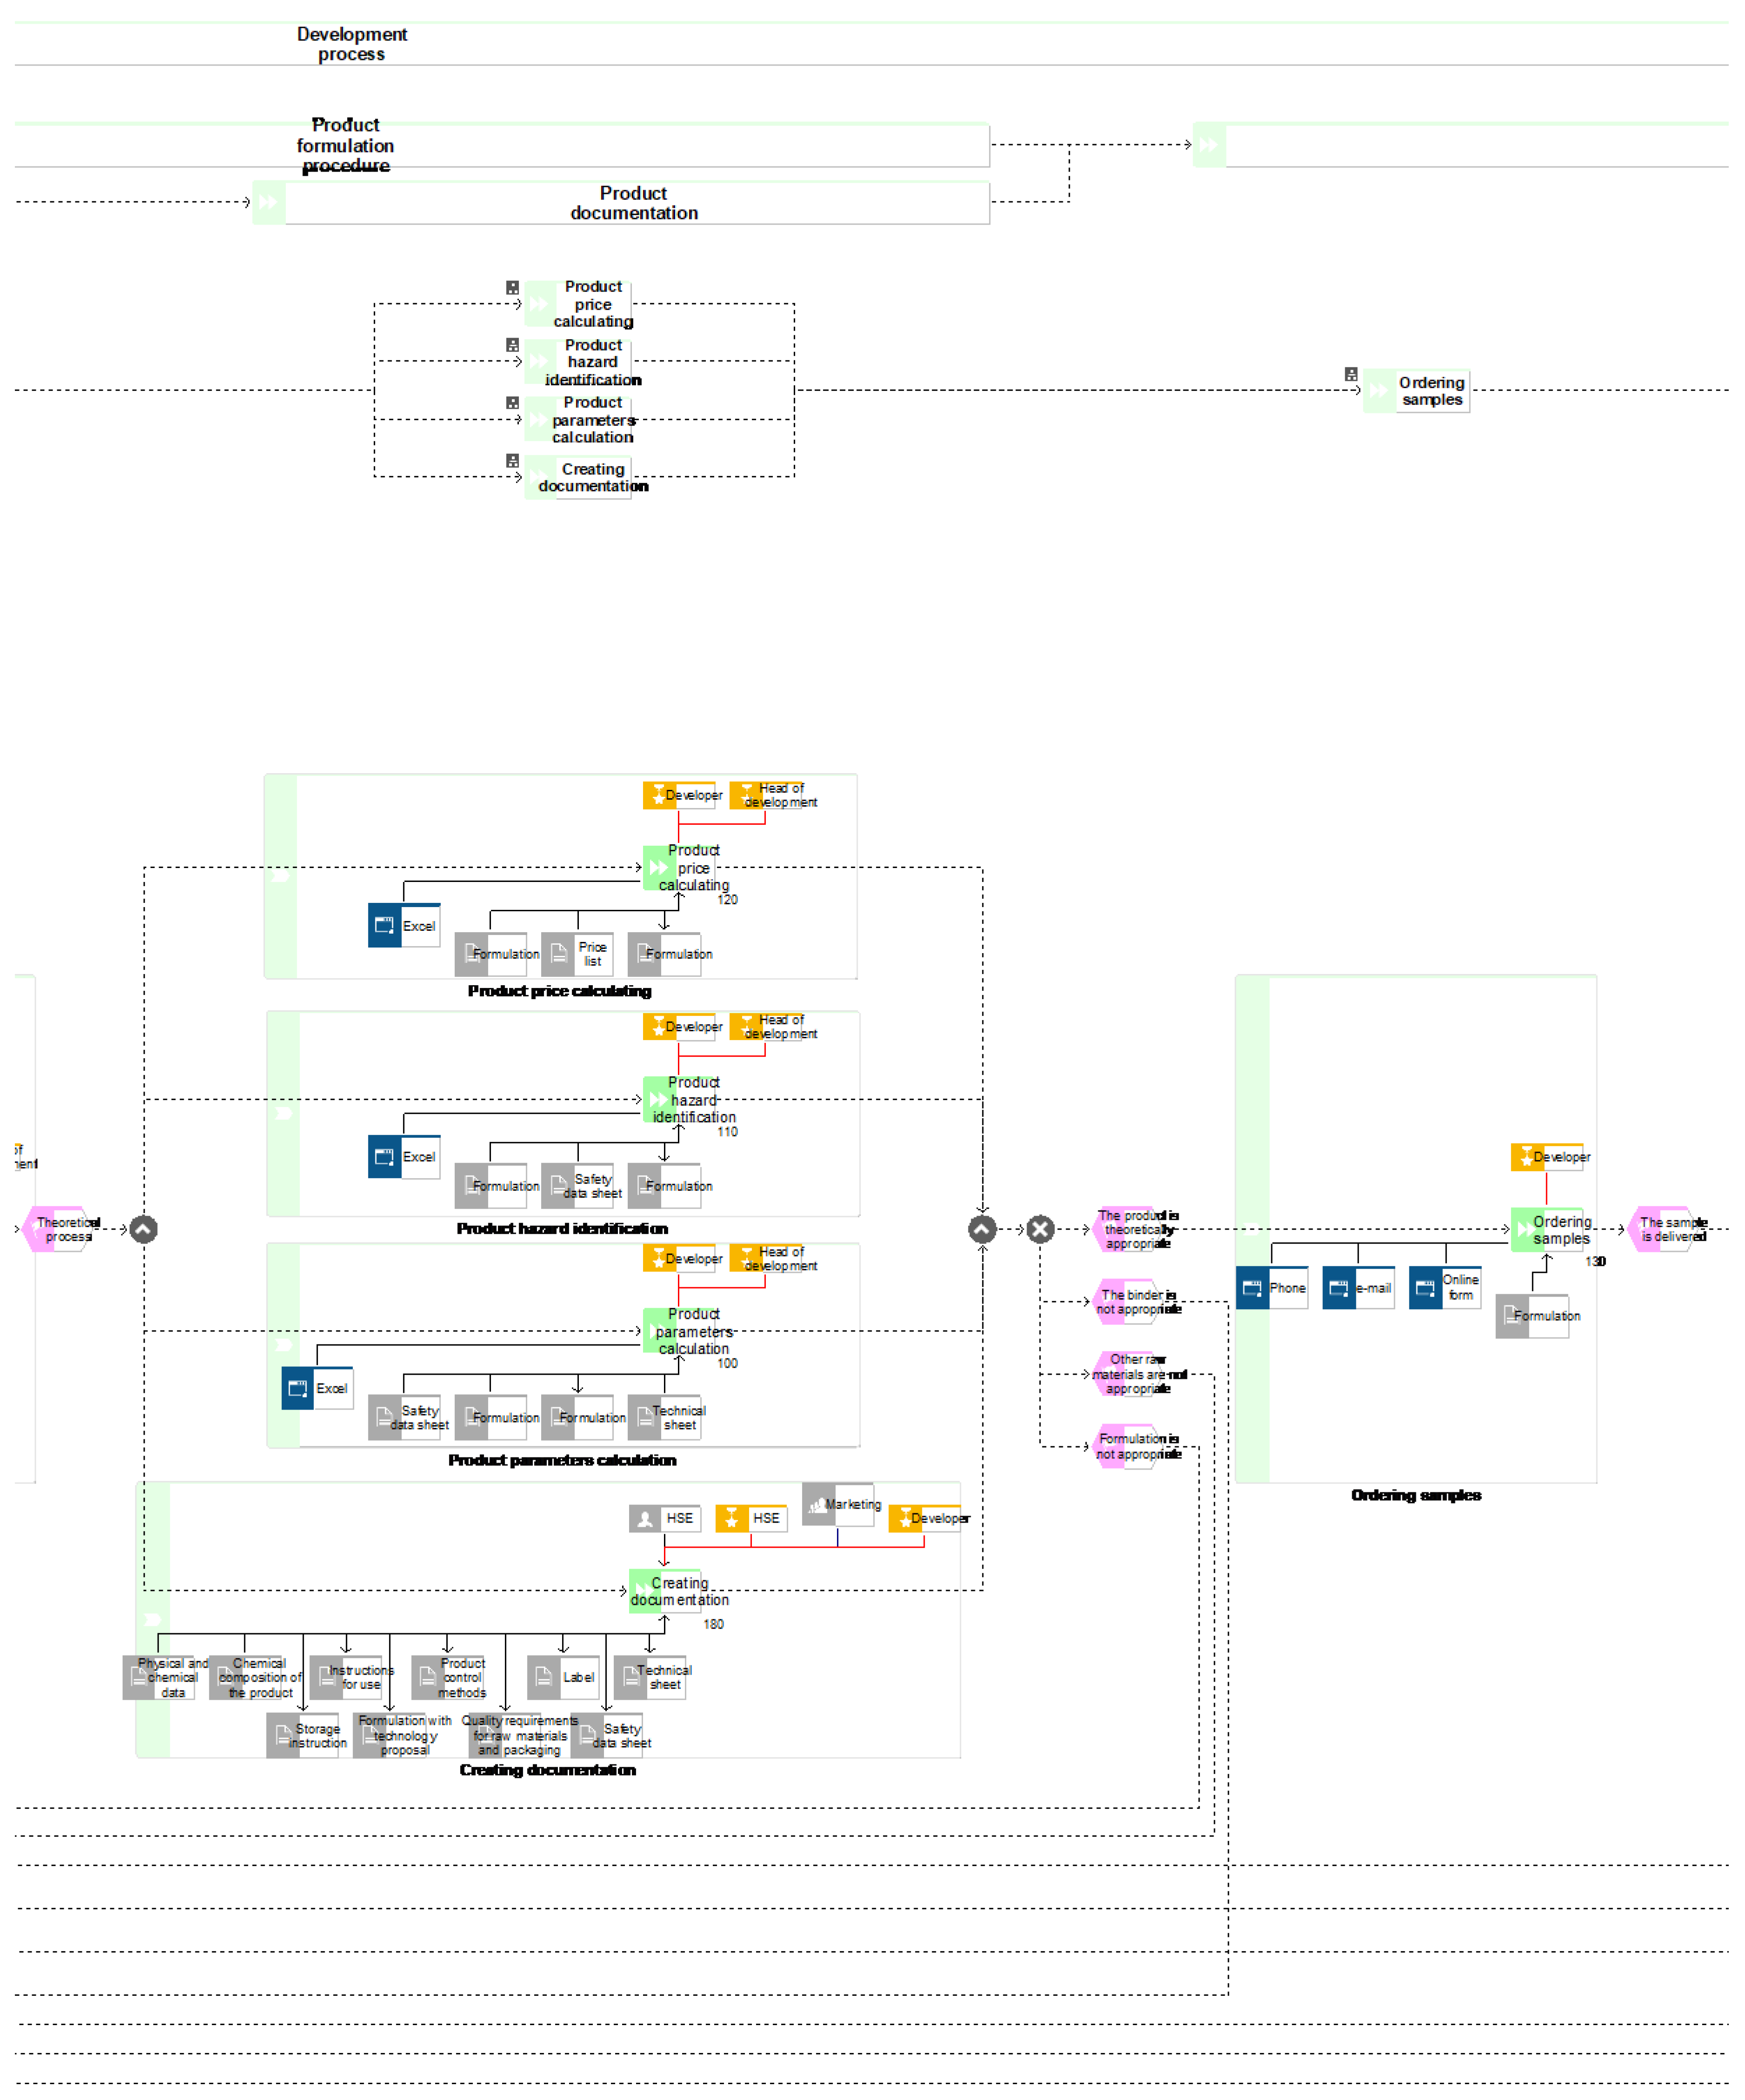
| 90 | Formulation (modified) formulations | 90 | Formulation (modified) formulations | ✓ | |
| 100 | Ordering samples | 100 | Ordering samples | ||
| 110 | Product laboratory testing | 110 | Product laboratory testing | ||
| 120 | Product parameters measurement | 120 | Product parameters measurement | ||
| 130 | Product hazard identification | 130 | Product hazard identification | ||
| 140 | Product price calculating | 140 | Product price calculating | ||
| 150 | Internal validation | 150 | Internal validation | ||
| 160 | External validation | 160 | External validation | ||
| 170 | Preparation of documentation draft | 170 | Preparation of documentation draft | ✓ | |
| 180 | Creating documentation | 180 | Creating documentation | ||
| ## | Process Activity | Time Estimates (in Hours, h) | Optimistic | Most Probable | Pessimistic | Expected | Activity Throughput | Probability 1 |
|---|---|---|---|---|---|---|---|---|
| 10 | Creating a new product idea | Waiting | 15.00 | 18.00 | 52.00 | 23.17 | 95.17 | 0.06 |
| Orientation | 3.00 | 8.00 | 45.00 | 13.33 | ||||
| Processing | 4400 | 55.00 | 88.00 | 58.67 | ||||
| 20 | Market analysis of existing products | Waiting | 15.00 | 18.00 | 52.00 | 23.17 | 95.17 | 1.00 |
| Orientation | 3.00 | 8.00 | 45.00 | 13.33 | ||||
| Processing | 44.00 | 55.00 | 88.00 | 58.67 | ||||
| 30 | Searching for suitable binders | Waiting | 0.20 | 0.40 | 1.00 | 0.47 | 4.72 | 0.92 |
| Orientation | 0.10 | 0.20 | 0.60 | 0.25 | ||||
| Processing | 2.00 | 4.00 | 6.00 | 4.00 | ||||
| 40 | Study of binder properties | Waiting | 0.20 | 0.40 | 1.00 | 0.47 | 4.72 | 1.00 |
| Orientation | 0.10 | 0.20 | 0.60 | 0.25 | ||||
| Processing | 2.00 | 4.00 | 6.00 | 4.00 | ||||
| 50 | Searching for pigments | Waiting | 0.20 | 0.40 | 1.00 | 0.47 | 4.72 | 0.19 |
| Orientation | 0.10 | 0.20 | 0.60 | 0.25 | ||||
| Processing | 2.00 | 4.00 | 6.00 | 4.00 | ||||
| 60 | Searching for additives | Waiting | 0.20 | 0.40 | 1.00 | 0.47 | 5.72 | |
| Orientation | 0.10 | 0.20 | 0.60 | 0.25 | ||||
| Processing | 3.00 | 5.00 | 7.00 | 5.00 | ||||
| 70 | Searching for solvents | Waiting | 0.20 | 0.40 | 1.00 | 0.47 | 1.80 | |
| Orientation | 0.10 | 0.20 | 0.60 | 0.25 | ||||
| Processing | 0.50 | 1.00 | 2.00 | 1.08 | ||||
| 80 | Searching for fillers | Waiting | 0.20 | 0.40 | 1.00 | 0.47 | 1.80 | |
| Orientation | 0.10 | 0.20 | 0.60 | 0.25 | ||||
| Processing | 0.50 | 1.00 | 2.00 | 1.08 | ||||
| 90 | Formulation (modified) formulations | Waiting | 0.00 | 0.00 | 0.00 | 0.00 | 2.17 | 1.00 |
| Orientation | 0.00 | 0.00 | 0.00 | 0.00 | ||||
| Processing | 1.00 | 2.00 | 4.00 | 2.17 | ||||
| 100 | Ordering samples | Waiting | 0.20 | 0.40 | 1.00 | 0.47 | 2.88 | 1.00 |
| Orientation | 0.10 | 0.20 | 0.60 | 0.25 | ||||
| Processing | 1.00 | 2.00 | 4.00 | 2.17 | ||||
| 110 | Product laboratory testing | Waiting | 25.00 | 50.00 | 172.00 | 66.17 | 159.83 | 0.50 |
| Orientation | 4.00 | 8.00 | 16.00 | 8.67 | ||||
| Processing | 40.00 | 80.00 | 150.00 | 85.00 | ||||
| 120 | Product parameters measurement | Waiting | 0.20 | 0.40 | 1.00 | 0.47 | 1.28 | 0.40 |
| Orientation | 0.10 | 0.20 | 0.60 | 0.25 | ||||
| Processing | 0.40 | 0.50 | 1.00 | 0.57 | ||||
| 130 | Product hazard identification | Waiting | 0.20 | 0.40 | 1.00 | 0.47 | 6.38 | |
| Orientation | 0.10 | 0.20 | 0.60 | 0.25 | ||||
| Processing | 2.00 | 5.00 | 12.00 | 5.67 | ||||
| 140 | Product price calculating | Waiting | 6.10 | 24.20 | 48.50 | 25.23 | 27.65 | |
| Orientation | 0.10 | 0.20 | 0.60 | 0.25 | ||||
| Processing | 1.00 | 2.00 | 4.00 | 2.17 | ||||
| 150 | Internal validation | Waiting | 25.00 | 50.00 | 172.00 | 66.17 | 291.50 | 0.50 |
| Orientation | 4.00 | 8.00 | 16.00 | 8.67 | ||||
| Processing | 100.00 | 200.00 | 400.00 | 216.67 | ||||
| 160 | External validation | Waiting | 72.00 | 232.00 | 644.00 | 274.00 | 291.60 | 0.75 |
| Orientation | 0.60 | 1.50 | 3.00 | 1.60 | ||||
| Processing | 8.00 | 16.00 | 24.00 | 16.00 | ||||
| 170 | Preparation of documentation draft | Waiting | 1.10 | 2.50 | 5.00 | 2.68 | 8.05 | 1.00 |
| Orientation | 0.20 | 1.00 | 2.00 | 1.03 | ||||
| Processing | 2.00 | 4.00 | 8.00 | 4.33 | ||||
| 180 | Creating documentation | Waiting | 4.10 | 8.50 | 17.00 | 9.18 | 27.88 | 1.00 |
| Orientation | 0.20 | 1.00 | 2.00 | 1.03 | ||||
| Processing | 10.00 | 16.00 | 32.00 | 17.67 |
| New Product Development Process with ICT Support and the Use of a Cloud-Based Database | ||
|---|---|---|
| ## | Process Activity | ICT |
| 10 | Creating a new product idea | ✓ |
| 20 | Market analysis of existing products | |
| 30 | Searching for suitable binders | ✓ |
| 40 | Searching for pigments | ✓ |
| 50 | Searching for additives | ✓ |
| 60 | Searching for solvents | ✓ |
| 70 | Searching for fillers | ✓ |
| 80 | Formulation (modified) formulations | ✓ |
| 90 | Product parameters calculation | ✓ |
| 100 | Product hazard identification | ✓ |
| 110 | Product price calculating | ✓ |
| 120 | Creating documentation | ✓ |
| 130 | Ordering samples | ✓ |
| 140 | Product laboratory testing | |
| 150 | Internal validation | |
| 160 | External validation | |
| ## | Process Activity | Time Estimates (in Hours, h) | Optimistic | Most Probable | Pessimistic | Expected | Activity Throughput | Probability 1 |
|---|---|---|---|---|---|---|---|---|
| 10 | Creating a new product idea | Waiting | 13.50 | 16.20 | 46.80 | 20.85 | 85.65 | 0.06 |
| Orientation | 2.70 | 7.20 | 40.50 | 12.00 | ||||
| Processing | 39.60 | 49.50 | 79.20 | 52.80 | ||||
| 20 | Market analysis of existing products | Waiting | 15.00 | 18.00 | 52.00 | 23.17 | 95.17 | 0.92 |
| Orientation | 3.00 | 8.00 | 45.00 | 13.33 | ||||
| Processing | 44.00 | 55.00 | 88.00 | 58.67 | ||||
| 30 | Searching for suitable binders | Waiting | 0.02 | 0.04 | 0.10 | 0.05 | 0.47 | 0.19 |
| Orientation | 0.01 | 0.02 | 0.06 | 0.03 | ||||
| Processing | 0.20 | 0.40 | 0.60 | 0.40 | ||||
| 40 | Searching for pigments | Waiting | 0.02 | 0.04 | 0.10 | 0.05 | 0.47 | |
| Orientation | 0.01 | 0.02 | 0.06 | 0.03 | ||||
| Processing | 0.20 | 0.40 | 0.60 | 0.40 | ||||
| 50 | Searching for additives | Waiting | 0.02 | 0.04 | 0.10 | 0.05 | 0.57 | |
| Orientation | 0.01 | 0.02 | 0.06 | 0.03 | ||||
| Processing | 0.30 | 0.50 | 0.70 | 0.50 | ||||
| 60 | Searching for solvents | Waiting | 0.02 | 0.04 | 0.10 | 0.05 | 0.18 | |
| Orientation | 0.01 | 0.02 | 0.06 | 0.03 | ||||
| Processing | 0.05 | 0.10 | 0.20 | 0.11 | ||||
| 70 | Searching for fillers | Waiting | 0.02 | 0.04 | 0.10 | 0.05 | 0.18 | |
| Orientation | 0.01 | 0.02 | 0.06 | 0.03 | ||||
| Processing | 0.05 | 0.10 | 0.20 | 0.11 | ||||
| 80 | Formulation (modified) formulations | Waiting | 0.00 | 0.00 | 0.00 | 0.00 | 0.22 | 1.00 |
| Orientation | 0.00 | 0.00 | 0.00 | 0.00 | ||||
| Processing | 0.10 | 0.20 | 0.40 | 0.22 | ||||
| 90 | Product parameters calculation | Waiting | 0.00 | 0.00 | 0.00 | 0.00 | 0.00 2 | 0.80 |
| Orientation | 0.00 | 0.00 | 0.00 | 0.00 | ||||
| Processing | 0.00 | 0.00 | 0.00 | 0.00 | ||||
| 100 | Product hazard identification | Waiting | 0.00 | 0.00 | 0.00 | 0.00 | 0.00 2 | |
| Orientation | 0.00 | 0.00 | 0.00 | 0.00 | ||||
| Processing | 0.00 | 0.00 | 0.00 | 0.00 | ||||
| 110 | Product price calculating | Waiting | 1.22 | 4.84 | 9.70 | 5.05 | 5.53 | |
| Orientation | 0.02 | 0.04 | 0.12 | 0.05 | ||||
| Processing | 0.20 | 0.40 | 0.80 | 0.43 | ||||
| 120 | Creating documentation | Waiting | 2.05 | 4.25 | 8.50 | 4.59 | 13.94 | |
| Orientation | 0.10 | 0.50 | 1.00 | 0.52 | ||||
| Processing | 5.00 | 8.00 | 16.00 | 8.83 | ||||
| 130 | Ordering samples | Waiting | 0.04 | 0.08 | 0.20 | 0.09 | 0.58 | 1.00 |
| Orientation | 0.02 | 0.04 | 0.12 | 0.05 | ||||
| Processing | 0.20 | 0.40 | 0.80 | 0.43 | ||||
| 140 | Product laboratory testing | Waiting | 18.75 | 37.50 | 129.00 | 49.63 | 119.88 | 0.50 |
| Orientation | 3.00 | 6.00 | 12.00 | 6.50 | ||||
| Processing | 30.00 | 60.00 | 112.50 | 63.75 | ||||
| 150 | Internal validation | Waiting | 25.00 | 50.00 | 172.00 | 66.17 | 291.50 | 0.50 |
| Orientation | 4.00 | 8.00 | 16.00 | 8.67 | ||||
| Processing | 100.00 | 200.00 | 400.00 | 216.67 | ||||
| 160 | External validation | Waiting | 72.00 | 232.00 | 644.00 | 274.00 | 291.60 | 0.75 |
| Orientation | 0.60 | 1.50 | 3.00 | 1.60 | ||||
| Processing | 8.00 | 16.00 | 24.00 | 16.00 |
| New Product Development Process without ICT Support (The Classic Process) | |||||
|---|---|---|---|---|---|
| ## | Process Activity | Activity Throughput Time | Throughput Time for One Product | With ICT Impact on Execution Time | Without ICT Impact on Execution Time |
| 10 | Creating a new product idea | 95.17 | 13.63 | 13.63 | |
| 20 | Market analysis of existing products | 95.17 | 218.09 | 218.09 | |
| 30 | Searching for suitable binders | 4.72 | 10.81 | 10.81 | |
| 40 | Study of binder properties | 4.72 | 11.79 | 11.79 | |
| 50 | Searching for pigments | 5.72 | 14.29 | 14.29 | |
| 60 | Searching for additives | ||||
| 70 | Searching for solvents | ||||
| 80 | Searching for fillers | ||||
| 90 | Formulation (modified) formulations | 2.17 | 28.89 | 28.89 | |
| 100 | Ordering samples | 2.88 | 38.44 | 38.44 | |
| 110 | Product laboratory testing | 159.83 | 2131.11 | 2131.11 | |
| 120 | Product parameters measurement | 27.65 | 184.33 | 184.33 | |
| 130 | Product hazard identification | ||||
| 140 | Product price calculating | ||||
| 150 | Internal validation | 291.5 | 777.33 | 777.33 | |
| 160 | External validation | 291.6 | 388.8 | 388.8 | |
| 170 | Preparation of documentation draft | 8.05 | 8.05 | 8.05 | |
| 180 | Creating documentation | 27.88 | 27.88 | 27.88 | |
| TOTAL FOR ONE SUCCESSFUL PRODUCT: | 3853.46 | 2469.23 | 1384.22 | ||
| ## | Process Activity | Activity Throughput Time | Throughput Time for One Product | With ICT Impact on Execution Time | Without ICT Impact on Execution Time |
| 10 | Creating a new product idea | 85.65 | 6.13 | 6.13 | |
| 20 | Market analysis of existing products | 95.17 | 109.05 | 109.05 | |
| 30 | Searching for suitable binders | 0.57 | 0.71 | 0.71 | |
| 40 | Searching for pigments | ||||
| 50 | Searching for additives | ||||
| 60 | Searching for solvents | ||||
| 70 | Searching for fillers | ||||
| 80 | Formulation (modified) formulations | 0.22 | 1.44 | 1.44 | |
| 90 | Product parameters calculation | 13.94 | 92.94 | 92.94 | |
| 100 | Product hazard identification | ||||
| 110 | Product price calculating | ||||
| 120 | Creating documentation | ||||
| 130 | Ordering samples | 0.58 | 3.08 | 3.08 | |
| 140 | Product laboratory testing | 119.88 | 639.33 | 639.33 | |
| 150 | Internal validation | 291.5 | 777.33 | 777.33 | |
| 160 | External validation | 291.6 | 388.8 | 388.8 | |
| TOTAL FOR ONE SUCCESSFUL PRODUCT: | 2018.82 | 743.65 | 1275.18 | ||
| THROUGHPUT TIME REDUCTION (in %): | 47.61 | 69.88 | 7.88 | ||
© 2019 by the authors. Licensee MDPI, Basel, Switzerland. This article is an open access article distributed under the terms and conditions of the Creative Commons Attribution (CC BY) license (http://creativecommons.org/licenses/by/4.0/).
Share and Cite
Kern, T.; Krhač, E.; Senegačnik, M.; Urh, B. Digitalizing the Paints and Coatings Development Process. Processes 2019, 7, 539. https://doi.org/10.3390/pr7080539
Kern T, Krhač E, Senegačnik M, Urh B. Digitalizing the Paints and Coatings Development Process. Processes. 2019; 7(8):539. https://doi.org/10.3390/pr7080539
Chicago/Turabian StyleKern, Tomaž, Eva Krhač, Marjan Senegačnik, and Benjamin Urh. 2019. "Digitalizing the Paints and Coatings Development Process" Processes 7, no. 8: 539. https://doi.org/10.3390/pr7080539
APA StyleKern, T., Krhač, E., Senegačnik, M., & Urh, B. (2019). Digitalizing the Paints and Coatings Development Process. Processes, 7(8), 539. https://doi.org/10.3390/pr7080539