Accelerating Biomanufacturing by Modeling of Continuous Bioprocessing—Piloting Case Study of Monoclonal Antibody Manufacturing


 ,
, 

Abstract
1. Introduction
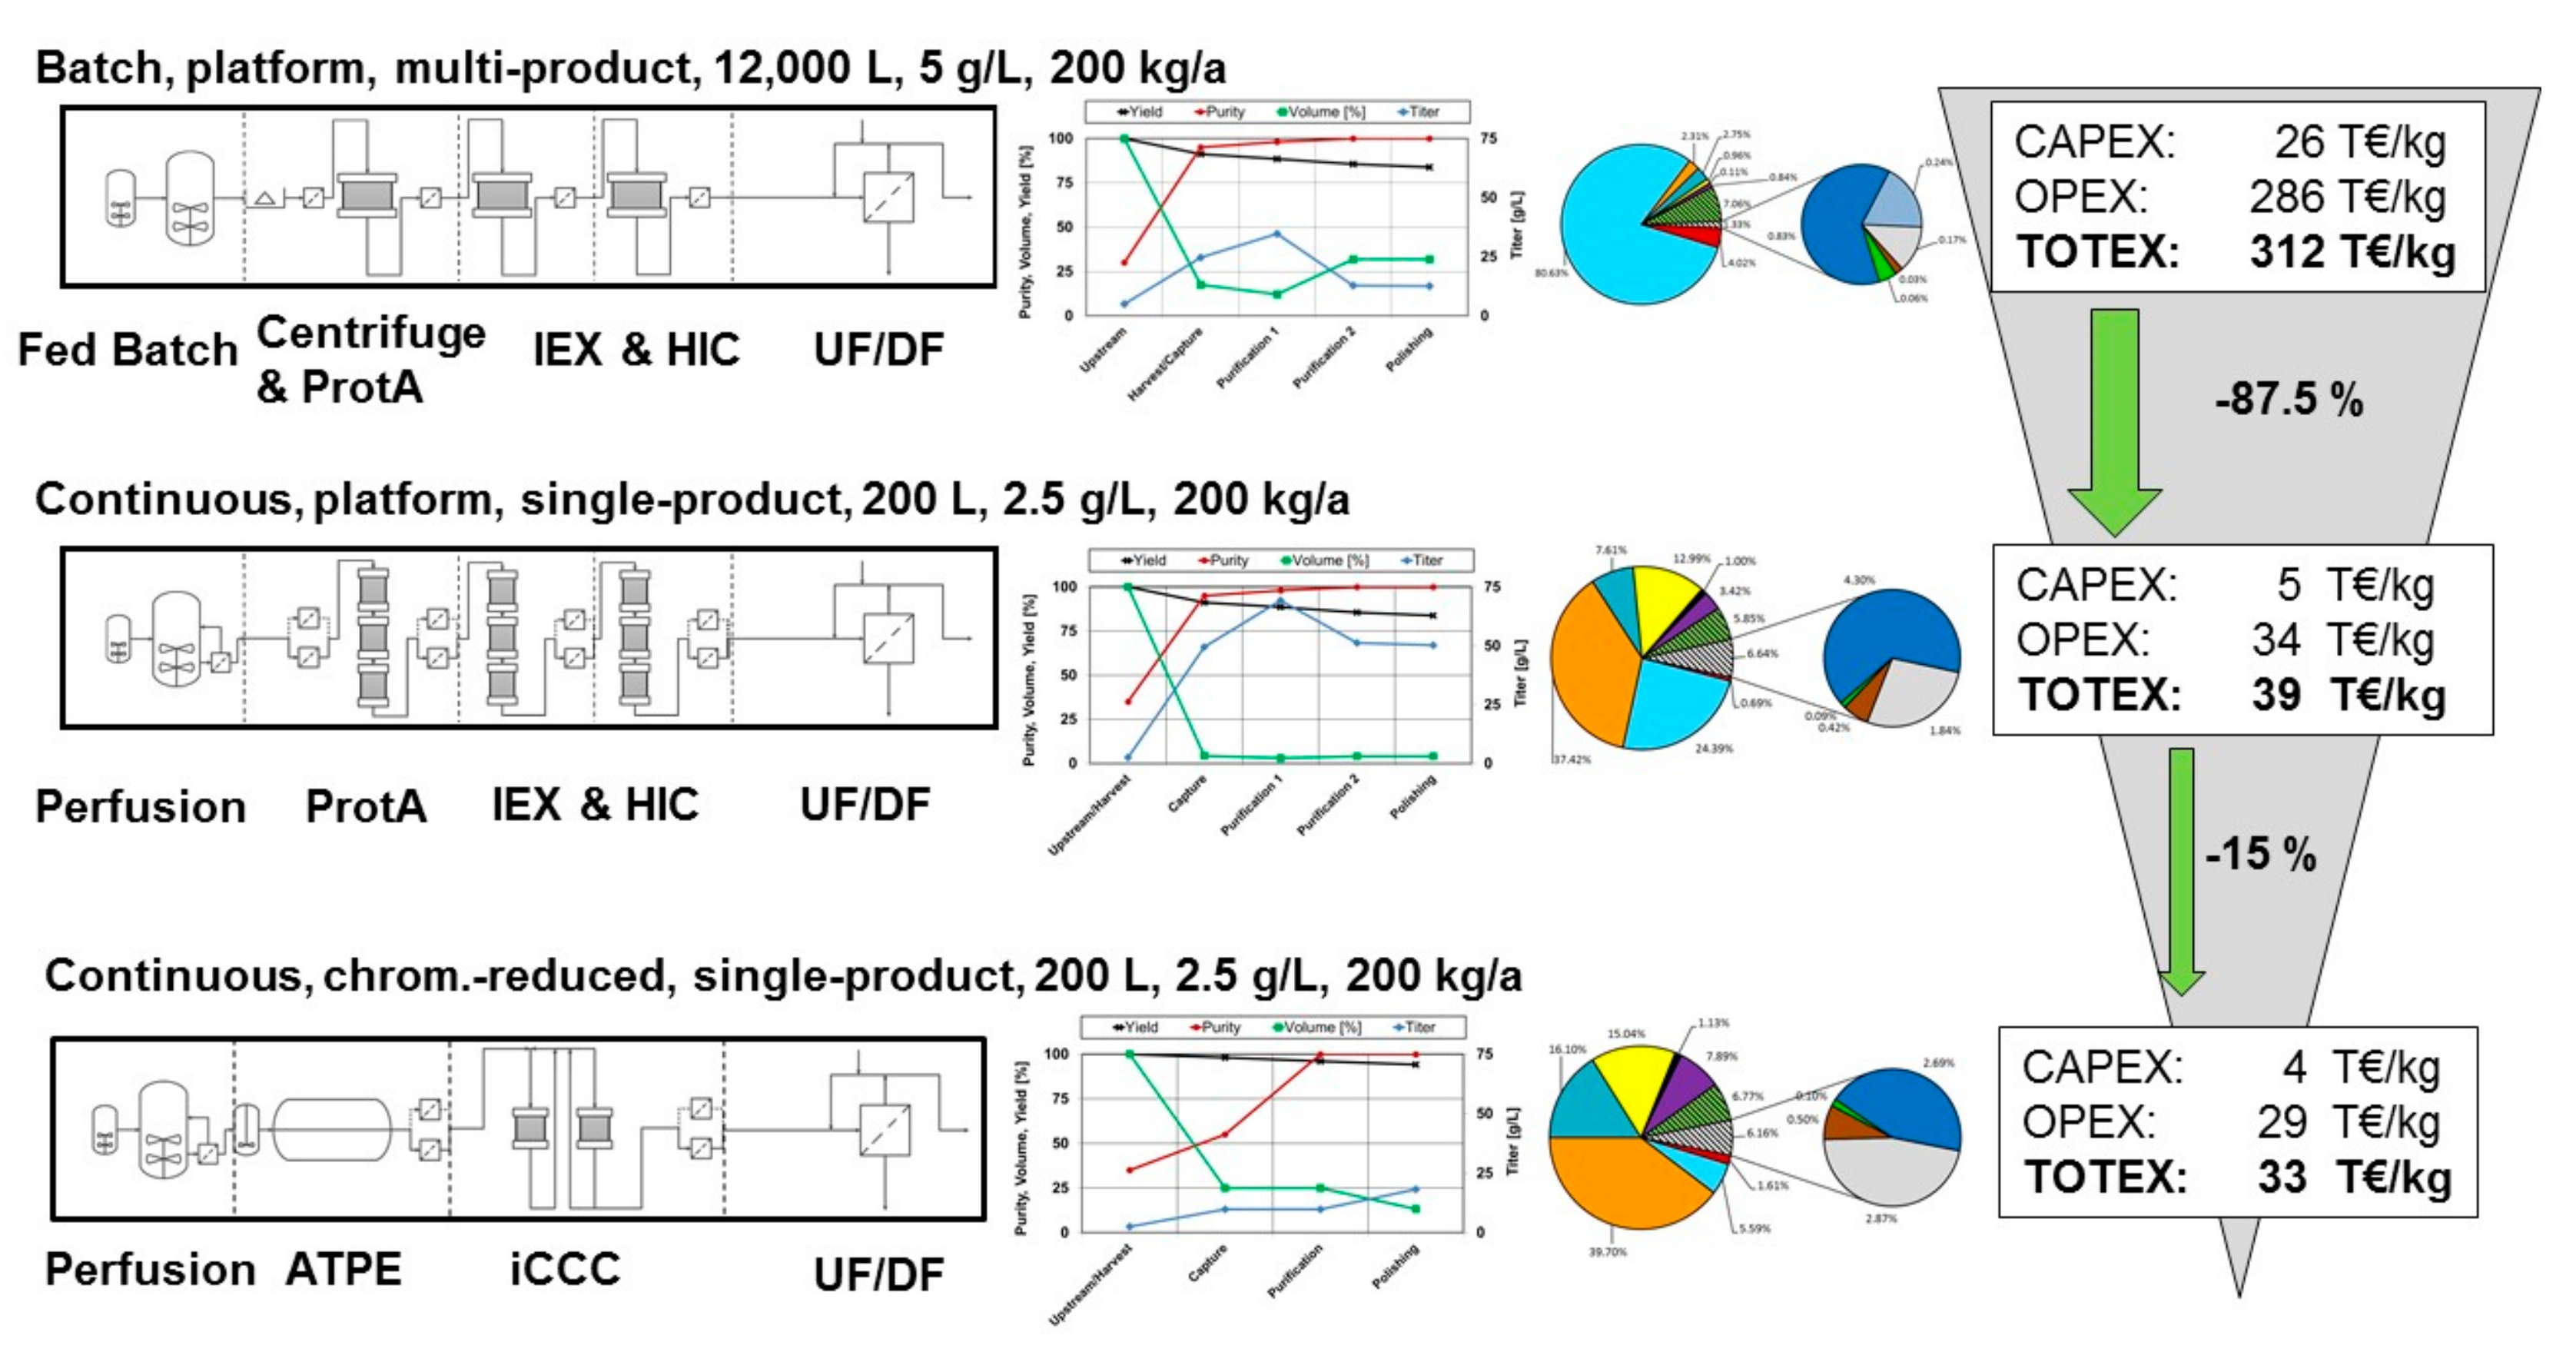
1.1. Critical View on Current Practice
1.2. Process Development of an Alternative Continuous AAC Process
2. Materials and Methods
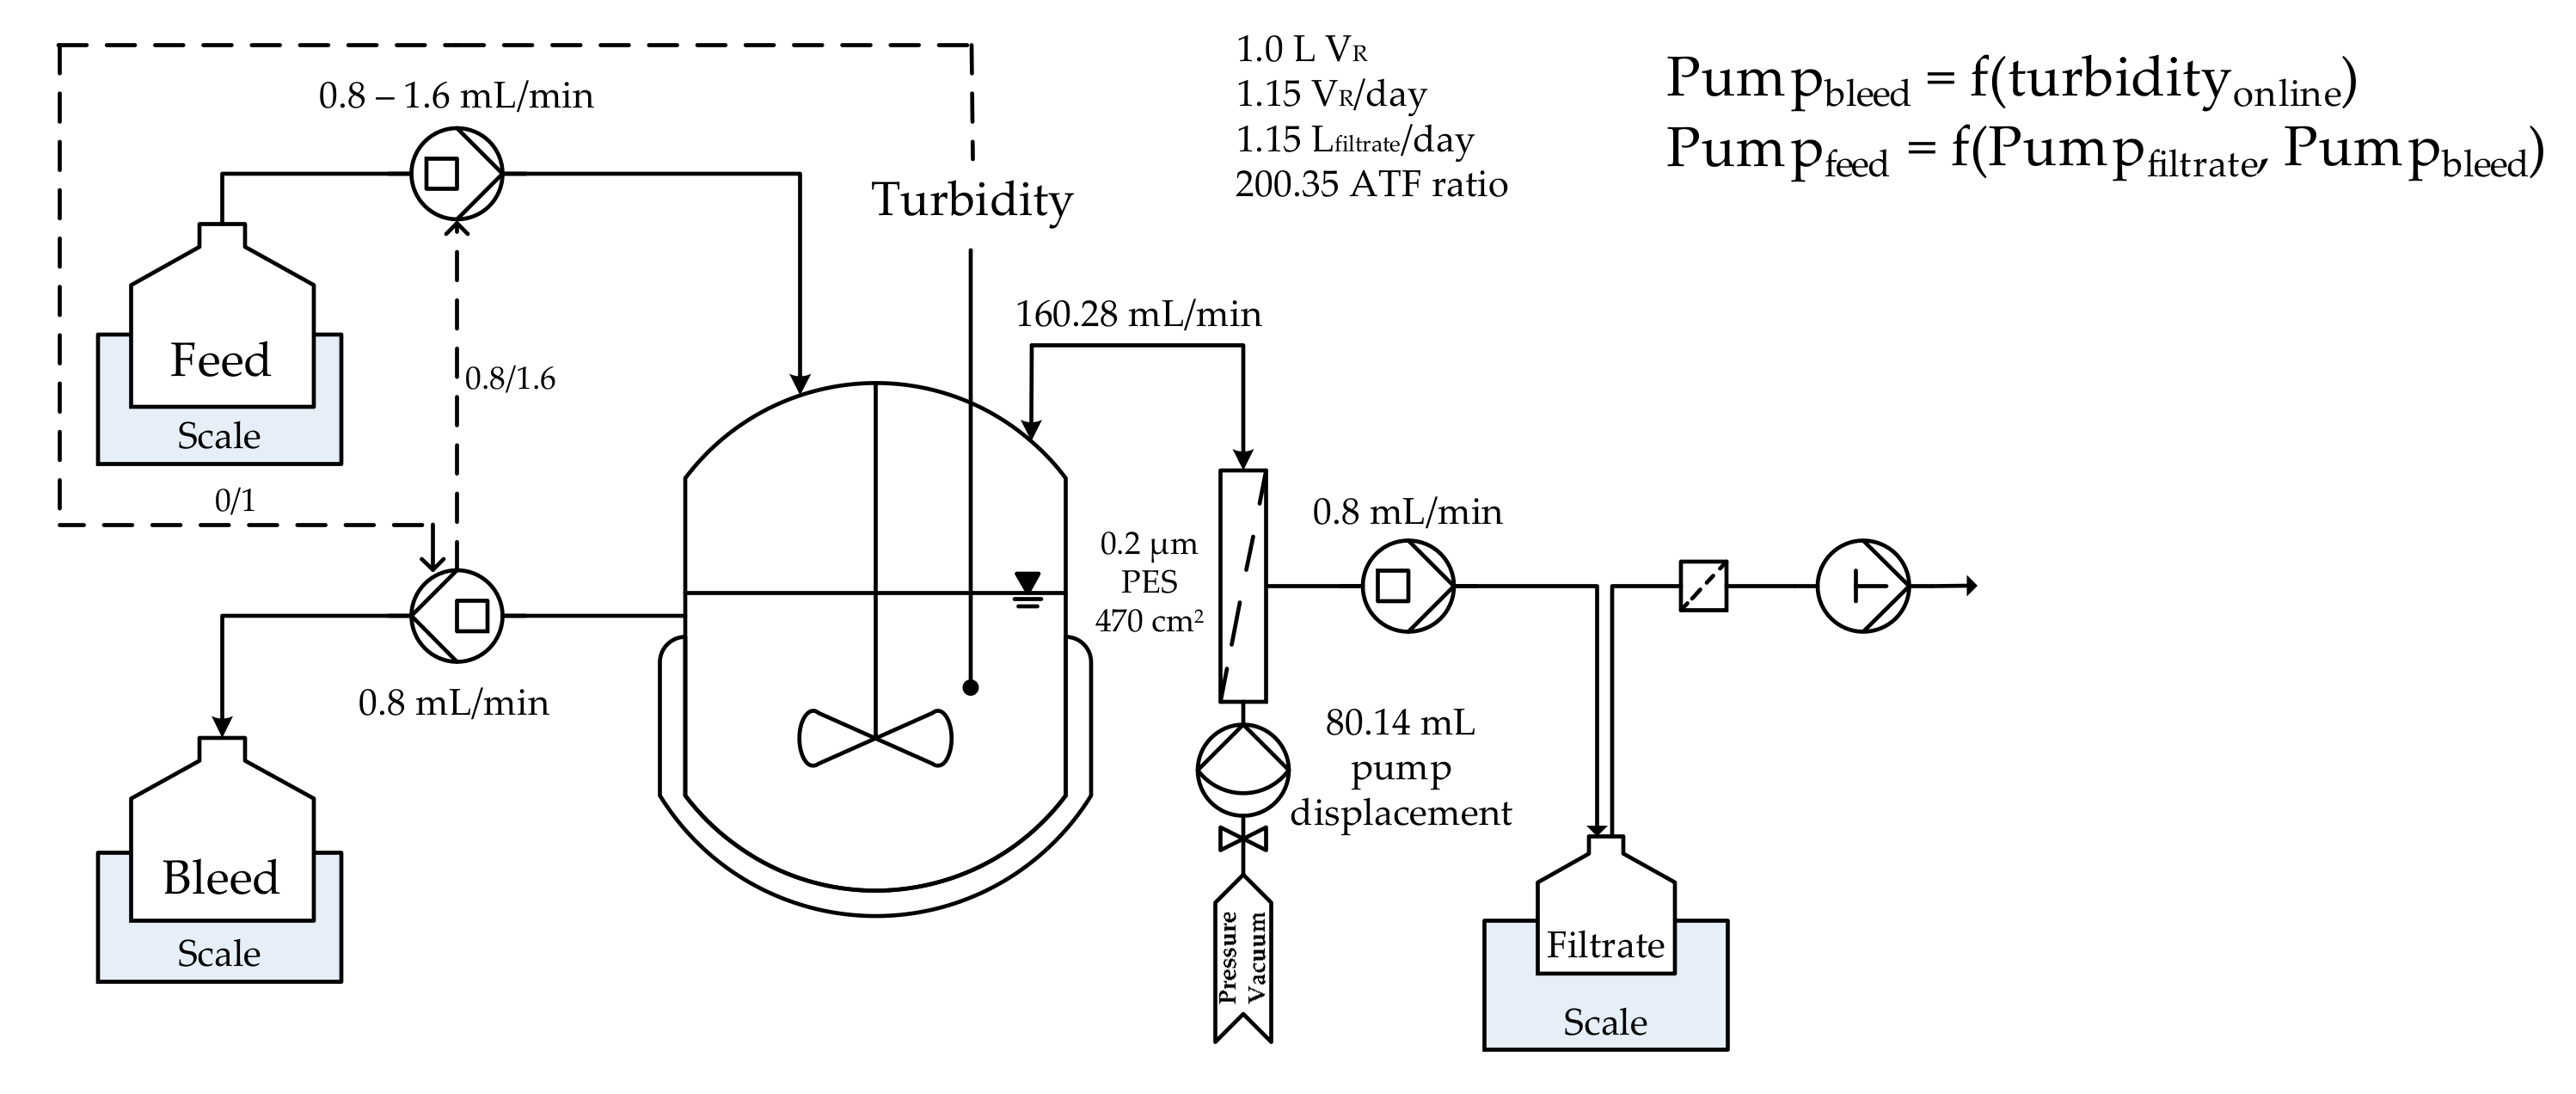
2.1. Cell Culture
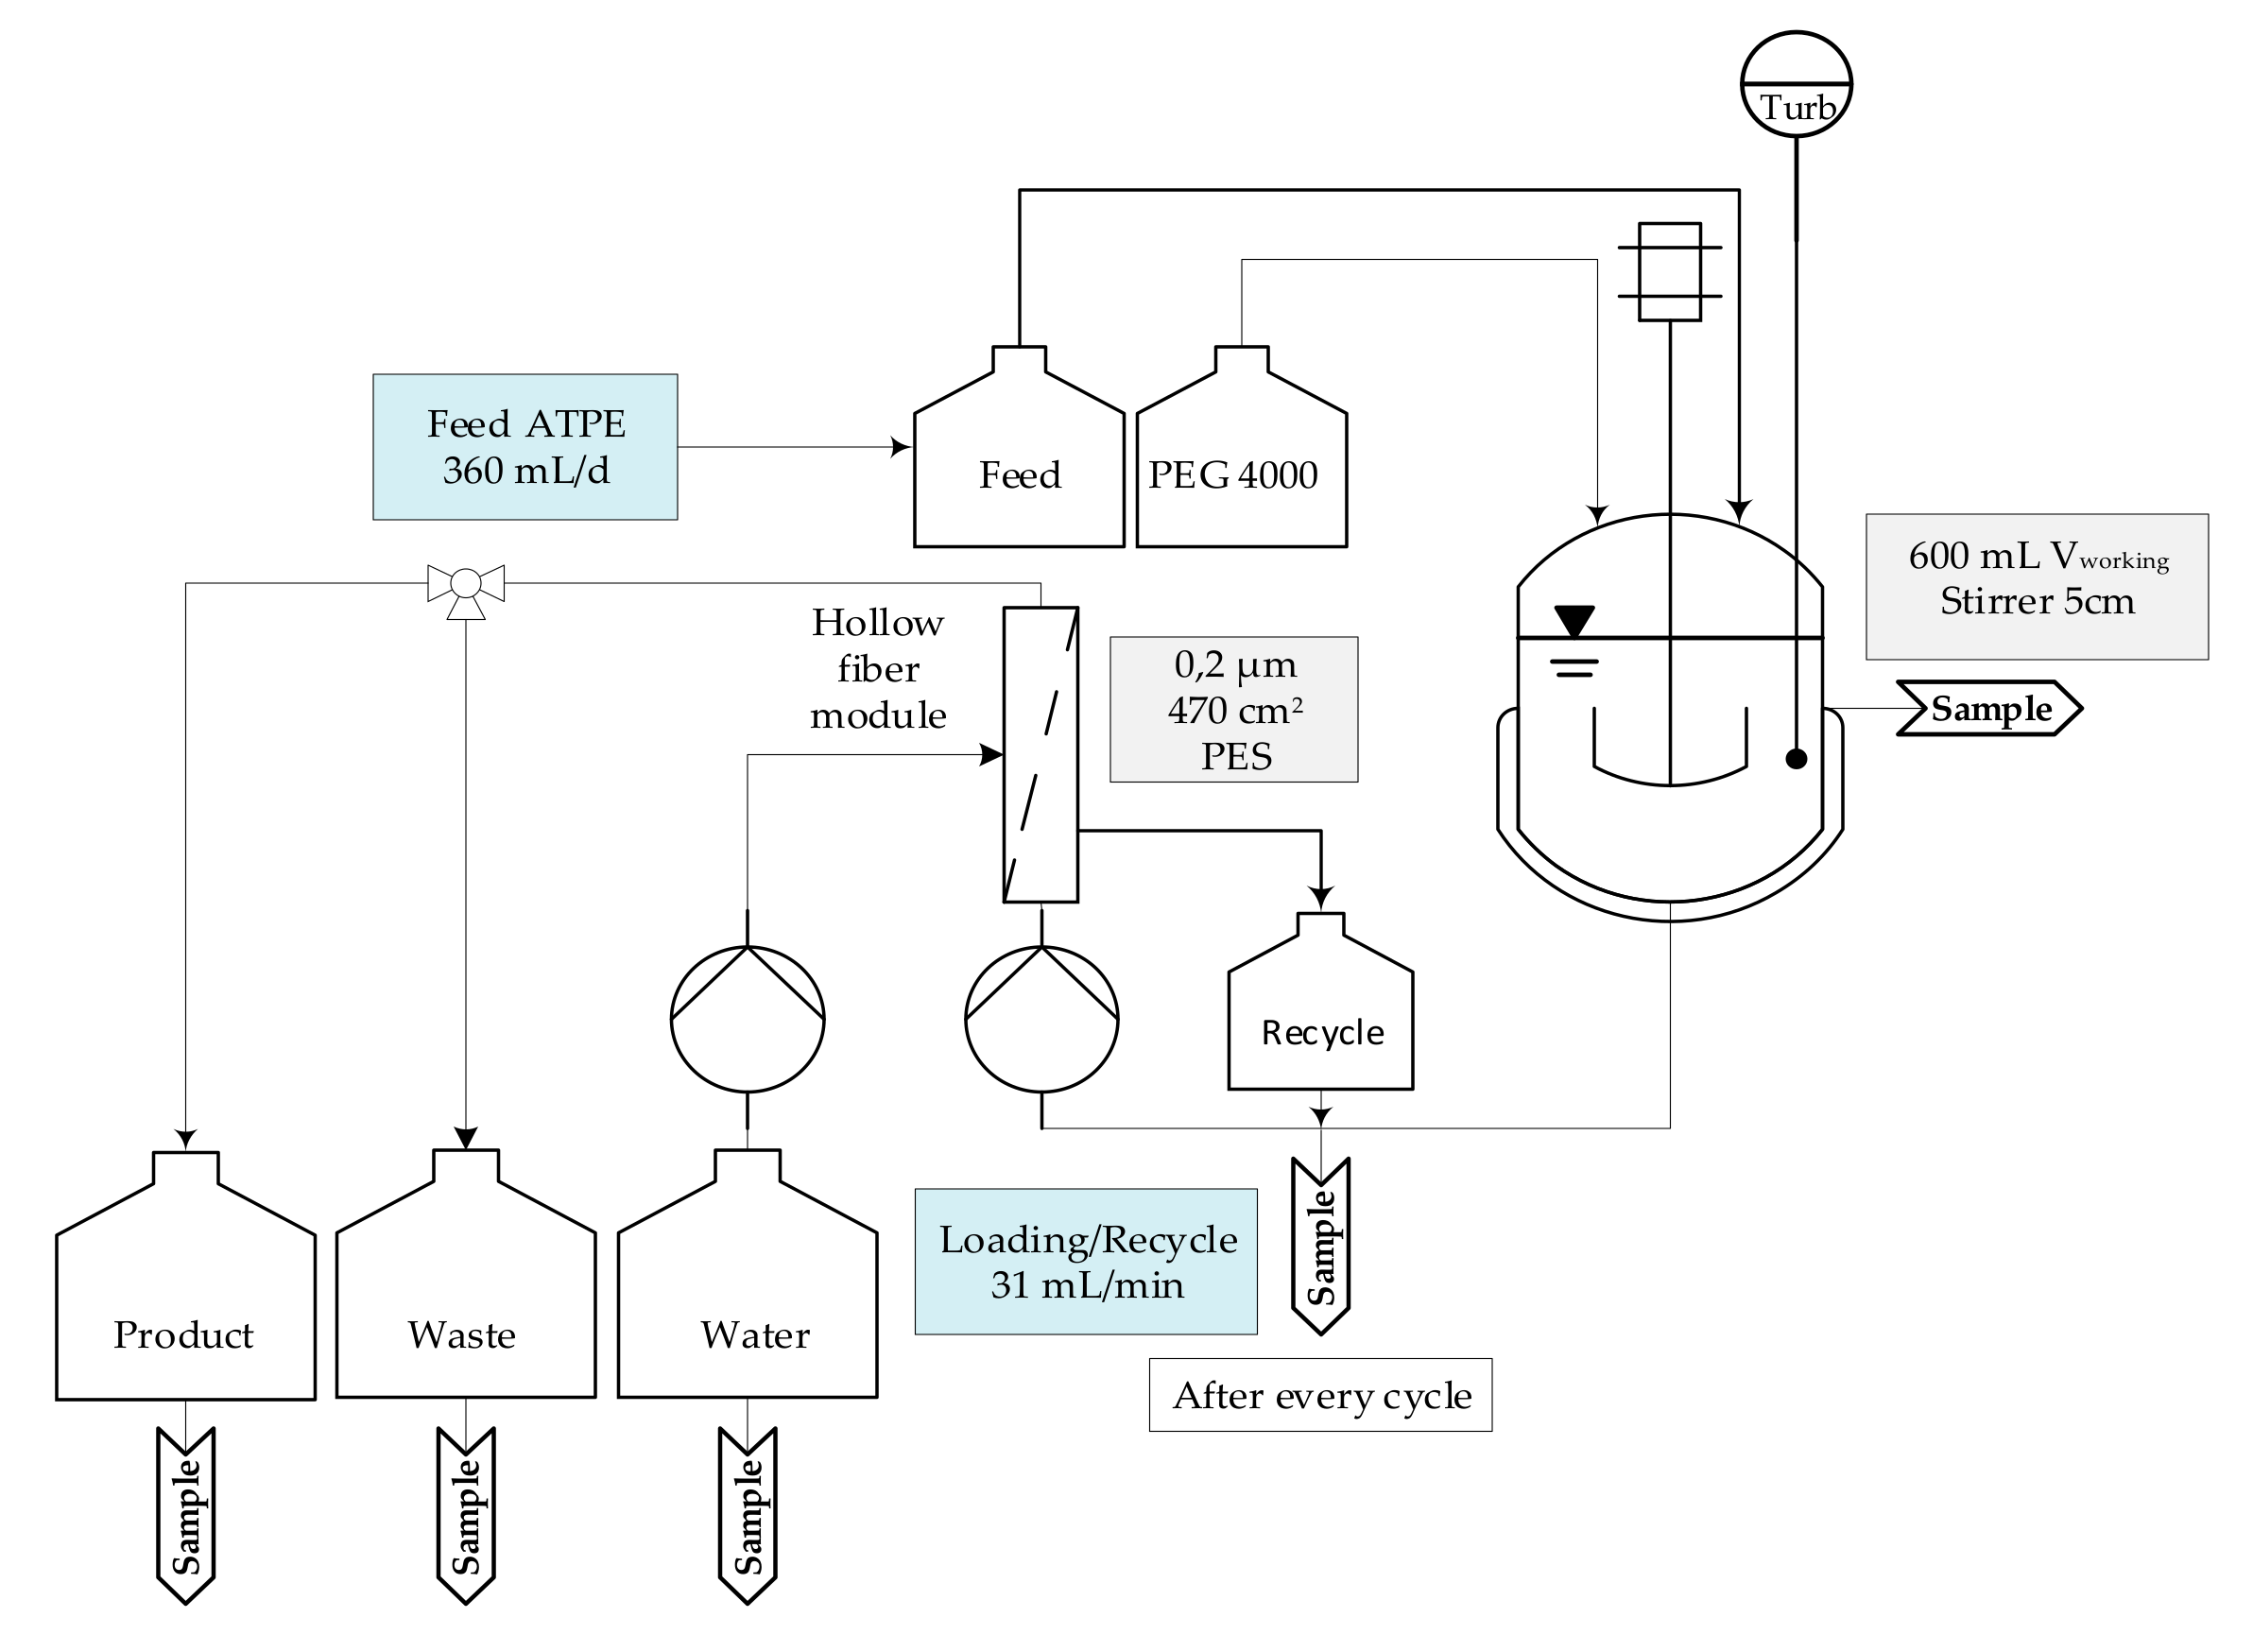
2.2. Extraction
2.3. Diafiltration
2.4. Precipitation
2.5. Chromatographic Separation
2.6. Lyophilization
- -
- A scale (“LyoBalance” measuring the weight loss of a single vial)
- -
- Up to eight wireless temperature sensors (“Wireless Temperature Measurement”, WTM)
- -
- A resistance sensor (“LyoRx” to determine the freezing point)
- -
- Two different pressure sensors (capacity and Pirani, enabling comparative pressure measurement)
2.7. Buffers and Columns
2.8. Devices and Instruments
3. Results and Discussion
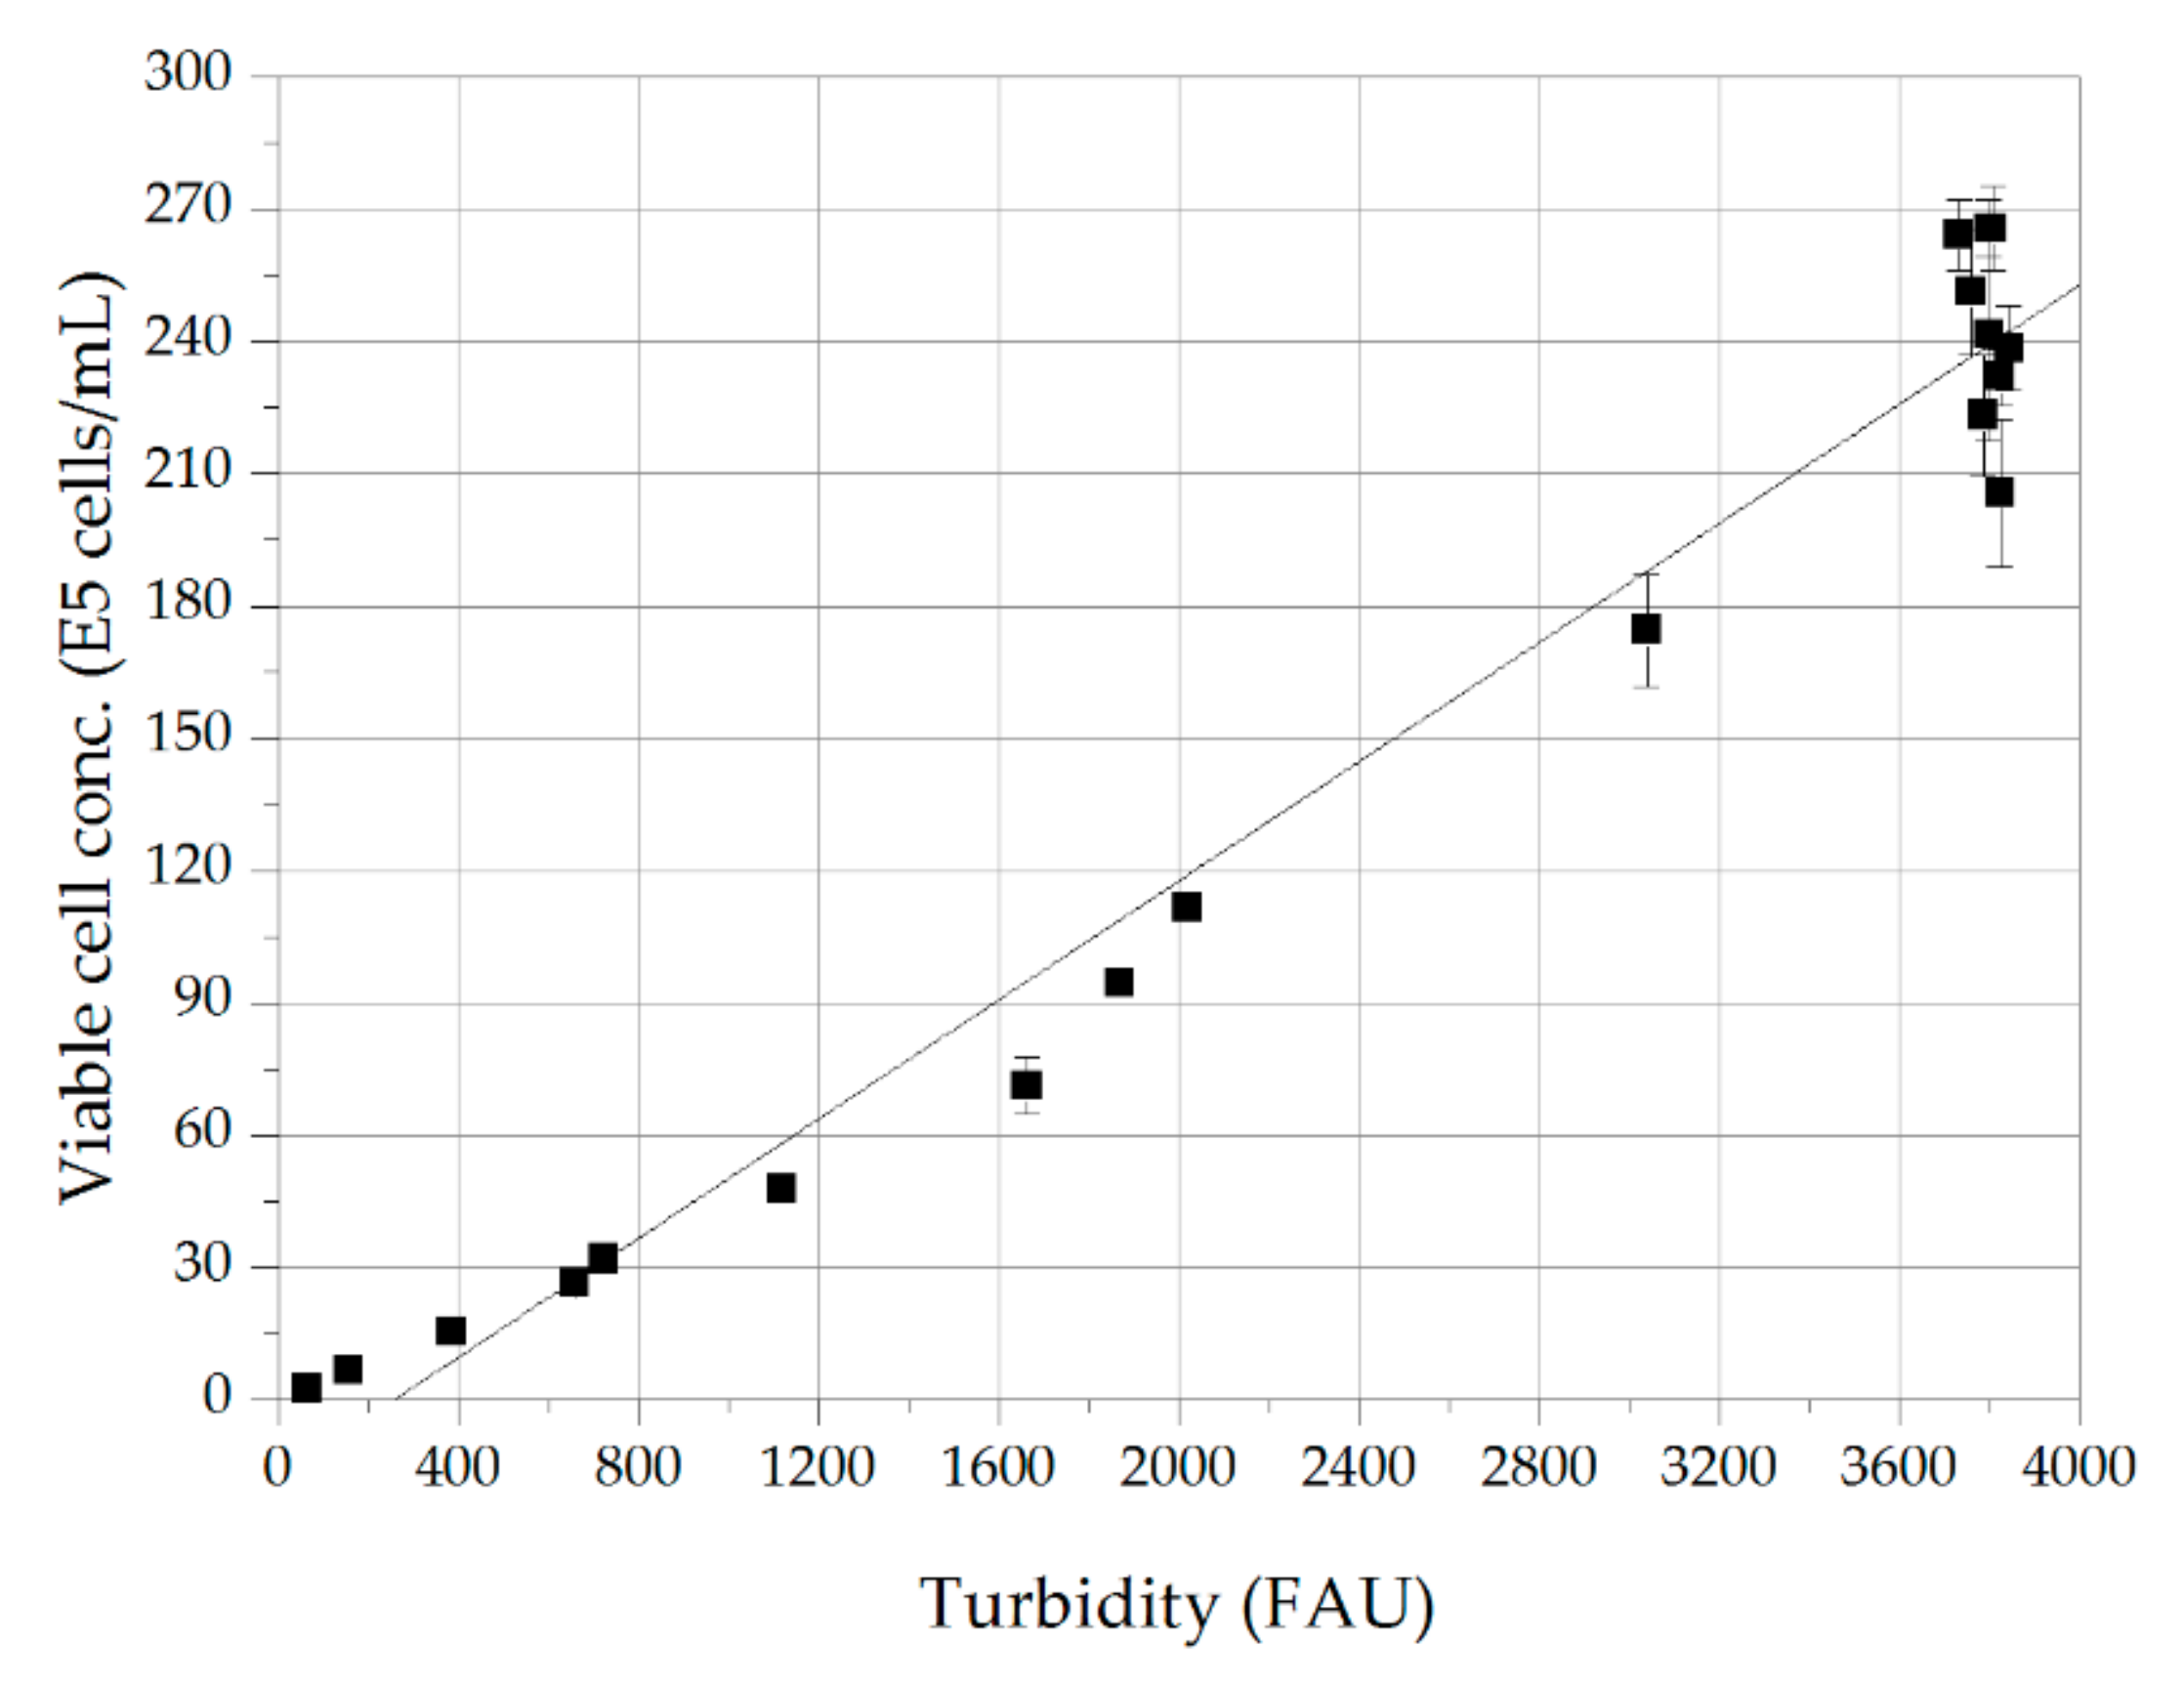
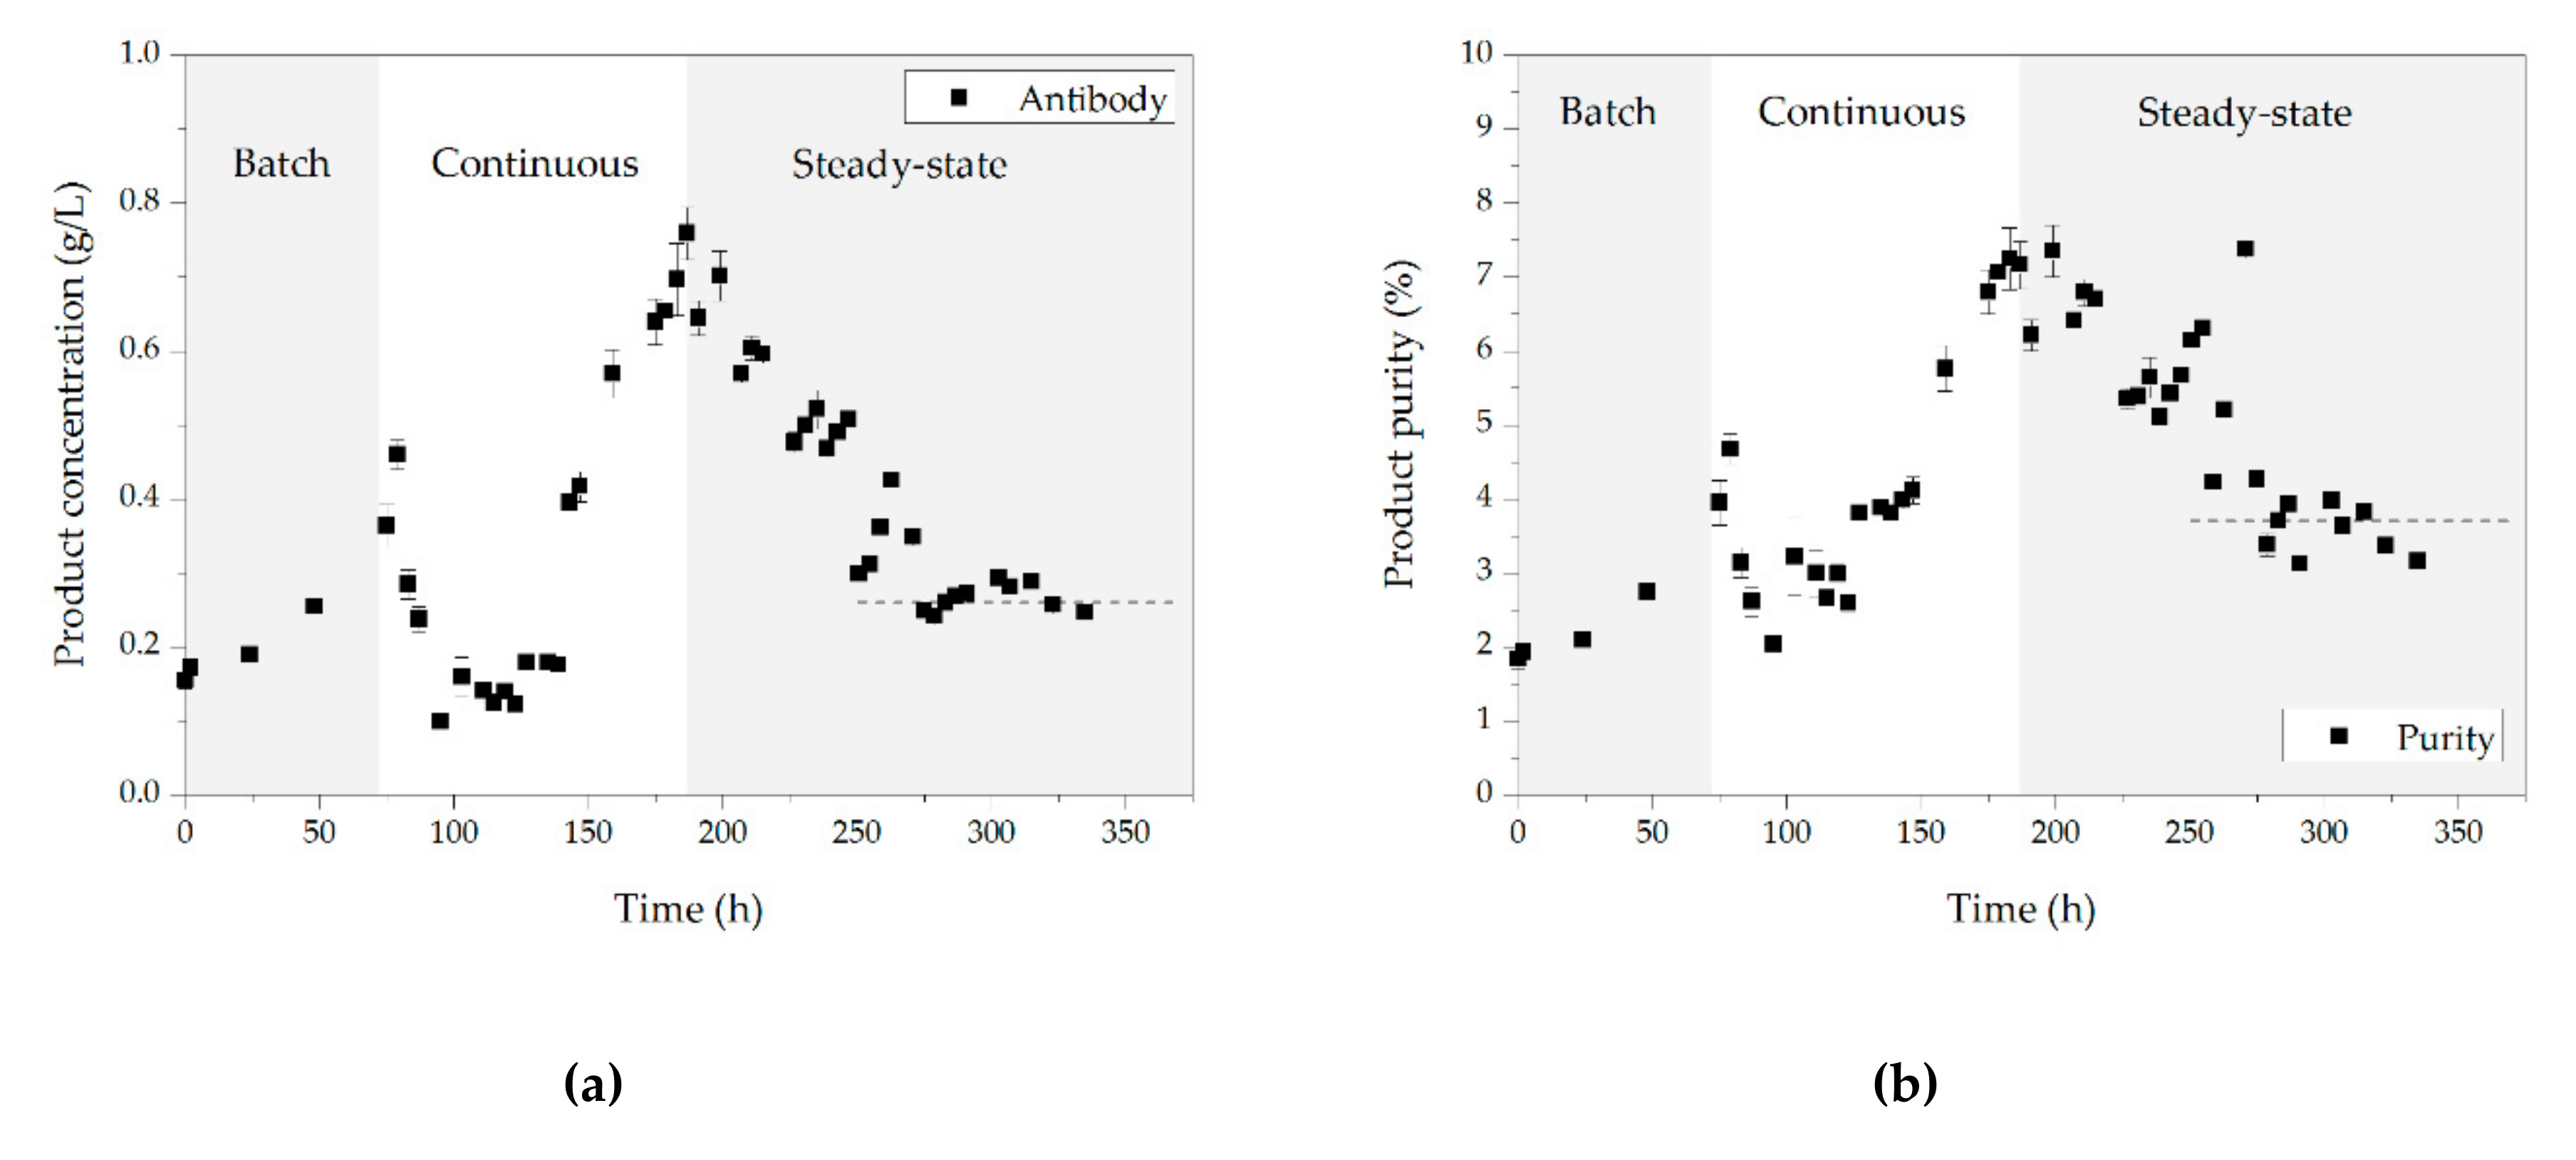
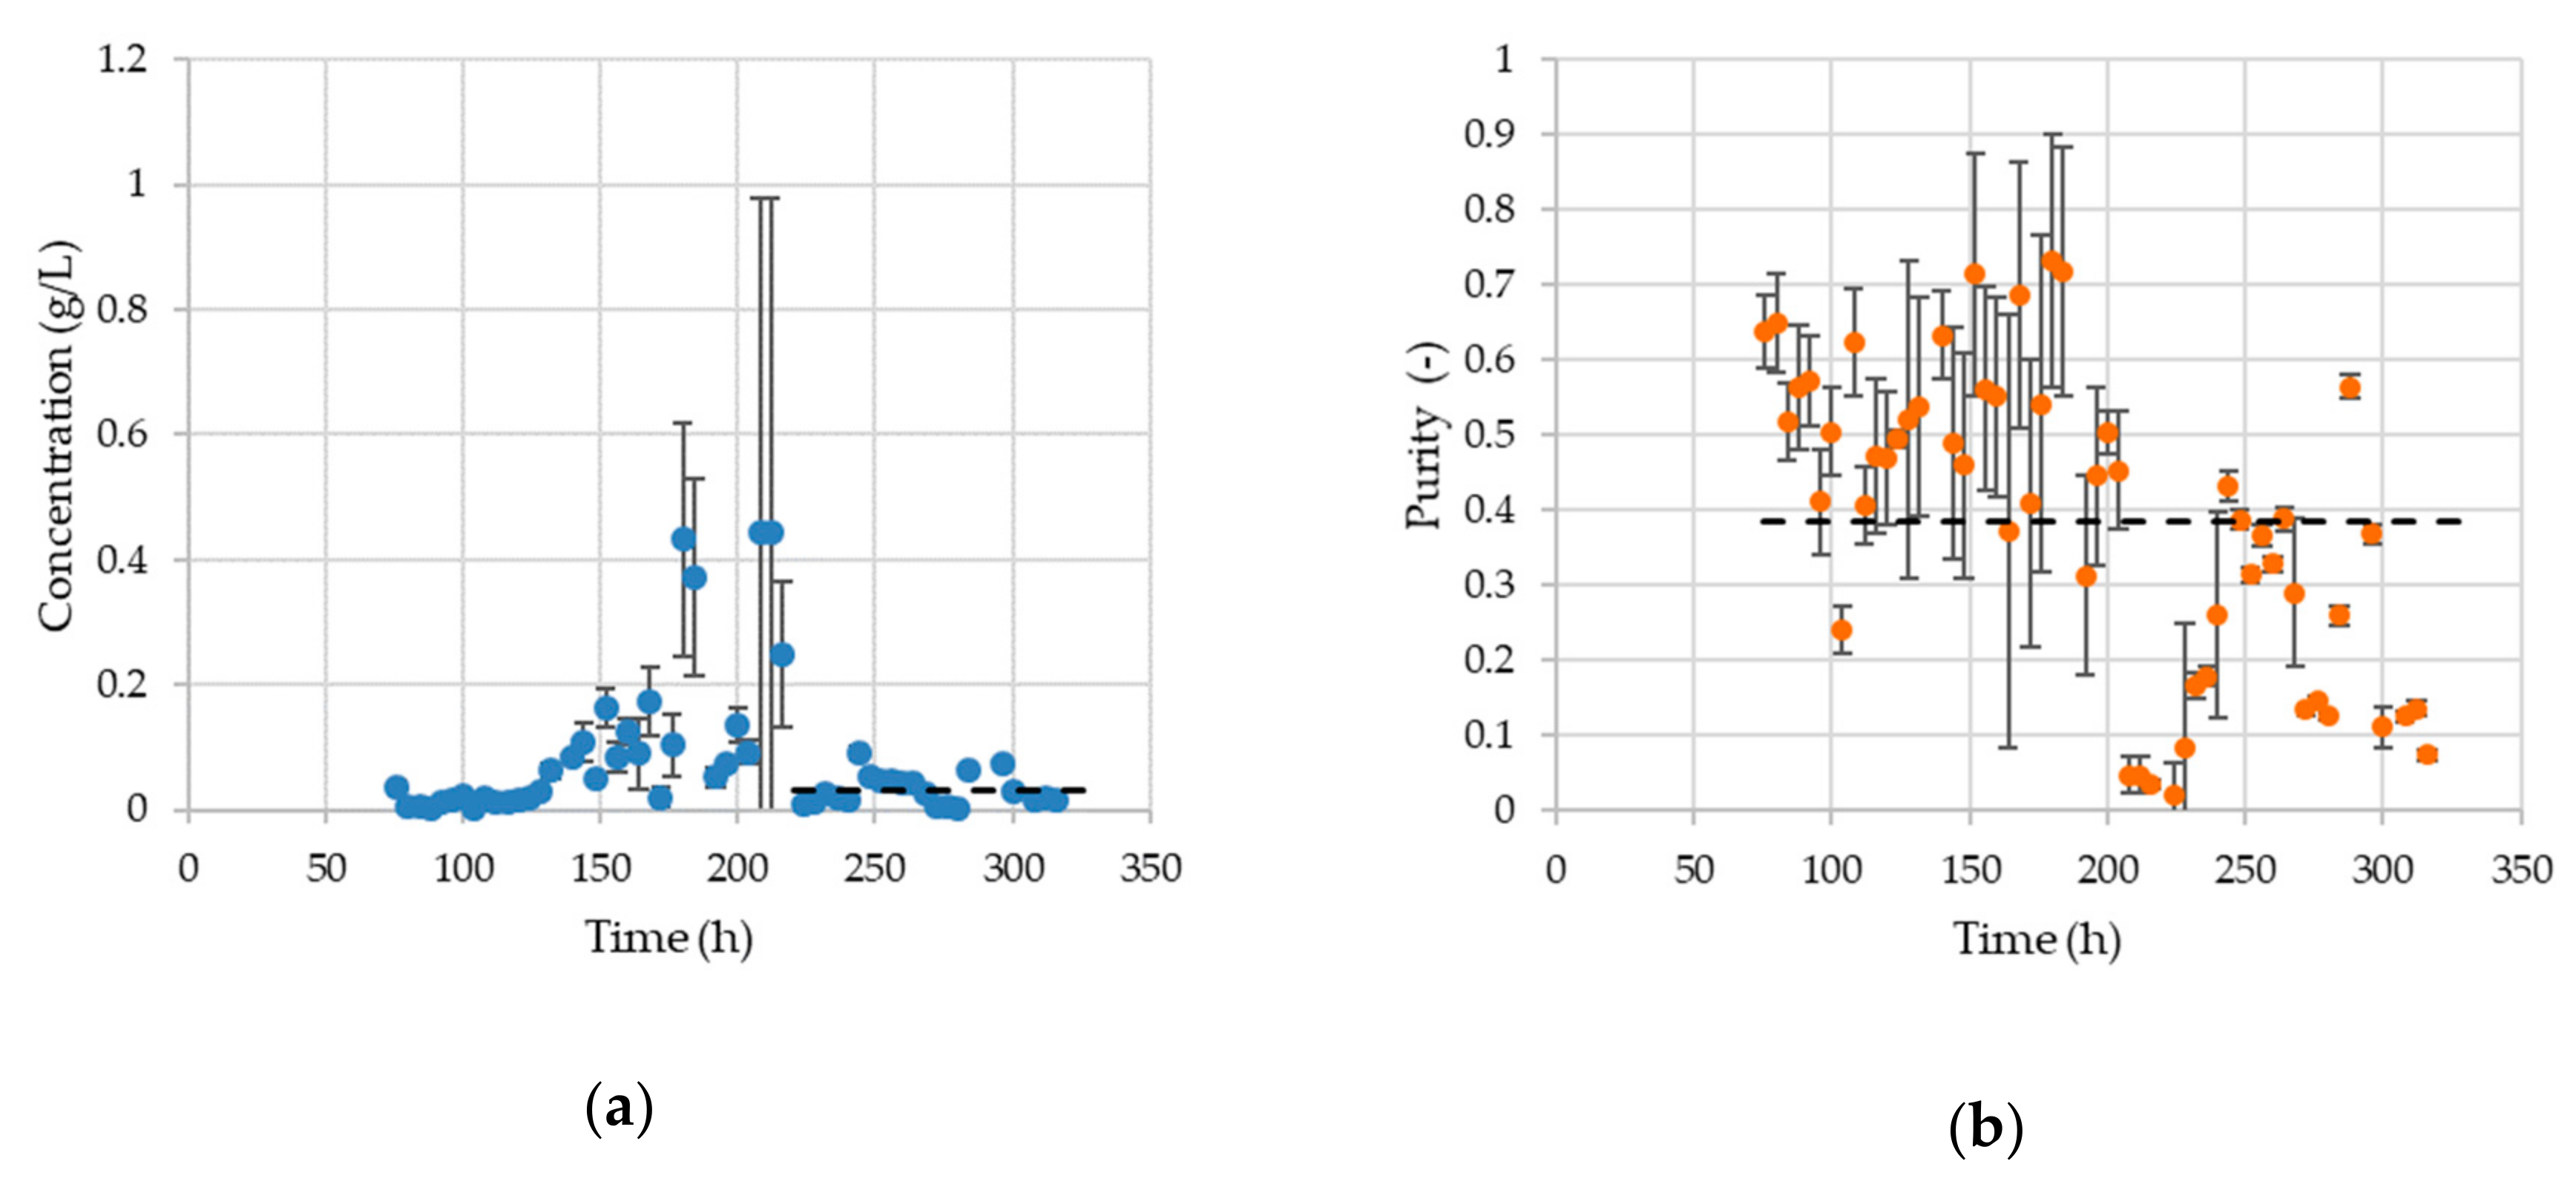
3.1. Cell Culture
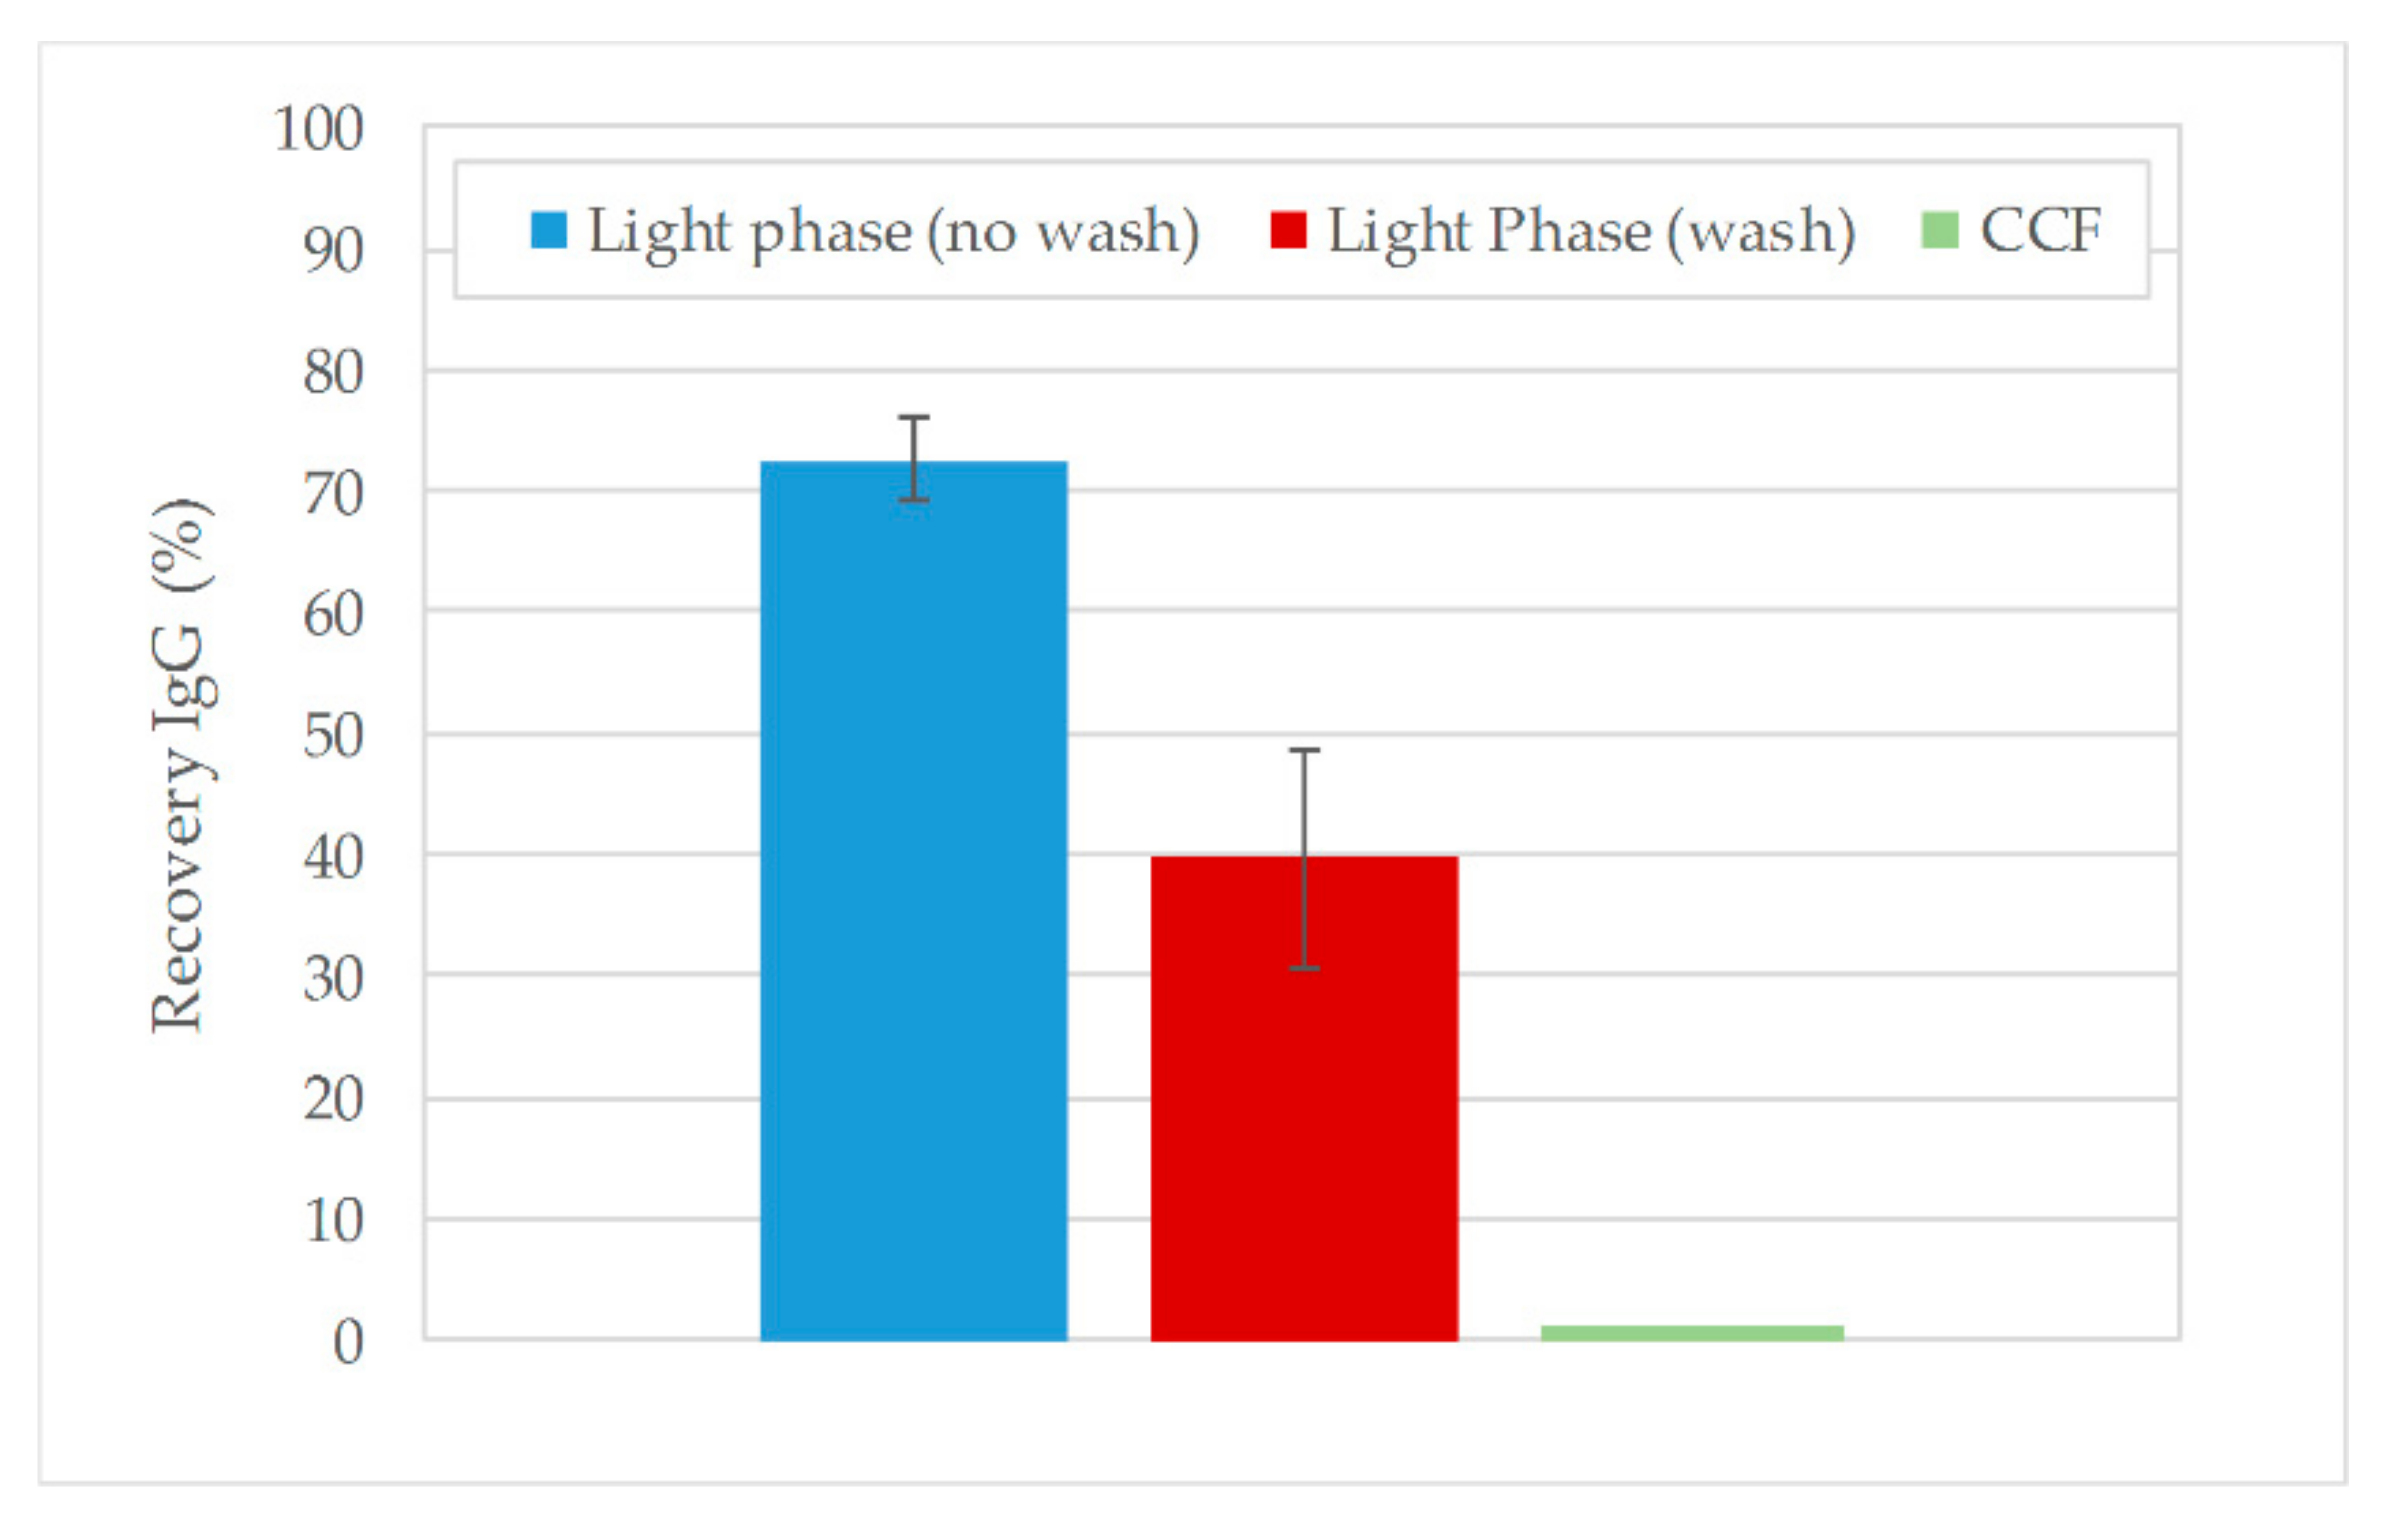
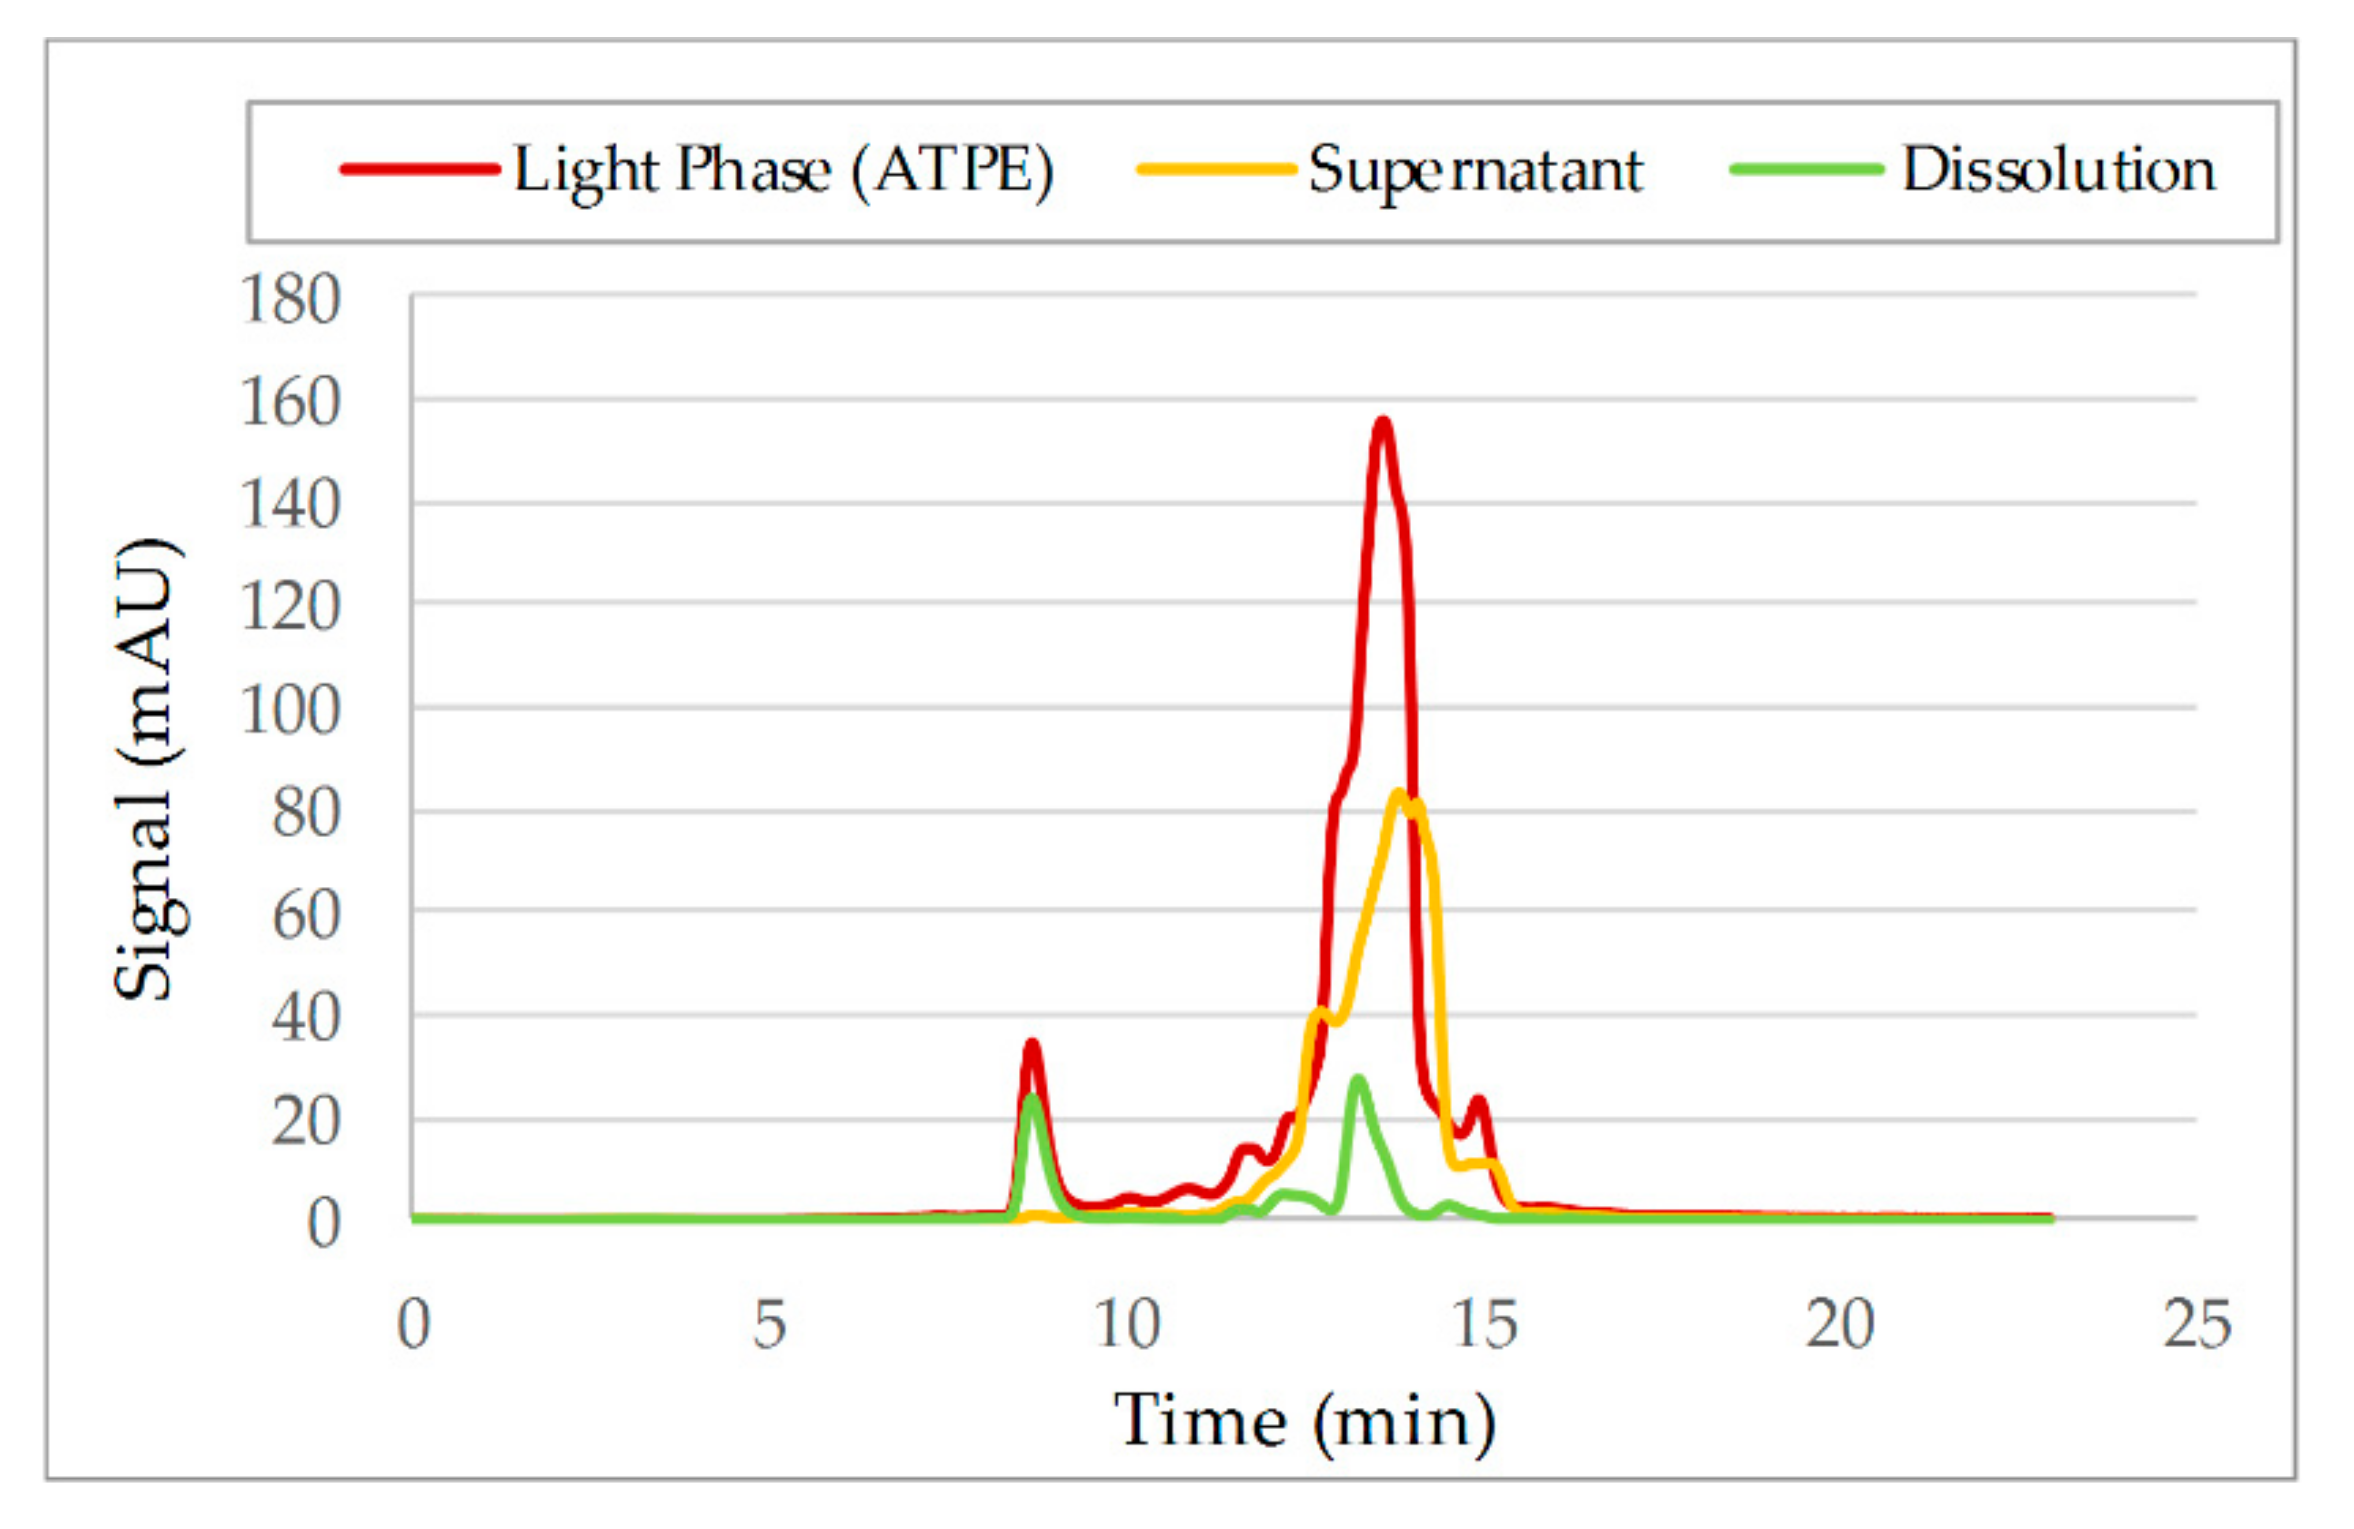
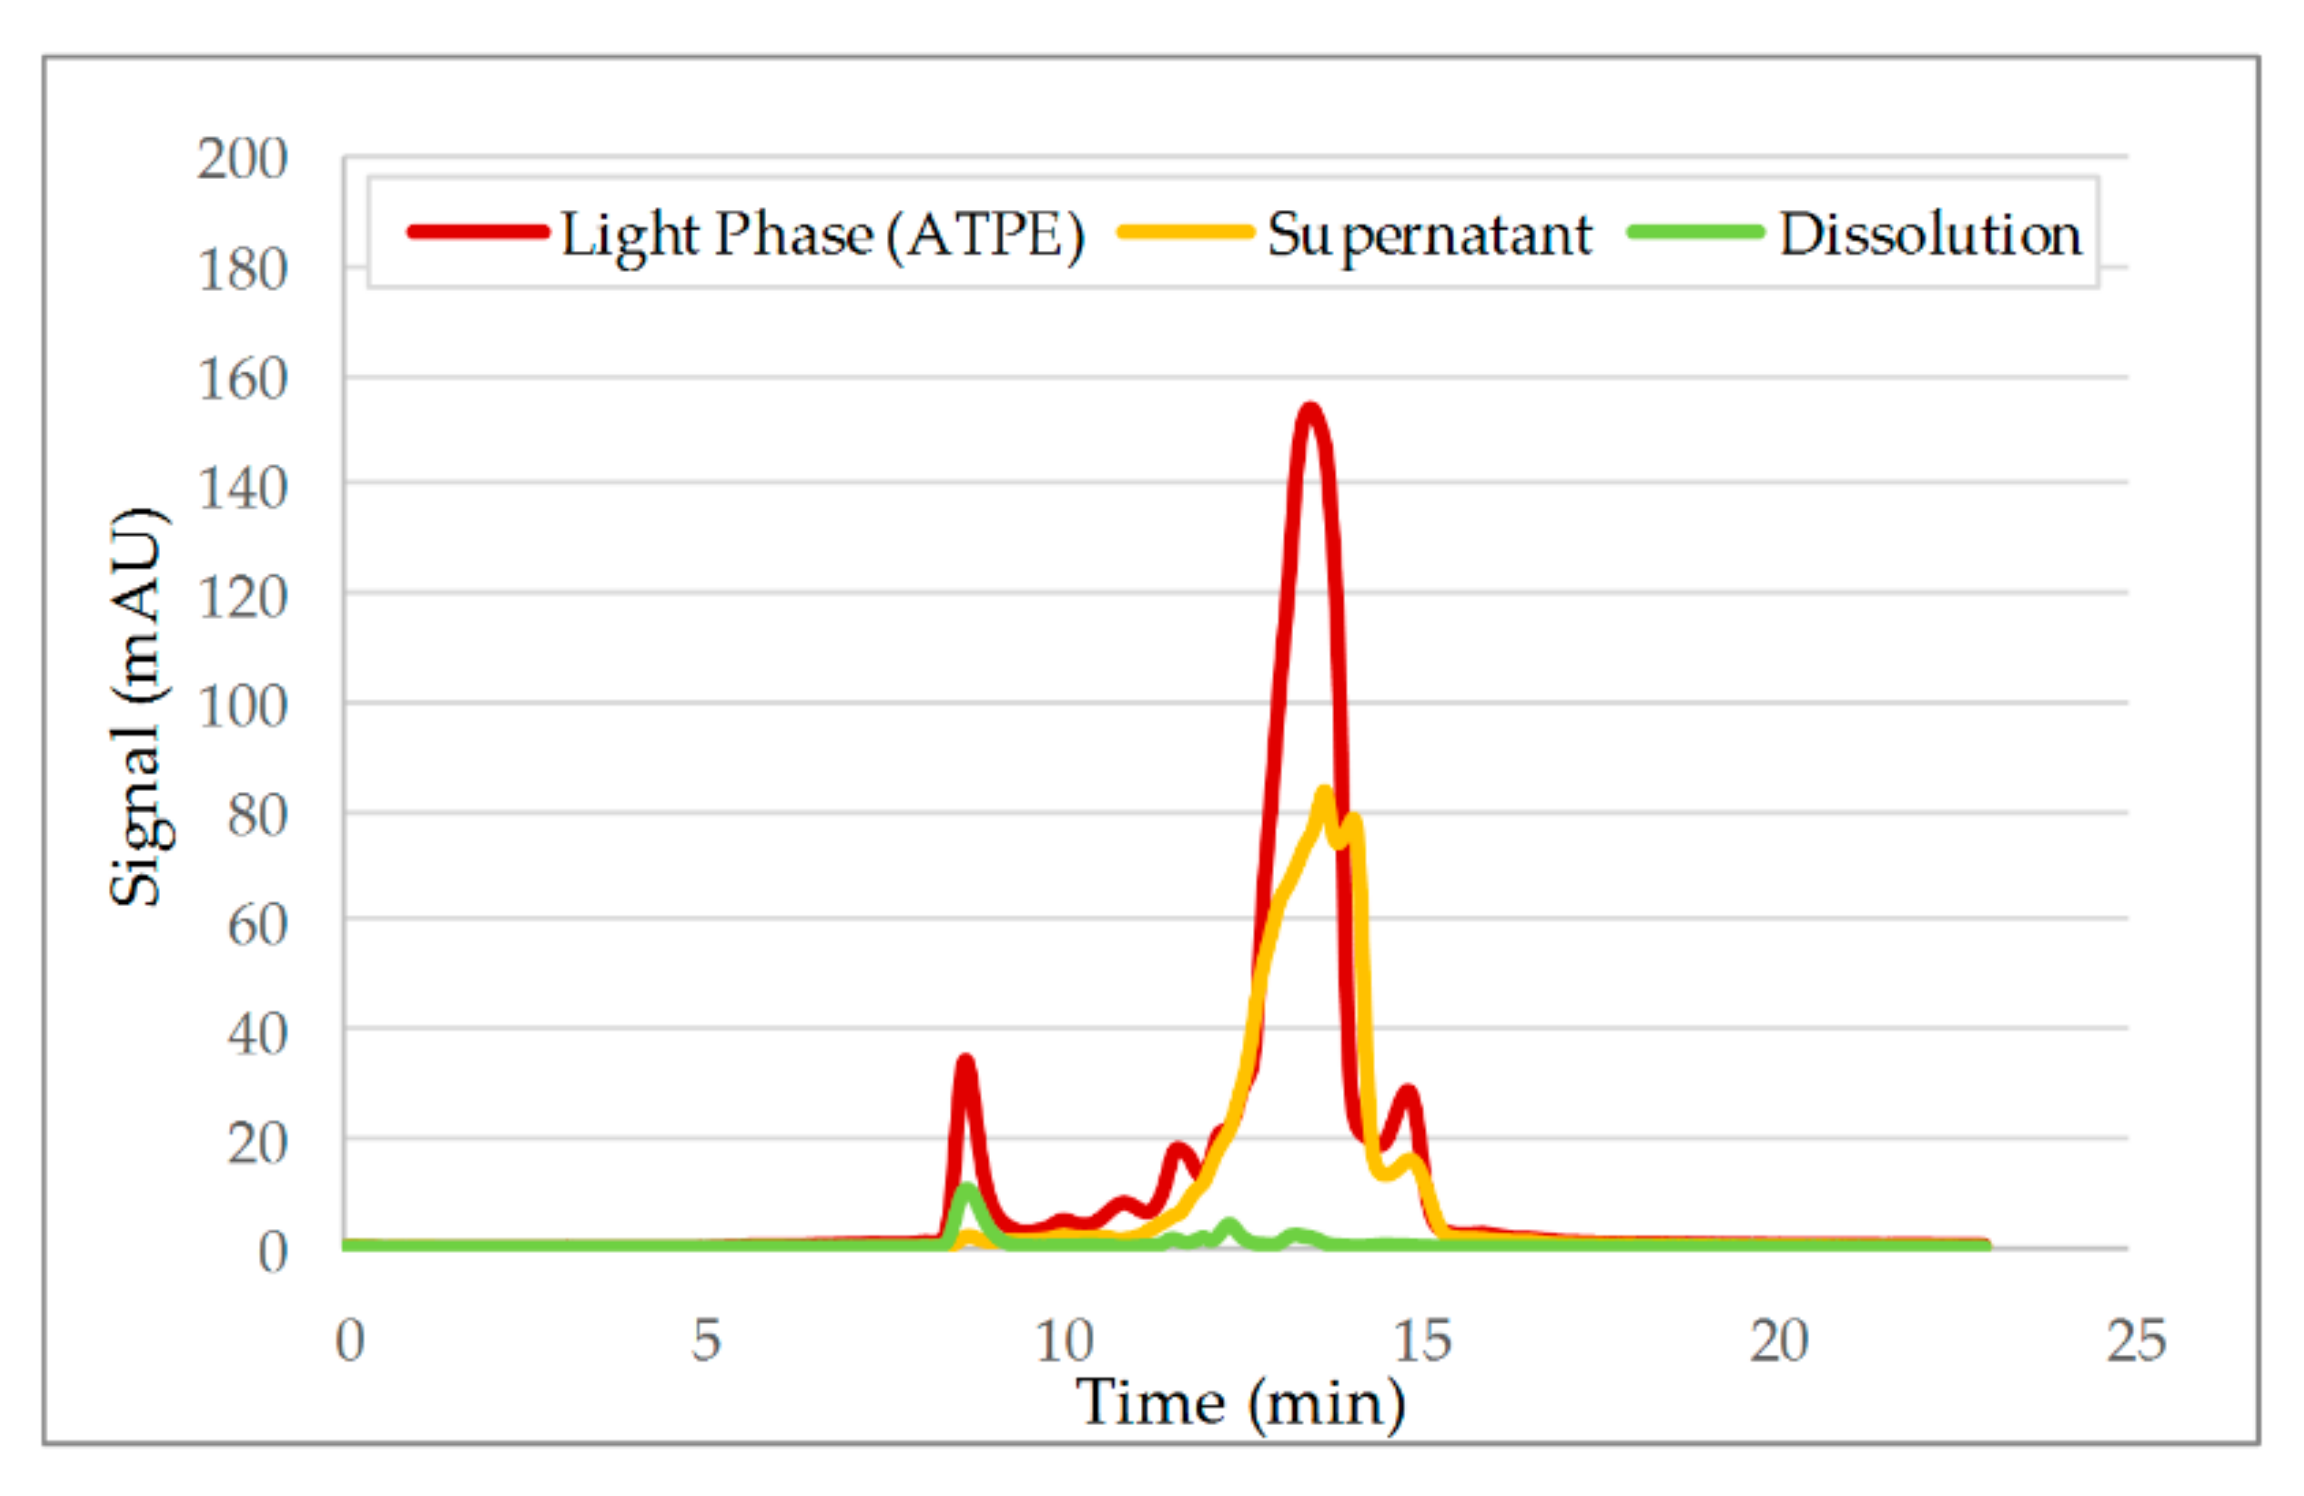
3.2. Aqueous Two-Phase Extraction
3.3. Diafiltration
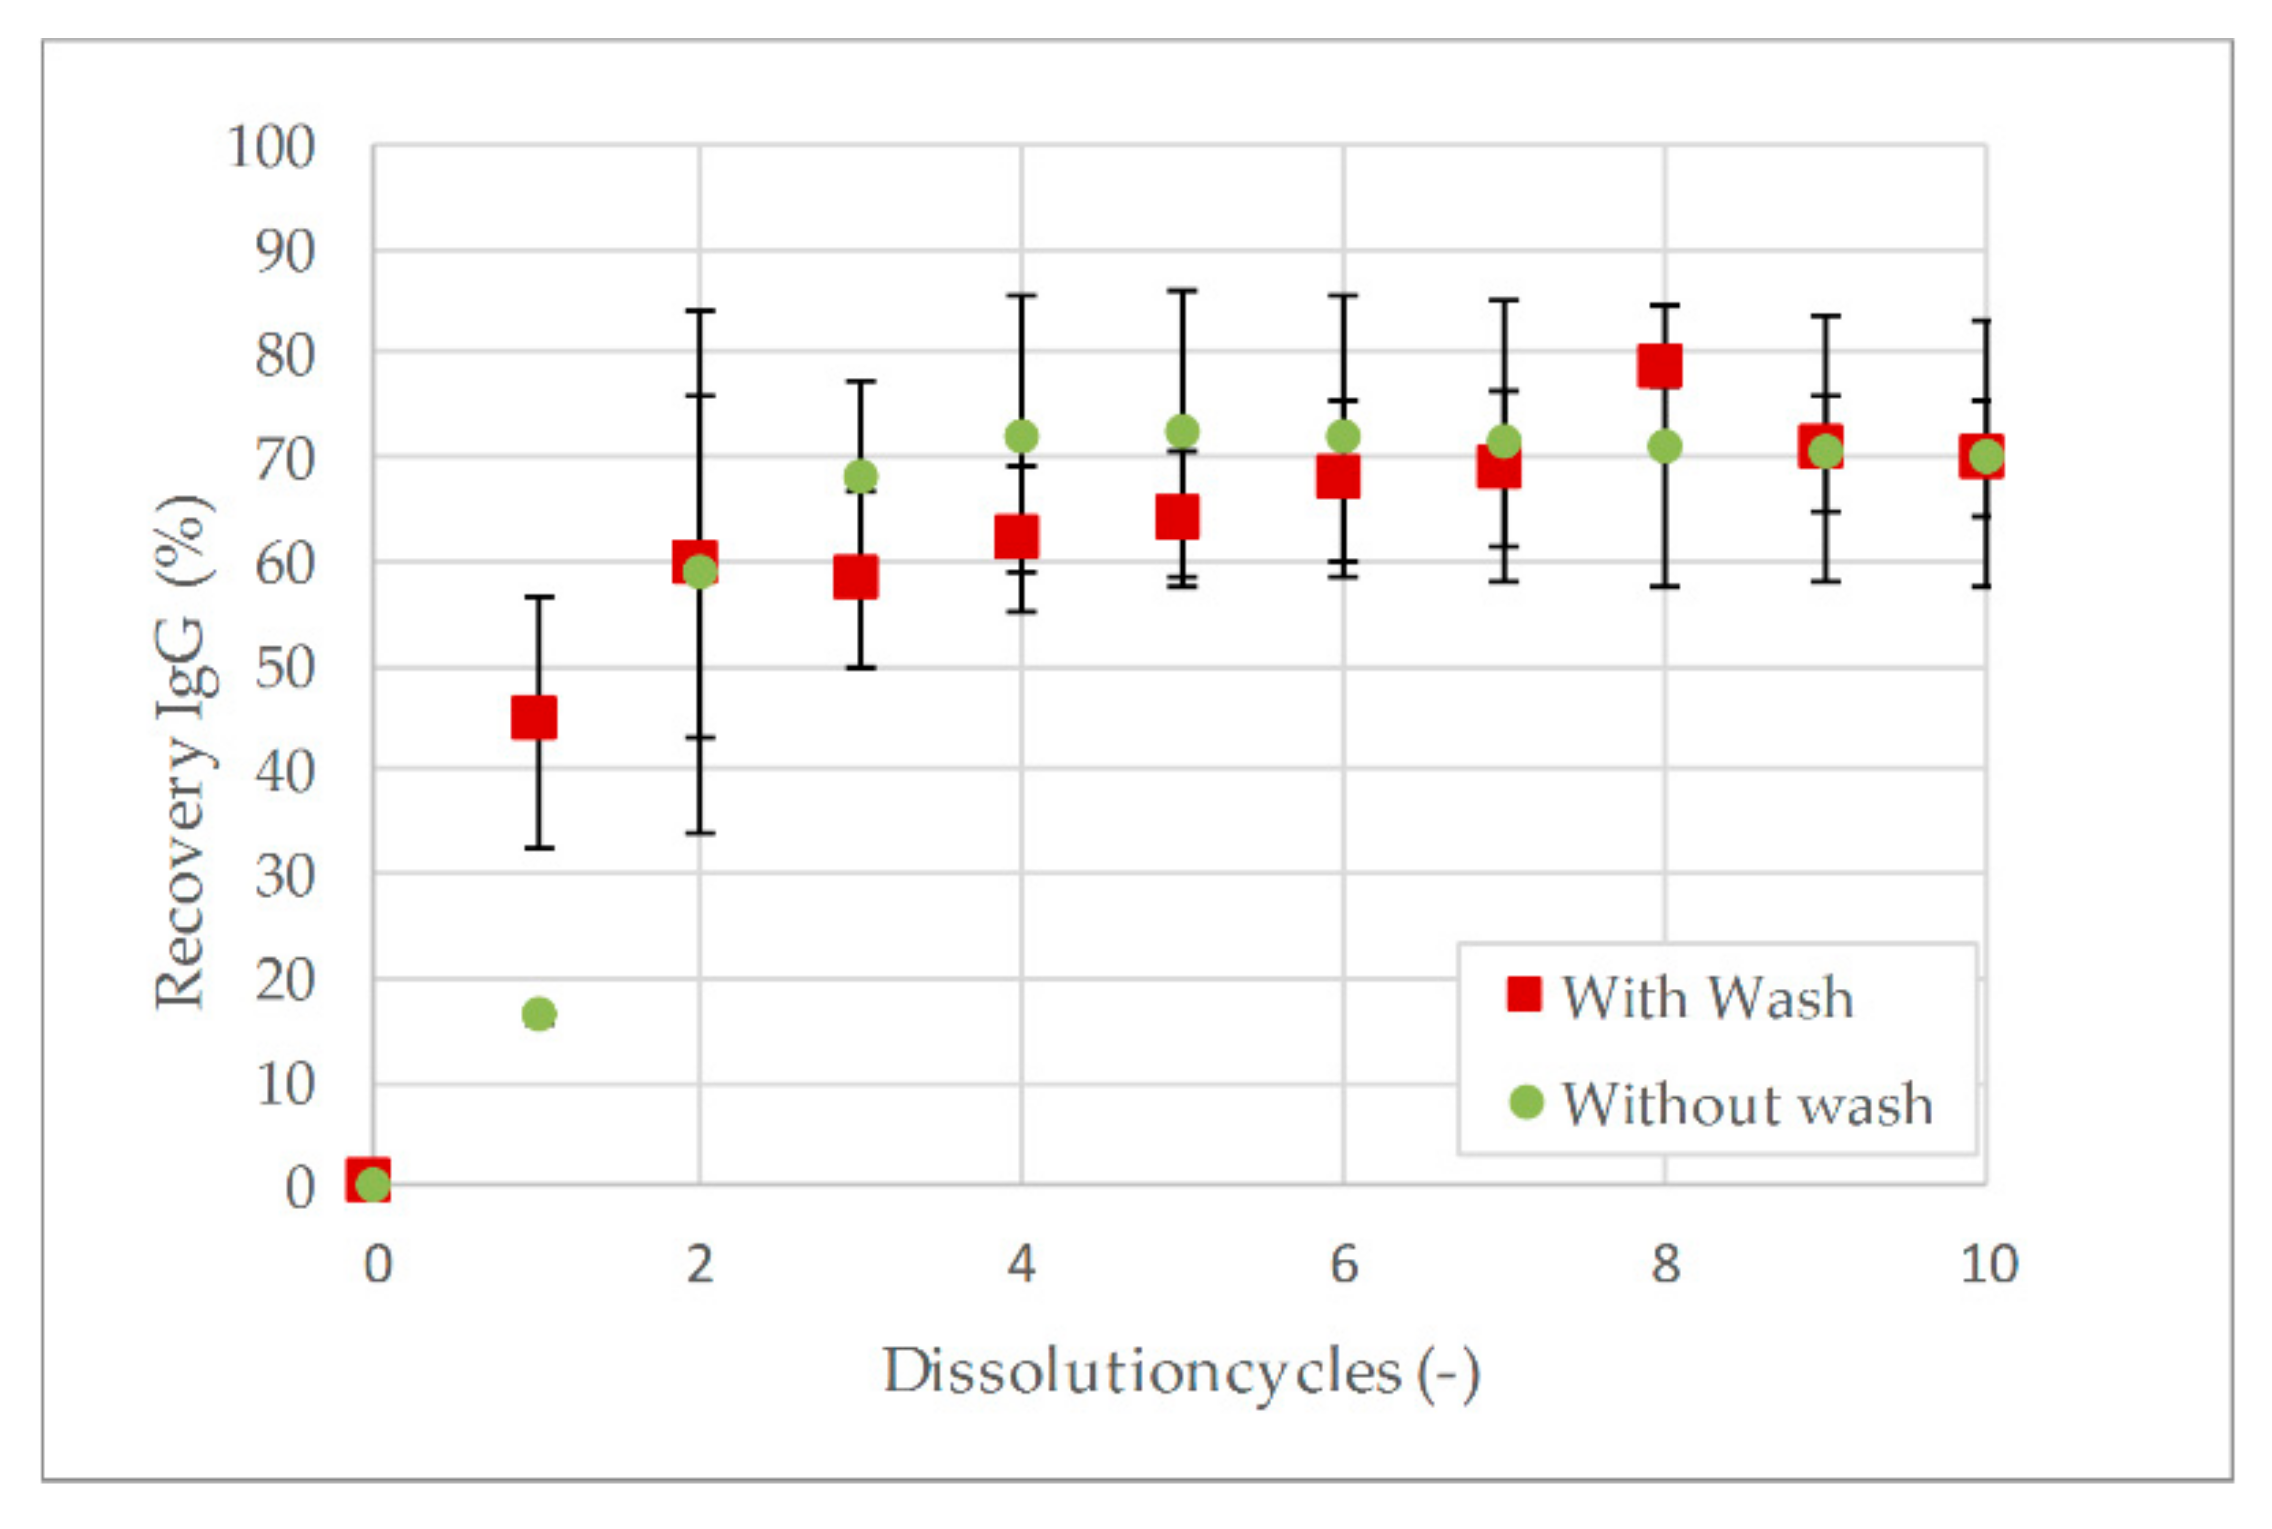
3.4. Precipitation
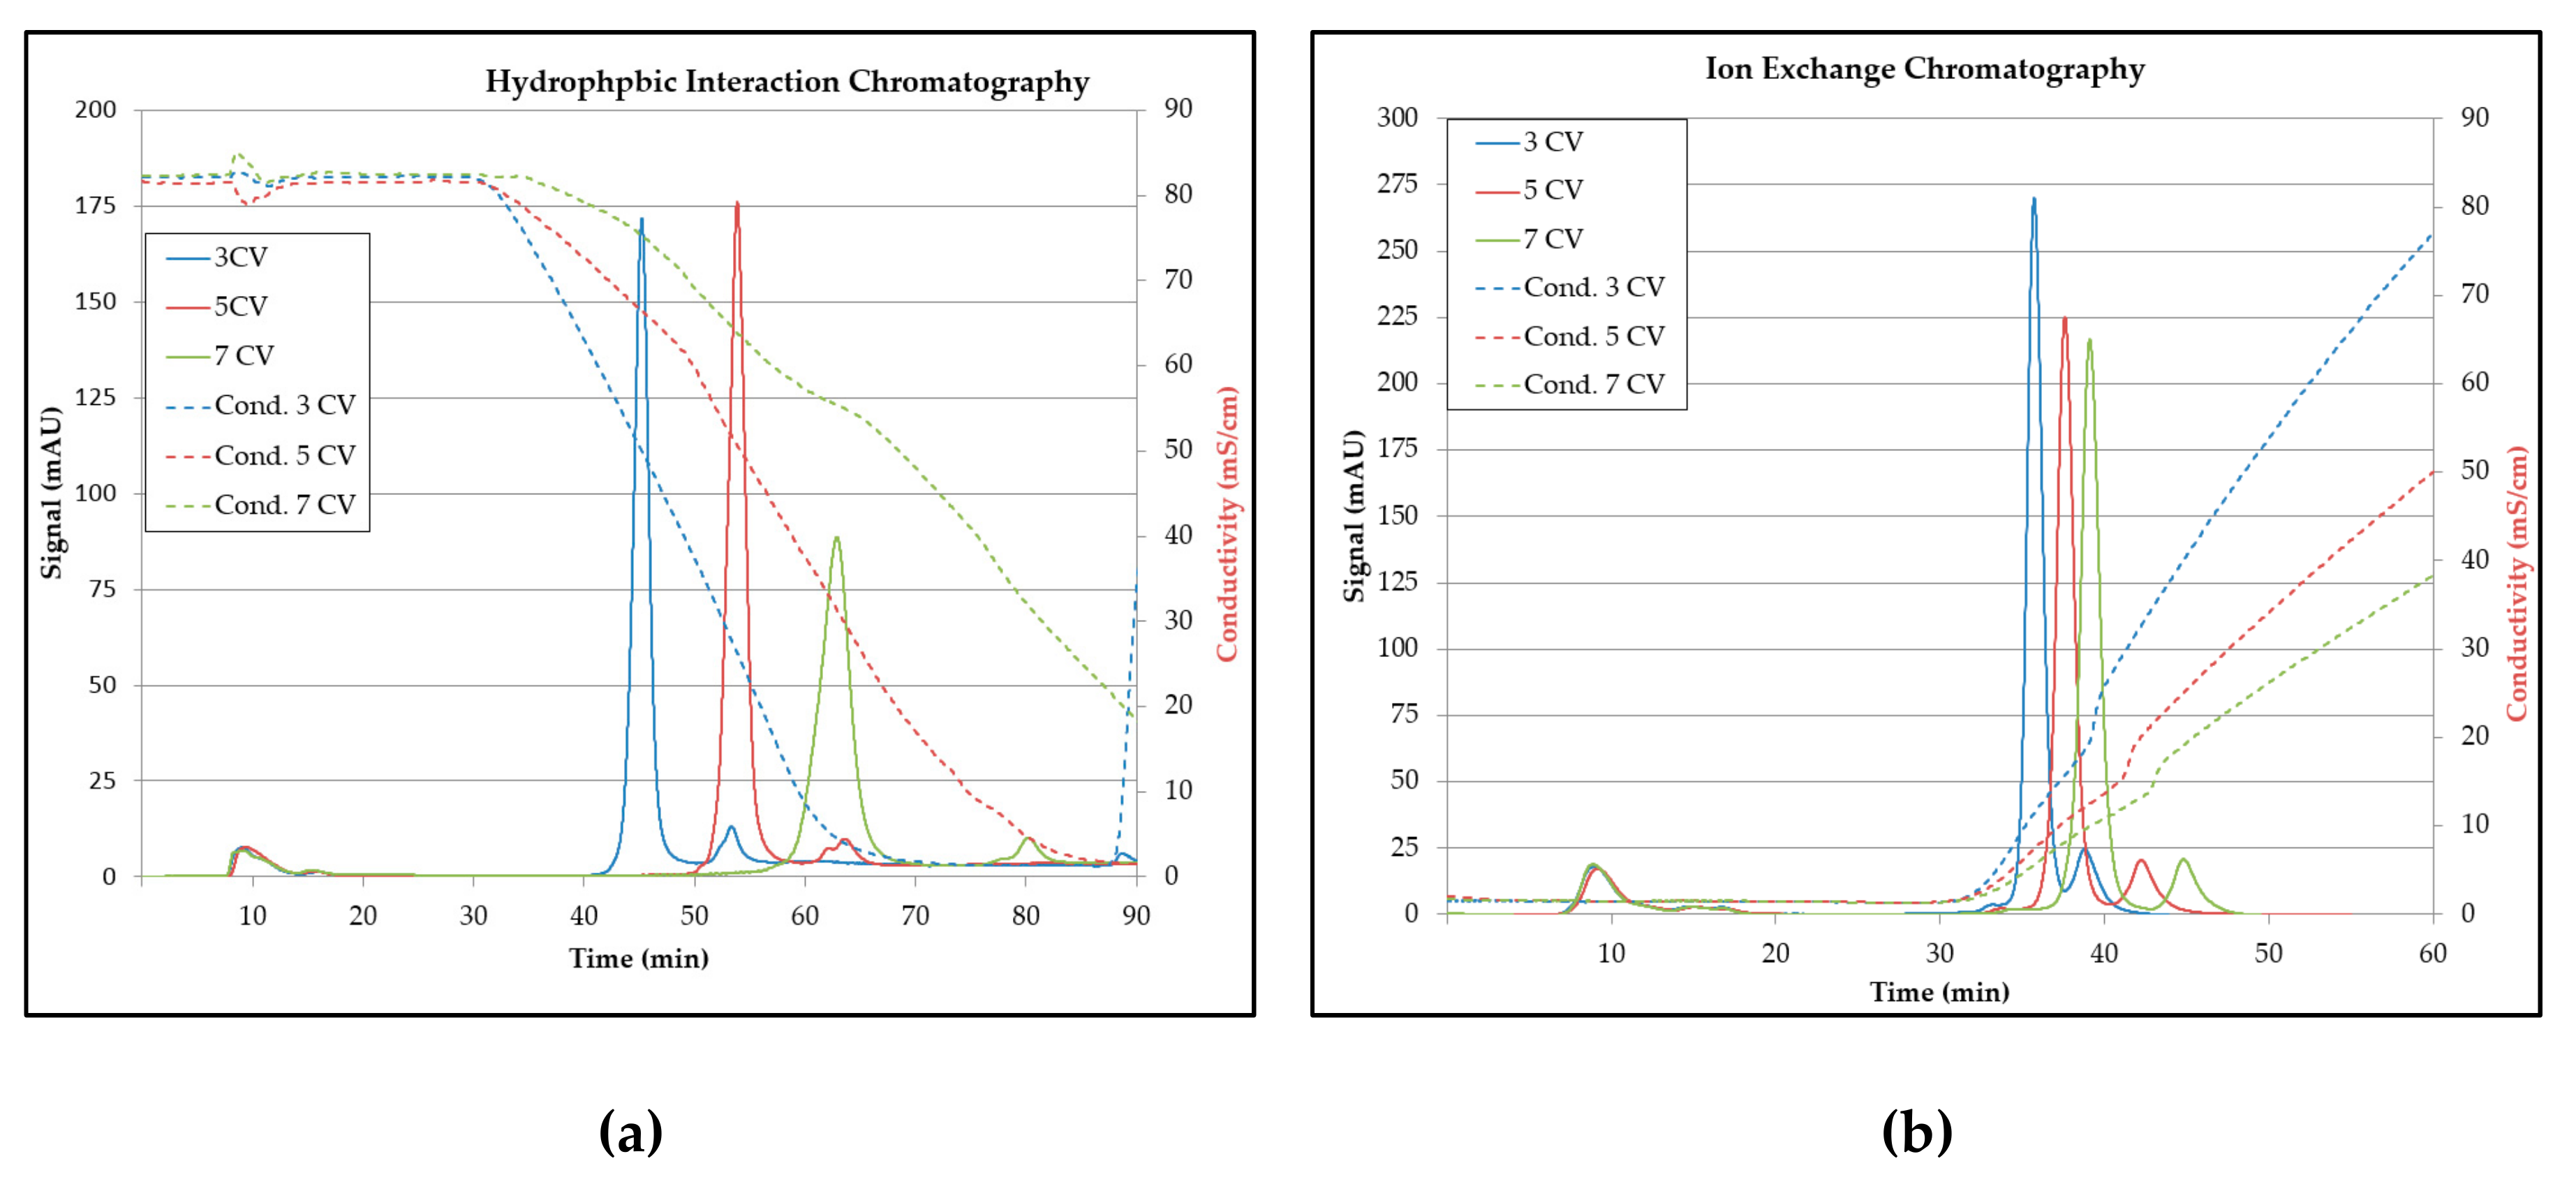
3.5. Chromatography
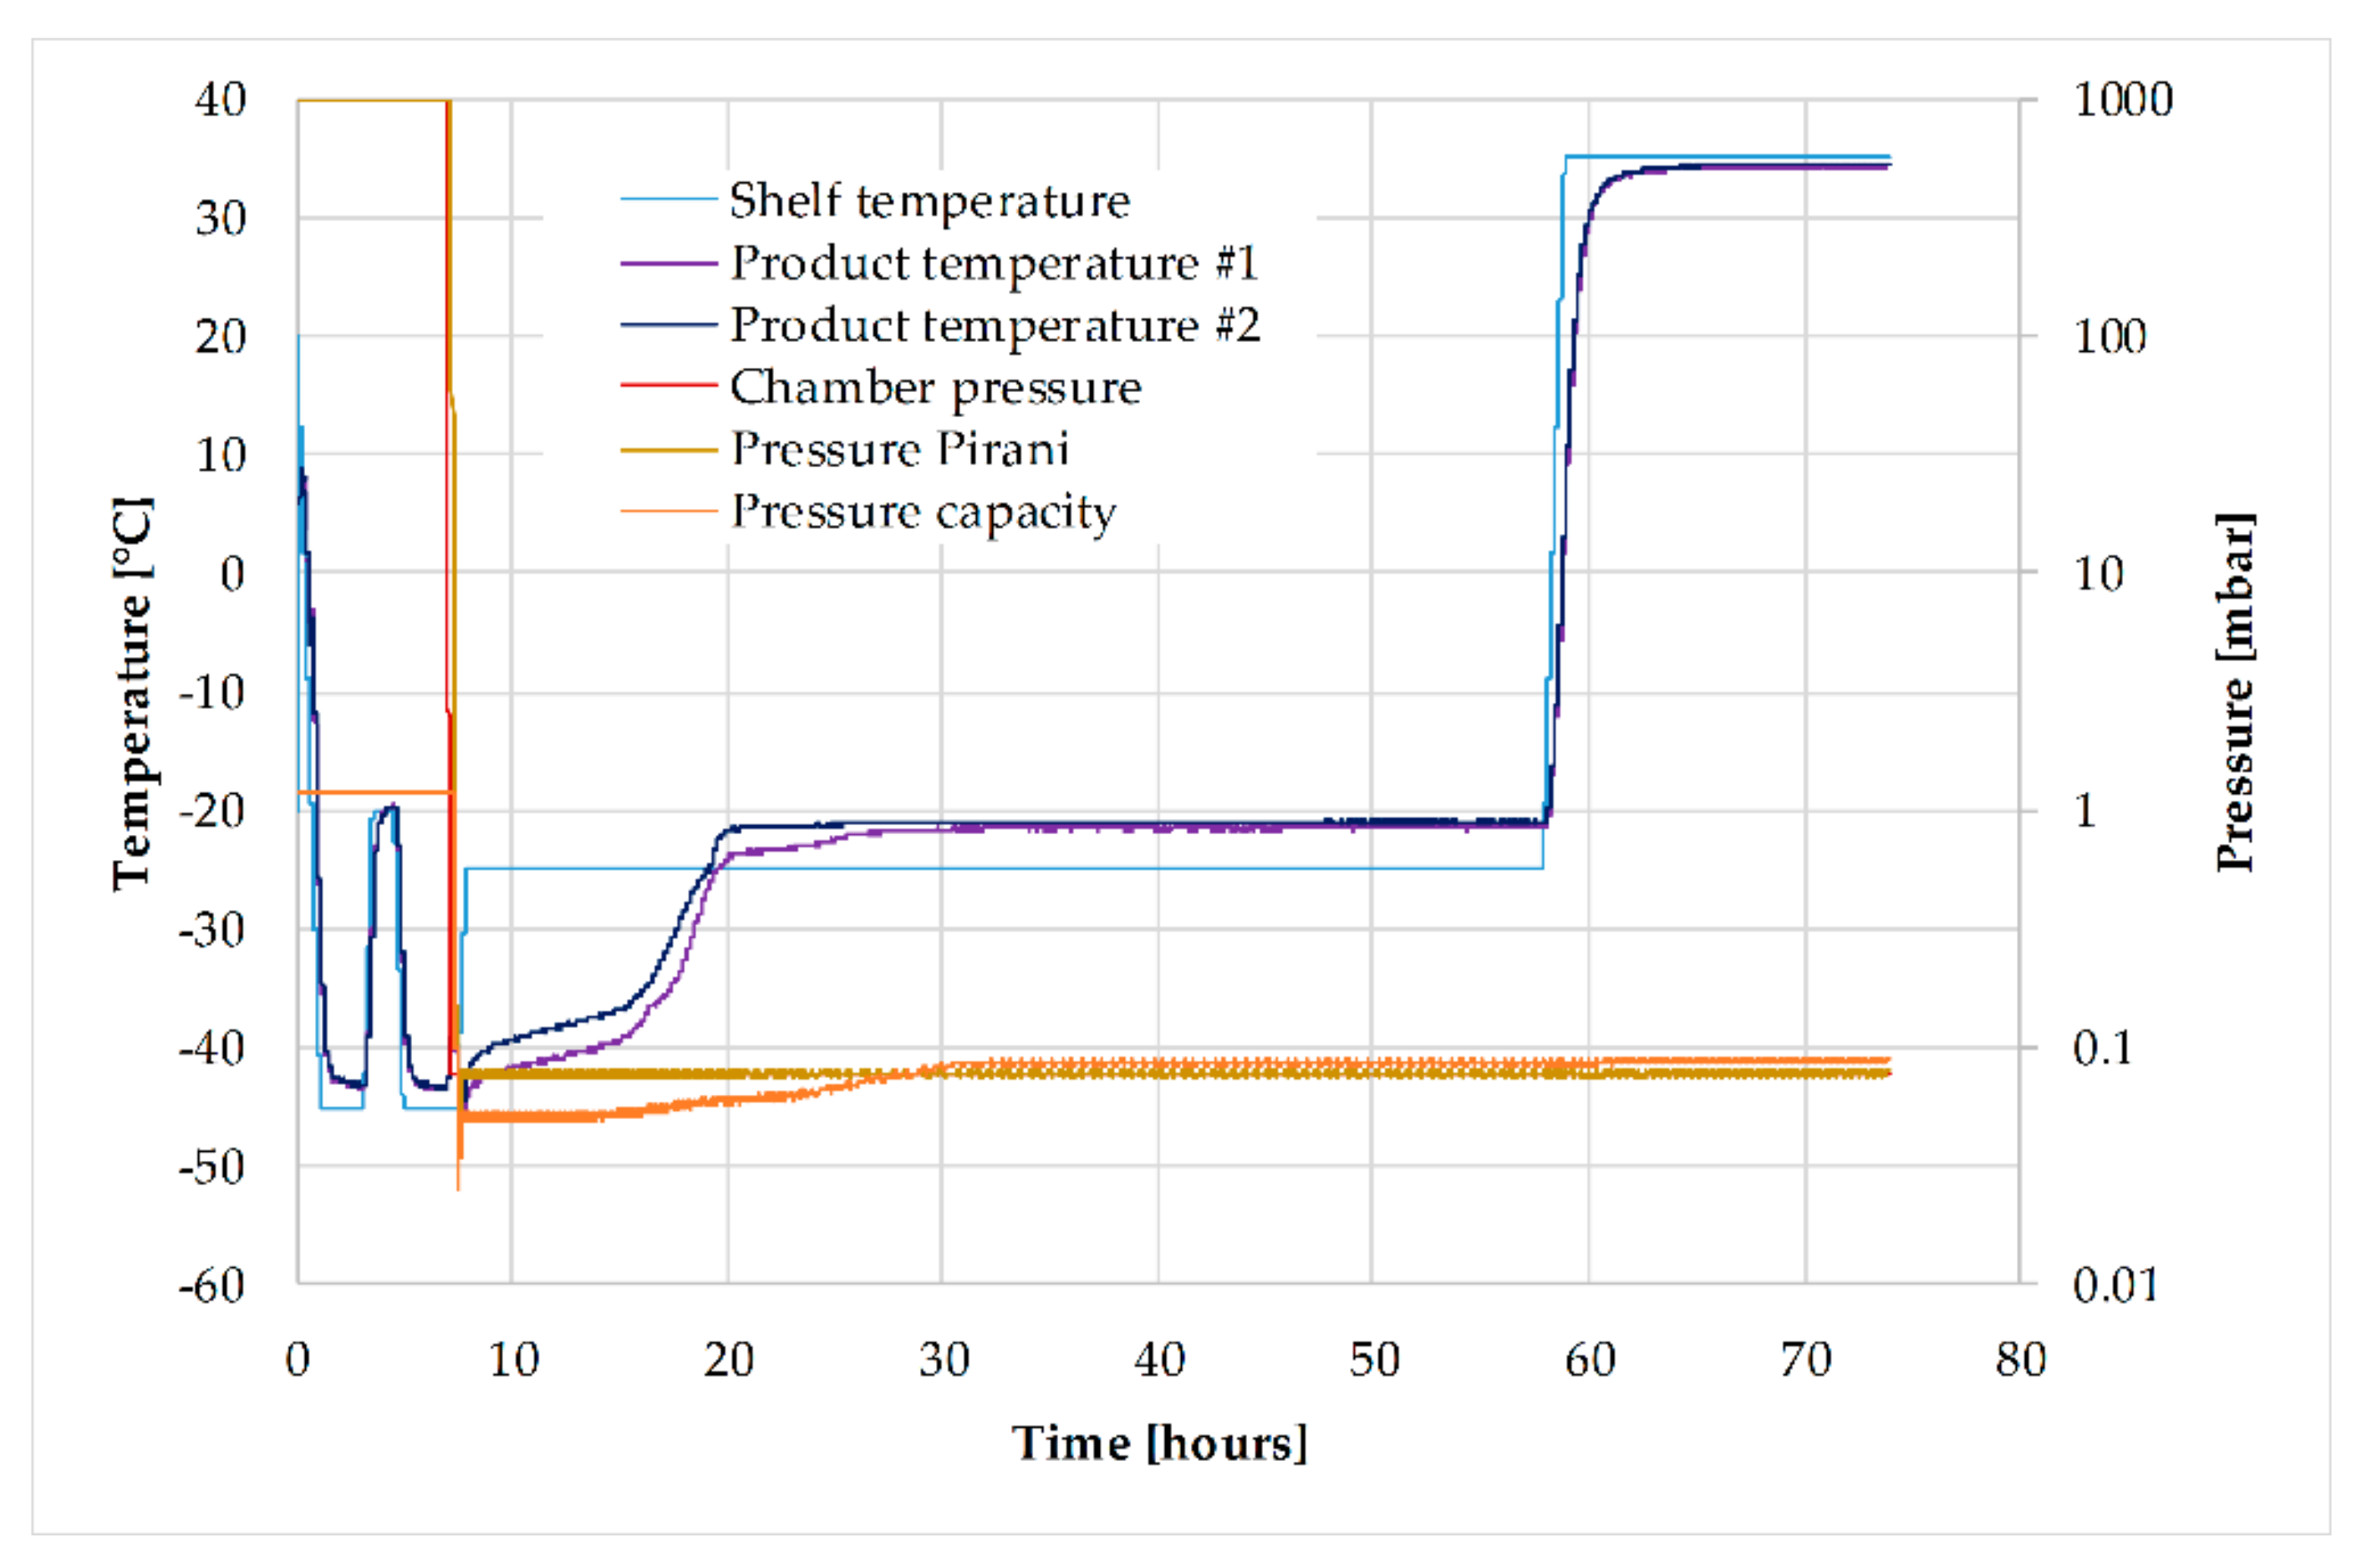
3.6. Lyophilization
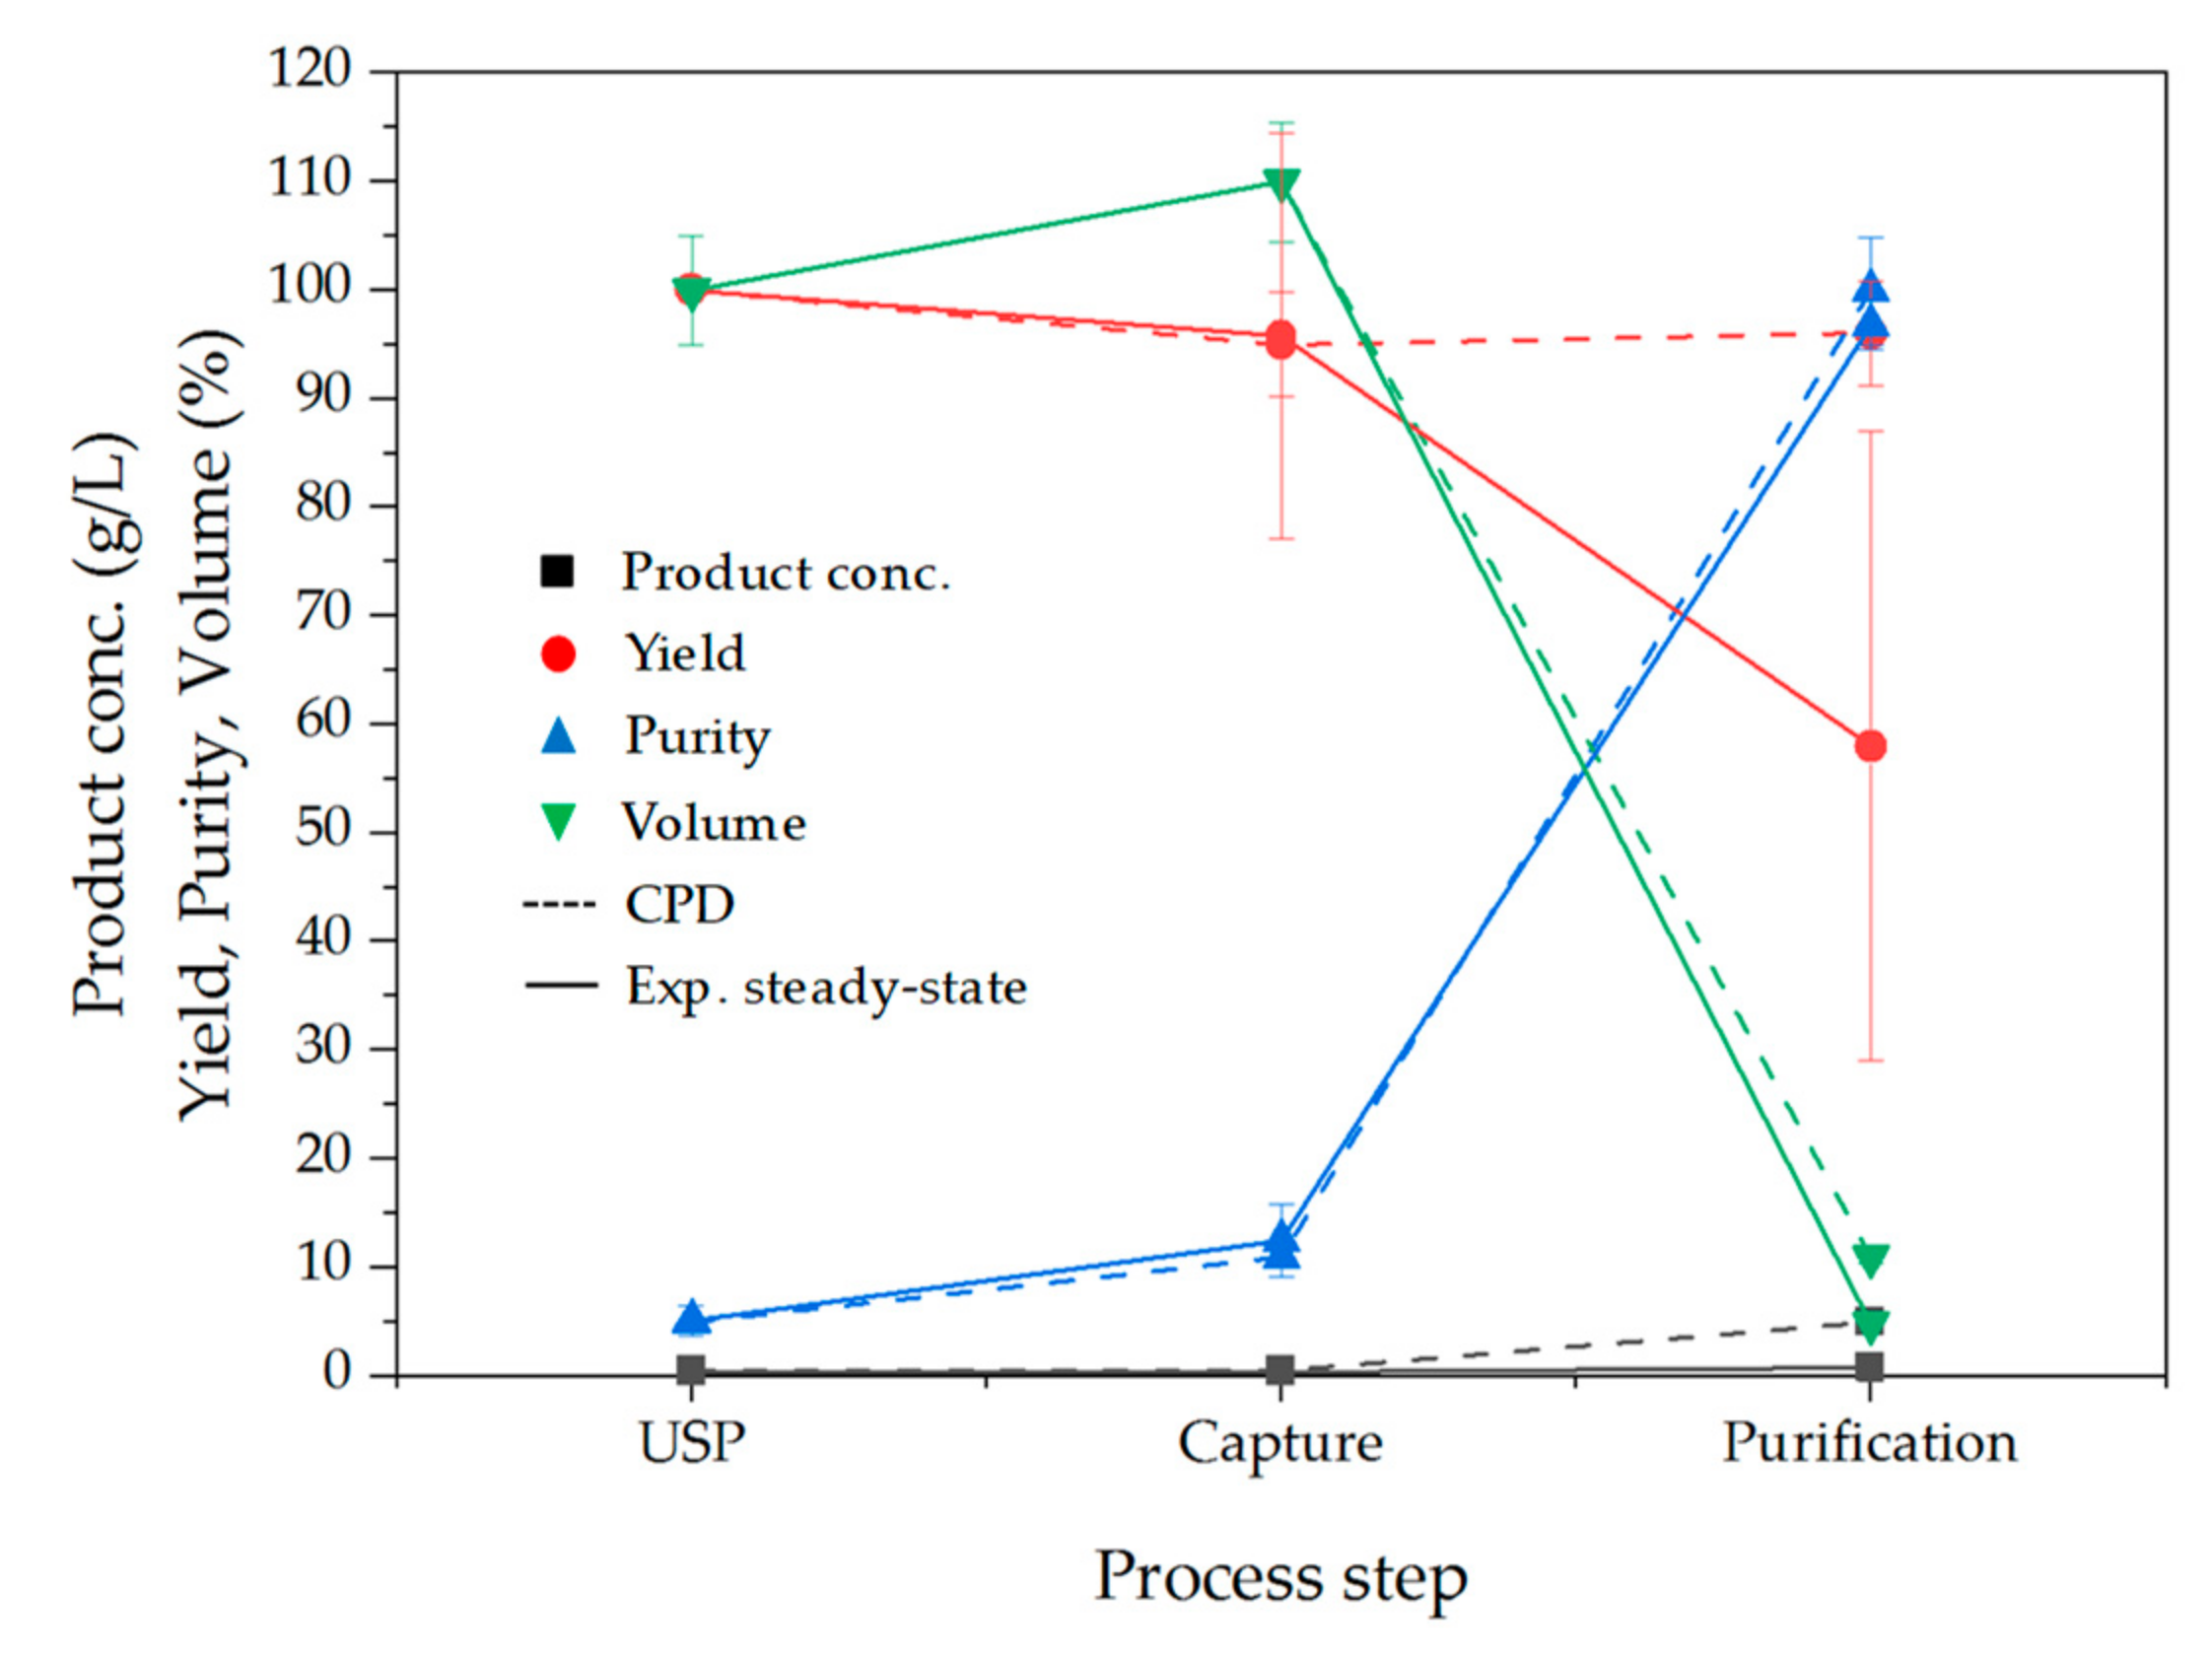
3.7. Comparison between Conceptual Process Design and Experimental Data
4. Conclusions
Author Contributions
Funding
Acknowledgments
Conflicts of Interest
References
- Kornecki, M.; Schmidt, A.; Strube, J. Pat as Key-Enabling Technology for Qbd in Pharmaceutical Manufacturing—A Conceptual Review on Upstream and Downstream Processing. Chem. Today 2018, 36, 44–48. [Google Scholar]
- EvaluatePharma. World Preview 2018 Outlook to 2024; Evaluate Ltd.: London, UK, 2018; pp. 1–47. [Google Scholar]
- Sommerfeld, S.; Strube, J. Challenges in biotechnology production—Generic processes and process optimization for monoclonal antibodies. Chem. Eng. Process. Process Intensif. 2005, 44, 1123–1137. [Google Scholar] [CrossRef]
- Gronemeyer, P.; Ditz, R.; Strube, J. Trends in Upstream and Downstream Process Development for Antibody Manufacturing. Bioengineering 2014, 1, 188–212. [Google Scholar] [CrossRef] [PubMed]
- Kelley, B. Very large scale monoclonal antibody purification: The case for conventional unit operations. Biotechnol. Prog. 2007, 23, 995–1008. [Google Scholar] [CrossRef] [PubMed]
- Strube, J.; Ditz, R.; Kornecki, M.; Huter, M.; Schmidt, A.; Thiess, H.; Zobel-Roos, S. Process intensification in biologics manufacturing. Chem. Eng. Process. Process Intensif. 2018, 133, 278–293. [Google Scholar] [CrossRef]
- Strube, J.; Grote, F.; Ditz, R. Bioprocess Design and Production Technology for the Future. In Biopharmaceutical Production Technology; Wiley-VCH Verlag GmbH & Co. KGaA: Weinheim, Germany, 2012; pp. 657–705. ISBN 9783527653096. [Google Scholar]
- Singh, N.; Arunkumar, A.; Chollangi, S.; Tan, Z.G.; Borys, M.; Li, Z.J. Clarification technologies for monoclonal antibody manufacturing processes: Current state and future perspectives. Biotechnol. Bioeng. 2016, 113, 698–716. [Google Scholar] [CrossRef]
- Jain, E.; Kumar, A. Upstream processes in antibody production: Evaluation of critical parage healthcameters. Biotechnol. Adv. 2008, 26, 46–72. [Google Scholar] [CrossRef]
- Pollock, J.; Ho, S.V.; Farid, S.S. Fed-batch and perfusion culture processes: Economic, environmental, and operational feasibility under uncertainty. Biotechnol. Bioeng. 2013, 110, 206–219. [Google Scholar] [CrossRef]
- Birch, J.R.; Racher, A.J. Antibody production. Adv. Drug Deliv. Rev. 2006, 58, 671–685. [Google Scholar] [CrossRef]
- Al-Rubeai, M. Animal Cell Culture; Springer International Publishing: Cham, Switzerland, 2015; ISBN 978-3-319-10319-8. [Google Scholar]
- GE Healthcare. Strategies for Protein Purification Handbook; GE Healthcare LS: Uppsala, Sweden, 2010. [Google Scholar]
- Continuous Biomanufacturing-Innovative Technologies and Methods; Subramanian, G., Ed.; Wiley-VCH Verlag GmbH & Co. KGaA: Weinheim, Germany, 2017; ISBN 9783527699902. [Google Scholar]
- Biopharmaceutical Production Technology; Subramanian, G., Ed.; Wiley-VCH Verlag GmbH & Co. KGaA: Weinheim, Germany, 2012; ISBN 9783527653096. [Google Scholar]
- Bioseparation and Bioprocessing, 2nd ed.; Subramanian, G., Ed.; Wiley-VCH: Weinheim, Germany, 2007. [Google Scholar]
- Rita Costa, A.; Elisa Rodrigues, M.; Henriques, M.; Azeredo, J.; Oliveira, R. Guidelines to cell engineering for monoclonal antibody production. Eur. J. Pharm. Biopharm. 2010, 74, 127–138. [Google Scholar] [CrossRef]
- Gstraunthaler, G.; Lindl, T. Zell-und Gewebekultur. Allgemeine Grundlagen und Spezielle Anwendungen, 7th ed.; Springer: Berlin/Heidelberg, Germany, 2013; ISBN 9783642331121. [Google Scholar]
- Gronemeyer, P.; Ditz, R.; Strube, J. Implementation of aqueous two-phase extraction combined with precipitation in a monoclonal antibody manufacturing process. Chim. Oggi Chem. Today 2016, 34, 66–70. [Google Scholar]
- Gronemeyer, P.; Schmidt, A.; Zobel, S.; Strube, J. Efficient Manufacturing of Biologics. Chem. Ing. Tech. 2016, 88, 1329. [Google Scholar] [CrossRef]
- Gronemeyer, P.; Thiess, H.; Zobel-Roos, S.; Ditz, R.; Strube, J. Integration of Upstream and Downstream in Continuous Biomanufacturing. In Continuous Biomanufacturing—Innovative Technologies and Methods; Subramanian, G., Ed.; Wiley-VCH Verlag GmbH & Co. KGaA: Weinheim, Germany, 2017; pp. 481–510. ISBN 9783527699902. [Google Scholar]
- Jungbauer, A. Continuous downstream processing of biopharmaceuticals. Trends Biotechnol. 2013, 31, 479–492. [Google Scholar] [CrossRef] [PubMed]
- Karst, D.J.; Steinebach, F.; Soos, M.; Morbidelli, M. Process performance and product quality in an integrated continuous antibody production process. Biotechnol. Bioeng. 2016, 114, 298–307. [Google Scholar] [CrossRef] [PubMed]
- Konstantinov, K.B.; Cooney, C.L. White Paper on Continuous Bioprocessing May 20–21 2014 Continuous Manufacturing Symposium. J. Pharm. Sci. 2015, 104, 813–820. [Google Scholar] [CrossRef] [PubMed]
- Karst, D.J.; Serra, E.; Villiger, T.K.; Soos, M.; Morbidelli, M. Characterization and comparison of ATF and TFF in stirred bioreactors for continuous mammalian cell culture processes. Biochem. Eng. J. 2016, 110, 17–26. [Google Scholar] [CrossRef]
- Warikoo, V.; Godawat, R.; Brower, K.; Jain, S.; Cummings, D.; Simons, E.; Johnson, T.; Walther, J.; Yu, M.; Wright, B.; et al. Integrated continuous production of recombinant therapeutic proteins. Biotechnol. Bioeng. 2012, 109, 3018–3029. [Google Scholar] [CrossRef] [PubMed]
- Zydney, A.L. Continuous downstream processing for high value biological products: A Review. Biotechnol. Bioeng. 2016, 113, 465–475. [Google Scholar] [CrossRef] [PubMed]
- Hernandez, R. Continuous Manufacturing: A Changing Processing Paradigm. BioPharm Int. 2015, 28, 20–27. [Google Scholar]
- Montgomery, A.; Scott, C.; Center, A. Continuous Chromatography. Experts Weigh in on the Possibilities and the Reality; BioProcess International: Boston, MA, USA, 2019. [Google Scholar]
- Thiess, H.; Zobel-Roos, S.; Gronemeyer, P.; Ditz, R.; Strube, J. Engineering Challenges of Continuous Biomanufacturing Processes (CBP). In Continuous Biomanufacturing-Innovative Technologies and Methods; Subramanian, G., Ed.; Wiley-VCH Verlag GmbH & Co. KGaA: Weinheim, Germany, 2017; pp. 69–106. ISBN 9783527699902. [Google Scholar]
- Steinebach, F.; Ulmer, N.; Wolf, M.; Decker, L.; Schneider, V.; Walchli, R.; Karst, D.; Souquet, J.; Morbidelli, M. Design and operation of a continuous integrated monoclonal antibody production process. Biotechnol. Prog. 2017, 33, 1303–1313. [Google Scholar] [CrossRef]
- Kateja, N.; Kumar, D.; Sethi, S.; Rathore, A.S. Non-protein a purification platform for continuous processing of monoclonal antibody therapeutics. J. Chromatogr. A 2018, 1579, 60–72. [Google Scholar] [CrossRef] [PubMed]
- Whitford, W.; GE Healthcare. Continuous Biomanufacturing: 10 Reasons Sponsors Hesitate. Available online: https://www.bioprocessonline.com/doc/continuous-biomanufacturing-reason-sponsors-hesitate-0001 (accessed on 16 May 2019).
- ICH Expert Working Group. Pharmaceutical Development Q8(R2). In ICH Harmonised Tripartite Guideline; International Council for Harmonisation of Technical Requirements for Pharmaceuticals for Human Use: Geneva, Switzerland, 2009; pp. 1–28. [Google Scholar]
- ICH Expert Working Group. Specifications: Test Procedures and Acceptance Criteria for Biotechnological/Biological Products Q6b. In Ich Harmonised Tripartite Guideline; International Council for Harmonisation of Technical Requirements for Pharmaceuticals for Human Use: Geneva, Switzerland, 1999; pp. 1–20. [Google Scholar]
- FDA. Guidance for Industry. PAT—A Framework for Innovative Pharmaceutical Development, Manufacturing, and Quality Assurance. 2004. Available online: https://www.fda.gov/downloads/drugs/guidances/ucm070305.pdf (accessed on 19 February 2018).
- ICH Expert Working Group. ICH Guideline Q9 on Quality Risk Management; Step 4; International Council for Harmonisation of Technical Requirements for Pharmaceuticals for Human Use: Geneva, Switzerland, 2005; 408p. [Google Scholar]
- Uhlenbrock, L.; Sixt, M.; Strube, J. Quality-by-Design (QbD) process evaluation for phytopharmaceuticals on the example of 10-deacetylbaccatin III from yew. Resour. Effic. Technol. 2017, 3, 137–143. [Google Scholar] [CrossRef]
- Alt, N.; Zhang, T.Y.; Motchnik, P.; Taticek, R.; Quarmby, V.; Schlothauer, T.; Beck, H.; Emrich, T.; Harris, R.J. Determination of critical quality attributes for monoclonal antibodies using quality by design principles. Biologicals 2016, 44, 291–305. [Google Scholar] [CrossRef] [PubMed]
- Croughan, M.S.; Konstantinov, K.B.; Cooney, C. The future of industrial bioprocessing: Batch or continuous? Biotechnol. Bioeng. 2015, 112, 648–651. [Google Scholar] [CrossRef] [PubMed]
- Schmidt, A.; Richter, M.; Rudolph, F.; Strube, J. Integration of Aqueous Two-Phase Extraction as Cell Harvest and Capture Operation in the Manufacturing Process of Monoclonal Antibodies. Antibodies 2017, 6, 21. [Google Scholar] [CrossRef]
- Ullmann’s Encyclopedia of Industrial Chemistry; Wiley-VCH Verlag GmbH & Co. KGaA: Weinheim, Germany, 2000; ISBN 9783527306732.
- Strube, J.; Zobel-Roos, S.; Ditz, R. Process-Scale Chromatography. In Ullmann’s Encyclopedia of Industrial Chemistry; Wiley-VCH Verlag GmbH & Co. KGaA: Weinheim, Germany, 2000; pp. 1–47. ISBN 3527306730. [Google Scholar]
- Zobel-Roos, S.; Thiess, H.; Gronemeyer, P.; Ditz, R.; Strube, J. Continuous Chromatography as a Fully Integrated Process in Continuous Biomanufacturing. In Continuous Biomanufacturing-Innovative Technologies and Methods; Subramanian, G., Ed.; Wiley-VCH Verlag GmbH & Co. KGaA: Weinheim, Germany, 2017; pp. 369–392. ISBN 9783527699902. [Google Scholar]
- Sixt, M.; Uhlenbrock, L.; Strube, J. Toward a Distinct and Quantitative Validation Method for Predictive Process Modelling—On the Example of Solid-Liquid Extraction Processes of Complex Plant Extracts. Processes 2018, 6, 66. [Google Scholar] [CrossRef]
- Kornecki, M.; Strube, J. Accelerating Biologics Manufacturing by Upstream Process Modelling. Processes 2019, 7, 166. [Google Scholar] [CrossRef]
- Schmidt, A.; Strube, J. Distinct and Quantitative Validation Method for Predictive Process Modeling with Examples of Liquid-Liquid Extraction Processes of Complex Feed Mixtures. Processes 2019, 7, 298. [Google Scholar] [CrossRef]
- Huter, M.; Strube, J. Model-based Design and Process Optimization of Continuous Single Pass Tangential Flow Filtration Focusing on Continuous Bioprocessing. Processes 2019, 7, 317. [Google Scholar] [CrossRef]
- Wechselberger, P.; Seifert, A.; Herwig, C. PAT method to gather bioprocess parameters in real-time using simple input variables and first principle relationships. Chem. Eng. Sci. 2010, 65, 5734–5746. [Google Scholar] [CrossRef]
- Junker, B.H.; Wang, H.Y. Bioprocess monitoring and computer control: Key roots of the current PAT initiative. Biotechnol. Bioeng. 2006, 95, 226–261. [Google Scholar] [CrossRef] [PubMed]
- Alford, J.S. Bioprocess control: Advances and challenges. Comput. Chem. Eng. 2005, 30, 1464–1475. [Google Scholar] [CrossRef]
- Kornecki, M.; Strube, J. Process Analytical Technology for Advanced Process Control in Biologics Manufacturing with the Aid of Macroscopic Kinetic Modeling. Bioengineering 2018, 5, 25. [Google Scholar] [CrossRef] [PubMed]
- Zobel-Roos, S.; Mouellef, M.; Siemers, C.; Strube, J. Process Analytical Approach towards Quality Controlled Process Automation for the Downstream of Protein Mixtures by Inline Concentration Measurements Based on Ultraviolet/Visible Light (UV/VIS) Spectral Analysis. Antibodies 2017, 6, 24. [Google Scholar] [CrossRef]
- Kornecki, M.; Mestmäcker, F.; Zobel-Roos, S.; Heikaus de Figueiredo, L.; Schlüter, H.; Strube, J. Host Cell Proteins in Biologics Manufacturing: The Good, the Bad, and the Ugly. Antibodies 2017, 6, 13. [Google Scholar] [CrossRef]
- Lewis, L.M.; Johnson, R.E.; Oldroyd, M.E.; Ahmed, S.S.; Joseph, L.; Saracovan, I.; Sinha, S. Characterizing the Freeze–Drying Behavior of Model Protein Formulations. AAPS PharmSciTech 2010, 11, 1580–1590. [Google Scholar] [CrossRef]
- Zobel, S.; Helling, C.; Ditz, R.; Strube, J. Design and operation of continuous countercurrent chromatography in biotechnological production. Ind. Eng. Chem. Res. 2014, 53, 9169–9185. [Google Scholar] [CrossRef]
- Zobel-Roos, S.; Stein, D.; Strube, J. Evaluation of Continuous Membrane Chromatography Concepts with an Enhanced Process Simulation Approach. Antibodies 2018, 7, 13. [Google Scholar] [CrossRef]
- Zobel-Roos, S.; Schmidt, A.; Mestmäcker, F.; Mouellef, M.; Huter, M.; Uhlenbrock, L.; Kornecki, M.; Lohmann, L.; Ditz, R.; Strube, J. Accelerating Biologics Manufacturing by Modeling or: Is Approval under the QbD and PAT Approaches Demanded by Authorities Acceptable without a Digital-Twin? Processes 2019, 7, 94. [Google Scholar] [CrossRef]


| Cultivation | ATPE | Diafiltration | Chromatography | Lyophilization |
|---|---|---|---|---|
| Dimensions | ||||
| 2 L working volume | 175 mL hold-up DN35 | 30 kDa 200 cm2 | 10 cm height 1.6 cm diameter | 2025 cm2 shelf area |
| 1.85 h/d | Hydrosart® | Toyopearl SP-650 (s) | 6R vials (1 mL) | |
| 54 mm stirrer | TSKgel® phenyl-5PW | |||
| Process Parameters | ||||
| 36.8 °C 433 rpm pH 7.1 5% CO2 60% pO2 200 cm3/min air 4800 FAU | 0.7 g/min feed 0.2 g/min PEG 400 1.2 g/min PO4 buffer | 2 bar feed 1 bar retentate 1.5 bar TMP | 1 mL/min loading 2 mL/min wash, elution, regeneration 3 CV gradient elution | Heating/cooling rate 1 K/min Shelf temperature 25 °C (prim. dry.) 35 °C (sec. dry.) 0.076 mbar chamber pressure |
| Phase | Freezing | Annealing | Prim. Drying | Sec. Drying | ||||||||
|---|---|---|---|---|---|---|---|---|---|---|---|---|
| Section | 1 | 2 | 3 | 4 | 5 | 6 | 7 | 8 | 9 | 10 | 11 | 12 |
| Time (hh:mm) | 00:00 | 01:10 | 02:00 | 00:25 | 01:00 | 00:25 | 02:00 | 00:10 | 00:20 | 50:00 | 01:00 | 15:00 |
| Tshelf (°C) | 25 | −45 | −45 | −20 | −20 | −45 | −45 | −45 | −25 | −25 | 35 | 35 |
| pchamber (mbar) | − | − | − | − | − | − | − | 0.076 | 0.076 | 0.076 | 0.076 | 0.076 |
© 2019 by the authors. Licensee MDPI, Basel, Switzerland. This article is an open access article distributed under the terms and conditions of the Creative Commons Attribution (CC BY) license (http://creativecommons.org/licenses/by/4.0/).
Share and Cite
Kornecki, M.; Schmidt, A.; Lohmann, L.; Huter, M.; Mestmäcker, F.; Klepzig, L.; Mouellef, M.; Zobel-Roos, S.; Strube, J. Accelerating Biomanufacturing by Modeling of Continuous Bioprocessing—Piloting Case Study of Monoclonal Antibody Manufacturing. Processes 2019, 7, 495. https://doi.org/10.3390/pr7080495
Kornecki M, Schmidt A, Lohmann L, Huter M, Mestmäcker F, Klepzig L, Mouellef M, Zobel-Roos S, Strube J. Accelerating Biomanufacturing by Modeling of Continuous Bioprocessing—Piloting Case Study of Monoclonal Antibody Manufacturing. Processes. 2019; 7(8):495. https://doi.org/10.3390/pr7080495
Chicago/Turabian StyleKornecki, Martin, Axel Schmidt, Lara Lohmann, Maximilian Huter, Fabian Mestmäcker, Leon Klepzig, Mourad Mouellef, Steffen Zobel-Roos, and Jochen Strube. 2019. "Accelerating Biomanufacturing by Modeling of Continuous Bioprocessing—Piloting Case Study of Monoclonal Antibody Manufacturing" Processes 7, no. 8: 495. https://doi.org/10.3390/pr7080495
APA StyleKornecki, M., Schmidt, A., Lohmann, L., Huter, M., Mestmäcker, F., Klepzig, L., Mouellef, M., Zobel-Roos, S., & Strube, J. (2019). Accelerating Biomanufacturing by Modeling of Continuous Bioprocessing—Piloting Case Study of Monoclonal Antibody Manufacturing. Processes, 7(8), 495. https://doi.org/10.3390/pr7080495