Article

Change of Data-Driven Drug Design Trends Through Patent Analysis

Department of Energy Resources Engineering, Inha University, Incheon 22212, Korea
*
Author to whom correspondence should be addressed.
Processes 2019, 7(8), 492; https://doi.org/10.3390/pr7080492
Submission received: 10 June 2019 / Revised: 14 July 2019 / Accepted: 23 July 2019 / Published: 1 August 2019
(This article belongs to the Section Process Control and Monitoring)

Abstract

:
The pharmaceutical industry is one of the most research and development (R&D)-intensive industries. This industry has tried many strategies to overcome the limitations of a business model that had a high return and high risk. In recent years, the fourth industrial revolution has affected many industries, causing them to update their traditional production and business strategies to a “data science-based” approach. This data science methodology, based on the largely increased size of the data environment, has actively changed the pharmaceutical industry. Therefore, this study aimed to identify specific characteristics of data science innovation in the pharmaceutical industry through the analysis of patent data from the triadic patent databases from the United States, Japan, and Europe.

1. Introduction

The pharmaceutical industry is a highly research and development (R&D)-intensive sector. Since the 1970s, R&D activity in the pharmaceutical industry has increased rapidly. In addition to the intensive use of R&D, the challenges faced in pharmaceutical R&D have increased considerably. Consequently, developments in the pharmaceutical industry have taken place as a result of the increased difficulties encountered in the pharmaceutical R&D [1,2].
Pharmaceutical companies have attempted to find novel materials that are different from incumbent and traditional materials, such as small molecules and the so-called new molecular entities (NMEs), through the use of biologics and biological entities. Changes in the type of pharmaceutical R&D companies have also taken place; more recently, small companies have increased and, from 2004, these exceeded the productivity of the R&D departments of bigger companies [2].
In the early 2000s, pharmaceutical innovation was science-based, i.e., the innovation was highly dependent on scientific researchers, their network, and the collaborations among scientists and scientific institutes [3,4,5].
In the last 10 years, rapid changes in innovation have occurred as a result of improvements in data availability and computational ability. This innovation is a part of the “fourth industrial revolution,” which combines technologies and blends advanced services based on data science [6,7,8,9,10,11,12,13,14]. In detail, data science shows many possibilities of improving productivity and adopting new business models with promising technologies, such as wireless sensor networking, big data, artificial intelligence, cloud-based services, and so forth. Data science plays a role in enabling automation, optimization of production, data-driven innovation, variety of personalized services, and so forth in various industries [12,13].
The pharmaceutical industry has also used data sciences for innovation and attempted to overcome the drawbacks of business models that require tremendous amounts of budget for innovation. Hence, pharmaceutical innovators or companies have tried to find ways to reduce R&D cost and initiate less risky business models. Pharmaceutical innovation players have attempted to apply data-driven models to assist innovation in the pharmaceutical industry and achieve a lower failure rate in the drug approval process [9]. The pharmaceutical industry could attempt to develop a new business model supplying personalized services that are less risky and less profitable by applying data science with medical health information [6,7,12,14].
The pharmaceutical industry has been adopting data science-based innovation. These changes in pharmaceutical innovation can be identified through the examination of patent activities. The authors hypothesized that the technological innovation regime differed according to period, and the patent data could reflect the changes in the technological innovation regime. Thus, this study aimed to find innovation trends in the patent information that could provide a deeper and more specific understanding of data-science-based pharmaceutical innovation.
Section 2 of this paper highlights previous studies discussing trends in innovation in the pharmaceutical industries that have moved from science-based to a data science-based innovation. Section 3 of this paper explains the empirical methodology, showing the relationship between technology classification codes and the data retrieval process. Section 4 of this paper includes the descriptive statistics of data, empirical results, and a discussion on the implications of the empirical results. In Section 5 of the paper, the authors suggest conclusive results and offer an in-depth discussion on pharmaceutical innovation trends from the patent analysis.

2. Literature Review

Innovation is the process that refers to the development and application of a new product, process, or service, as assessed by the United States (US) Office of Technology [15]. Innovation is driven by social situations, and the trends can be monitored.
The pharmaceutical industry is under immense pressure to innovate. This pressure has increased exponentially owing to the vast increase in R&D assets and scientific and engineering personnel. The pharmaceutical industry has spent enormous amounts of money on R&D since the early 1960s. The extent of R&D expenditure was approximately twice that of all other industries in the 1980s, and it had increased by approximately three times that of all other industries by the late of 1990s, despite the decrease in the approval of new drug applications (NDAs) for new molecular entities (NMEs) and non-new molecular entities (non-NME) since 1996 [1].
Given the increasing complexity in pharmaceutical innovation, companies have attempted to find new ways to survive. The production of biopharmaceuticals compounds began in 1982. Between 1980 and 2004, the number of discovery projects in small companies slightly exceeded those in large companies. This resulted in a few small companies succeeding in their discovery projects, which, in turn, led to an increase in the mergers and acquisitions (M&A) of small companies [2].
In view of the increased computing ability and genomic knowledge, pharmaceutical innovation adopted science-based innovation in the early 2000s. The changes in innovation in the pharmaceutical industry have resulted in changes in the process of innovation and, subsequently, presented new possibilities. The key requirements for the successful management of science-based innovation in the pharmaceutical industry are a new international market strategy and internationalization and collaboration strategies in the R&D management [3]. The collaboration strategy should be used at the level of the national innovation system. Korea has a national innovation system using horizontal and vertical collaboration among government-sponsored research institutes to promote innovation within the pharmaceutical industry [4,5].
Since the late 2000s, most science has been impacted by the rapid increase in availability of information. As a result of this impact, traditional methodologies are re-adopted and re-applied with the largely increased size of available data. This phenomenon is known as data science, which has rebuilt traditional science based on this largely increased size of data. Data science has induced changes in many industries, as well as in science and academia. The healthcare industry has adopted data science to provide developed, qualified, and personalized services [6,7,12]. The strength of data science is that it merges various technologies; in particular, it combines pharmaceutical technology with digital and physical technologies [8,12].
Before the emergence of data science, science-based innovation was limited by productivity and dependent on previous research [16,17,18,19]. For example, in other R&D intensive industries, such as the energy industry, upstream companies insisted on the continued production of shale gas and oil from the early to the middle 2010s [20]. However, these companies needed to develop new production technologies by using data science [21,22]. Moreover, they attempted to change their business routine by horizontally and vertically expanding their business area [23].
In case of the pharmaceutical industry, some incumbent pharmaceutical innovators have applied modeling and simulating to reduce development costs. In addition, some companies have used data to perform a qualitative risk assessment [9].
However, recently, data-driven methods have emerged to reduce the high cost of extensive experimentation through the replacement of traditional simulation-based analysis with a quality by design (QbD) system [10]. The manufacturing system can be made more productive and efficient through the adoption of data science analysis methods. In the recent years, the continuous tablet manufacturing system is one of the most notable applications of data science-driven innovation [11]. The genomic data analysis-based development of drugs is used in clinical practice to reduce the cost of gathering the three billion human DNA [24].
A data science-based approach to the medical or pharmaceutical industry starts with the generation of data (electronic medical records (EMR) and electronic health records (HER)) related to medical, health, or clinical use and the transmission and storage of the data in the medical information system. The stored data are integrated and analyzed by a comprehensive clinical research approach dealing with data regarding genes, transcripts, proteins, and metabolites, known as omics. Interestingly, the omics-based services are also provided by traditional information technology companies as well as traditional medical care company [25].
The data science-based innovation or R&D begins with the measurement of highly utilizable data suitable for data science. Recent data science environments require high-performance hardware and time, to develop data science-based analytical models. However, for analysis and measurement, it is possible to operate even if the hardware is small and has a low performance capability. With the universalization of the wireless internet and the use of cloud-based services, small devices are now able to measure, analyze, store, and manage data and results for users, through network communications without the necessity for separate storage. In addition, with the popularization of the smartphone, most people have access to high-performance computing and wireless network equipment. Thus, the development of measuring equipment in such a technological environment, can be used as a means to secure competitiveness by lowering users’ entry barriers in healthcare services. Additionally, the development of multi-purpose health care measurement equipment has the advantage of applicability across various methods of service [13,14].
Personalized pharmaceutical services have also been developed by the application of 3-dimensional printing tools. The first approval of a 3D printed drug was announced in August 2015. As 3D-printed drugs are in the early stages of innovation, additional time will be required before they are suitable for clinical and general use by the customer. However, the 3D-printed drug technology has an enormous potential for innovation [26,27].
A role for data science in the pharmaceutical industry has been suggested in various forms within the integrated value chain. It begins with the generation of patient data, followed by the application of the generated and measured patient data in the conduction of large-scale clinical trials, and, finally, the production and distribution of personally optimized drugs based on the results of clinical research. The administration of an optimized drug generates clinical trial data, and the data subsequently obtained from the dose can be further utilized as clinical research, resulting in a virtuous cycle that improves the accuracy of the optimized drug [13,14].

3. Methodology

Many previous studies have provided micro evidence for the success of data science-driven pharmaceutical innovation; however, empirical and macro evidence is lacking. Therefore, to identify the empirical evidence of multidisciplinary innovation in the pharmaceutical industry, this study applied association rules and generated a map identifying the relationship between various fields of technology [28,29]. This study used the R project (version 3.4.3) with the packages ‘arules’ and ‘arulesViz’ to calculate association rules and visualize association maps [30,31,32].

3.1. Calculation of Association Criteria

Association rules show a meaningful and associated relationship through the calculation of the conditional probability among the items [33]. In this study, an item represents an International Patent Classification (IPC) code of some patent, and a transaction represents a patent of some transaction set. A transaction set is a set of granted patents for a particular analysis period. The authors divided the analysis period into several parts by taking into consideration the features of data set and results from previous studies. Details of the criteria for division of the analysis period are described in Section 3.3.
To obtain meaningful association rules and a relationship between technologies, it is necessary to select the correct evaluation criteria. There are three well-known criteria: support, confidence, and lift [28,29,33,34].
The concept of support is based on conditional probability. Support is defined as shown in Equation (1). The i x and i y of under every equation represents an item (an IPC code).
s u p p o r t ( i x i y ) = number   of   transactions   including   both   i x   a n d   i y t o t a l   n u m b e r   o f   t r a n s a c t i o n s = P ( i x i y ) .
As the value of support of a certain transaction approaches 1, they (the items of the transaction) are considered to be more related. In other words, the greater the relative frequency is within the total transactions in a set, the closer the value is to 1.
The confidence of i x and i y can be calculated from Equation (2).
c o n f i d e n c e ( i x i y ) = number   of   transactions   including   both   i x   a n d   i y t o t a l   n u m b e r   o f   t r a n s a c t i o n s   i n c l u d i n g   i x = P ( i y | i x )
This simple Equation (2) is a conditional probability. This simple equation is useful to understand the direction of the relationship between i x and i y . The value of support, s u p p o r t ( i x i y ) is the same as s u p p o r t ( i y i x ) . The difference in a pair of supports is understood as the size and direction of causal relationship [29].
The third criterion is lift. The lift can be calculated from the Equation (3).
l i f t ( i x i y ) = c o n f i d e n c e ( i x i y ) s u p p o r t ( i y ) = P ( i y | i x ) P ( i y ) = P ( i x i y ) P ( i x ) P ( i y )
As shown in Equation (3), the lift is calculated by applying confidence and support. The lift is not a type of probability. Therefore, it can converge to infinity. The value of lift represents the relationship of a transaction. If l i f t ( i x i y ) is 1, i x and i y are independent of each other. If l i f t ( i x i y ) is bigger than 1, i x and i y have a complementary relationship to each other. If l i f t ( i x i y ) is smaller than 1, i x and i y have a substitutional relationship with each other [29].

3.2. Data

This study has retrieved a set of patent data from the KIPRIS (Korea Intellectual Property Rights Information Service) website [35]. The dataset was retrieved by search queries, including a combination of key words for three fields (title, abstract, and claim) and the technology classification codes for the IPC (International Patent Classification) field [21,36]. The search queries are summarized in Table 1.
As shown in Table 1, the queries have focused on pharmaceutical technology, including techniques related to data science. The combination of IPC codes refers to reports from KIPO (Korea Intellectual Property Office) that identify data technology IPC codes [37,38]. The retrieved data is summarized in Table 2.

3.3. Descriptive Statistics

As shown in Table 2, the total number of applications between 1975 and 2018 was 6161. The country with the highest number of applications was the United States (US), with 4375 applications; the US was also the most successful country with a 42.4% of granted ratio. The US holds the largest number of granted patents in the dataset. China made the second-highest number of applications. In contrast to the, U.S.; China has a very low granted ratio (3.5%) and applied patent count (460).
In this study, the authors used patents from the popular triadic patent family of the United States, Europe, and Japan as the analysis sample [39]. Even for this popular triadic patent family, pharmaceutical-granted patent rate was low. The granted patent rate was 27.0%; thus, even the granted patent rate for the US did not exceed 50%. To avoid presenting results that contained insignificant information, disqualified patents were excluded. Thus, this study used only granted patent data. Finally, to reflect the characteristics of recent technology, the author restricted the sampling period.
As shown in Table 3, retrieved patent data counts rapidly increased in the year 2000. In the, U.S.; 14 patents were granted in 1999 and 53 patents were granted in 2000. Japan had zero granted patents in 1999 but a granted patent count in 2000. Europe slowly started to increase the patent count as compared with the US and Japan.
As shown in Figure 1, the rapid growth of yearly granted patent counts stopped after 2007, and has fluctuated until 2015. From 2016 to 2018, granted patent counts were dramatically decreased as the patent database system did not include and reflect the patent information for the previous three years. Thus, this study uses patent data from 2000 to 2015 for empirical analysis. The total number of granted patents from 2000 to 2015 was 1994, and the number of granted patents of the triadic countries, for the same period, was 1897. From 2000 to 2007, the total number of granted patents was 842, and the number of granted patents of the triadic countries was 783. From 2008 to 2015, the total number of granted patents was 1152, and the number of granted patents of triadic countries was 1142. The number of granted patents means the number of transactions of some set.
To provide a greater confidence on the breaking point of the innovation regime change, the authors checked the granted patent ratio for the dataset.
As shown in Figure 2, dramatic changes in the cumulative granted patent ratio can be easily identified by country. Since 2000, each country has shown different behaviors in cumulative granted patent ratio. The cumulative granted patent ratio in the US has decreased significantly. This may have resulted due to the rapidly increased activities in patent application. From 1975 to 1999, the cumulative granted patent count was 30. Subsequently, the US granted 31 patents in the following years. This could signal the change in the technological regime, from the active implementation of the innovation model, to a science-based pharmaceutical innovation. Thus, the focus of innovation activities progressed to the still developing science-based pharmaceutical innovations.

4. Results and Discussion

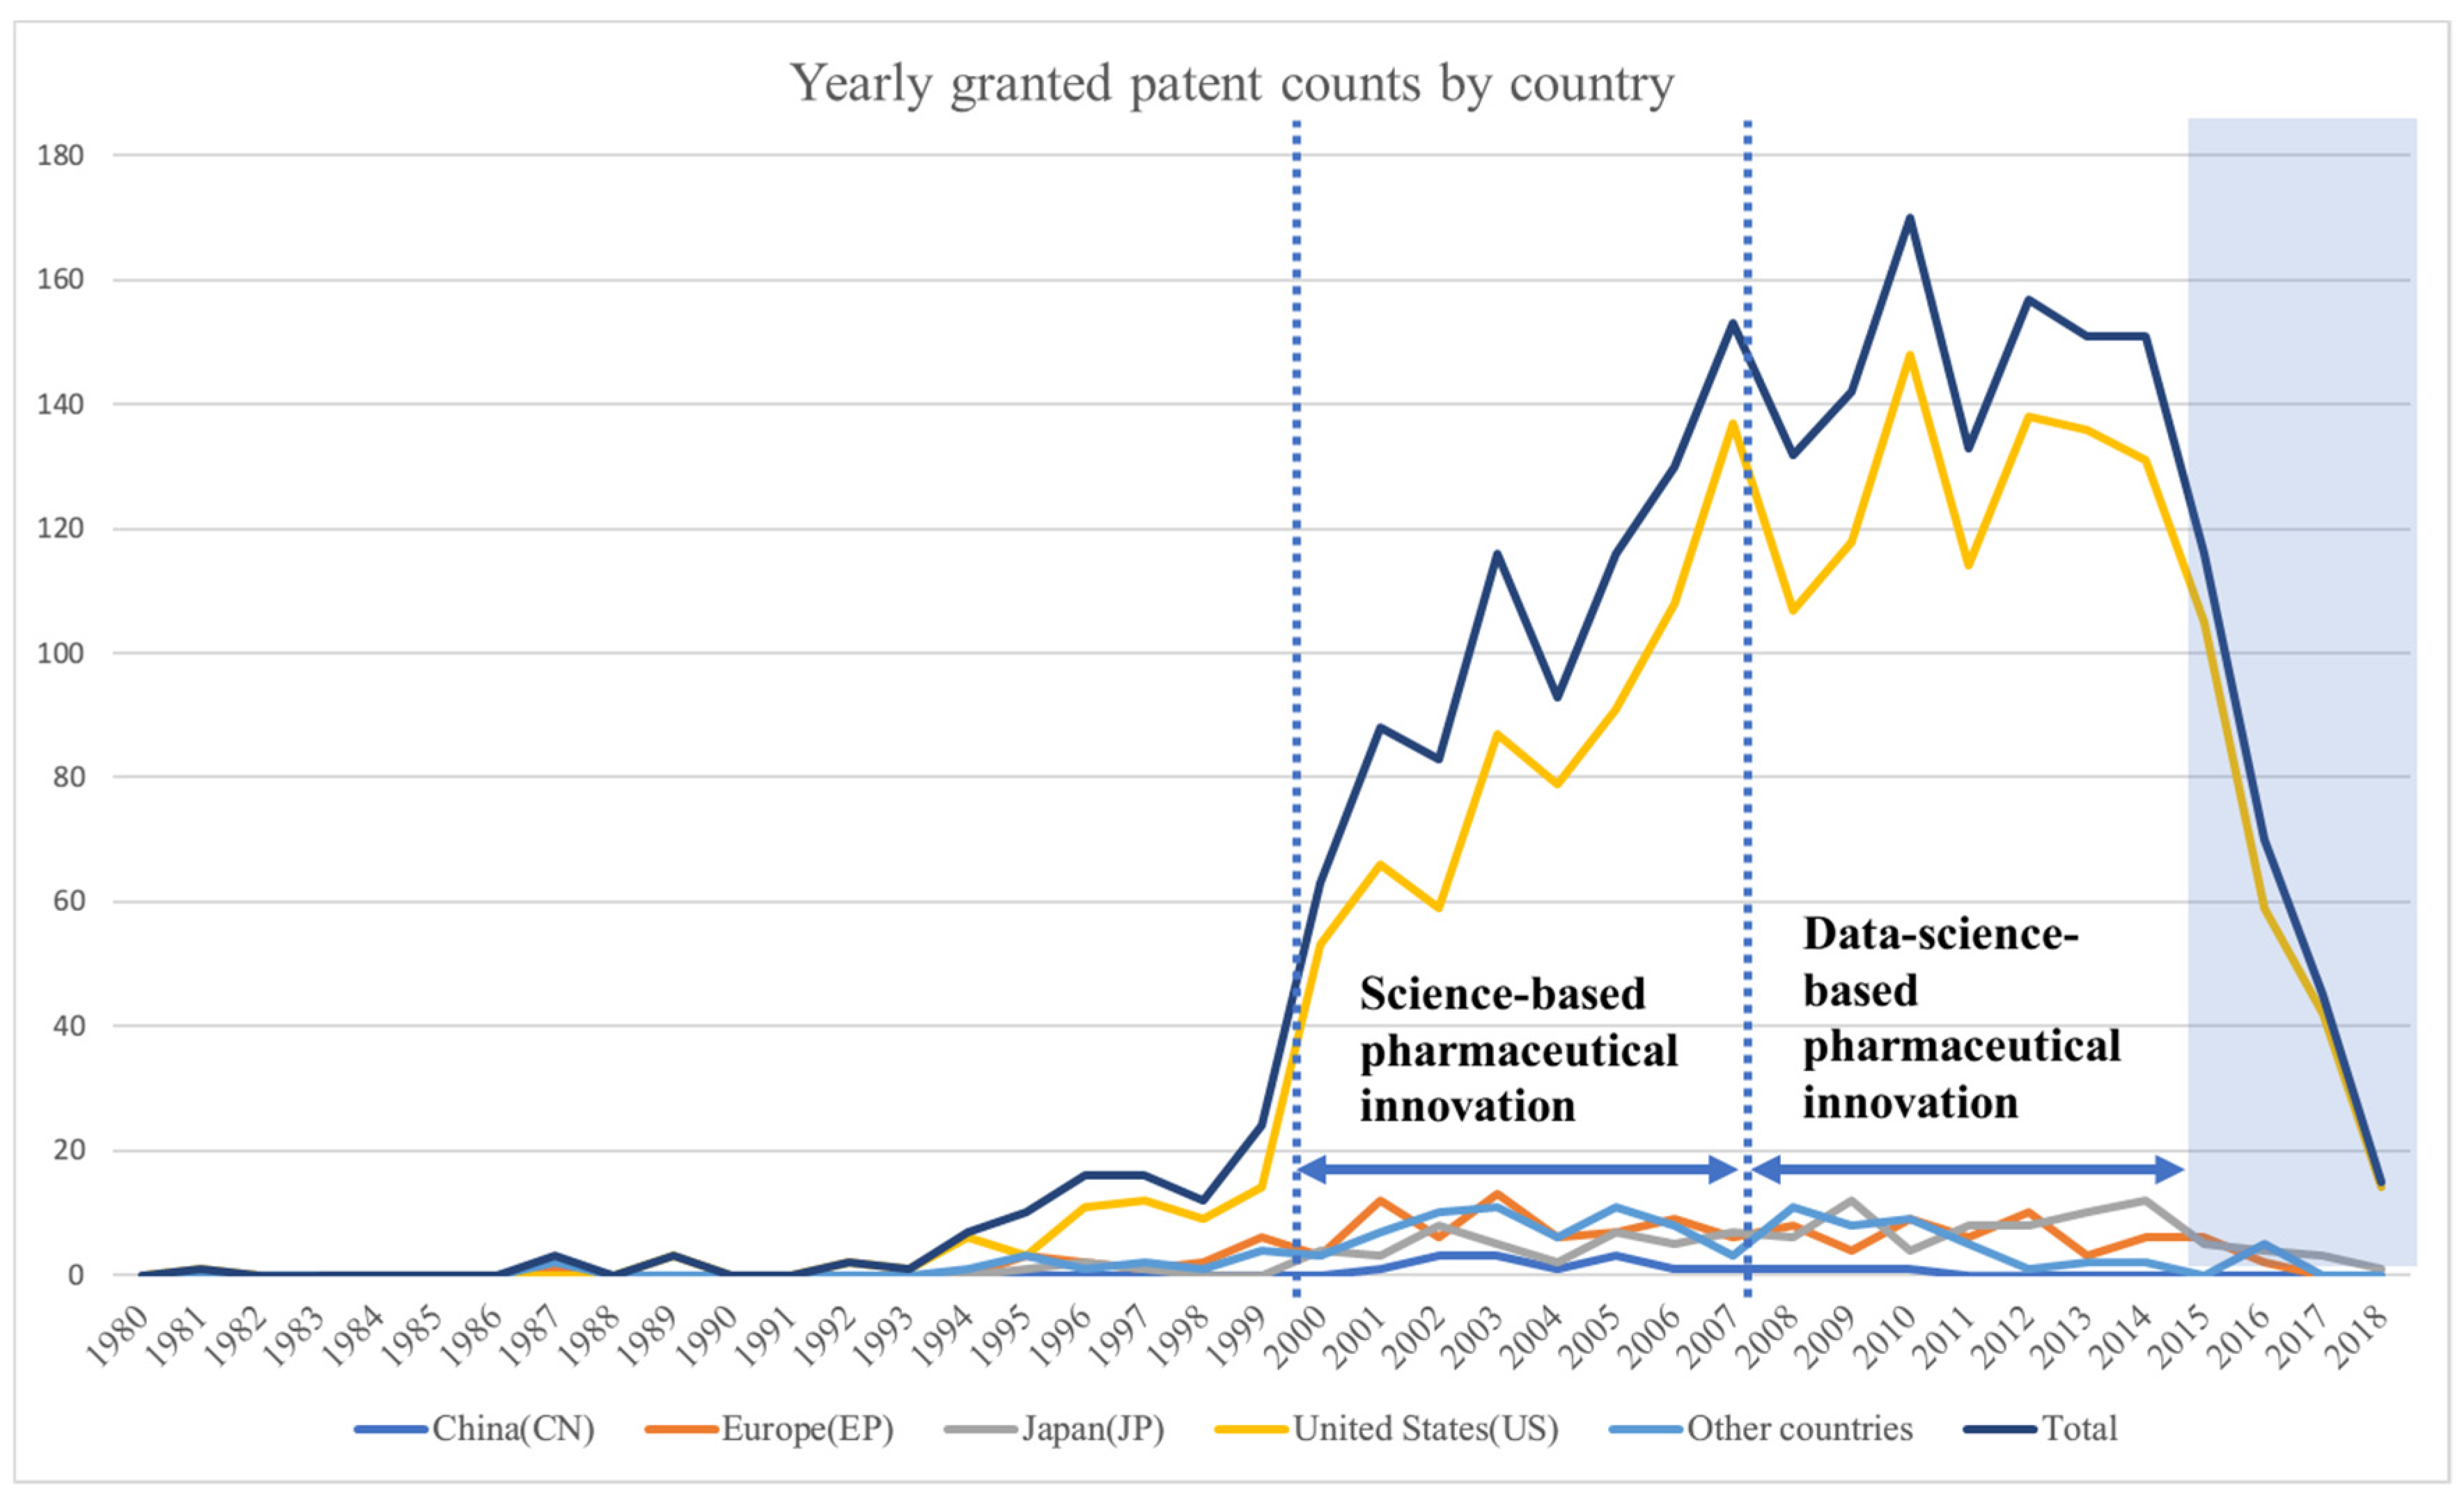
In this section, this study will present the association rules and maps representing the relationship of technologies for a specific innovation regime. The period between 2000 and 2007 was assumed to represent science-based innovation in the pharmaceutical industry. Data science-based innovation in the pharmaceutical industry has been represented by the period between 2008 and 2015. Moreover, this study has provided an in-depth discussion of the results from the perspective of the technological innovation theory.
This study set the minimum value of 0.01 for confidence and support. Therefore, the results showed only the association rules when the confidence and support exceed the minimum value.

4.1. Association Rule and Map of Science Based Pharmaceutical Technology

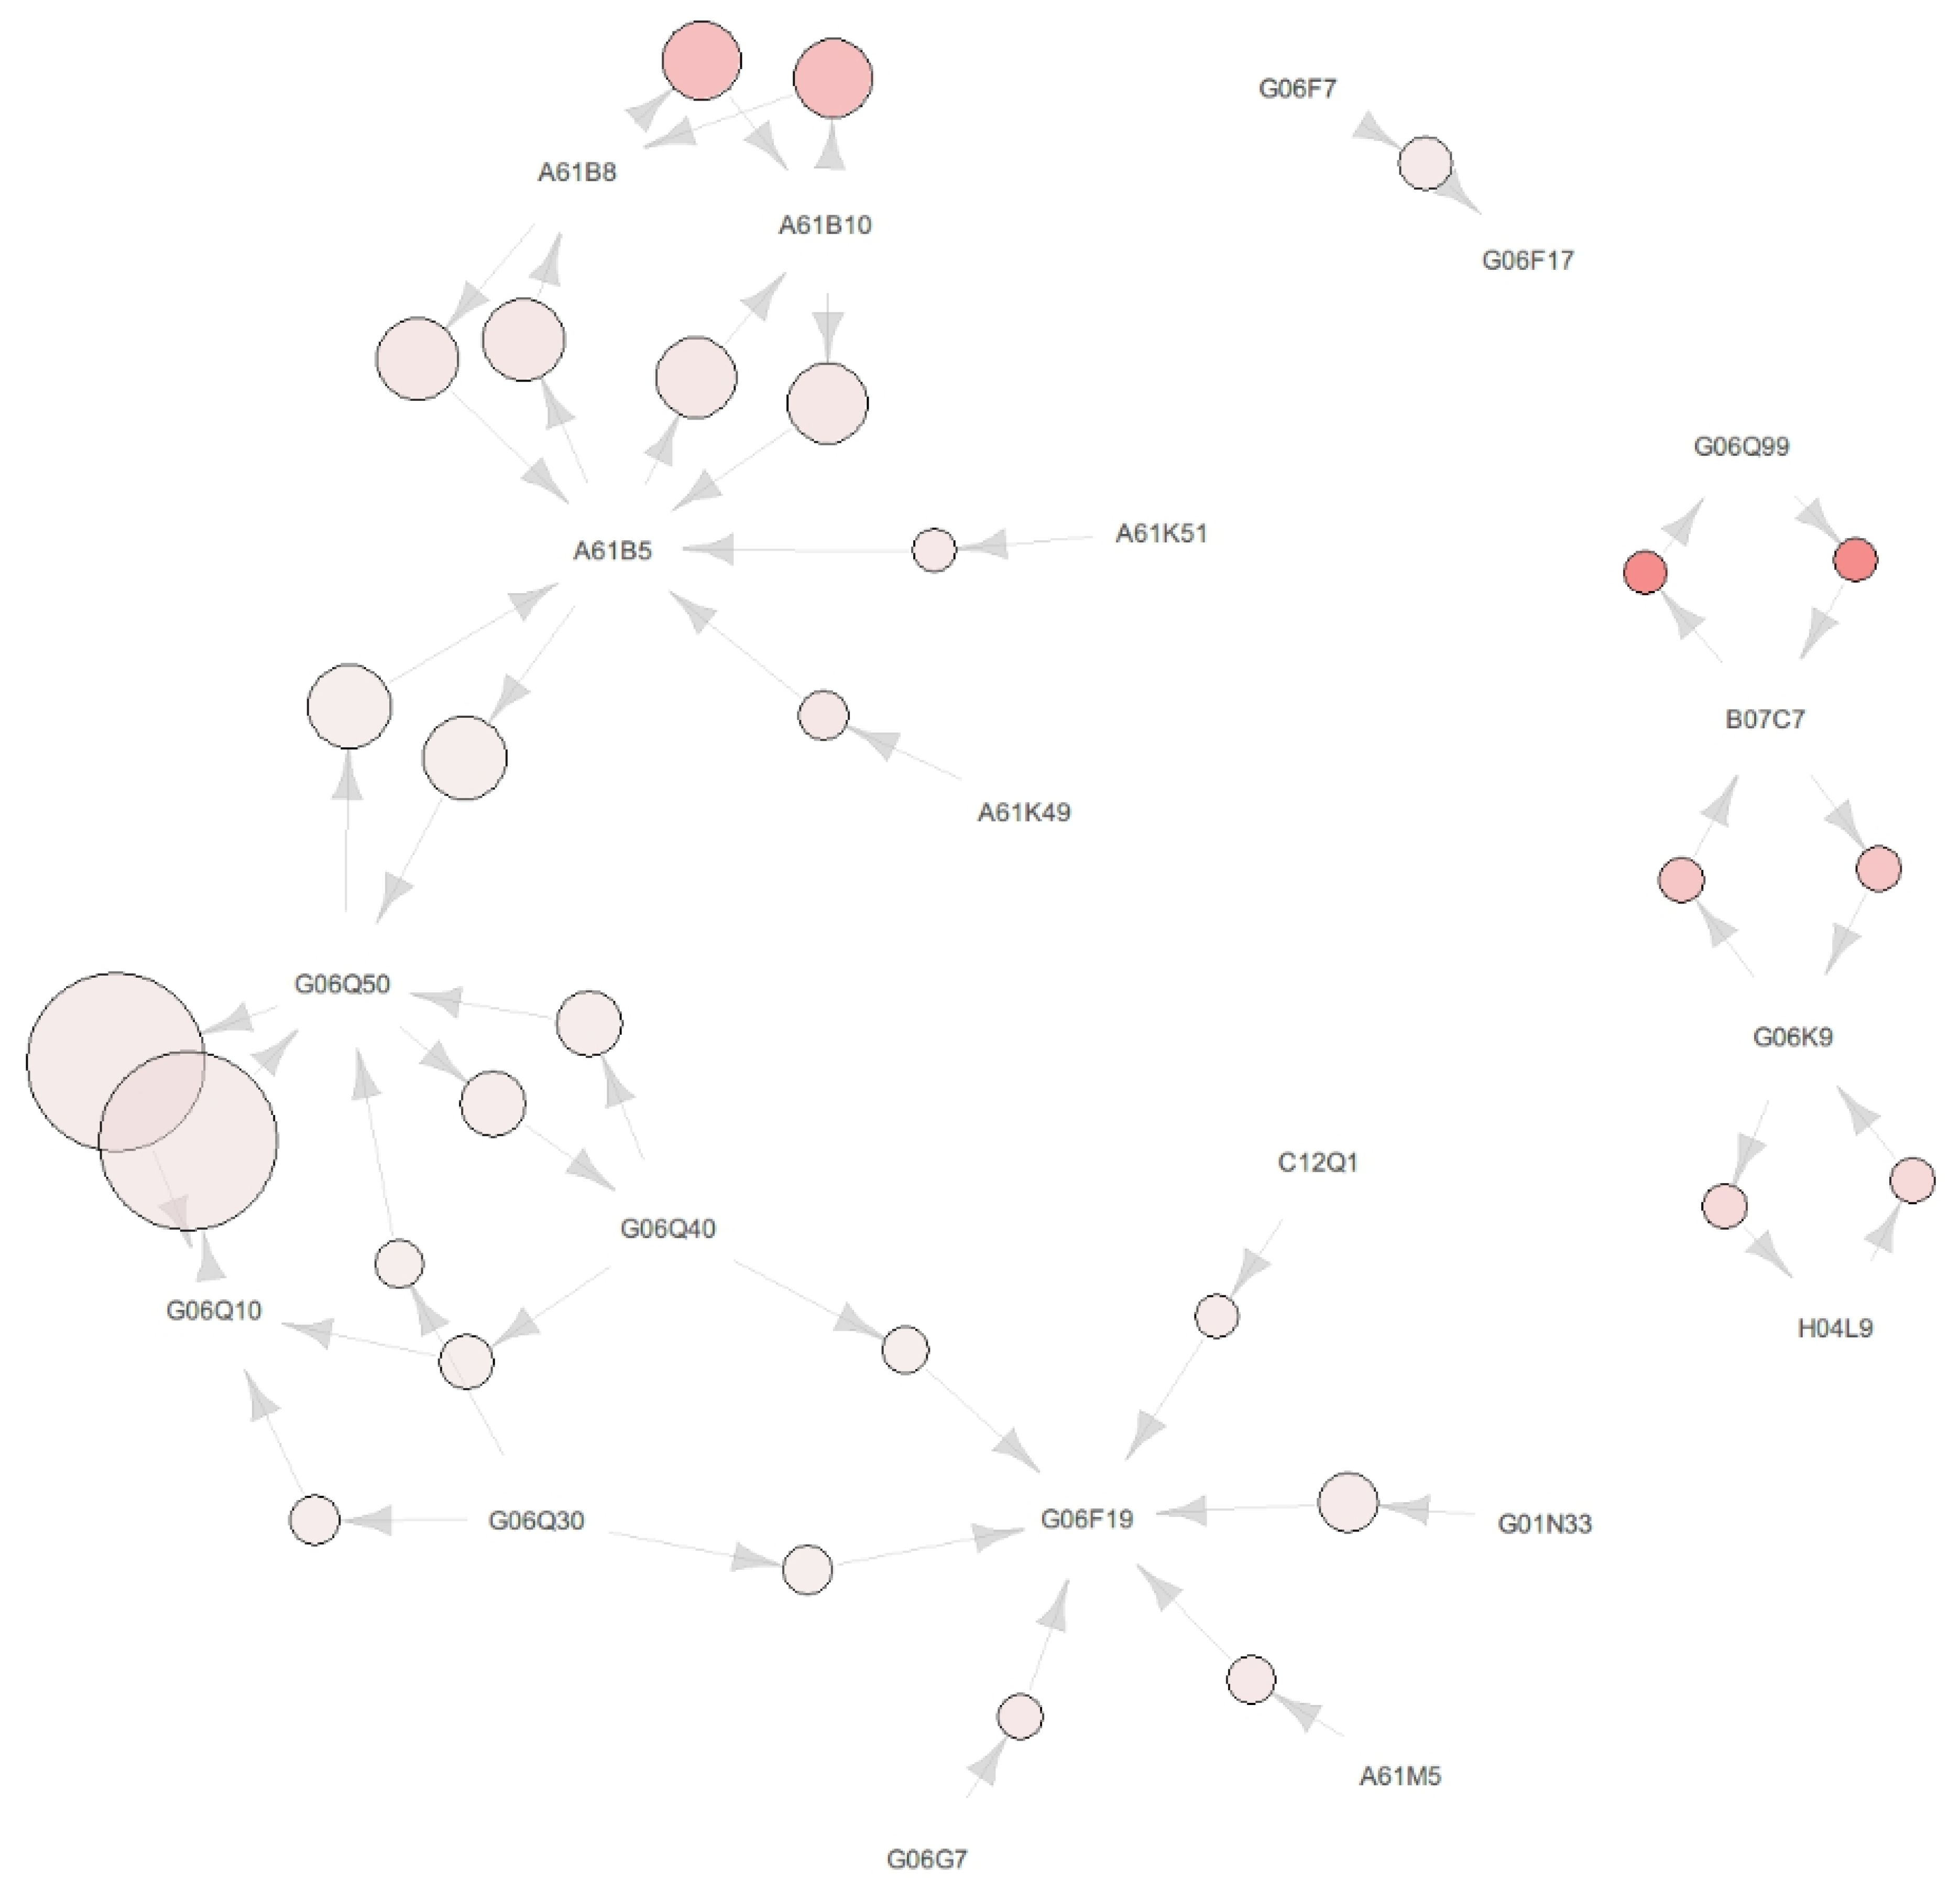
This section shows the association rules and map of the pharmaceutical patent data from 2000 to 2007. As shown in Figure 3, we found three big clusters with certain IPC codes as the centroid. The IPC codes located as the centroid were A61B5, G06Q50, and G06F19. First, Figure 3 showed some IPC codes surrounding A61B5 and the codes A61B8, A61B10, A61K49, A61K52, and G06Q50, which have a relationship with A61B5. Second, the IPC codes surrounding G06Q50, that is A61B5, G06Q10, Q06Q30, and G06Q40, which have a relationship with G06Q50, are shown in Figure 3. Third, the IPC codes surrounding G06F19, that is A61M5, C12Q1, G01N33, G06G7, G06Q30, and G06Q40, which have a relationship with G06F19, are shown in Figure 3. Detailed information of Figure 3 is shown in Table A1, Table A2 and Table A3 of Appendix A.
The IPC code located as the centroid has a relationship from some surrounding codes and a relationship towards some other surrounding codes. The feature of the centroid IPC code is that the relationship from surrounding IPC code to centroid IPC code has a higher confidence than the confidence of relationship from the centroid to the surrounding IPC code. This characteristic means that the technology corresponding to the centroid IPC code dispreads and is more commonly used when new patents or technology are invented. Furthermore, it would imply that the technology corresponding to the centroid IPC code is adopted, together with technologies corresponding to surrounding IPC code, but that the precedence of technology corresponding to the centroid IPC code would be an efficient way to invent technology and receive patents.
As another characteristic of the centroid IPC code, the centroid IPC code has a relationship with other centroid IPC codes. For example, the IPC code G06Q50 has a relationship with A61B5, and also the G06Q50 has a relationship with G06F19 through intermediate IPC codes, as shown in Figure 3. The code A61B5 has a relationship with G06Q50 and no relationship with G06F19. Actually, there is a direct relationship between the centroid IPC codes, but it is not weighty enough to be shown in Figure 3. The less weighty and directly connected relationships between the centroid IPC codes are presented in Table 4.
Table 4 shows the relationships of G06Q10 with G06F19, A61B5 with G06F19, and A61B5 with G06Q50. The feature of panel A in Table 4 is that all relationships are substitutive, because every value of lift is less than one. However, the substitutive extent was different. The relationship between A61B5 and G06Q10 was 0.903. As that was close to one, most of the last substitutive relationships were in panel A of Table 4. G06Q50 has a relationship with G06F19 and A61B5. The relationships involving G06Q50 show a lower lift value than the relationship between A61B5 and G06F19. The lift value of the relationship between G06Q50 and G06F19 is 0.693, which is the most substitutive and lowest lift value in panel A of Table 4. The lift value of the relationship between A61B5 and G06Q50 was 0.739. Interestingly, the multi-component, which is the combination of centroid IPC codes and other IPC codes, always showed a complementary relationship toward the centroid IPC codes, as shown in panel B of Table 4. This had two implications. The first is that there was a need to develop combined technology in addition to single and independent technologies. The second is that the technologies of each cluster were developed simultaneously and were then developed independently by cluster. Moreover, the relationship from the triple component to the centroid of clusters showed the highest lift value, other than the relationship of multi-component cases, as shown in panel B of Table 4.

4.2. Association Rule and Map of Data-Science Based Pharmaceutical Technology

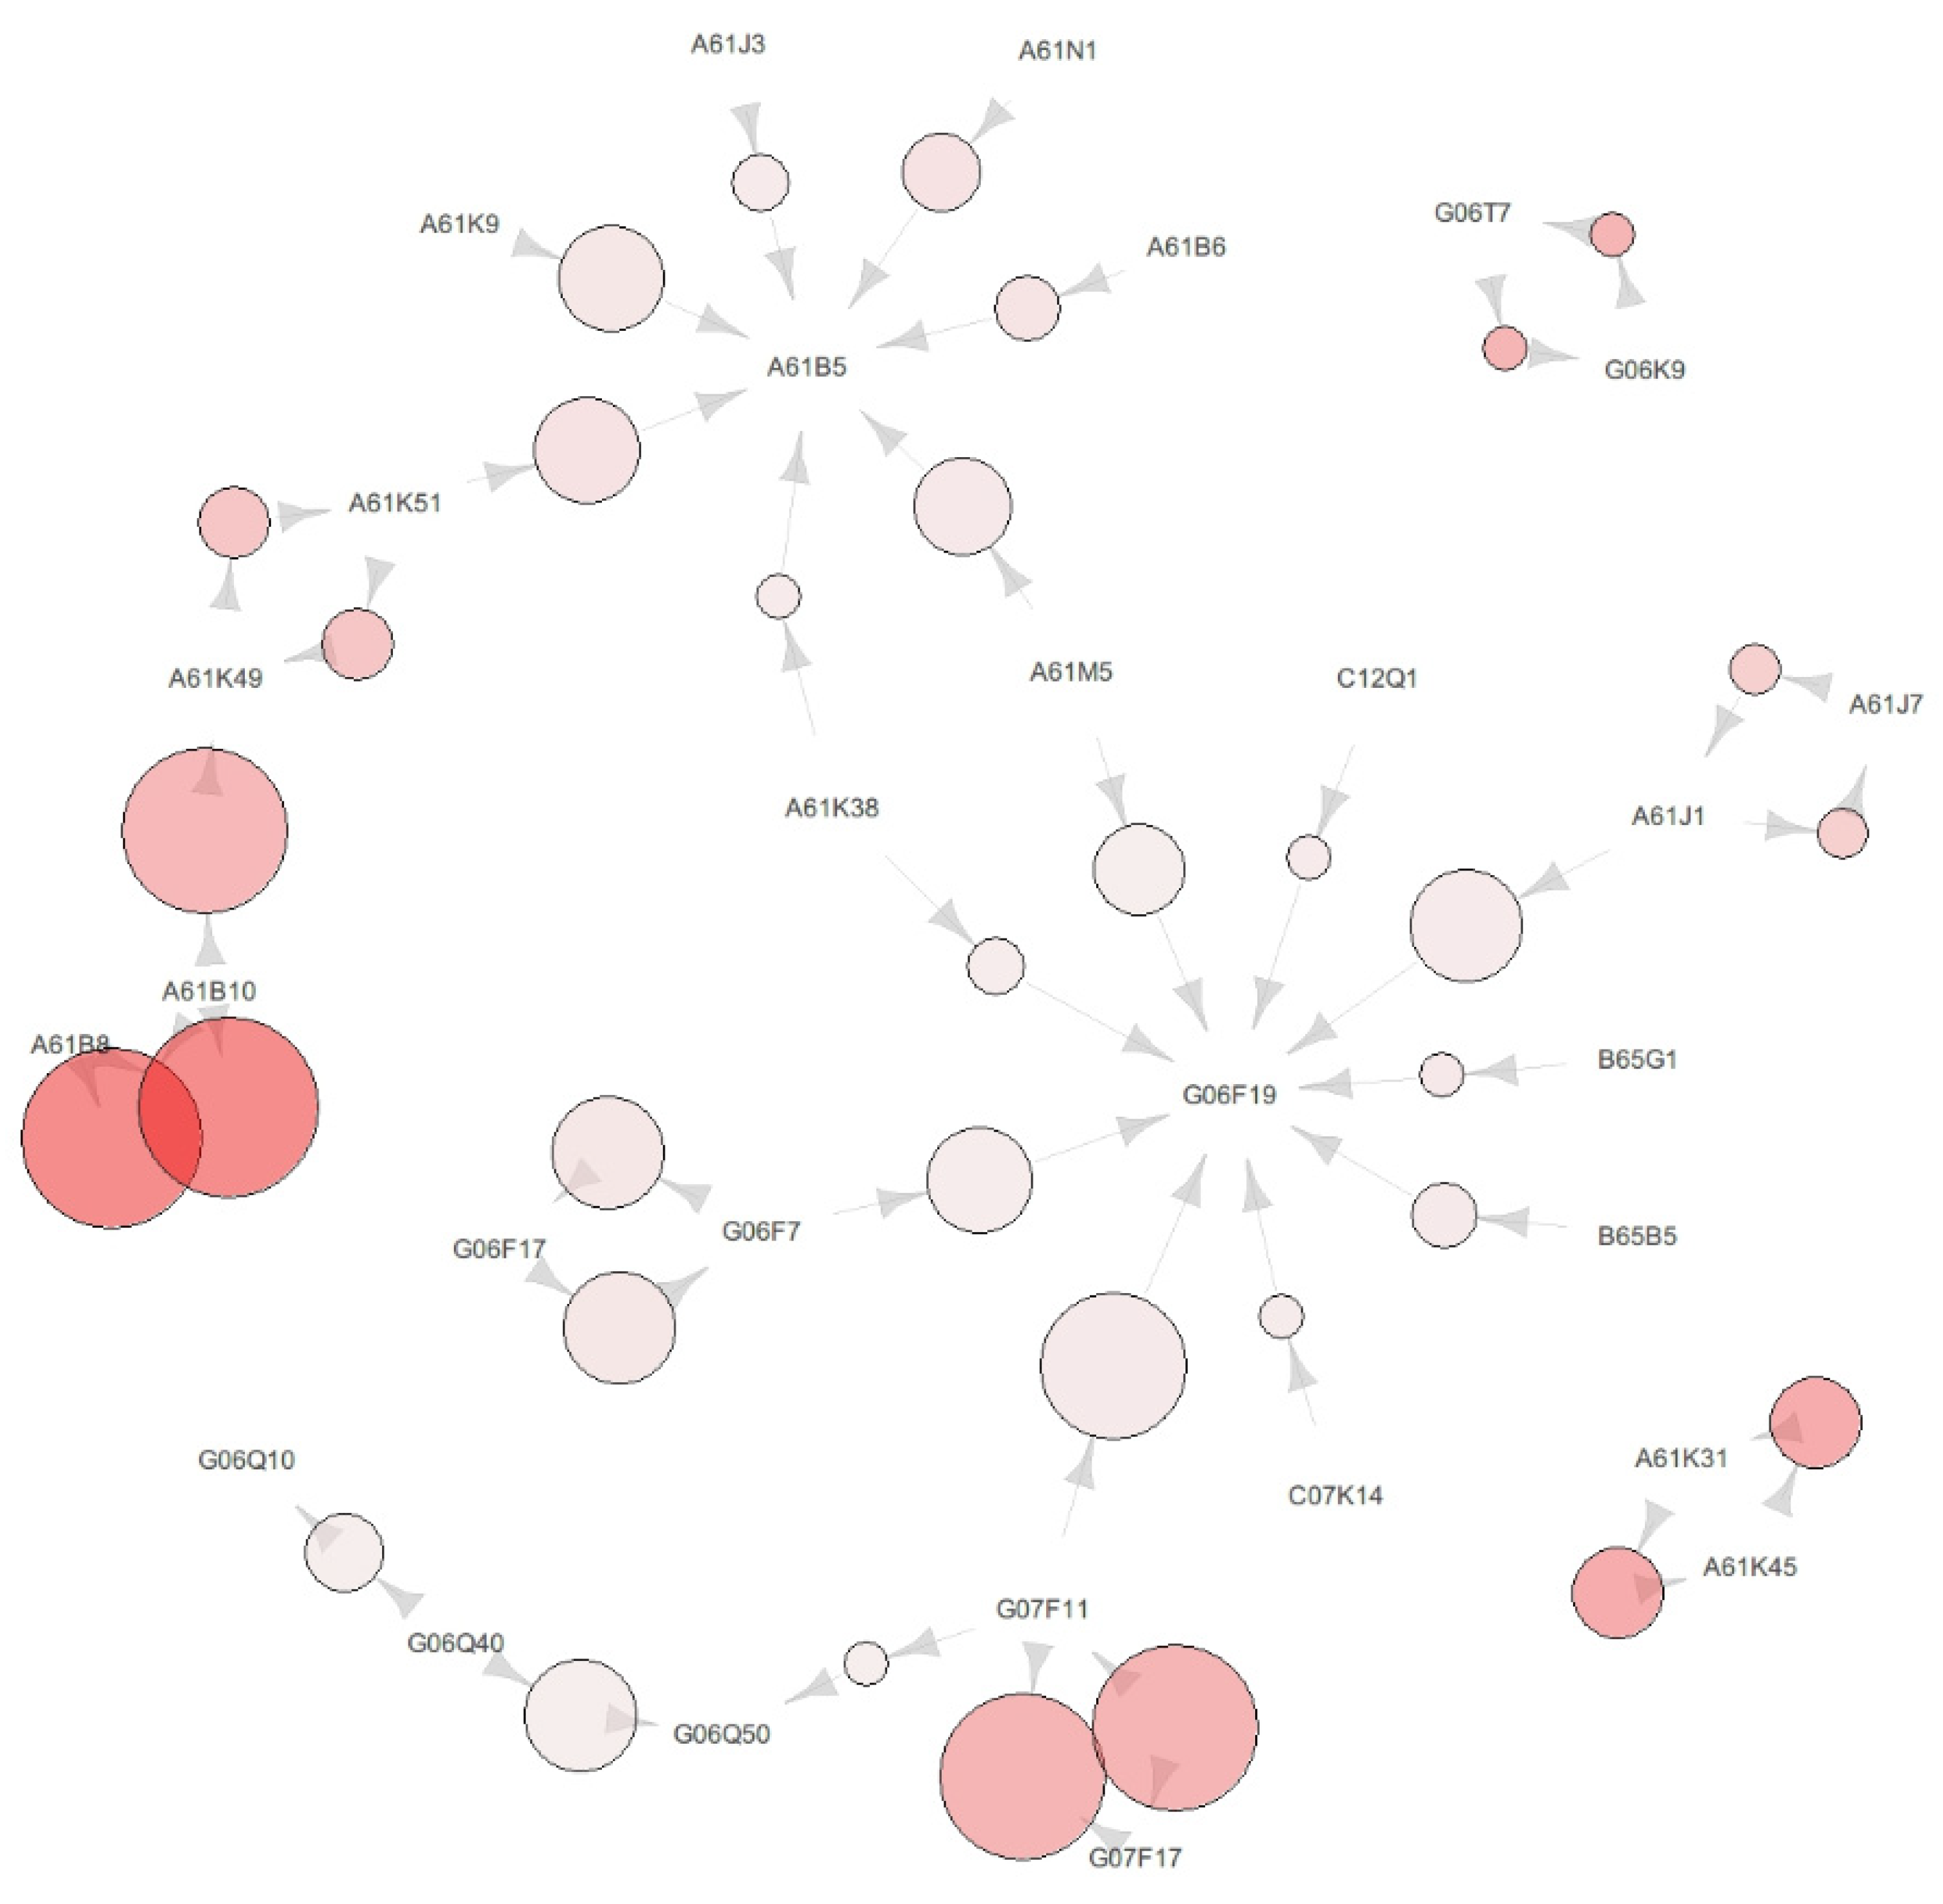
This section shows the association rules and map of pharmaceutical patent data from 2008 to 2015. There were two clusters encircled by different IPC codes, as shown in Figure 4. The IPC codes located as the centroid are A61B5 and G06F19. First, A61B5 is surrounded by A61K9, A61J3, A61N1, A61B6, A61M5, A61K38, and A61K51. Secondly, G06F19 is surrounded by C12Q1, A61J1, B65G1, B65B5, C07K14, G07F11, G06F7, A61K38, and A61M5. Detailed information of Figure 4 is shown in Table A4 and Table A5 of Appendix A.
Broadly, the IPC codes are divided into two group in Figure 4. The majority of IPC codes starting with A61 are linked with the A61B5 cluster and the majority of IPC codes starting with G06 are linked with the G06F19 cluster. In particular, there are intermediate IPC codes between A61B5 and G06F19, that is, A61K38 and A61M5.
The relationship between A61B5 and G06F19 is shown in Table 5. The relationship between centroid cluster A61B5 and G06F19 was substitutive and the lift value of the relationship was 0.549. The interesting point was that the multi-component’s relationship was different according to object IPC code. The relationship toward G06F19 was complementary, but the relationship toward A61B5 was substitutive in panel B of Table 5. Every relationship from multi-component to centroid IPC code (A61B5) was complementary except the case involving G06F19, as shown in Table A4 of Appendix A. Moreover, every relationship from the multi-component to centroid IPC code (G06F19) was complementary, as shown in Table A5 of Appendix A. This implied that there was a need to develop combined technology compared with single and independent technologies when the purpose of developing the technology was represented by G06F19. Further, it implied that technology represented by A61B5 was developed as a precedent technology for the technology represented by G06F19.
Table 6 shows the relationships between intermediate IPC codes (A61M5 and A61K38), and between A61B5 and G06F19. The lift value from A61M5 to A61B5 was 2.740, and the lift value from A61M5 to G06F19 was 1.470. The relationship from A61M5 to A61B5 was more complementary, higher than 1.270, than the relationship from A61M5 to G06F19. The lift value from A61K38 to A61B5 was 2.314, and the lift value from A61K38 to G06F19 was 1.524. The relationship from A61K38 to A61B5 was more complementary, higher than 0.79, compared to the relationship from A61K38 to G06F19. This implied that there was a need for the precedent development of technologies represented by A61M5 and A61K38.

4.3. Discussion

In this section, we will focus on the differences between the science-based period and the data science-based period to illuminate data-driven technological innovation in the pharmaceutical industry. The differences are summarized in Table 7.
First, the most remarkable difference existed in the intermediate IPC code between two periods. In the science-based innovation period, the centroid IPC codes were A61B5, G06Q50, and G06F19, and the intermediate IPC code between A61B5 and G06F19 was G06Q50. In the data science-based innovation period, the centroid IPC codes were A61B5 and G06F19, and the intermediate IPC code between A61B5 and G06F19 was A61M5 and A61K38. The most remarkable difference was that the intermediate technology changed from G06Q50 to A61K38 and A61M5.
A61M5 has no relationship with A61B5; it only has a relationship with G06F19 from 2000 to 2007. However, A61M5 has a complementary relationship with both A61B5 and G06F19. A61M5 represents “devices for bringing media into the body in a subcutaneous, intra-vascular or intramuscular way,” as shown in Table A6 of Appendix A. This implied that the technology represented by A61M5 was more necessary and was invented during the development of clinical testing in the data science-based innovation period.
A61K38 represents “medical preparations containing peptides,” as shown in Table A7 of Appendix A. The appearance of technology that used peptides in the data science-based innovation period may reflect the increase in the use of omics-based technologies [25]. In addition, we found similar cases showing directly connected and complementary relationships for digital computing (G06F19) and chemical materials (C07K14).
The direct relationship of A61B5 and G06F19 has changed. The lift value of A61B5 and G06F19 has decreased, and the difference was 0.354. This implied that the independent development of technology A61B5 and G06F19 occurred less frequently in the science-based innovation period than in the data science-based innovation period. Moreover, as described in Section 4.2, the precedence for development has been established. Thus, it may be implied that the relationship of technology has become more strict and concrete owing to the accumulation of technological development.
Differences also existed in surrounding IPC codes. A61J3 represented “devices or methods specially adapted for bringing pharmaceutical products into particular physical or administering forms.” The appearance of A61J3 may have indicated the invention for personalized drug forms, such as tablets printed by 3D printers [27]. The appearance of B65B5, representing “packaging individual articles in containers or receptacles,” and B65G1, representing “storing articles, individually or in orderly arrangement, in warehouses or magazines,” implied the occurrence of inventions for data processing technology dealing with personalized information [6,7,25] as shown in Table A7 of Appendix A.
Overall, the empirical results showed some agreement with the literature reviews. Specifically, some results indicated the invention of personalized and qualified services, and some results indicated the features of data science-based pharmaceutical characteristics in the discipline (omics). As summarized in Table 7, the suggested results and implications of data science-based pharmaceutical innovations are expected to bring about changes in the pharmaceutical industry to reduce risk and obtain medium return compared with the science-based innovation period.
We proposed an in-depth discussion about the most noteworthy IPC code ‘A61B5′ that refers to “measuring for diagnostic purposes.” The following interpretation of the observations of ‘A61B5′ were presented. Development of a measuring device may be relatively easier than the development of an analytical algorithm. Pharmaceutical companies have been competing through the development of measuring instruments. Traditional measuring equipment lacked sufficient potential to provide numerous and frequent measurements suitable for data science-based research. In addition, A61B5 may be included in patents to reflect the corresponding technical features as secondary or incidental technical components, rather than as a major component of the patent. Nevertheless, A61B5 has been included in many patents owing to the pharmacological industry’s data science-based innovation or business model generally including measurement and diagnostic technology as one of the technical features.

5. Conclusions

This paper presents an analysis of patent data distinguished by the period according to the technological innovation regime. The first period, that is science-based innovation, in which pharmaceutical innovation activity was based on simulation, focused on ways to find new NMEs, which involved high return but also high risk. During the second period, that is data science-based innovation, pharmaceutical innovation activity attempted to apply new ways to use data involving personal characteristics and information to identify services and products.
This study attempted to find macro evidence and trends in pharmaceutical innovation activity by using patent data. The empirical results characterized data science-based innovation technology and the points of accordance with the literature review. Despite these efforts to find macro trends, this study has limitations; thus, the accordance of empirical results with the literature review should be developed further to identify a more direct association.

Author Contributions

Conceptualization, J.-H.K. and Y.-G.L.; Methodology, J.-H.K. and Y.-G.L.; Software, J.-H.K.; Validation, J.-H.K. and Y.-G.L.; Formal Analysis, J.-H.K. and Y.-G.L.; Investigation, J.-H.K. and Y.-G.L.; Resources, J.-H.K. and Y.-G.L.; Data Curation, J.-H.K.; Writing—Original Draft Preparation, J.-H.K.; Writing-Review & Editing, Y.-G.L.; Visualization, J.-H.K.; Supervision, Y.-G.L.; Project Administration, Y.-G.L.; Funding Acquisition, Y.-G.L.

Funding

This study was funded by the Inha University.

Acknowledgments

We thank Inha university for funding the research.

Conflicts of Interest

The authors declare no conflict of interest.

Appendix A

Table A1. Relationships of clusters in the science-based pharmaceutical innovation period (2000–2007).
CentroidSupportConfidenceLiftRelationshipCount
FromTo
G06F19A61B50.0540.2100.903Substitutive42
G06Q100.0430.1870.804Substitutive34
G06Q500.0420.1720.739Substitutive33
A61B80.0411.0004.302Complementary32
A61B100.0401.0004.302Complementary31
A61B10, A61B80.0381.0004.302Complementary30
G06F19, G06Q100.0370.6302.712Complementary29
G06Q10, G06Q500.0340.2901.249Complementary27
G06F19, G06Q500.0330.7653.290Complementary26
G06F19, G06Q10, G06Q500.0320.9263.984Complementary25
A61K490.0150.9233.971Complementary12
A61K510.0100.8003.442Complementary8
A61B5G06F190.0540.2310.903Substitutive42
G06Q500.0420.1810.739Substitutive33
G06Q100.0430.1870.804Substitutive34
A61B80.0410.1764.302Complementary32
A61B100.0400.1704.302Complementary31
Table A2. Relationships of clusters in the science-based pharmaceutical innovation period (2000–2007).
CentroidSupportConfidenceLiftRelationshipCount
FromTo
G06Q10G06F190.0590.2530.990Substitutive46
A61B50.0540.2310.903Substitutive42
G06Q500.0430.1770.693Substitutive34
A61B5, G06Q100.0370.8533.339Complementary29
G06Q10, G06Q500.0340.2901.137Complementary27
A61B5, G06Q500.0330.7883.085Complementary26
A61B5, G06Q10, G06Q500.0320.9263.625Complementary25
G01N330.0230.6922.710Complementary18
G06Q300.0150.3241.270Complementary12
A61M50.0140.8463.313Complementary11
G06Q400.0130.1920.753Substitutive10
G06G70.0110.9003.524Complementary9
C12Q10.0100.6152.409Complementary8
G06F19G06Q100.0590.2300.990Substitutive46
A61B50.0540.2100.903Substitutive42
G06Q500.0430.1700.693Substitutive34
Table A3. Relationships of clusters in the science-based pharmaceutical innovation period (2000–2007).
CentroidSupportConfidenceLiftRelationshipCount
FromTo
G06Q10G06Q500.1190.5112.084Complementary93
G06F190.0430.1700.693Substitutive34
A61B50.0420.1810.739Substitutive33
A61B5, G06Q100.0340.7943.239Complementary27
G06F19, G06Q100.0340.5872.394Complementary27
A61B5, G06F190.0330.6192.525Complementary26
A61B5, G06F19, G06Q100.0320.8623.516Complementary25
G06Q400.0280.4231.725Complementary22
G06Q300.0140.2971.212Complementary11
G06Q10, G06Q400.0130.6672.719Complementary10
G06Q50G06Q100.1190.4842.084Complementary93
G06F190.0430.1770.693Substitutive34
A61B50.0420.1720.739Substitutive33
G06Q400.0280.1151.725Complementary22
Table A4. Relationships of clusters in the data science-based pharmaceutical innovation period (2008–2015).
CentroidSupportConfidenceLiftRelationshipCount
FromTo
A61K49A61B50.0500.9665.026Complementary56
G06F190.0360.1060.549Substitutive40
A61B80.0340.9274.825Complementary38
A61B100.0311.0005.206Complementary35
A61B10, A61B80.0291.0005.206Complementary32
A61B8, A61K490.0280.9695.043Complementary31
A61B10, A61K490.0271.0005.206Complementary30
A61B10, A61B8, A61K490.0271.0005.206Complementary30
G01N330.0270.4622.403Complementary30
A61K310.0250.5002.603Complementary28
A61K510.0190.9554.969Complementary21
A61K90.0190.6563.416Complementary21
A61M50.0180.5262.740Complementary20
A61K49, G01N330.0171.0005.206Complementary19
A61N10.0150.9444.916Complementary17
A61K49, A61K510.0141.0005.206Complementary16
A61B60.0130.8334.338Complementary15
G06F19, G06Q500.0130.1380.716Substitutive15
A61B8, G01N330.0131.0005.206Complementary14
A61B8, A61K49, G01N330.0131.0005.206Complementary14
A61J30.0130.4522.351Complementary14
A61B10, G01N330.0121.0005.206Complementary13
A61B10, A61B8, G01N330.0121.0005.206Complementary13
A61B10, A61K49, G01N330.0121.0005.206Complementary13
A61B10, A61B8, A61K49, G01N330.0121.0005.206Complementary13
A61K380.0110.4442.314Complementary12
G06F19, G06Q100.0110.1430.744Substitutive12
A61B5A61K490.0500.2625.026Complementary56
G06F190.0360.1870.549Substitutive40
A61B80.0340.1784.825Complementary38
A61B100.0310.1645.206Complementary35
G01N330.0270.1402.403Complementary30
A61K310.0250.1312.603Complementary28
Table A5. Relationships of clusters in the data science-based pharmaceutical innovation period (2008–2015).
CentroidSupportConfidenceLiftRelationshipCount
FromTo
G06Q50G06F190.0980.3080.905Substitutive109
G06Q100.0750.3270.961Substitutive84
G06F170.0560.3481.024Complementary62
G06Q10, G06Q500.0540.3971.168Complementary60
G07F170.0480.8852.602Complementary54
A61B50.0360.1870.549Substitutive40
A61J70.0330.8412.472Complementary37
G01N330.0310.5231.537Complementary34
G07F110.0240.8442.480Complementary27
G07F11, G07F170.0230.8672.547Complementary26
G06Q300.0220.2630.774Substitutive25
A61K310.0210.4111.207Complementary23
A61J10.0200.7862.309Complementary22
G06F70.0190.5251.543Complementary21
A61M50.0170.5001.470Complementary19
G06Q30, G06Q500.0160.4091.202Complementary18
G06F17, G07F170.0150.8952.630Complementary17
G06F17, G06Q500.0150.5861.723Complementary17
A61J7, G07F170.0141.0002.939Complementary16
G06Q50, G07F170.0140.7622.239Complementary16
B65B50.0130.8332.449Complementary15
A61B5, G06Q500.0130.7892.321Complementary15
G06F17, G06Q100.0130.6001.764Complementary15
G06Q10, G07F170.0130.8752.572Complementary14
A61K380.0130.5191.524Complementary14
B65G10.0110.9232.713Complementary12
A61B5, G06Q100.0110.8572.519Complementary12
C12Q10.0110.7502.204Complementary12
G06F17, G06Q10, G06Q500.0110.6671.960Complementary12
C07K140.0110.6321.856Complementary12
G06Q10, G06Q300.0110.3751.102Complementary12
G06F19G06Q500.0980.2880.905Substitutive109
G06Q100.0750.2220.961Substitutive84
G06F170.0560.1641.024Complementary62
G07F170.0480.1422.602Complementary54
A61B50.0360.1060.549Substitutive40
Table A6. Description of IPC codes for the science-based innovation period (2000–2007).
IPC CodeDescription
A61B5Measuring for diagnostic purposes
A61B8Diagnosis using ultrasonic, sonic or infrasonic waves
A61B10Other methods or instruments for diagnosis
A61K49Preparations for testing in vivo
A61K51Preparations containing radioactive substances for use in therapy or testing in vivo
G06F19Digital computing or data processing equipment or methods, specially adapted for specific applications
A61M5Devices for bringing media into the body in a subcutaneous, intra-vascular or intramuscular way
C12Q1Measuring or testing processes involving enzymes, nucleic acids or microorganisms; Compositions therefor; Processes of preparing such compositions
G01N33Investigating or analyzing materials by specific methods
G06G7Devices in which the computing operation is performed by varying electric or magnetic quantities
G06Q50Systems or methods specially adapted for specific business sectors
G06Q10Administration, Management
(Between G06F19 and G06Q50)
G06Q30Commerce, e.g., shopping or e-commerce
G06Q40Finance; Insurance; Tax strategies; Processing of corporate or income taxes
Table A7. Description of IPC codes for the data science-based innovation period (2008–2015).
IPC CodeDescription
A61B5Measuring for diagnostic purposes
A61B6Apparatus for radiation diagnosis
A61J3Devices or methods specially adapted for bringing pharmaceutical products into particular physical or administering forms
A61K9Medicinal preparations characterized by special physical form
A61K51Preparations containing radioactive substances for use in therapy or testing in vivo
A61N1Electrotherapy; Magnetotherapy; Radiation therapy; Ultrasound therapy
G06F19Digital computing or data processing equipment or methods, specially adapted for specific applications
A61J1Containers specially adapted for medical or pharmaceutical purposes
B65B5Packaging individual articles in containers or receptacles
B65G1Storing articles, individually or in orderly arrangements, in warehouses or magazines
C07K14Peptides having more than 20 amino acids; Gastrin; Somatostatins; Melanotropins; Derivatives thereof
C12Q1Measuring or testing processes involving enzymes, nucleic acids or microorganisms; Compositions thereof; Processes for preparing such compositions
G06F7Methods or arrangements for processing data by operating upon the order or content of the data handled
G07F11Coin-freed apparatus for dispensing, or the like, discrete articles
Intermediate
A61K38Medicinal preparations containing peptides
A61M5Devices for bringing media into the body in a subcutaneous, intra-vascular or intramuscular way

References

  1. Cohen, F.J. Macro trends in pharmaceutical innovation. Nat. Rev. Drug Discov. 2005, 4, 78–84. [Google Scholar] [CrossRef] [PubMed]
  2. Munos, B. Lessons from 60 years of pharmaceutical innovation. Nat. Rev. Drug Discov. 2009, 8, 959–968. [Google Scholar] [CrossRef] [PubMed]
  3. Gassmann, O.; Reepmeyer, G. Organizing Pharmaceutical Innovation: From Science-based Knowledge Creators to Drug-oriented Knowledge Brokers. Creat. Innov. Manag. 2005, 14, 233–245. [Google Scholar] [CrossRef]
  4. Yong-Gil, L.; Yun-Chul, C. Collaborative Research in Biotechnology and Role of Government-sponsored Research Institutes (GRIs). Asian Biotechnol. Dev. Rev. 2004, 6, 1–13. [Google Scholar]
  5. Yong-Gil, L. Introduction to the special cluster on managing technology–service fusion innovation. Technovation 2012, 32, 415–418. [Google Scholar]
  6. Donati, G.; Woolston, C. Information management: Data domination. Nature 2017, 548, 613–614. [Google Scholar] [CrossRef]
  7. Stokes, L.B.; Rogers, J.W.; Hertig, J.B.; Weber, R.J. Big Data: Implications for Health System Pharmacy. Hosp. Pharm. 2016, 51, 599–603. [Google Scholar] [CrossRef] [Green Version]
  8. Maynard, A.D. Navigating the fourth industrial revolution. Nat. Nanotechnol. 2015, 10, 1005. [Google Scholar] [CrossRef] [PubMed]
  9. Kimko, H.; Pinheiro, J. Model-based clinical drug development in the past, present and future: A commentary. Br. J. Clin. Pharmacol. 2015, 79, 108–116. [Google Scholar] [CrossRef]
  10. Laky, D.; Xu, S.; Rodriguez, J.; Vaidyaraman, S.; García Muñoz, S.; Laird, C. An Optimization-Based Framework to Define the Probabilistic Design Space of Pharmaceutical Processes with Model Uncertainty. Processes 2019, 7, 96. [Google Scholar] [CrossRef]
  11. Metta, N.; Ghijs, M.; Schäfer, E.; Kumar, A.; Cappuyns, P.; Van Assche, I.; Nopens, I. Dynamic Flowsheet Model Development and Sensitivity Analysis of a Continuous Pharmaceutical Tablet Manufacturing Process Using the Wet Granulation Route. Processes 2019, 7, 234. [Google Scholar] [CrossRef]
  12. Production and Consumption in the Fourth Industrial Revolution; South Korea Ministry of Science and ICT Committee of Future Preparation: Gwacheon, Korea, 2017.
  13. Andreu-Perez, J.; Poon, C.C.; Merrifield, R.D.; Wong, S.T.; Yang, G.Z. Big data for health. IEEE J. Biomed. Health Inf. 2015, 19, 1193–1208. [Google Scholar] [CrossRef] [PubMed]
  14. Szlezak, N.; Evers, M.; Wang, J.; Pérez, L. The role of big data and advanced analytics in drug discovery, development, and commercialization. Clin. Pharmacol. Ther. 2014, 95, 492–495. [Google Scholar] [CrossRef] [PubMed]
  15. Congress; US Office of Technology Assessment. Innovation and Commercialization of Emerging Technology; US Government Printing Office: Washington, DC, USA, 1995.
  16. Arthur, W.B. Increasing Returns and Path Dependence in the Economy; University of Michigan Press: Ann Arbor, MI, USA, 1994. [Google Scholar]
  17. Liebowitz, S.J.; Margolis, S.E. Path dependence, lock-in, and history. J. Law Econ. Organ. 1995, 11, 205–226. [Google Scholar] [CrossRef]
  18. Coombs, R.; Hull, R. ‘Knowledge management practices’ and path-dependency in innovation. Res. Policy 1998, 27, 239–256. [Google Scholar] [CrossRef]
  19. Page, S.E. Path dependence. Q. J. Polit. Sci. 2006, 1, 87–115. [Google Scholar] [CrossRef]
  20. Jong-Hyun, K.; Yong-Gil, L. Analyzing the Learning Path of US Shale Players by Using the Learning Curve Method. Sustainability 2017, 9, 2232. [Google Scholar] [CrossRef]
  21. Wei, Y.; Kang, J.; Yu, B.; Liao, H.; Du, Y. A dynamic forward-citation full path model for technology monitoring: An empirical study from shale gas industry. Appl. Energy 2017, 205, 769–780. [Google Scholar] [CrossRef]
  22. Kim, J.; Lee, Y. Learning Curve, Change in Industrial Environment, and Dynamics of Production Activities in Unconventional Energy Resources. Sustainability 2018, 10, 3322. [Google Scholar] [CrossRef]
  23. Kim, J.; Lee, Y. Co-development strategy of gas and electricity in developing countries. Geosyst. Eng. 2018, 30, 1–12. [Google Scholar] [CrossRef]
  24. Bender, E. Big data in biomedicine. Nature 2015, 527, S1. [Google Scholar] [CrossRef] [PubMed]
  25. Costa, F.F. Big data in biomedicine. Drug Discov. Today 2014, 19, 433–440. [Google Scholar] [CrossRef] [PubMed]
  26. Trenfield, S.J.; Awad, A.; Goyanes, A.; Gaisford, S.; Basit, A.W. 3D Printing Pharmaceuticals: Drug Development to Frontline Care. Trends Pharmacol. Sci. 2018, 39, 440–451. [Google Scholar] [CrossRef] [PubMed]
  27. Norman, J.; Madurawe, R.D.; Moore, C.M.V.; Khan, M.A.; Khairuzzaman, A. A new chapter in pharmaceutical manufacturing: 3D-printed drug products. Adv. Drug Deliv. Rev. 2017, 108, 39–50. [Google Scholar] [CrossRef] [PubMed]
  28. Jun, S.; Sung Park, S.; Sikg, D. Technology forecasting using matrix map and patent clustering. Ind. Manag. Data Syst. 2012, 112, 786–807. [Google Scholar] [CrossRef]
  29. Jun, S. IPC code analysis of patent documents using association rules and maps-patent analysis of database technology. In Database Theory and Application, Bio-Science and Bio-Technology; Springer: New York, NY, USA, 2011; pp. 21–30. [Google Scholar]
  30. Team, R.C. R: A language and environment for statistical computing. Available online: https://cran.r-project.org/bin/windows/base/old/3.4.3/ (accessed on 18 May 2019).
  31. Hahsler, M.; Chelluboina, S. arulesViz: Visualizing association rules and frequent itemsets. Available online: https://cran.r-project.org/web/packages/arulesViz/index.html (accessed on 18 May 2019).
  32. Hahsler, M.; Buchta, C.; Gruen, B.; Hornik, K. arules: Mining association rules and frequent. Available online: https://cran.r-project.org/web/packages/arules/index.html (accessed on 18 May 2019).
  33. Agrawal, R.; Imieliński, T.; Swami, A. Mining Association Rules between Sets of Items in Large Databases. ACM Sigmod Rec. 1993, 22, 207–216. [Google Scholar] [CrossRef]
  34. Han, J.; Pei, J.; Kamber, M. Data Mining: Concepts and Techniques; Elsevier: Amsterdam, The Netherlands, 2011. [Google Scholar]
  35. Korea Intellectual Property Rights Information Service. Available online: http://abpat.kipris.or.kr/abpat/searchLogina.do?next=MainSearch (accessed on 18 May 2019).
  36. Patent Landscape Report on Atazanavir; World Intellectual Property Organization: Geneva, Switzerland, 2012.
  37. Fourth Industrial Revolution Related Technology Classification System. Available online: https://www.kipo.go.kr/kpo/HtmlApp?c=33001&catmenu=m06_07_06 (accessed on 16 March 2019).
  38. Fourth Industrial Revolution Related Technology Classification Codes Matching Table. 2018. Available online: http://www.koipa.re.kr/bbs/download.php?file_uid=2973 (accessed on 16 March 2019).
  39. Lee, W.S.; Han, E.J.; Sohn, S.Y. Predicting the pattern of technology convergence using big-data technology on large-scale triadic patents. Technol. Forecast. Soc. Chang. 2015, 100, 317–329. [Google Scholar] [CrossRef]
Figure 1. Yearly granted patent counts by country [35].
Processes 07 00492 g001
Figure 2. Yearly granted patent counts by country [35].
Processes 07 00492 g002
Figure 3. Association map of pharmaceutical technology between 2000 and 2007.
Processes 07 00492 g003
Figure 4. Association map of pharmaceutical technology from 2008 to 2015.
Processes 07 00492 g004
Table 1. Search queries.
FieldContentsOperator
Intra FieldInter Field
IPC (International Patent Classification)IPC = (A61B5/00+A61B6/50+A61B6/52+A61B8/52+G01S+G01S5/0278+G01V+G06F11/00+G06F16+G06F17/00+G06F17/20+G06F17/21+G06F17/2264+G06F17/27+G06F17/28+G06F17/30+G06F17/30002+G06F17/30047+G06F17/30067+G06F17/30076+G06F17/30153+G06F17/30194+G06F17/30268+G06F17/30289+G06F17/30312+G06F17/30318+G06F17/30386+G06F17/3061+G06F17/30734+G06F17/30861+G06F19/00+G06F19/18+G06F19/28+G06F19/30+G06F21/31+G06F21/50+G06F21/60+G06F21/6245+G06F3/01+G06F3/048+G06F9/00+G06K7/00+G06K7/1413+G06K9/00+G06Q+G08B21/00+G08B21/0205+G16B20+G16B50+G16C+G16H+G16Z99/00+H04L43/16+H04L9/32+H04M1/00+H04M1/725+H04N1/00+H04N21/00+H04N21/4135+H04N21/45+H04N5/232+H04Q9/00)Or(+)And(*)
TitleTL = [(Pharmaceutical+pharmacy+pharmacies)]Or(+)Or(+)
AbstractAB = [(Pharmaceutical+pharmacy+pharmacies)]Or(+)
ClaimCL = [(Pharmaceutical+pharmacy+pharmacies)]Or(+)
Table 2. Search results.
China (CN)Europe (EP)Japan (JP)United States (US)Other CountriesTotal
Applied patent count46048630043755406161
(weight)(7.5%)(7.9%)(4.9%)(71.0%)(8.8%)(100.0%)
Rank of application3241
Granted patent count1613111818561002221
(weight)(0.7%)(5.9%)(5.3%)(83.6%)(4.5%)(100.0%)
Rate of granted3.5%27.0%39.3%42.4%18.5%36.0%
Rank of granted4321
Table 3. Yearly granted patent counts by country [35].
China (CN)Europe (EP)Japan (JP)United States (US)Other CountriesTotal
1975000000
1976000000
1977000101
199701112216
19980209112
199906014424
200003453363
2001112366688
200236859783
20033135878116
200416279593
2005377918116
20061951087130
20071671372153
200818610711132
200914121187142
20101941488170
20110681145133
201201081381157
201303101362151
201406121312151
20150651050116
201602459570
201700342045
201800114015
Total1613111818561002221
Table 4. Various relationships of centroids of clusters in the science-based pharmaceutical innovation period (2000–2007).
CentroidSupportConfidenceLiftRelationshipCount
FromTo
Panel A: Single component and directly connected relationship between centroids of cluster
G06Q50G06F190.0590.1770.693Substitutive46
G06F19G06Q500.0590.1700.693Substitutive46
A61B5G06F190.0540.2310.903Substitutive42
G06F19A61B50.0540.2100.903Substitutive42
A61B5G06Q500.0420.1810.739Substitutive42
G06Q50A61B50.0420.1720.739Substitutive42
Panel B: Relationship from multi-components involving centroids of cluster to centroid of cluster
G06F19, G06Q10A61B50.0370.6302.712Complementary29
G06Q10, G06Q500.0340.2901.249Complementary27
G06F19, G06Q500.0330.7653.290Complementary26
G06F19, G06Q10, G06Q500.0320.9263.984Complementary25
A61B5, G06Q10G06F190.0370.8533.339Complementary29
G06Q10, G06Q500.0340.2901.137Complementary27
A61B5, G06Q500.0330.7883.085Complementary26
A61B5, G06Q10, G06Q500.0320.9263.625Complementary25
A61B5, G06Q10G06Q500.0340.7943.239Complementary27
G06F19, G06Q100.0340.5872.394Complementary27
A61B5, G06F190.0330.6192.525Complementary26
A61B5, G06F19, G06Q100.0320.8623.516Complementary25
783 granted patents were used for analysis
Table 5. Directly connected relationship between centroids of cluster for data science-based pharmaceutical innovation period (2008–2015) [35].
CentroidSupportConfidenceLiftRelationshipCount
FromTo
Panel A: Single component and directly connected relationship between centroids of cluster
A61B5G06F190.0360.1870.549Substitutive40
G06F19A61B50.0360.1060.549Substitutive40
Panel B: Relationship from multi component involving centroids of cluster to centroid of cluster
G06F19, G06Q50A61B50.0130.1380.716Substitutive15
G06F19, G06Q100.0110.1430.744Substitutive12
A61B5, G06Q50G06F190.0130.7892.321Complementary15
A61B5, G06Q100.0110.8572.519Complementary12
1114 granted patents were used for analysis
Table 6. Relationships of centroids located between clusters A61B5 and G06F19 in the data science-based pharmaceutical innovation period (2008–2015) [35].
CentroidSupportConfidenceLiftRelationshipCount
FromTo
A61M5A61B50.0180.5262.740Complementary20
G06F190.0170.5001.470Complementary19
A61K38G06F190.0130.5191.524Complementary14
A61B50.0110.4442.314Complementary12
1114 granted patents were used for analysis
Table 7. Summary of differences between science-based innovation and data science-based innovation.
Technological Innovation Regime
Science-Based InnovationData science-Based Innovation
Panel A: Technological innovation characteristics
PurposeInventing new pharmaceutical entityInventing service or personalized, and qualified pharmaceutical entity
StrategyReducing failure in inventionServiceable invention
AdvantageHigh returnLow risk
DisadvantageHigh riskMedium return
Panel B: Association rule and map
Centroid IPC codeA61B5, G06F19, G06Q50A61B5, G06F19
Relationship among IPC code
Among centroid SubstitutiveSubstitutive
From multi component to centroid ComplementaryDifferent according to centroid
Intermediate IPC code
Between A61B5 & G06F19G06Q50A61M5, A61K38
Between G06F19 & G06Q50G06Q40, G06Q30
IPC code surrounding centroid
A61B5
Co-existingA61K51A61K51
Different G06Q50, A61B8, A61B10, A61K49A61M5, A61K38, A61K9, A61J3, A61N1, A61B6
G06F19
Co-existingA61M5, C12Q1A61M5, C12Q1
Different G06G7, G06Q30, G06Q40, G01N33A61K38, G06F7, G07F11, C07K14, B65B5, B65G1, A61J1
G06Q50A61B5, G06Q10, G06Q40, G06Q30

