Article

Influence of Injection Timing on Performance and Exhaust Emission of CI Engine Fuelled with Butanol-Diesel Using a 1D GT-Power Model

College of Power and Energy, Harbin Engineering University, Harbin 150001, China
*
Author to whom correspondence should be addressed.
Processes 2019, 7(5), 299; https://doi.org/10.3390/pr7050299
Submission received: 23 April 2019 / Revised: 13 May 2019 / Accepted: 14 May 2019 / Published: 21 May 2019
(This article belongs to the Section Process Control and Monitoring)

Abstract

:
Injection timing variations have a significant effect on the performance and pollutant formation in diesel engines. Numerical study was conducted to investigate the impact of injection timing on engine performance and pollutants in a six-cylinder turbocharged diesel engine. Diesel fuel with different amounts (5%, 15%, and 25% by volume) of n-butanol was used. Simulations were performed at four distinct injection timings (5°, 10°, 20°, 25°CA bTDC) and two distinct loads of brake mean effective pressure (BMEP = 4.5 bar and 10.5 bar) at constant engine speed (1800 rpm) using the GT-Power computational simulation package. The primary objective of this research is to determine the optimum injection timing and optimum blending ratio for improved efficiencies and reduced emissions. Notable improvements in engine performance and pollutant trends were observed for butanol-diesel blends. The addition of butanol to diesel fuel has greatly diminished NOX and CO pollutants but it elevated HC and CO2 emissions. Retarded injection timing decreased NOX and CO2 pollutants while HC and CO2 emissions increased. The results also indicated that early injection timings (20°CA bTDC and 25°CA bTDC) lowered both CO2 and unburned hydrocarbon emissions. Moreover, advanced injection timing slightly improved brake thermal efficiency (BTE) for all engine loads. It is concluded that retarded injection timing, i.e., 10°CA bTDC demonstrated optimum results in terms of performance, combustion and emissions and among the fuels 15B showed good outcome with regard to BTE, higher heat release rate, and lower pollution of HC, CO, and NOx.

1. Introduction

Diesel engines are alluring because of their high power yield, good fuel transformation proficiency, relatively low fuel consumption, and high durability [1,2]. Diesel engines are outstanding for their elevated efficiency and mileage, however, they have gaseous emissions at their exhaust that consist mainly of nitric oxide and nitrogen dioxide (NOx), CO, and HC which are noxious to human health [3]. There are numerous negative impacts of exhaust emissions discharged from ocean and land vehicles on human beings and the environment. In order to meet the strict rules and regulations of emissions, soaring energy demand, and the dwindling of non-renewable fuels a great deal of research has been directed to upgrade the combustion characteristics so as to maximize engine efficiency, thus reducing fuel consumption and harmful gaseous emissions.
Significant accomplishments with regard to the improvement of cleaner diesel engines have been made by ensuing different engine-associated approaches; for example, the utilization of common-rail systems, fuel injection control techniques, exhaust gas recirculation, exhaust gas after-treatment, etc. [4,5]. For the minimization of gaseous pollution, scientists have concentrated their pursuit in the realm of fuel-associated methods, such as the utilization of substitute fuels, often in fumigated form, or vaporous fuels of a renewable nature that are ambiance-friendly. Alcohol fuels such as methanol, ethanol, and butanol, can be used with diesel fuels in different percentage blends for CI engine as a clean alternative fuel source [6]. Butanol is a workable choice fuel or fuel additive for use in CI engines and gives various commendable properties compared to ethanol and methanol. It has a higher cetane number, lower heat of vaporization, higher heating value, no corrosion to pipelines, and better miscibility and inter-solubility with diesel fuel [7]. Moreover, butanol has higher energy density than ethanol and methanol [8] and can be mixed with diesel fuel without phase separation [9]. There are three ways in utilizing butanol in diesel engines: butanol-diesel fuel blend [10,11], butanol fumigation [12,13], and dual injection systems [10].

1.1. Research Background

There are, fundamentally, two major ways of generating butanol: from biomass (bio-butanol) and from petroleum products (petro-butanol) [14]. The majority of butanol generated today is synthetic and is obtained from a petrochemical reaction (petro-butanol). Butanol made its way to biotechnological industrial production by the so-called ABE process, which produces acetone-butanol-ethanol in a ratio of 3:6:1, by Clostridial fermentation [15].Technological factors hindering bio-butanol production from fermentation are low butanol yield, a costly recovery stage, and the price of the substrate. Compared to pure and expensive substrates, such as dextrose, butanol can be produced from lignocellulosic agricultural wastes, energy crops, or forest residues [16]. According to Alkayam et al. [17] ABE from lignocellulosic materials (a green energy resource) can be improved through metabolic engineering of the fermenting yeast (Clostridia) or pre-treatment techniques. One of the main factors influencing bio-butanol production around the world is the petrochemical industry. Hence, ABE fermentation plant profitability is closely related to the butanol price and further interconnected with the cost of oil [15]. Koonin [18] stated that biofuels could supply some 30% of worldwide demand in an environmentally responsible manner without affecting food production. The global n-butanol market size will increase to 8.3 billion US$ by 2025, from 6.44 billion US$ in 2018, at a compound annual growth rate (CAGR) of 3.7% during the forecast period [19].
Numerous investigations revealed that the utilization of diesel mixed fuels is linked with bettering performance and decreasing gaseous pollutants. Chen et al. [20] reported that butanol-diesel blends raised brake specific fuel consumption (BSFC) and BTE. They also found that, at lower loads, CO pollutants were elevated while NOX diminished with the increasing ratio of n-butanol. In another study Rakopoulos et al. [21] reported that NOx and CO pollutants were inappreciably diminished, while the HC pollutants rose with the addition of butanol. They also observed a slight rise in specific fuel consumption and BTE. Lapuerta et al. [22] showed that hydrocarbon, carbon monoxide, and fuel consumption increased with the increase of butanol while NOX emissions remained unaffected. They also observed that the addition of butanol significantly reduced particle emissions. According to Yusri et al. [23] NOx pollutants were reduced by 73.4% and 11.3% for both low and high speeds, respectively, when butanol-diesel blends were used. Doğan et al. [9] showed that smoke opacity, NOX, and CO pollutants decreased while HC increased with the increased addition of n-butanol. In another study conducted by Yao et al. [24] revealed that n-butanol addition could greatly slash CO pollutants without a grave impingement on BSFC. The use of butanol in spark ignition (SI) has also been widely studied. Li et al. [25] reported that butanol-gasoline blends in SI engines lowered the CO, HC, and NOx emissions while BTE slightly increased. Leach et al. [26] demonstrated that different oxygenates (ethanol, methanol, and n-butanol) blends with gasoline resulted in diverse particulate matter (PM) emanations, depending on their stoichiometry. The study with regard to the performance and emission of butanol in SI engines can be found in [27,28,29,30].
Despite the literature showing that, with respect to diesel fuel, butanol-diesel blends increase HC emanations [9,31], they decrease PM emissions [32] and soot [31,33]. Alcohols, due to their high oxygen content (up to 34.3% by weight), can considerably decrease PM emissions [34]. According to Choi et al. [35] particulate matter decreased by 50% with n-butanol diesel-blends. PM emissions reduction was also reported by Nayar et al. [36] in their experimental works. Studies by Siwale et al. [31] and Jin et al. [33] achieved significant drops of greater than 50% in soot emissions with butanol-diesel blends.
For the operation of any diesel engine, the fuel injection system has a paramount impact on pollutants and the performance of engines [37,38,39]. In a fuel injection system there are many ways that affect the amount of NOX emitted, such as injection pressure, injection rate, and injection timing [37,40]. Considerable studies have demonstrated that the injection timing influences the degree of gaseous pollutants of CI engines. According to Huang et al. [41] advancing injection timing decreased the heat release rate and cylinder pressure peak value, while NOx and soot pollutants diminished. Shuai et al. [42] found that advanced injection provided reduced soot, HC, and CO pollutants and higher NOx than the retarded injection. Algayyim et al. [43] investigated the influence of injector hole diameter on macroscopic spray behavior of butanol-diesel blends. They concluded that efficient diesel engine performance can be attained by controlling injection attributes. Zhu et al. [44] concluded that a better balance between emissions and efficiency can be achieved by combining a higher butanol ratio, high EGR rate, and early injection timing. Cheng et al. [45] reported that early and late injections decreased soot emissions due to their long premixed duration and smoke pollutants can be contracted by up to 70% with the expansion of the n-butanol mixing proportion. Raeie and Emami [46] showed that advanced injection gives reduced soot and higher NOX pollutants compared to retarded injection.

1.2. Research Objective

As per the studies referenced above, n-butanol can be utilized as a fuel blend in diesel fuel with no engine adjustment. Additionally, these investigations have shown the impacts of butanol addition on the performance, pollution, and combustion of different engines with different working parameters. Although there are many studies on the impacts of n-butanol addition, the study with respect to the influence of injection timing (IT) using diesel-butanol fuel on performance and emissions is still scarce. There are a lot of studies in the literature on the effects of injection timing with different fuel blends, however, to our knowledge, few studies focus on the effects of injection timing using diesel-butanol fuel. Thus, it is important to conduct a thorough investigation to build understanding of the impact of IT on combustion, performance, and exhaust pollution of diesel-butanol fuel and assist engine designers in selecting an optimum injection timing that gives an optimum outcome in terms of efficiency and emissions.
From the perspective of the above setting, in the current study we investigated the impacts of injection timing using diesel fuel with 5%, 15%m and 25% (by volume) of n-butanol on the performance and pollution of a six cylinder turbocharged engine operating at a fixed engine speed (1800 rpm) and at two distinct engine loads (BMEP = 0.45 MPA and 1.05 MPA). The investigation was conducted at four different injection timings (10°CA bTDC, 5°CA bTDC, 20°CA bTDC, and 25°CA). The results were compared to the baseline original injection timing, i.e., 15°CA bTDC, and optimum injection timing in terms of higher efficiency and low emissions is suggested.

1.3. Model Description

The engine used for this study is six cylinders, direct injection, and turbocharged, with a common rail injection system; the specifications are shown in Table 1, and the engine setup is shown in Figure 1. The application used in the current work is GT-Power, which is an extensively-used 1D simulation package for engine modeling and analysis. It is based on one-dimensional gas dynamics, representing the flow and heat transfer in the pipes and other components of an engine system. It is designed applicable to all different kinds of internal combustion engines. The engine mentioned above was modeled by using different blocks and interconnections that represent the engine layout. The following input data are required to establish the model: the engine geometric data, the intake and exhaust valve profiles, the compressor and turbine performance maps, the constants of the engine sub-model (combustion, heat transfer, and friction), the engine operating point (load/speed), and the ambient conditions. The engine model included a high-pressure common rail fuel injection system (injector with eight holes, 0.25 mm diameter, and injection pressure of 2000 bars), a turbocharger unit, an intercooler unit, and a throttle valve that controls the mass flow rate of the turbocharged cooled air. The injection system, main engine parameters (engine speed, crank angle and mass flow rate of fuel and air) were controlled by the engine control unit (ECU). The output results of in-cylinder pressure, heat release, and temperature were collected. Pressure was recorded by a pressure versus crank angle data recorder. The pressure sensor is a piezo-electric-based pressure transducer. The signal of the cylinder pressure is acquired at every 0.6° crank angle for 200 cycles. The HC, CO, and NOX pollutants from diesel and n-butanol-diesel blends fuel combustion were recorded by the emission sensors in the ECU. The engine speed was set at 1800 rpm, and the load rates (low and high) were chosen, i.e. 0.45 MPa and 1.05 MPa, respectively. The boost pressures were 1.1 bar and 1.9 bar for BMEP of 0.45 MPa and 1.05 MPa, respectively. A constant engine speed of 1800 rpm was selected to ensure that the engine maximum torque output. As explained in the introduction there are various methods involving butanol-diesel dual-fuel operation. In this examination, the butanol-diesel fuel mix method was used to research the impacts of injection timing. Simulations were carried out initially using diesel and the three butanol-diesel mixtures at the original injection timing. i.e., 15°CA bTDC for both given loads to generate the reference line data, then further simulations were performed by retarding the injection timing to 10°CA bTDC and 5°CA bTDC, and advancing to 20°CA bTDC and 25°CA bTDC under the same working conditions.

1.4. Butanol as an Alternative Fuel

Butanol is a higher-chain alcohol containing 4 carbon structures [47] and promising renewable fuel which could be used readily up to higher mixing proportion with diesel in internal combustion engines [20]. Butanol can be blended into diesel without emulsifiers; it is better in terms of safety compared to ethanol and methanol [48]. Its relatively high heat of vaporization reduces the combustion temperature, which could result in a lower dimension of NOx discharges. In addition, it has better ignition at cold start conditions has low environmental impact and high energy density. It does not cause cavitation or vapor lock problems in fuel supply systems due to its low saturation pressure [47]. Additionally, the kinematic viscosity of butanol is high due to its four-carbon structure. This results in good lubricity of the fuel, which is attractive in delicate fuel pump systems in diesel engines [49]. Its higher oxygen content [21] decreases the formation of soot in diesel engines. It has great miscibility with diesel. The above mentioned properties make n-butanol an excellent and competitive alternative fuel for diesel engines.
There are four isomers of butanol based on the location of hydroxyl group and the carbon chain structure [48,50].All four isomers have the same formulae and similar energy content however they have different molecular structures that affect their properties [50]. They have different physical properties [51], such as solubility, density, latent heat of vaporization, and boiling point, as shown in Table 2. Among the isomers n-butanol has shortest ignition delay [52], it is the most reactive [53] and has higher laminar velocity [54]. Different butanol isomers exhibit different combustion and emission characteristics in diesel engines [55]. Based on the research we conducted in our previous work [56] we selected n-butanol for this study.
The volume ratios used in this investigation were 5%, 15%, and 25% of butanol with 95%, 85%, and 75% of diesel fuel, respectively. They are designated as follows: 0B refers to 0% butanol in the blend; 5B refers to 5% of n-butanol and 95% of diesel by volume; 15B refers to 15% of n-butanol and 85% of diesel by volume; and 25B refers to 25% of n-butanol and 75% of diesel fuel by volume. The properties of diesel and n-butanol are summarized in Table 3.
The stoichiometric combustion for n-butanol and diesel is given by [57]:
C 4 H 9 O H + 6 ( O 2 + 3.76 N 2 ) 4 C O 2 + 5 H 2 O + 22.6 N 2
C 13.5 H 23.6 + 19.4 ( O 2 + 3.76 N 2 ) 13.5 C O 2 + 11.8 H 2 O + 72.9 N 2
For the mixture of diesel and butanol in stoichiometric conditions for x molar fraction of butanol in the blend the reaction can be written as follows:
x C 4 H 9 O H + ( 1 x ) C 13.5 H 23.6   + ( 19.4 13.15 x ) ( O 2 + 3.76 N 2 ) ( 13.5 9 x ) C O 2 + ( 11.8 7.3 x ) H 2 O + ( 72.9 49.4 x ) N 2
The viscosity and thermal conductivity of n-butanol in liquid and vapor phases were modeled using the following [58]:
μ L = E . e x p [ A ( C T T D ) 1 3 + B ( C T T D ) 4 3 ]
μ V = A T B 1 + C T 1 + D T 2
K L = A ( 1 + B ( 1 T T c ) 1 3 + C ( 1 T T c ) 2 3 + D ( 1 T T c ) )
K v = T T c ( A + B T c T + C T c 2 T 2 + D T c 2 T 3 )
where µL and µV are the viscosities of butanol at liquid and vapor phase respectively; KL and KV are its thermal conductivity at liquid and vapor phase; A, B, C, D, and E are empirical coefficients; Tc is the critical temperature of butanol; and T is the temperature at which the viscosity and thermal conductivity is calculated.

2. Results and Discussions

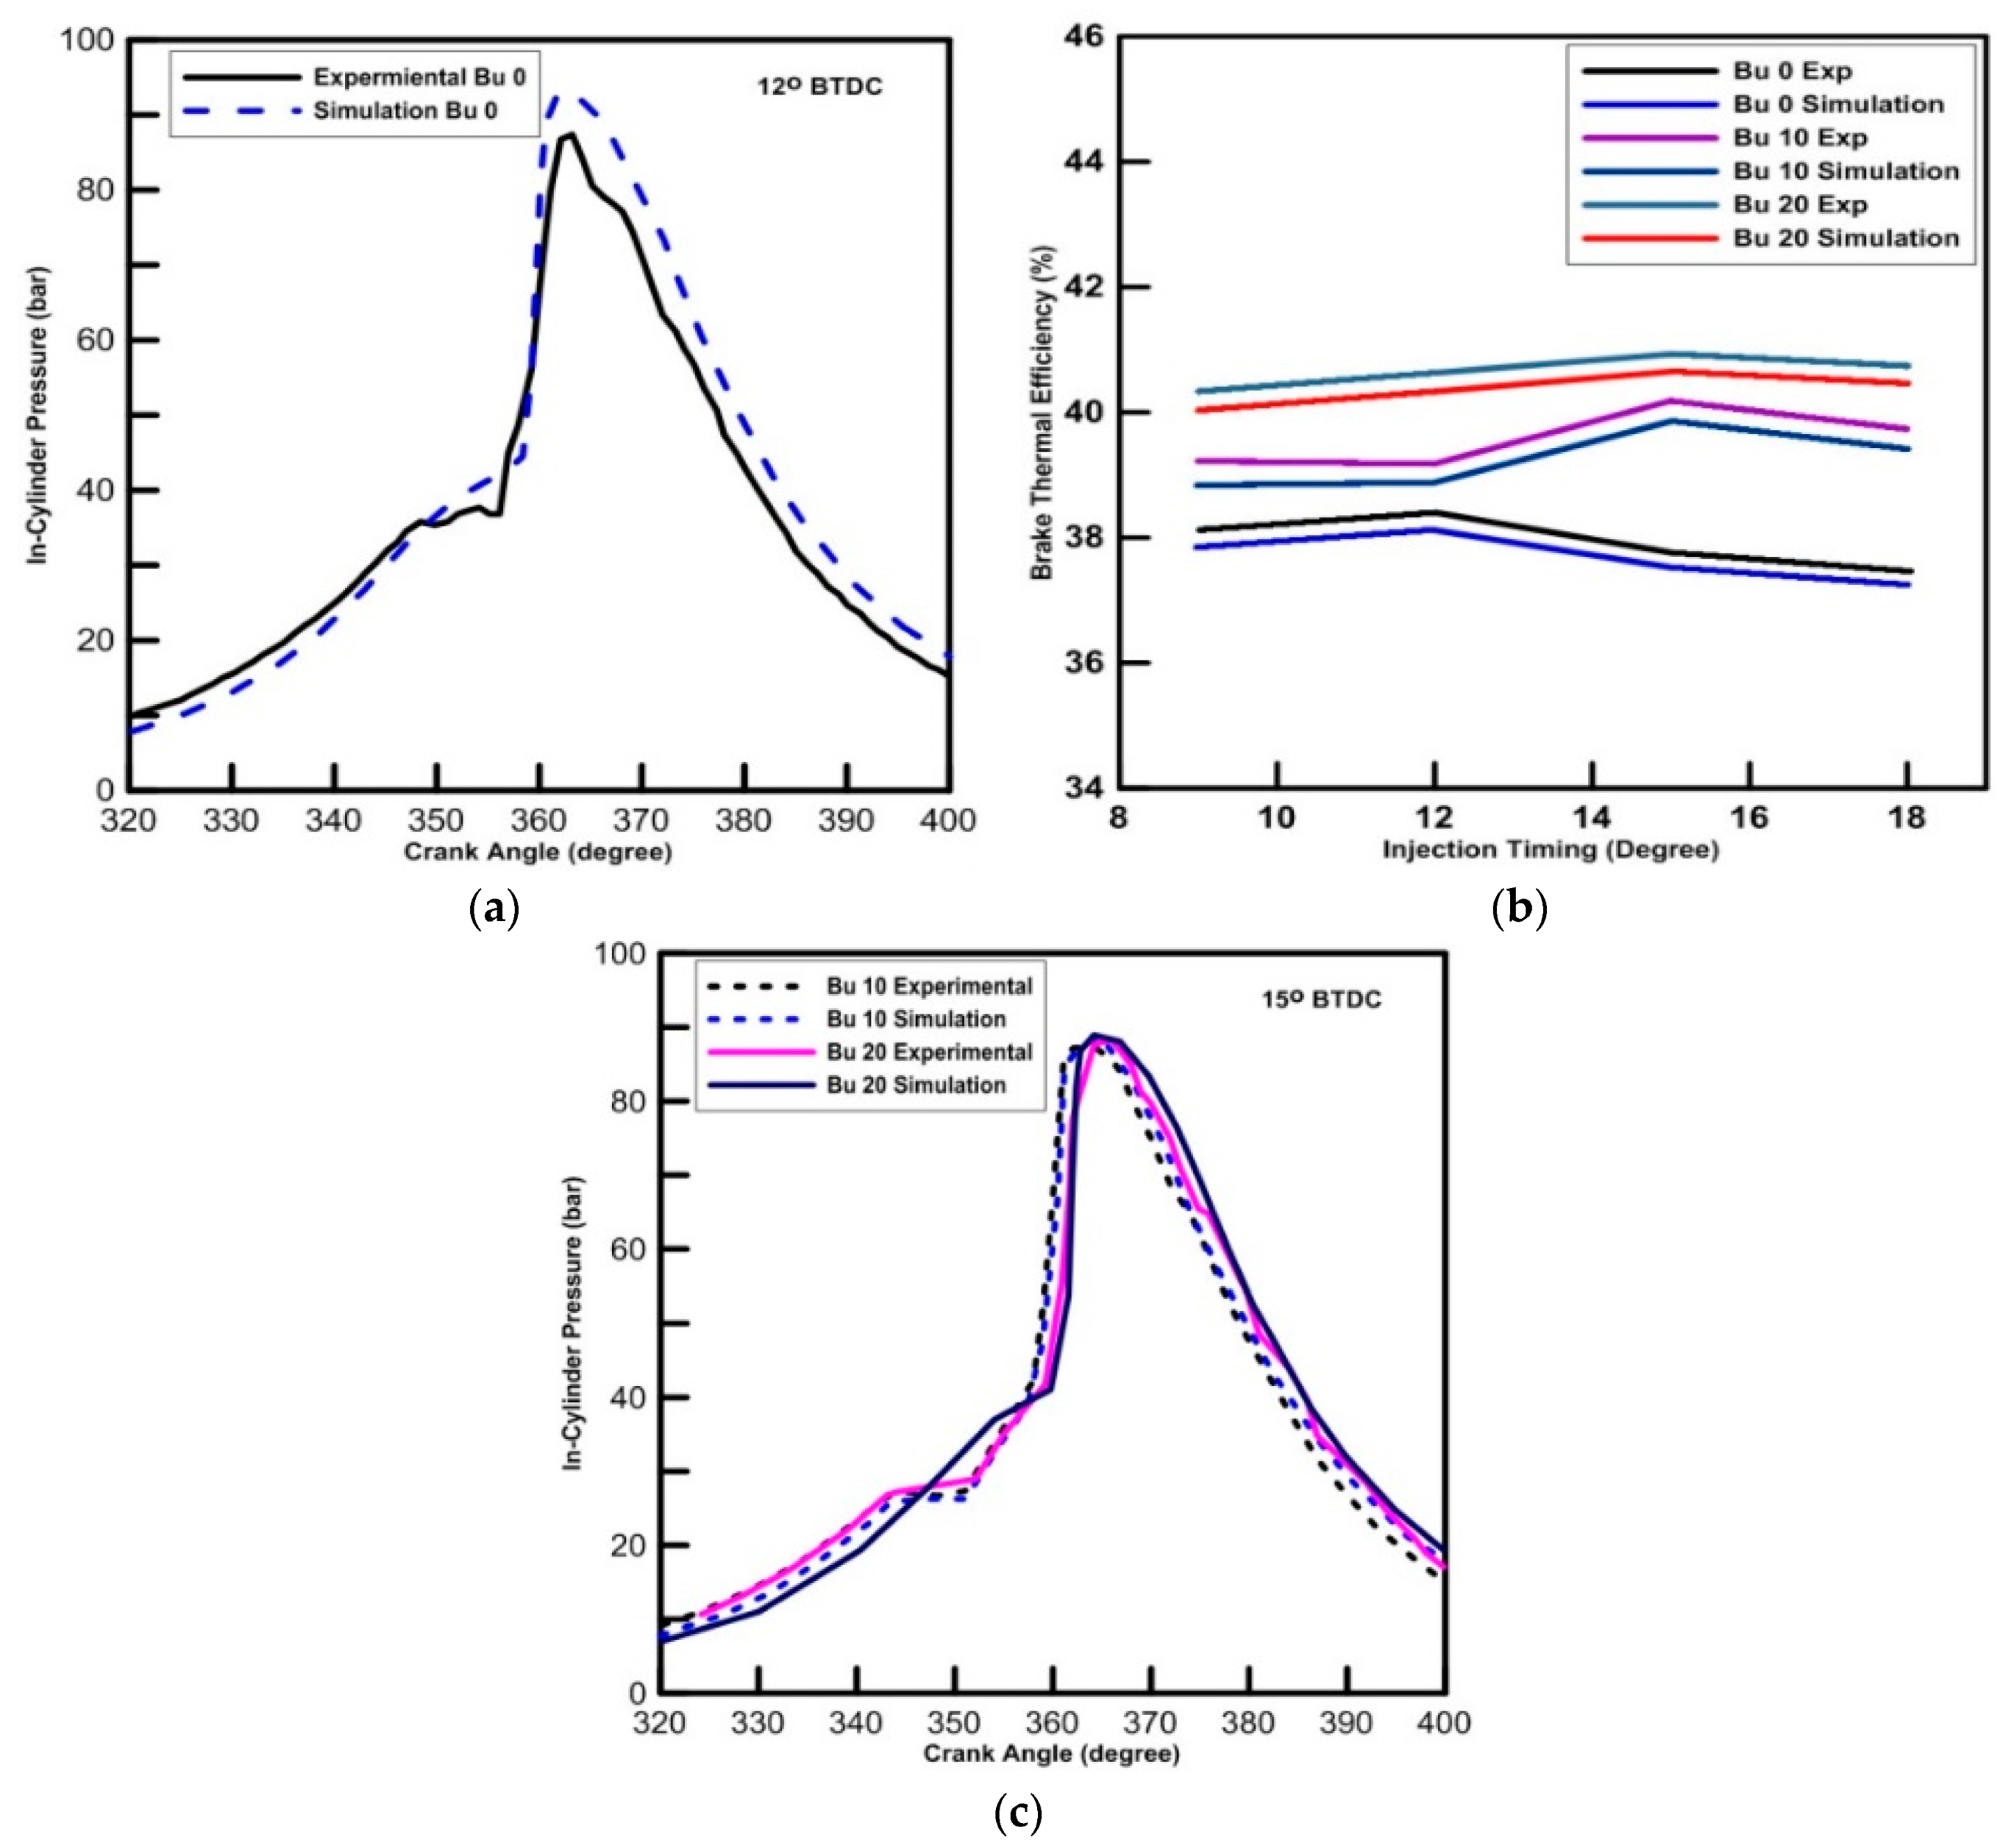
2.1. Numerical Validation

In order to validate our numerical simulations we have used the experimental work conducted by Lamani et al. [60]. We have built Lamani’s model which is a twin cylinder, four stroke, common rail direct injection engine which uses butanol-diesel blends (BU0, BU10, and BU20) in GT power and carried out numerical simulations. Figure 2a–c show the comparisons between the numerical analysis and experiments for in-cylinder pressure and brake thermal efficiency. We have calculated some parameters, such as viscosity and thermal conductivity of n-butanol in liquid and vapor phases and we have also used empirical formulae to calculate the properties of the blends and used them in the simulation which gave minor inaccuracies. Despite the minor inaccuracies, our simulation results were in good agreement with the experimental results, thus confirming the accuracy of the model.

2.2. Combustion Analysis

In-chamber burning of fuels is one of the most crucial processes which influence the evolution of gaseous pollutants as well as the engine performance and durability [61].

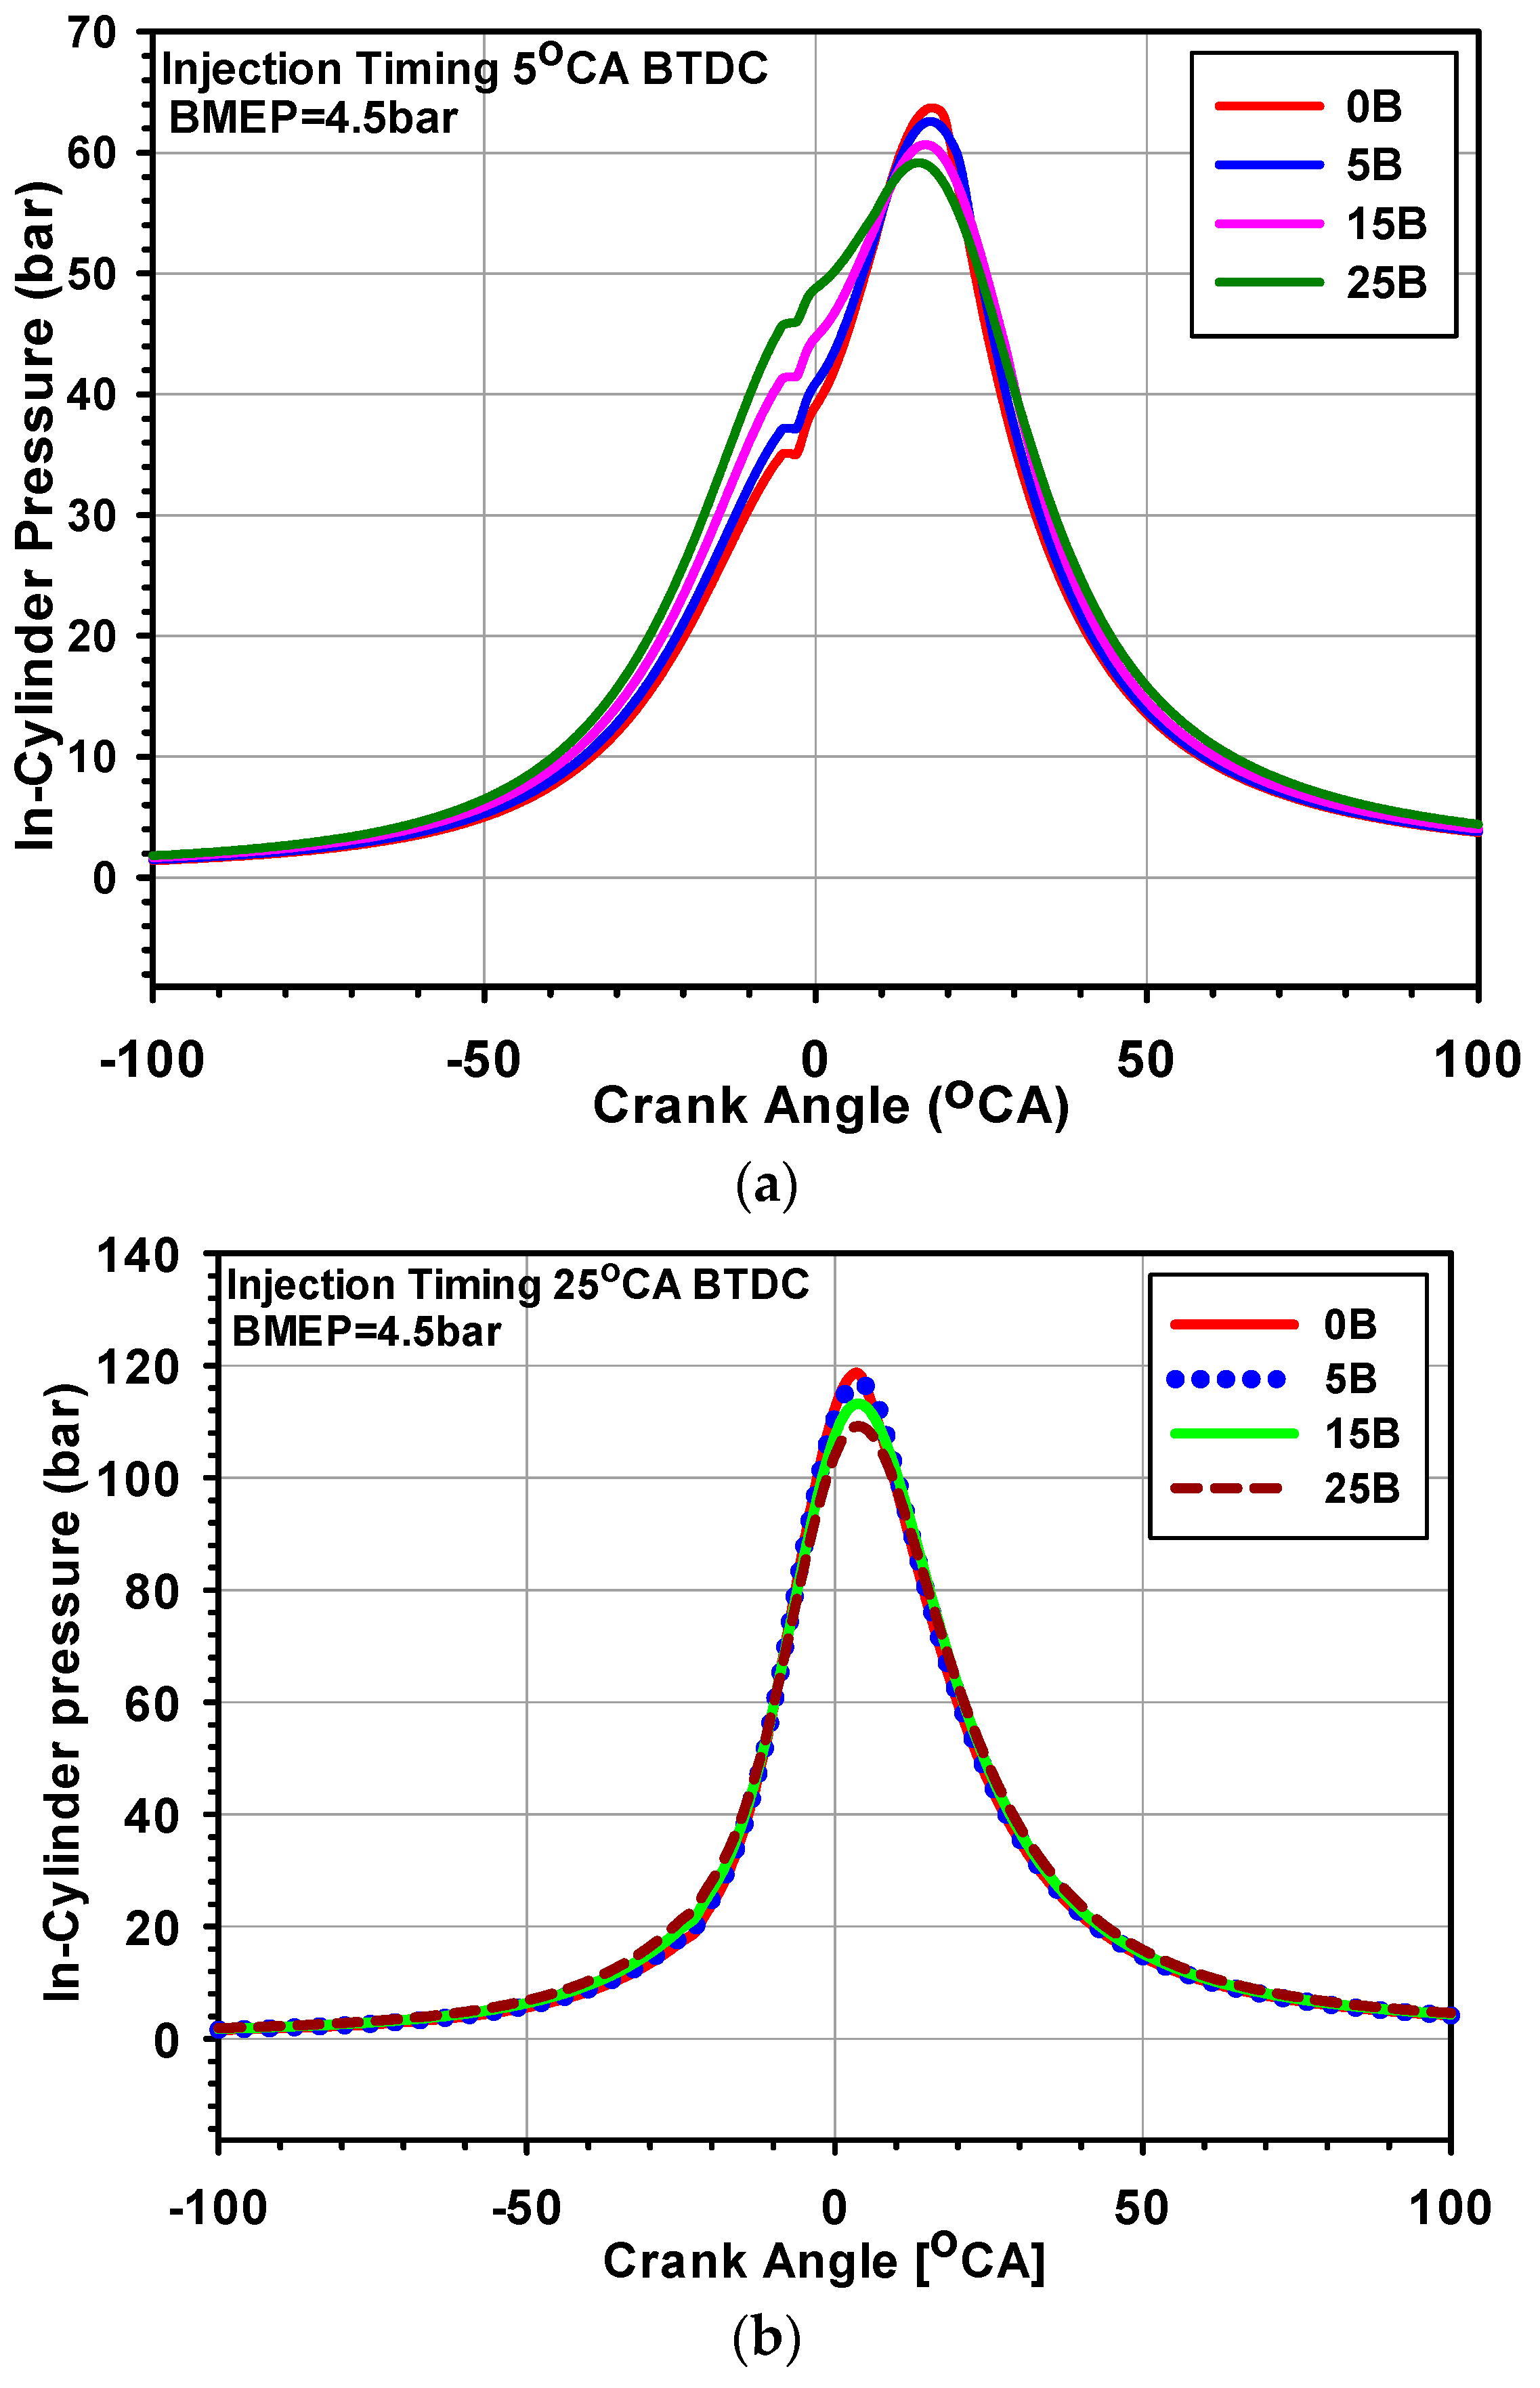
3. In-Cylinder Pressure

In-cylinder pressure fluctuations versus crank angle are shown in Figure 3. Peak cylinder pressure marginally declined with the increase of butanol ratio. As seen in Table 4, the peak cylinder pressure occurred at 91.7 bar (at 9.7°CA aTDC), 90.2 bar (at 9.5°CA aTDC), 87.4 bar (at 9.4°CA aTDC), and 84.7 bar (at 9.2°CA aTDC) for 0B, 5B, 15B, and 25B at 4.5 bar of BMEP and 15°CA bTDC, respectively. The addition of butanol lowered the cetane number of the blends, and this increased the ignition delay as more fuel is burned during the premixed burning stage, hence, decreasing the cylinder pressure [4]. Injection timing has a great impact on cylinder pressure. As indicated in Figure 3 for both advanced and retarded injection timings cylinder pressure increased with an increasing engine load because, at higher loads, more fuel is injected. This phenomenon gave rise to a higher cylinder pressure. The results showed that the rise in the cylinder pressure was about 16.4%, 18.2%, 21.5%, and 24.6% for 0B, 5B, 15B, and 25B as the engine load was augmented from 4.5 to 10.5 bar BMEP at 5°CA bTDC. Advancing the injection timing (IT) increased cylinder pressure while retarding IT reduced it. As seen in Figure 3a–d, advanced injection timing (25°CA) raised the cylinder pressure an average of 29.4% and retarded injection timing (5°CA bTDC) lowered the cylinder pressure by an average of 30.4% compared to the original injection timing, at 4.5 bar BMEP. Similar trends were observed at high loads for both advanced and retarded IT. At BMEP = 10.5 bar of engine load and IT of 25°CA bTDC maximum cylinder pressure of 142.5, 141.4, 138.9, and 136.1 bar was obtained for 0B, 5B, 15B, and 25B, respectively. As seen in Figure 3 and Table 4, at BMEP = 4.5 bar the peak cylinder pressure was obtained at 63.7 bar (at 17.5°CA aTDC), 62.6 bar (at 17.6° CA aTDC), 60.7 bar (at 16.8°CA aTDC), and 59.2 bar (at 15.3°CA aTDC) for 0B, 5B, 15B, and 25B at retarded IT of 5°CA bTDC respectively. The peak pressures occurred earlier with advancing injection timings [62].

4. Pressure Rise Rate

Pressure rise rate (PRR) as a function of injection timing is indicated in Figure 4. The PRR diminished with increased ratio of butanol in the mixture at lower loads. As seen in Figure 4, as compared to 5B the PRR for 15B and 25B decreased by 21.8% and 22.8%, respectively, at 4.5 bar of BMEP and IT of 5°CA bTDC. On the contrary, for the same IT, as compared to 5B, the PRR for 15B and 25B increased by 8.5% and 16.9%, respectively, at 10.5 bar of BMEP. Retarding the injection timing decreased the PRR while advancing injection timing increased it. As illustrated in Figure 4, retarded injection timing (5°CA bTDC) decreased the PRR by an average of 54.8%, while advanced injection timing (25°CA bTDC) increased the PRR by an average of 45.4 % compared to the original injection timing, at 4.5 bar BMEP. Similar results were observed at high load for both advanced and retarded injection timing.

5. Heat Release Rate

Heat release rate is a significant gauge of burning efficiency. This specific attribute shows adjustments in the overall performance, combustion, and pollutant formation. The heat release rate was simulated according to double Weibe and is given by [63]:
X b = { 1 e x p [ a 1 ( θ θ 1 Δ θ 1 ) m 1 + 1 ] } + { 1 e x p [ a 2 ( θ θ 2 Δ θ 2 ) m 2 + 1 ] }
where θ is the crank angle, θ1 and θ2 are the start of combustion, and θ1 and θ2 combustion duration m1, a1, m2, a2, and α are all shape factors. The apparent heat release rate is given by [4]:
d Q n d θ = d Q c o m b d θ d Q h t d θ = ( γ γ 1 ) P d V d θ + ( 1 γ 1 ) V d P d θ
where dQcomb and dQht are the heat released by the burning fuel and heat lost to the cylinder walls and are given by [63]:
d Q c o m b d θ = m f · L H V · d x b d θ
d Q h t d θ = h g A ( T g T w )
The ignition delay period was simulated based on the empirical formula developed by Hardenberg and Hase [4] and is given as follows:
τ i d ( C A ) = ( 0.36 + 0.22 S ¯ p ) e x p [ E A ( 1 R T 1 17,190 ) ( 21.2 p 12.4 ) 0.63 ]
where Sp is the mean piston speed and R is the universal gas constant, EA is the apparent activation energy, T and p are charge temperature and pressure during the delay.
Heat release rate as a function of crank angle is displayed in Figure 5. As illustrated in Figure 5, HRR decreased with the ascent of the butanol ratio in the mixture. As seen in Table 5, the maximum HRR was obtained at 224.6 J/°CA (at 4.9°CA aTDC), 212.8 J/°CA (at 4.5°CA aTDC), 190.2 J/°CA (at 5°CA aTDC), and 166.9 J/°CA (at 4.6°CA aTDC) for 0B, 5B, 15B, and 25B at 4.5 BMEP load and original IT 15°CA bTDC, respectively. The lower calorific value of butanol is lower than diesel, which reduces HRR. Additionally, butanol fuel has a lower cetane number compared to diesel fuel, which results in a lower cetane number for butanol-diesel blends, and this prolongs the ignition delay, thus, HRR decreases. As indicated in Figure 5, the HRR curve has two peaks. According Yao et al. [24] early injection timing shows such a phenomenon known as cool flame and hot flame premixed compression combustion. Chen [20] explained that such curves with two peaks occur under the maximum-torque condition due to two-injection strategy. In our study, since we have used the maximum torque, this could be the reason for the two peak curves. HRR increased with retarded injection timing and decreased with early IT for all fuel mixtures. The HRR compared to original IT increased by 2.9%, 2.5%, 1.7%, and 0.75% for 0B, 5B, 15B, and 25B, respectively, at 4.5 bar of BMEP and IT 5°CA bTDC. However, for the same load conditions HRR decreased by 5.3%, 4.6%, 3.3%, and 2.0% for 0B, 5B, 15B, and 25B, respectively, at advanced injection timing 25°CA bTDC, as illustrated in Figure 5. Similar trends were observed at high loads at both early and late injection timings. Diesel fuel has the highest heat release due to its higher calorific value in comparison with other fuels [64].

6. Cumulative Heat Release (CHR)

The cumulative heat release (CHR) as a function of crank angle for diesel and butanol-diesel is shown in Figure 6. It was found that at 4.5 bar of engine load the maximum CHR for diesel fuel operation was 3715 J compared to 3777, 3587, and 3217 J for 5B, 15B, and 25B, respectively, at 5°CA bTDC. As seen in Figure 6a, 5B had the highest CHR which was 3715 J (occurred at 23.05°CA aTDC). However, for the same engine load when the IT was advanced to 25°CA bTDC, the maximum CHR for 0B, 5B, 15B, and 25B increased by 9.64, 6.89, 2.93, and 3.88%, respectively, and 0B had the highest CHR, which was 4074 J (occurring at 4.96°CA aTDC) as seen Figure 6b. As depicted in Figure 6c,d, at higher engine loads (10.5 bar) the CHR increased due increased input fuel energy as compared to lower loads. For the same engine load conditions (10.5 bars), the maximum CHR of 5965 J (for 25B) and 5922 J (for 0B) were found at 5°CA and 25°CA bTDC, respectively. The CHR increased with increase in the engine load due to increased amount of liquid fuel in the combustion chamber.

7. In-Cylinder Temperature

The change in cylinder temperature with respect to crank angle is shown in Figure 7. It was found that increasing the n-butanol proportion in the mixture lowered the cylinder temperature. As illustrated in Figure 7, in comparison to 0B, the cylinder temperature decreased by 4.11%, 15.27%, and 24.75% for 5B, 10B, and 25B, respectively, at 4.5 bar BMEP load and IT 5°CA bTDC. Retarding injection timing caused a decrease in cylinder temperature for all the fuels at both the given loads. The temperature decreased by 3.8%, 3.3%, 4.2%, and 4.9%; for 0B, 5B, 15B, and 25B, respectively, at 4.5 bar of BMEP and IT of 5°CA bTDC. This is attributed to the large evaporation of butanol that caused a higher temperature reduction. Moreover, the addition of butanol reduces the cetane number, which increases the ignition delay period causing the temperature to decrease. Similar results were also observed at 10.5 bar BMEP and 5°CA bTDC. However, the cylinder temperature increased for early IT for all fuel mixtures. Advancing IT provoked an earlier start of combustion corresponding to the TDC. As consequence of this, the chamber charge, being compacted as the piston moved to the TDC, had comparatively higher temperatures. The cylinder temperature increased by 6.01%, 6.65%, 6.77%, and 7.26% for diesel, 5B, 15B, and 25B, respectively, at 10.5 bar of BMEP and IT of 25°CA bTDC as compared to original IT. At early IT, more energy is generated in the course of compression stroke, which results in an increased cylinder pressure and thus an increased temperature. Generally n-butanol has a temperature-lowering effect due to its lower calorific value and its higher heat of evaporation, which led to a decrease in cylinder temperature. The higher latent heating value of the blends absorbed more thermal heat during evaporation process, hence, reducing the in-cylinder temperature. As can be seen in Table 6 as the ratio of butanol increased in the blends the latent heat of vaporization of the blends also increased, which decreased the in-cylinder temperature. A similar decrease in cylinder temperatures for n-butanol-diesel blends were reported by Rakopoulos et al. [21,65], Swamy et al. [66] and Xiaobei et al. [45]

8. Diesel Engine Emissions

8.1. Nitrogen Oxides (NOX)

Exhaust gases contain oxides of nitrogen (nitric oxide, NO, and small amounts of nitrogendi-oxide, NO2 which are collectively known as NOX). The generation of NOx is profoundly reliant on in-chamber temperatures, the oxygen accumulation, and residence time for the reaction to occur. The most vital engine parameters that influence NOx formation are ignition delay, infusion timing, inter-cooling, combustion chamber design, injection rate, and compression ratio [67].
The nitric oxide formation was calculated based on the extended Zeldovich [4] mechanism and are given by [4,68]:
N + O k 1 + k 1   N O + N
N + O 2 k 2 + k 2   N O + N
N + O H k 3 + k 3   N O + H
where k+ and k are given as follows [4]:
k 1 + = 7.6 x 10 13 exp ( 38000 T )
k 2 + = 6.4 x 10 9 T [ e x p ( 3150 T ) ]
k 2 = 1.5 X 10 9 T [ e x p ( 19500 T ) ]
k 3 + = 4.1 x 10 13
k 3 = 2.0 x 10 14 e x p ( 23650 T )
NOX pollutants with respect to injection timing are depicted in Figure 8. NOx pollutants of the butanol blends were lower than those of diesel at both given loads, with the decrease being higher the higher the content of butanol in the mixture. Compared to 0B, the NOX emission decreased an average of 69% for the butanol blends at 4.5 bar and 5°CA bTDC. The increase in butanol ratio has the effect of prolonging the ignition delay which provides enough time for the fuel to mix with air to form a leaner mixture resulting in decreased NOx pollution. NOx pollutants diminished with an increasing engine load. For instance, it was found that NOx decreased by around 23.7%, 25.7%, 21.7%, and 5.3% for 0B, 5B, 15B, and 25B, respectively, as the load increases from 4.5 to 10.5 bar BMEP for IT of 5°CA bTDC. Injection timing fluctuations strongly impact NOx pollutions. When the IT was delayed, it was seen that NOx pollutants shrunk for all fuel mixtures at both low and high loads. As shown in Figure 8, at 4.5 bar of BMEP retarded injection timing (5°CA bTDC) reduced NOx emission by 49.4%, 61.5%, 76.7%, and 83.2% for 0B, 5B, 15B, and 25B compared to the original injection timing, respectively. Similar trends were also observed at high loads. Delaying the IT caused a decrease in cylinder pressure because more fuel is burned after top dead center (TDC). Lower cylinder pressures resulted in lower cylinder temperature subsequently; and the level of NOX emission is reduced. Moreover, the lower heating value of butanol, along with its higher latent heat of vaporization, decreases cylinder temperature thereby reducing the NOX emissions. There was a noteworthy increment in NOX with advanced injection timing compared to the original IT. For instance, at BMEP = 10.5 bar and advanced injection timing (25°CA bTDC) the NOx pollutant was found to be 1994.1, 1673.1, 875.3, and 248.9 ppm for 0B, 5B, 15B, and 25B, respectively, while at original injection timing 15°CA bTDC the NOX emission was found to be 1385.3, 919.7, 256.5, and 39.1 ppm for 0B, 5B, 15B, and 25B, respectively. The rise in NOX concentration with advanced IT is due to the higher combustion temperature, which resulted in greater NOX generation in the thermal-NO pathway. The results are in agreement with the finding of Yilmaz et al. [69] and Rahman et al. [70]. Huang et al. [41] reported that butanol–diesel blends produce lower NOX at all engine loads compared to diesel. They showed that the addition of up to 30% of butanol produced lower NOX due to lower LHV and lower combustion temperature. Similar results are also reported by Chen [71] who found that a higher ratio of butanol decreases NOx because of the higher heat of evaporation of butanol.

8.2. CO2 Pollution

CO2 emission demonstrates the total burning of the fuel. CO2 emission as a function of injection timing is shown Figure 9. The CO2 emissions for the diesel-butanol mixes were higher compared to diesel fuel. CO2 pollutants expanded with the expanding of butanol in the mixture. The use of biofuels permits a higher relative concentration of oxygen to prevail in the burning gases and this gave way to a higher transformation of CO to CO2 than for diesel fuel [10]. Subsequently, the CO2 pollutants rose. CO2 emissions ascended with the early IT and decreased with the retarded IT for all fuel blends. As portrayed in Figure 9, the CO2 emissions diminished by 19.1%, 12.7%, 5.7%, and 1.4%, for 0B, 5B, 15B, and 25B at low loads and IT of 5°CA bTDC, respectively. However, at IT of 25°CA bTDC the CO2 emissions for 0B, 5B, 15B, and 25B increased by 44.9%, 31.9%, 18.6%, and 10.9%, respectively. The main reason behind the decrease of CO2 with retarding IT is due to the shortened ignition delay that causes incomplete combustion, thereby decreasing the CO2.At higher loads the CO2 for all the fuels increased with advancing and retarding of IT. It was observed that the CO2 pollutants increased with the increasing load, as the engine load was augmented from 4.5 to 10.5 bar and IT of 25°CA bTDC, the CO2 emission for diesel, 5B, 15B, and 25B increased by 77.7%, 57.1%, 33.7%, and 18.8%, respectively. More fuel injection at higher loads, increased combustion temperature and oxidation rates are responsible for the higher CO2 at higher loads. The results conform to those in the literature [36,72,73,74].

8.3. CO Emission

The presence of carbon monoxide in the exhaust gas is a measure of loss in engine power. The generation of CO happens when the oxygen present amid burning is deficient to form CO2 [4]. Numerous scientists have demonstrated that the expansion of biofuels like ethanol and butanol diminishes the CO outflows since they have less carbon than diesel fuel and their oxygen content expands the oxygen to fuel proportion in the fuel abundant zones [75,76]. Carbon monoxide (CO) emission as a function of injection timing is depicted in Figure 10. The results showed that the CO emission of butanol-diesel blends were generally lower than that for diesel, with the decline being higher the higher the proportion of butanol in the blends. This is because of the enhancement of oxygen attributable to butanol expansion, as expanding the extent of oxygen will advance the oxidation of CO to CO2. In comparison to the original IT, the increase in CO pollutants was around 5.12%, 5.38%, 5.59%, and 5.56% for 0B, 10B, 15B, and 25B, respectively, at 4.5 bar BMEP load and retarded IT, as shown in Figure 10. The corresponding CO emissions for diesel (0B), 5B, 15B, and 25B were found to be 1109, 1044, 906, and 750 g/kW-h, respectively. However, for the same IT when the load was increased to 10.5 bar of BMEP the CO emission for diesel (0B), 5B, 15B, and 25B were 360.2, 307.9, 195.6, and 74.4 g/kW-h, respectively. The increase of CO with retarding IT timing could be due to lesser time for combustion resulting in incomplete combustion of the butanol-diesel blends and the increase in ignition delay could also be one of the reasons for these results. However, with advancing injection timing the butanol-diesel blends had enough time to undergo a complete combustion, thereby reducing the CO emissions. At higher loads when injection timing was advanced and delayed reduced CO pollutants were noticed for the blends. The results of the CO pollutants concur with those detailed by Yao et al. [24], as the addition of oxygenated n-butanol markedly diminished CO pollutants. Similar findings were reported by other researchers [9,65]. Most of the studies [31,36,60] confirm that butanol addition to diesel decreases CO emissions. However, there are few researchers who reported that the addition of n-butanol increases the CO emissions due to lower gas temperature in the late expansion process [77] and the deficiency of air at the fuel rich zone [71].

8.4. HC Emission

Hydrocarbons are a consequence of deficient burning of hydrocarbon fuel [4]. Figure 11 illustrates the unburned hydrocarbons (HC) emissions as a function of injection timing. It was found that the HC emission of the blends were greater than that of diesel fuel, with the rise being greater the greater the ratio of butanol in the mixture. The reason behind the expanded HC emanations with the expansion of butanol is because of the higher heat of evaporation of the butanol mixes causing slower evaporation and slower and poorer fuel-air mixing, which increased spray penetration, causing undesirable fuel encroachment on the chamber walls [4]. For instance, in comparison with diesel (0B), it was observed that the HC emissions increased by 2.4%, 11.4%, and 14.6% for 5B, 15B, and 25B at 4.5 bar of BMEP at retarded injection timing of 5°CA bTDC, respectively. Among the fuels 25B has the highest HC emissions for both advancing and retarding IT. There was a notable increment in HC emissions at both early and late injection timings. Compared to the original IT for both the given loads (4.5 and 10.5 bar) at 5°CA bTDC the HC emissions increased. The HC emissions compared to original injection timing rose by 153.5%, 148.9%, 151.7%, and 143.9% for 0B, 5B, 15B, and 25B, respectively, at 4.5 bar BMEP engine load and late IT of 5°CA bTDC, as shown in Figure 11. Likewise, at 10.5 bar the HC increased by 134.1%, 138.7%, 129.7%, and 130.7% for 0B, 5B, 15B, and 25B, respectively. Non-uniform mixing of fuel, cold starting, lean combustion, and poor spray causing wall wetting could be the reasons responsible for these results. Another explanation for the expansion of HC is the increase in ignition delay which prompts a lower burning temperature that give rise to higher HC. It was observed that early IT caused a minor decrease in HC pollutants. Compared to the original IT i.e., 15°CA, HC emissions decreased an average of 3.6% and 2.4% corresponding to engine loads of 4.5 bar and 10.5 bar, respectively, for 25°CA bTDC. This could be because of the earlier start of burning that resulted in higher cylinder temperatures, hence, decreased HC emissions. Furthermore, with advancing the IT, the lower cetane number of butanol-diesel blends caused a prolonged ignition delay period. This raised the in-cylinder temperature and pressure increased in the oxidation process of hydrocarbon fuels, hence, the HC emissions are decreased. HC pollutants were higher at low loads; it was found that HC emissions decreased by around by 27.9%, 24.8%, 27.9%, and 24.7% for 0B, 5B, 15B, and 25B, respectively, as the engine load augmented from 4.5 to 10.5 bar of BMEP for 5°CA bTDC. In the literature it has also been reported that the presence of alcohol in the blends contributes to the increment of HC pollutants. The variations of HC emissions with the addition of butanol are consistent with the results of Chen [71], Rakopoulos [21], and Siwale [31]. A similar HC trend in butanol-diesel blends can be found in [9,73,74].

9. Diesel Engine Performance

9.1. Exhaust Gas Temperature

Exhaust gas temperature (EGT) with respect to injection timing for the various fuels is depicted in Figure 12. Compared to 0B the EGT decreased marginally for 5B and 15B. However, the EGT for 25B was slightly higher than that of 0B. EGT increased with the rising of loads for all the fuels due to more fuel injection at higher loads, which increases combustion temperature, hence, it increased. Compared to the original IT the EGT increased at both early and late IT. As illustrated in Figure 12a, EGT increased on average of 2–3% and 3–5% for retarded IT (5°CA bTDC) and advanced IT (25°CA bTDC), respectively. It was observed that 15B has the lowest EGT among the blends at 15°CA bTDC i.e., 628.3 K and 0B has the highest at advanced IT 25°CA bTDC i.e., 663.2 K. At higher loads EGT has a different trend from those of lower loads. At higher loads slightly higher EGT were achieved for the butanol blends compared to 0B. This is primarily due to the higher level of the amount of oxygen in butanol which increases oxygen-rich areas in the burning chamber giving rise to higher in-cylinder temperatures and EGT. As shown in Figure 12b, EGT increased by an average of 8.5% for retarded injection timing and it reduced by an average of 2.7% for advanced injection timing compared to the original injection timing. It was found that 25B has the highest EGT among the blends at retarded IT 5°CA bTDC and BMEP = 10.5 bar, i.e., 998.4 K.

9.2. Brake Thermal Efficiency

The brake thermal efficiency (BTE) as a function of injection timing is shown in Figure 13. BTE was marginally higher for the blends compared to diesel fuel operation, it became higher when higher content of butanol were used in the blend. For instance, in comparison to 0B, BTE increased by 5.7%, 19.4%, and 37.3% for 5B, 10B, and 25B, respectively, at 4.5 bar BMEP load and retarded injection timing 5°CA bTDC. It was observed that there was insignificant change in BTE with advancing and retarding the injection timings for all the engine loads. The highest BTE was achieved with 25B for all the engine loads. The 25B fuel blend at 10.5 bar of BMEP and advanced injection timing 25°CA bTDC gave the highest BTE, i.e., 31.04%. The increment in BTE is because of the higher content of oxygen in butanol which resulted in a more complete combustion in the fuel-rich regions, subsequently enhancing the burning productivity. In addition, heat losses decreased in the cylinder as a result of lower flame temperature of butanol than that of diesel fuel operation [72]. As depicted in Figure 14, the results showed that the heat transfer coefficient for the blends was lower at early and late injection timings when compared with diesel fuel which resulted in decreased heat losses and increased BTE. The lower cetane number of butanol results in a longer ignition delay which involves a speedy rate of energy discharge that lessens the heat loss from the engine as a result of there not being enough time for this heat to depart the cylinder through heat transfer with the coolant.

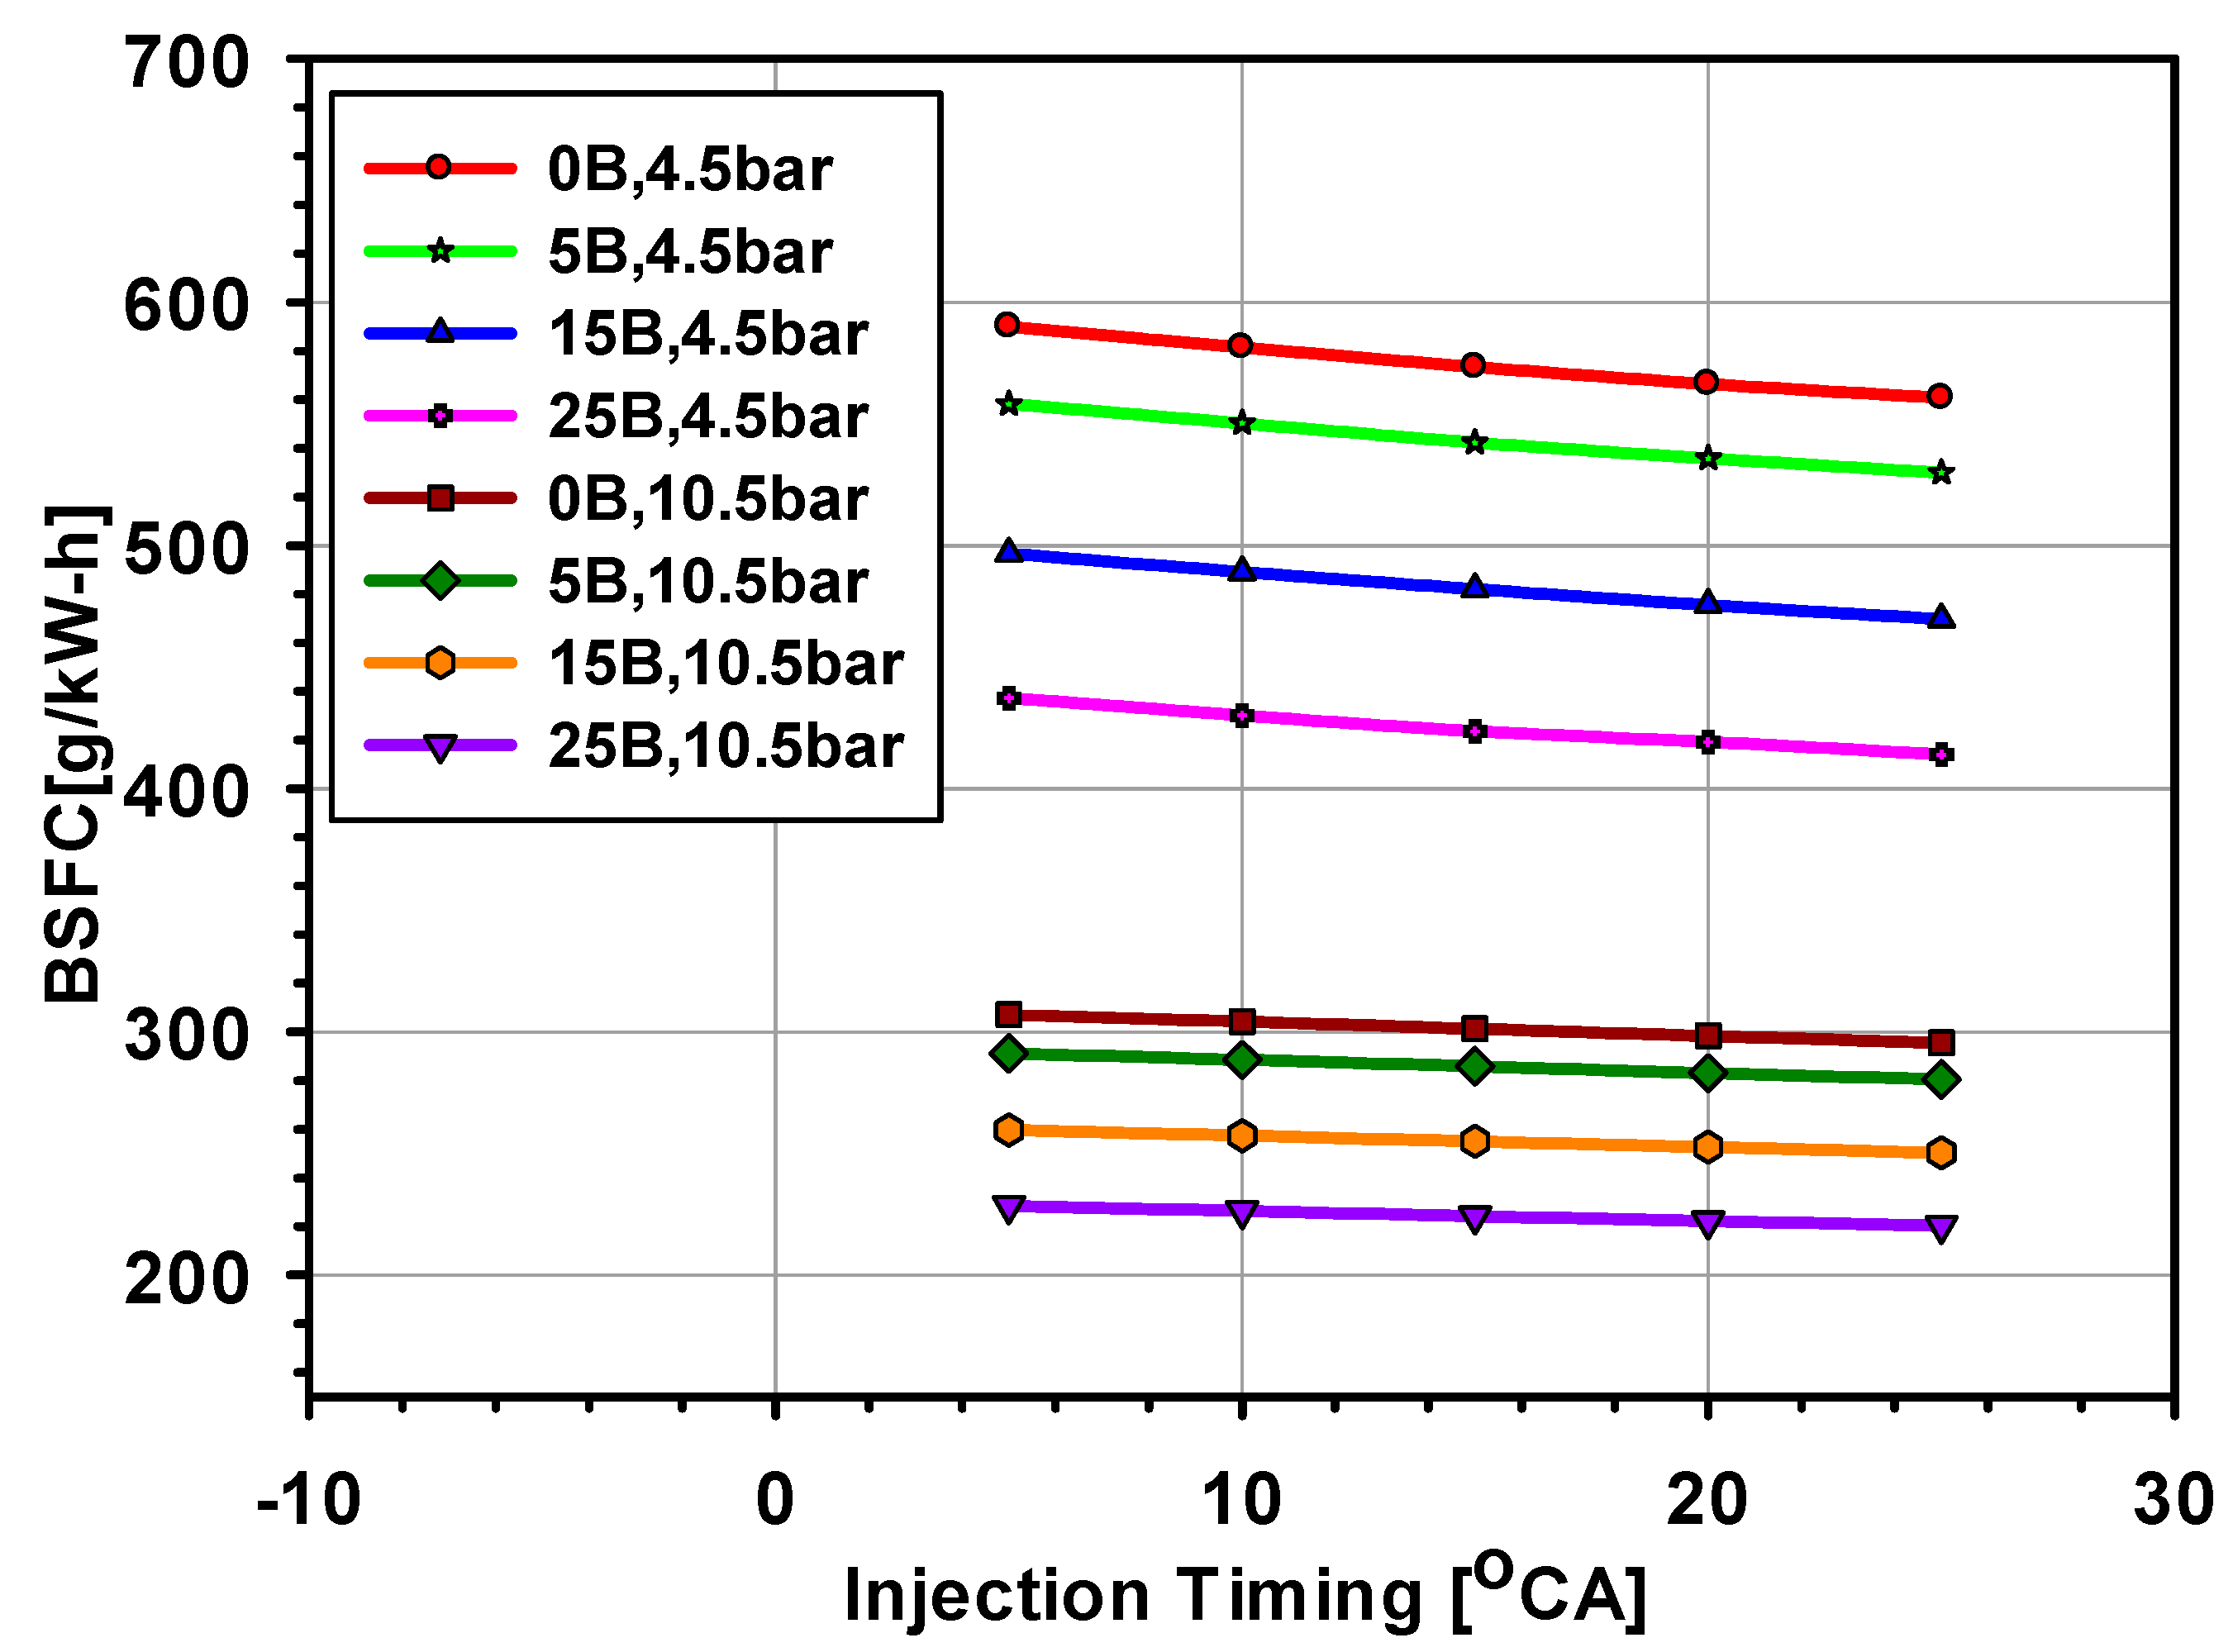
9.3. Brake Specific Fuel Consumption (BSFC)

The brake specific fuel consumption (BSFC) as a function of injection timing is shown in Figure 15. BSFC of the butanol blends were lower than those of diesel fuel at all engine loads, with the decrease being higher the higher the content of butanol in the mixture. Compared to 0B, BSFC for 5B, 15B, and 25B decreased by 5.4%, 15.8%, and 25.9% at 4.5 bar and 5°CA bTDC, respectively. It was observed that retarded injection timing increased BSFC while early IT decreased BSFC for all the fuel mixtures. As shown in Figure 15, at 4.5 bar of BMEP retarded injection timing (5°CA bTDC) increased BSFC by an average of 3% and advanced injection timing (25°CA bTDC) reduced BSFC by an average of 2.3%. Similar trends were also observed at high loads. At BMEP = 10.5 bar and advanced injection timing (25°CA bTDC) lowest BSFC values were observed for all the fuel mixtures. The minimum BSFC values corresponding to 0B, 5B, 15B, and 25B were found to be 295.5, 280.5, 250.4, and 220.4 g/g/kW-h. In terms of BSFC compared with original injection timing 25°CA bTDC gave good results.

10. Conclusions

This paper investigated the impact of injection timing on the performance and exhaust emission of a six cylinder turbocharged engine using diesel fuel and three butanol-diesel blends. The following are our conclusions:
It was observed that advanced injection timing slightly improved the BTE for all engine loads. The BTEs were increased by 5.7%, 19.4%, and 37.2%, for 5B, 15B, and 25B, respectively, compared to 0B. The BSFC decreased slightly with increasing n-butanol content in fuel blends.
NOx pollutants were reduced with increasing the n-butanol ratio in the blends and retarded injection timing. Retarded injection timing of 5°CA bTDC decreased NOX by an average of more than 50% for all the fuels at both the loads. The minimum NOx emission was found to be 633.1, 320.8, 59.6, and 7.56 ppm for 0B, 5B, 15B, and 25B obtained at 5°CA BTDC, respectively.
The results demonstrated that n-butanol addition significantly reduced CO emissions. Increasing butanol content in the mixture reduced CO emissions due to higher oxygen/carbon ratio of butanol. Minimum CO emission is 315.2, 271.6, and 178.8 g/kW-h for 0B, 5B, and 15B obtained at advanced injection timing 25°CA bTDC, respectively, and 74.4 g/kW-h for 25B at retarded injection timing 5°CA bTDC
Both HC and CO2 emissions increased with increasing n-butanol content in fuel blends with respect to 0B. Retarded injection timing (5°CA bTDC and 10°CA bTDC) and original injection timing (15°CA bTDC) gave minimum CO2 emissions at low and high loads, respectively. Advanced injection timing of 25°CA bTDC gave minimum HC emissions for all the fuel at all engine loads.
A general conclusion of this study is that retarded Injection timing of 10°CA bTDC gives optimum performance, combustion, and lower emissions when compared with the original Injection timing of 15°CA bTDC. Among the fuels 15B showed good results in terms of BTE, higher heat release rate, and lower emissions of HC, CO, and NOx. Hence, 15B can be effectively used with injection timing of 10°CA bTDC.

Author Contributions

Conceptualization, simulation, data analysis and paper writing S.A.A.; Supervision and funding acquisition, S.Z. and Y.F.; Methodology Y.Z.; Validation and writing-review and editing N.A. and A.M.

Funding

The authors wish to thank the financial support of National Key R and D Program of China (grant No.2016YFC0205400 and No. 2016YFC0205202).

Conflicts of Interest

No potential conflict of interest was reported by the authors.

Nomenclature

QcombTotal heat released
dQnApparent heat release rate
mfMass of fuel
QhtHeat lost to the cylinder walls
PCylinder Pressure
TgThe gas instantaneous temperature
θoStart of combustion
ΔθbCombustion duration
TcCritical temperature of butanol
xMolar fraction of butanol
µLViscosity at liquid phase
µV Viscosity at vapor phase
xbMass fraction of burned gases
TwCylinder wall temperature
ACylinder heat transfer area
hgHeat transfer coefficient
VCylinder volume
γRatio of specific heats
BTEBrake thermal efficiency
°CADegrees of crank angle
BMEPBrake mean effective pressure
CO Carbon monoxide
CO2Carbon dioxide
NOXNitrogen oxides
HC Hydrocarbon
LHVLower heating value
BSFC Brake specific fuel consumption
ITInjection timing
ppmParts per million
EGTExhaust gas temperature
PRRPressure rise rate

References

  1. Bayraktar, H. An Experimental Study on the Performance Parameters of an Experimental Ci Engine Fueled with Diesel–Methanol–Dodecanol Blends. Fuel 2008, 87, 158–164. [Google Scholar] [CrossRef]
  2. Liu, J.; Yao, A.; Yao, C. Effects of Injection Timing on Performance and Emissions of a Hd Diesel Engine with Dmcc. Fuel 2014, 134, 107–113. [Google Scholar] [CrossRef]
  3. Broatch, A.; Luján, J.M.; Ruiz, S.; Olmeda, P. Measurement of Hydrocarbon and Carbon Monoxide Emissions During the Starting of Automotive Di Diesel Engines. Int. J. Automot. Technol. 2008, 9, 129–140. [Google Scholar] [CrossRef]
  4. Heywood, J.B. Internal Combustion Engine Fundamentals; McGraw-Hill Education: New York, NY, USA, 1988. [Google Scholar]
  5. Stone, R. Introduction to Internal Combustion Engines; Springer: Berlin/Heidelberg, Germany, 1999. [Google Scholar]
  6. Angelica, H.; Golubkov, I.; Kronberg, B.; van Stam, J. Alternative Fuel for a Standard Diesel Engine. Int. J. Engine Res. 2006, 7, 51–63. [Google Scholar]
  7. Yilmaz, N.; Vigil, F.M. Potential Use of a Blend of Diesel, Biodiesel, Alcohols and Vegetable Oil in Compression Ignition Engines. Fuel 2014, 124, 168–172. [Google Scholar] [CrossRef]
  8. Sarathy, S.M.; Thomson, M.J.; Togbé, C.; Dagaut, P.; Halter, F.; Mounaim-Rousselle, C. An Experimental and Kinetic Modeling Study of N-Butanol Combustion. Combust. Flame 2009, 156, 852–864. [Google Scholar] [CrossRef]
  9. Doğan, O. The Influence of N-Butanol/Diesel Fuel Blends Utilization on a Small Diesel Engine Performance and Emissions. Fuel 2011, 90, 2467–2472. [Google Scholar] [CrossRef]
  10. Sayin, C. Engine Performance and Exhaust Gas Emissions of Methanol and Ethanol–Diesel Blends. Fuel 2010, 89, 3410–3415. [Google Scholar] [CrossRef]
  11. Rakopoulos, D.C.; Rakopoulos, C.D.; Papagiannakis, R.G.; Kyritsis, D.C. Combustion Heat Release Analysis of Ethanol or N-Butanol Diesel Fuel Blends in Heavy-Duty Di Diesel Engine. Fuel 2011, 90, 1855–1867. [Google Scholar] [CrossRef]
  12. Abu-Qudais, M.; Haddad, O.; Qudaisat, M. The Effect of Alcohol Fumigation on Diesel Engine Performance and Emissions. Energy Convers. Manag. 2000, 41, 389–399. [Google Scholar] [CrossRef]
  13. Ajav, E.A.; Singh, B.; Bhattacharya, T.K. Thermal Balance of a Single Cylinder Diesel Engine Operating on Alternative Fuels. Energy Convers. Manag. 2000, 41, 1533–1541. [Google Scholar] [CrossRef]
  14. da Silva, T.; Roberto, W.; dos Santos, R.G. Review on the Characteristics of Butanol, Its Production and Use as Fuel in Internal Combustion Engines. Renew. Sustain. Energy Rev. 2017, 69, 642–651. [Google Scholar]
  15. Green, E.M. Fermentative Production of Butanol—The Industrial Perspective. Curr. Opinion Biotechnol. 2011, 22, 337–343. [Google Scholar] [CrossRef] [PubMed]
  16. Dürre, P. Biobutanol: An Attractive Biofuel. Biotechnol. J. Healthc. Nutr. Technol. 2007, 2, 1525–1534. [Google Scholar] [CrossRef]
  17. Algayyim, S.J.b.M.; Wandel, A.P.; Yusaf, T.; Hamawand, I. Production and Application of Abe as a Biofuel. Renew. Sustain. Energy Rev. 2018, 82, 1195–1214. [Google Scholar] [CrossRef]
  18. Koonin, S.E. Getting Serious About Biofuels; American Association for the Advancement of Science: Washington, DC, USA, 2006. [Google Scholar]
  19. World, Research Reports. N-Butanol Market 2019 |Global Industry Analysis by Trends, Size, Share, Company Overview, Growth and Forecast by 2025; Latest Research Report; Research Reports World: Pune, India, 11 April 2019. [Google Scholar]
  20. Chen, Z.; Liu, J.; Han, Z.; Du, B.; Liu, Y.; Lee, C. Study on Performance and Emissions of a Passenger-Car Diesel Engine Fueled with Butanol–Diesel Blends. Energy 2013, 55, 638–646. [Google Scholar] [CrossRef]
  21. Rakopoulos, D.C.; Rakopoulos, C.D.; Giakoumis, E.G.; Dimaratos, A.M.; Kyritsis, D.C. Effects of Butanol–Diesel Fuel Blends on the Performance and Emissions of a High-Speed Di Diesel Engine. Energy Convers. Manag. 2010, 51, 1989–1997. [Google Scholar] [CrossRef]
  22. Lapuerta, M.; Hernández, J.J.; Rodríguez-Fernández, J.; Barba, J.; Ramos, A.; Fernández-Rodríguez, D. Emission Benefits from the Use of N-Butanol Blends in a Euro 6 Diesel Engine. Int. J. Engine Res. 2018, 19, 1099–1112. [Google Scholar] [CrossRef]
  23. Yusri, I.M.; Mamat, R.; Ali, O.M.; Aziz, A.; Akasyah, M.K.; Kamarulzaman, M.K.; Ihsan, C.K.; Mahmadul, H.M.; Rosdi, S.M. Combustion and Emissions Characteristics of a Compression Ignition Engine Fueled with N-Butanol Blends; Paper presented at the IOP Conference Series: Materials Science and Engineering; IOP Publishing Ltd.: Bristol, UK, 2015. [Google Scholar]
  24. Yao, M.; Wang, H.; Zheng, Z.; Yue, Y. Experimental Study of N-Butanol Additive and Multi-Injection on Hd Diesel Engine Performance and Emissions. Fuel 2010, 89, 2191–2201. [Google Scholar] [CrossRef]
  25. Li, Y.; Gong, J.; Yuan, W.; Fu, J.; Zhang, B.; Li, Y. Experimental Investigation on Combustion, Performance, and Emissions Characteristics of Butanol as an Oxygenate in a Spark Ignition Engine. Adv. Mech. Eng. 2017, 9. [Google Scholar] [CrossRef]
  26. Leach, F.; Stone, R.; Davy, M.; Richardson, D. Comparing the Effect of Different Oxygenate Components on Pn Emissions from Gdi Engines; Institution of Mechanical Engineers: London, UK, 2015. [Google Scholar]
  27. Merola, S.S.; Tornatore, C.; Marchitto, L.; Valentino, G.; Corcione, F.E. Experimental Investigations of Butanol-Gasoline Blends Effects on the Combustion Process in a Si Engine. Int. J. Energy Environ. Eng. 2012, 3, 6. [Google Scholar] [CrossRef]
  28. Elfasakhany, A. Experimental Study on Emissions and Performance of an Internal Combustion Engine Fueled with Gasoline and Gasoline/N-Butanol Blends. Energy Convers. Manag. 2014, 88, 277–283. [Google Scholar] [CrossRef]
  29. Szwaja, S.; Naber, J.D. Combustion of N-Butanol in a Spark-Ignition Ic Engine. Fuel 2010, 89, 1573–1582. [Google Scholar] [CrossRef]
  30. Gu, X.; Huang, Z.; Cai, J.; Gong, J.; Wu, X.; Lee, C. Emission Characteristics of a Spark-Ignition Engine Fuelled with Gasoline-N-Butanol Blends in Combination with Egr. Fuel 2012, 93, 611–617. [Google Scholar] [CrossRef]
  31. Siwale, L.; Kristóf, L.; Adam, T.; Bereczky, A.; Mbarawa, M.; Penninger, A.; Kolesnikov, A. Combustion and Emission Characteristics of N-Butanol/Diesel Fuel Blend in a Turbo-Charged Compression Ignition Engine. Fuel 2013, 107, 409–418. [Google Scholar] [CrossRef]
  32. Fayad, M.A.; Tsolakis, A.; Fernández-Rodríguez, D.; Herreros, J.M.; Martos, F.J.; Lapuerta, M. Manipulating Modern Diesel Engine Particulate Emission Characteristics through Butanol Fuel Blending and Fuel Injection Strategies for Efficient Diesel Oxidation Catalysts. Appl. Energy 2017, 190, 490–500. [Google Scholar] [CrossRef]
  33. Jin, C.; Yao, M.; Liu, H.; Chia-fon, F.L.; Ji, J. Progress in the Production and Application of N-Butanol as a Biofuel. Renew. Sustain. Energy Rev. 2011, 15, 4080–4106. [Google Scholar] [CrossRef]
  34. Mofijur, M.; Rasul, M.G.; Hyde, J.; Azad, A.K.; Mamat, R.; Bhuiya, M.M.K. Role of Biofuel and Their Binary (Diesel–Biodiesel) and Ternary (Ethanol–Biodiesel–Diesel) Blends on Internal Combustion Engines Emission Reduction. Renew. Sustain. Energy Rev. 2016, 53, 265–278. [Google Scholar] [CrossRef]
  35. Choi, B.; Jiang, X.; Kim, Y.K.; Jung, G.; Lee, C.; Choi, I.; Song, C.S. Effect of Diesel Fuel Blend with N-Butanol on the Emission of a Turbocharged Common Rail Direct Injection Diesel Engine. Appl. Energy 2015, 146, 20–28. [Google Scholar] [CrossRef]
  36. Nayyar, A.; Sharma, D.; Soni, S.L.; Mathur, A. Experimental Investigation of Performance and Emissions of a Vcr Diesel Engine Fuelled with N-Butanol Diesel Blends under Varying Engine Parameters. Environ. Sci. Pollut. Res. 2017, 24, 20315–20329. [Google Scholar] [CrossRef]
  37. Herzog, P.L.; Bürgler, L.; Winklhofer, E.; Zelenka, P.; Cartellieri, W. Nox Reduction Strategies for Di Diesel Engines; SAE Technical Paper; SAE International: Warrendale, PA, USA, 1992. [Google Scholar]
  38. Erlach, H.; Chmela, F.; Cartellieri, W.; Herzog, P. Pressure Modulated Injection and Its Effect on Combustion and Emissions of a Hd Diesel Engine; Society of Automotive Engineers, Inc.: Warrendale, PA, USA, 1995. [Google Scholar]
  39. Obert, E.F. Internal Combustion Engines and Air Pollution; Harper & Row Publishers: New York, NY, USA, 1973. [Google Scholar]
  40. Funai, K.; Yamaguchi, T.; Itoh, S. Injection Rate Shaping Technology with Common Rail Fuel System (Ecd-U2); SAE Technical Paper; SAE International: Warrendale, PA, USA, 1996. [Google Scholar]
  41. Huang, H.; Liu, Q.; Yang, R.; Zhu, T.; Zhao, R.; Wang, Y. Investigation on the Effects of Pilot Injection on Low Temperature Combustion in High-Speed Diesel Engine Fueled with N-Butanol–Diesel Blends. Energy Convers. Manag. 2015, 106, 748–758. [Google Scholar] [CrossRef]
  42. Shuai, S.; Abani, N.; Yoshikawa, T.; Reitz, R.D.; Park, S.W. Evaluation of the Effects of Injection Timing and Rate-Shape on Diesel Low Temperature Combustion Using Advanced Cfd Modeling. Fuel 2009, 88, 1235–1244. [Google Scholar] [CrossRef]
  43. Algayyim, S.; Wandel, A.; Yusaf, T. The Impact of Injector Hole Diameter on Spray Behaviour for Butanol-Diesel Blends. Energies 2018, 11, 1298. [Google Scholar] [CrossRef]
  44. Zhu, Y.; Chen, Z.; Liu, J. Emission, Efficiency, and Influence in a Diesel N-Butanol Dual-Injection Engine. Energy Convers. Manag. 2014, 87, 385–391. [Google Scholar] [CrossRef]
  45. Cheng, X.; Li, S.; Yang, J.; Liu, B. Investigation into Partially Premixed Combustion Fueled with N-Butanol-Diesel Blends. Renew. Energy 2016, 86, 723–732. [Google Scholar] [CrossRef]
  46. Raeie, N.; Emami, S.; Sadaghiyani, O.K. Effects of Injection Timing, before and after Top Dead Center on the Propulsion and Power in a Diesel Engine. Propuls. Power Res. 2014, 3, 59–67. [Google Scholar] [CrossRef]
  47. Zhao, H. Advanced Direct Injection Combustion Engine Technologies and Development: Diesel Engines; Elsevier: Amsterdam, The Netherlands, 2009; Volume 2. [Google Scholar]
  48. Folkson, Richard. Alternative Fuels and Advanced Vehicle Technologies for Improved Environmental Performance: Towards Zero Carbon Transportation; Elsevier: Amsterdam, The Netherlands, 2014. [Google Scholar]
  49. Altun, S.; Oner, C.; Yasar, F.; Adin, H. Effect of N-Butanol Blending with a Blend of Diesel and Biodiesel on Performance and Exhaust Emissions of a Diesel Engine. Ind. Eng. Chem. Res. 2011, 50, 9425–9430. [Google Scholar] [CrossRef]
  50. Kumar, S.; Cho, J.H.; Park, J.; Moon, I. Advances in Diesel–Alcohol Blends and Their Effects on the Performance and Emissions of Diesel Engines. Renew. Sustain. Energy Rev. 2013, 22, 46–72. [Google Scholar] [CrossRef]
  51. Kumar, B.R.; Saravanan, S. Use of Higher Alcohol Biofuels in Diesel Engines: A Review. Renew. Sustain. Energy Rev. 2016, 60, 84–115. [Google Scholar] [CrossRef]
  52. Moss, J.T.; Berkowitz, A.M.; Oehlschlaeger, M.A.; Biet, J.; Warth, V.; Glaude, P.; Battin-Leclerc, F. An Experimental and Kinetic Modeling Study of the Oxidation of the Four Isomers of Butanol. J. Phys. Chem. A 2008, 112, 43–55. [Google Scholar] [CrossRef]
  53. Grana, R.; Frassoldati, A.; Faravelli, T.; Niemann, U.; Ranzi, E.; Seiser, R.; Cattolica, R.; Seshadri, K. An Experimental and Kinetic Modeling Study of Combustion of Isomers of Butanol. Combust. Flame 2010, 157, 2137–2154. [Google Scholar] [CrossRef]
  54. Gu, X.; Huang, Z.; Wu, S.; Li, Q. Laminar Burning Velocities and Flame Instabilities of Butanol Isomers–Air Mixtures. Combust. Flame 2010, 157, 2318–2325. [Google Scholar] [CrossRef]
  55. Gu, X.; Li, G.; Jiang, X.; Huang, Z.; Lee, C. Experimental Study on the Performance of and Emissions from a Low-Speed Light-Duty Diesel Engine Fueled with N-Butanol–Diesel and Isobutanol–Diesel Blends. Proc. Inst. Mech. Eng. Part D J. Automob. Eng. 2013, 227, 261–271. [Google Scholar] [CrossRef]
  56. Ahmed, S.A.; Zhou, S.; Zhu, Y.; Feng, Y. Numerical Investigation of N-Butanol Addition on the Performance and Emission Characteristics of Ci Diesel Engine. Int. Energy J. 2018, 18, 1867–1879. [Google Scholar]
  57. da Rocha, R.C.; Alviso, D.A.; Darabiha, N.; Santos, R.G. Comparison between N-Butanol and Ethanol Combustion Kinetic Models through One-Dimensional Premixed Flame Simulations. In Proceedings of the 23rd ABCM International Congress of Mechanical Engineering, Rio de Janiero, RJ, Brazil, 6–11 December 2015. [Google Scholar]
  58. Gmehling, J.; Kolbe, B.; Kleiber, M.; Rarey, J. Chemical Thermodynamics for Process Simulation; Wiley-VCH: Weinheim, Germany, 2012. [Google Scholar]
  59. Wallner, T.; Miers, S.A.; McConnell, S. A Comparison of Ethanol and Butanol as Oxygenates Using a Direct-Injection, Spark-Ignition Engine. J. Eng. Gas Turbines Power 2009, 131, 129–139. [Google Scholar] [CrossRef]
  60. Lamani, V.; Tavareppa; Yadav, A.K.; Gottekere, K.N. Performance, Emission, and Combustion Characteristics of Twin-Cylinder Common Rail Diesel Engine Fuelled with Butanol-Diesel Blends. Environ. Sci. Pollut. Res. 2017, 24, 23351–23362. [Google Scholar] [CrossRef]
  61. Tesfa, B.; Mishra, R.; Zhang, C.; Gu, F.; Ball, A.D. Combustion and Performance Characteristics of Ci (Compression Ignition) Engine Running with Biodiesel. Energy 2013, 51, 101–115. [Google Scholar] [CrossRef]
  62. Sayin, C.; Canakci, M. Effects of Injection Timing on the Engine Performance and Exhaust Emissions of a Dual-Fuel Diesel Engine. Energy Convers. Manag. 2009, 50, 203–213. [Google Scholar] [CrossRef]
  63. Medina, A.; Curto-Risso, P.L.; Hernández, A.C.; Guzmán-Vargas, L.; Angulo-Brown, F.; Sen, A.K. Quasi-Dimensional Simulation of Spark Ignition Engines; Springer: Berlin/Heidelberg, Germany, 2014. [Google Scholar]
  64. Gumus, M. A Comprehensive Experimental Investigation of Combustion and Heat Release Characteristics of a Biodiesel (Hazelnut Kernel Oil Methyl Ester) Fueled Direct Injection Compression Ignition Engine. Fuel 2010, 89, 2802–2814. [Google Scholar] [CrossRef]
  65. Rakopoulos, D.C.; Rakopoulos, C.D.; Hountalas, D.T.; Kakaras, E.C.; Giakoumis, E.G.; Papagiannakis, R.G. Investigation of the Performance and Emissions of Bus Engine Operating on Butanol/Diesel Fuel Blends. Fuel 2010, 89, 2781–2790. [Google Scholar] [CrossRef]
  66. Swamy, R.L.; Chandrashekar, T.K.; Banapurmath, N.R.; Khandal, S.V. Impact of Diesel-Butanol Blends on Performance and Emission of Diesel Engine. J. Oil Gas Res. 2015, 1, 101. [Google Scholar]
  67. Ikegami, M.; Nakatani, K.; Tanaka, S.; Yamane, K. Fuel Injection Rate Shaping and Its Effect on Exhaust Emissions in a Direct-Injection Diesel Engine Using a Spool Acceleration Type Injection System; SAE Technical Paper; SAE International: Warrendale, PA, USA, 1997. [Google Scholar]
  68. Ferguson, C.R.; Kirkpatrick, A.T. Internal Combustion Engines: Applied Thermosciences; John Wiley & Sons: Hoboken, NJ, USA, 2015. [Google Scholar]
  69. Yilmaz, N.; Vigil, F.M.; Benalil, K.; Davis, S.M.; Calva, A. Effect of Biodiesel–Butanol Fuel Blends on Emissions and Performance Characteristics of a Diesel Engine. Fuel 2014, 135, 46–50. [Google Scholar] [CrossRef]
  70. Rahman, M.M.; Rasul, M.G.; Hassan, N.M.S.; Azad, A.K.; Uddin, M.N. Effect of Small Proportion of Butanol Additive on the Performance, Emission, and Combustion of Australian Native First-and Second-Generation Biodiesel in a Diesel Engine. Environ. Sci. Pollut. Res. 2017, 24, 22402–22413. [Google Scholar] [CrossRef] [PubMed]
  71. Chen, Z.; Wu, Z.; Liu, J.; Lee, C. Combustion and Emissions Characteristics of High N-Butanol/Diesel Ratio Blend in a Heavy-Duty Diesel Engine and Egr Impact. Energy Convers. Manag. 2014, 78, 787–795. [Google Scholar] [CrossRef]
  72. Ramadhas, A.S. Alternative Fuels for Transportation; CRC Press: Boca Raton, FL, USA, 2016. [Google Scholar]
  73. Lujaji, F.; Kristóf, L.; Bereczky, A.; Mbarawa, M. Experimental Investigation of Fuel Properties, Engine Performance, Combustion and Emissions of Blends Containing Croton Oil, Butanol, and Diesel on a Ci Engine. Fuel 2011, 90, 505–510. [Google Scholar] [CrossRef]
  74. Şahin, Z.; Aksu, O.N. Experimental Investigation of the Effects of Using Low Ratio N-Butanol/Diesel Fuel Blends on Engine Performance and Exhaust Emissions in a Turbocharged Di Diesel Engine. Renew. Energy 2015, 77, 279–290. [Google Scholar] [CrossRef]
  75. Choi, C.-Y.; Reitz, R.D. An Experimental Study on the Effects of Oxygenated Fuel Blends and Multiple Injection Strategies on Di Diesel Engine Emissions. Fuel 1999, 78, 1303–1317. [Google Scholar] [CrossRef]
  76. Praptijanto, A.; Muharam, A.; Nur, A.; Putrasari, Y. Effect of Ethanol Percentage for Diesel Engine Performance Using Virtual Engine Simulation Tool. Energy Procedia 2015, 68, 345–354. [Google Scholar] [CrossRef] [Green Version]
  77. Miers, S.A.; Carlson, R.W.; McConnell, S.S.; Ng, H.K.; Wallner, T.; Esper, J.L. Drive Cycle Analysis of Butanol/Diesel Blends in a Light-Duty Vehicle; SAE Technical Paper; SAE International: Warrendale, PA, USA, 2008. [Google Scholar]
Figure 1. Engine model.
Processes 07 00299 g001
Figure 2. (a) The comparison of in-cylinder pressure between numerical and experimental for diesel (BU0); (b) the comparison of BTE between numerical and experimental for BU0, BU10, and BU20; and (c) the comparison of in-cylinder pressure between numerical and experimental for BU10 and BU20.
Processes 07 00299 g002
Figure 3. Variation of in-cylinder pressure: (a) BMEP 4.5 bar, injection timing 5°CA bTDC; (b) BMEP 4.5 bar, injection timing 25°CA bTDC; (c) BMEP 10.5 bar, injection timing 5°CA bTDC; and (d) BMEP 10.5 bar, injection timing 25°CA bTDC.
Processes 07 00299 g003aProcesses 07 00299 g003b
Figure 4. Variation of pressure rise rate with injection timing for diesel and butanol blends at BMEP = 4.5 bar and 10.5 bar.
Processes 07 00299 g004
Figure 5. Variation of heat release rate: (a) BMEP 4.5 bar, injection timing 5°CA bTDC; (b) BMEP 4.5 bar, injection timing 25°CA bTDC; (c) BMEP 10.5 bar, injection timing 5°CA bTDC; and (d) BMEP 10.5 bar, injection timing 25°CA bTDC.
Processes 07 00299 g005aProcesses 07 00299 g005b
Figure 6. Variation of cumulative heat release: (a) BMEP 4.5 bar, injection timing 5°CA bTDC; (b) BMEP 4.5 bar, injection timing 25°CA bTDC; (c) BMEP 10.5 bar, injection timing 5°CA bTDC; and (d) BMEP 10.5 bar, injection timing 25°CA bTDC.
Processes 07 00299 g006aProcesses 07 00299 g006b
Figure 7. Variation of cylinder temperature: (a) BMEP 4.5 bar, injection timing 5°CA bTDC; (b) BMEP 4.5 bar, injection timing 25°CA bTDC; (c) BMEP 10.5 bar, injection timing 5°CA bTDC; and (d) BMEP 10.5 bar, injection timing 25°CA BTDC.
Processes 07 00299 g007aProcesses 07 00299 g007b
Figure 8. Variations of NOX pollutants.
Processes 07 00299 g008
Figure 9. Variation of CO2 emissions.
Processes 07 00299 g009
Figure 10. Variation of CO emissions.
Processes 07 00299 g010
Figure 11. HC emission.
Processes 07 00299 g011
Figure 12. Variation of exhaust temperature for diesel and butanol-diesel blends at: (a) BMEP = 4.5 bar; and (b) 10.5 bar.
Processes 07 00299 g012
Figure 13. Variation of BTE.
Processes 07 00299 g013
Figure 14. Variation of coefficient of heat transfer: (a) BMEP 4.5 bar, injection timing 5°CA bTDC; (b) BMEP 4.5 bar, injection timing 25°CA bTDC; (c) BMEP 10.5 bar, injection timing 5°CA bTDC; and (d) BMEP 10.5 bar, injection timing 25°CA bTDC.
Processes 07 00299 g014aProcesses 07 00299 g014b
Figure 15. Variation of BSFC with injection timing.
Processes 07 00299 g015
Table 1. Engine parameters.
Engine ParametersValues
Engine Power298 (kW)
Bore119 (mm)
Stroke175 (mm)
Connecting Rod Length300 (mm)
Total Displacement11.7 (L)
Cylinder Configuration 6 in-line
Compression Ratio16.5
Turbocharger 1 unit
Fuel injection nozzle8 holes
Injection pressure 2000 (bar)
Table 2. Properties of butanol isomers [50,51].
Propertyn-ButanolIso-ButanolSec-ButanolTer-Butanol
Molecular weight (kg/kmol)74.1274.1274.1274.12
Density (kg/m3) at 15 °C809.7802806789
Self-ignition Temperature (°C)385415.6406.1477.8
Lower heating value (MJ/kg)33.0933.1132.7429.79
Latent heat of evaporation (kJ/kg)581.4684671511
Flash point (°C)372824Miscible
Water solubility (g/100 mL)7.7812.7511
Table 3. Diesel and butanol [33,58,59].
Fuel PropertiesDieseln-Butanol5B15B25B
Average Molecular FormulaC13.5H23.6C4H9OHC7.2H12.73O0.065C7.1H12.81O0.196C6.81H12.89O0.328
Molecular weight (kg/kmol)185.674.1299.909101.43899.908
Density @ 20C (kg/m3)840–880813843.46840.36837.23
Lower calorific value (MJ/kg)42.533.142.0541.1440.22
Heat of vaporization (MJ/kg)0.270.5810.2850.3150.346
Cetane number 45–551750.744.843.8
Stoichiometric air fuel ratio 14.4311.1914.2714.1313.64
Carbon ratio (wt%)87.2964.8286.2183.9681.77
Oxygen ratio (wt%)021.591.043.135.24
Hydrogen ratio (wt%)12.713.512.7512.8212.90
H/C ratio 1.752.51.781.801.89
Flash point (°C)8537---
Kinematic viscosity at 40 °C (cST)32.272.652.532.47
Self-Ignition Temperature (°C)>250385---
Table 4. Peak pressure.
Injection TimingMaximum in-Cylinder Pressure/BarDegrees of CA (CAD)
BMEP/BarFuel510152025510152025
4.50B63.777.291.7105.9118.717.513.79.76.43.5
5B62.675.990.2104.2117.017.613.09.56.44.0
15B60.773.687.4100.8113.216.813.09.46.03.9
25B59.271.684.797.5109.215.312.39.26.43.7
10.50B74.289.8106.9124.7142.516.613.310.07.75.7
5B74.089.4106.3123.8141.416.612.710.07.35.3
15B73.788.6104.9121.8138.915.412.09.67.75.7
25B73.787.9103.3119.6136.113.311.49.47.45.5
Table 5. Maximum heat release rate.
Injection Timing Maximum Heat Release Rate/J/°CADegrees of Occurrence CA (CAD)
BMEP/BarFuel510152025510152025
4.50B231.3229.0224.6218.8212.714.49.64.9−0.1−5.0
5B218.2216.4212.8208.2203.014.49.44.5−0.1−5.4
15B193.2192.3190.0187.1183.814.59.75.00.1−4.9
25B168.2167.9166.9165.3163.614.59.44.6−0.3−4.5
10.50B227.3225.4222.8219.0214.816.611.36.51.7−2.9
5B218.9217.2214.7211.3207.616.612.06.61.9−2.8
15B202.0200.1198.1195.5192.917.412.77.73.0−2.4
25B185.3183.2181.3179.4177.418.813.48.74.0−1.4
Table 6. LCV and HV of diesel and n-butnol blends.
FuelsLower Calorific Value (MJ/kg)Heat of Vaporization (MJ/kg)
Diesel42.50.27
n-Butanol33.10.581
5B42.050.285
15B41.140.315
25B40.220.346

