Abstract
In a globalized marketplace, the competition in the aerospace industry has increased significantly. Producers can choose between many suppliers. These suppliers have to comply with more requirements and technical specifications, as well as take on greater responsibilities that originally fell on producers. In this context, business opportunities for small and medium-sized enterprises (SMEs) are limited, but still suppliers must try to leverage the maximum strategic advantage of the few that present. Adopting research, development and innovation (R+D+i) practices has proven to bring great benefits to companies and allows them to gain significant competitive advantages. However, the process of designing, implementing and testing R+D+i-related processes is not straightforward, nor it has been addressed in the recent research on SMEs. In this paper, a case study of a Spanish innovative small company providing industrial metrology and quality services is analyzed. Thanks to an internal decision-making process, an R+D+i management system based on the UNE 166.002:2014 standard is eventually adopted. A pilot project is closely followed up to test the robustness of the system implementation. The R+D+i management system has allowed the company to streamline its innovation activities, establish objectives to better allocate essential resources, organize high performing innovation units within the organization structure, increase the clients’ confidence, improve the company’s competitiveness, carry out technological surveillance, and get more patented technology, among many others. Adoption steps taken by this SME are generalizable to other SMEs from other industries and show how an R+D+i management system can be chosen, designed, implemented and tested in the context of Industry 4.0 (I4.0).
1. Introduction
In a globalized economy, companies need to be adaptable to maintain their presence in the market [1]. The whole value chain is also changing and companies need to be proactive in this change [2]. Where and how much these companies invest can decide whether they will acquire a significant competitive advantage or fail and go under [3,4].
In companies, particularly in the case of Small and Medium Enterprises (SMEs), research has found a strong positive relationship between innovation and growth [5], and between innovation and performance [6]. Unfortunately, SMEs frequently lack the resources to fully invest in recent technologies [7]. They need to prioritize their investments and be very careful when allocating their capital. Furthermore, it is generally only possible to extract value from new technologies when SMEs adopt suitable business models [8]. These generally involve some degree of SWOT (strengths, weaknesses, opportunities, and threats) analysis, particularly with the aim of transforming threats into opportunities [9]. Hence, if SMEs harness their innovation capacity and fully exploit their capital through a structured management system [10], they could potentially obtain better results with the same or fewer resources while strengthening their market position [11].
In industrial environments, companies are being advised to early identify the potential gains of Industry 4.0 (I4.0) and constantly adapt to remain competitive [12]. Among many other things, I4.0 supports innovation, pushing companies to strengthen their interaction with customers while reaching new customers through individually-tailored offers [13]. I4.0 also provides a high degree of digitization, which allows every company to be better interconnected with the rest of the industry. All these can lead to smarter value creation [14] and enhanced productivity [15] without having to sacrifice other economic, ecological and social aspects [16]. However, although there is a collective agreement that I4.0 offers promising opportunities, it is barely known how those promises can be fulfilled [2]. Studies on the implications of I4.0 across the whole industrial value chain have also been in short supply [13] and the analyses of companies’ implementation strategies in their operational contexts to harness the benefits of I4.0 are still virtually nonexistent [17].
However, SMEs’ challenges differ from large companies’. SMEs generally need to significantly adapt their organization and find a tailored approach to meet I4.0 demands [18], otherwise their economic growth could be harmed [19]. Conversely, opportunities appear if SMEs evolve and deploy new technologies and principles (e.g., SMEs can better particularize products and services to demanding thanks to I4.0) [20]. However, the process of adopting effective I4.0 solutions is not straightforward for most SMEs. This, as these companies generally lack formalized processes and count on limited economic and (human) capital resources [21]. Moreover, as suggested earlier, academic research in this area has been lacking for SMEs [22].
An industry in which SMEs have been facing these challenges is the aerospace sector [23]. In it, there is a relatively small set of producers (usually big and globally-oriented firms) that selectively choose their suppliers (generally a myriad of SMEs). These SMEs are increasingly required to take on greater responsibilities and comply with more requirements and technical specifications. For many of these SMEs, (internal and external) competitive pressures are plentiful (e.g., decreasing availability of natural resources, increasing energy prices, increasing age of employees, markets globalization). Conversely, business opportunities for them are limited. They must try to leverage those few strategic opportunities that present and face whichever challenges to remain competitive. In this context, R+D+i activities constitute not just essential survival and dynamizing elements, but also critical factors for achieving business excellence [24].
Therefore, in a context of growing maturity and higher requirements, supply chain management in the aerospace sector needs to become more efficient [25]. To achieve this, SMEs’ innovation, as well as research and development, need to adopt high-level technologies and invest in transformative business practices. With this approach, it is also expected that if companies’ processes, routines, techniques and tools can be standardized by a management standard, their effectiveness could also be improved [26]. In this regard, this paper presents the case study of an aerospace SME depicting the experience of adopting a new R+D+i management system, which allows, not just survival, but prosperity in a competitive environment.
The paper is structured as follows. Section 2 presents the research objectives. Section 3 (Background) presents a structured literature review connecting R+D+i management with I4.0 and analyzing the supply chain in the aerospace sector. Section 4 relates the research methods. Section 5 describes the case study and its major findings. Section 6 discusses the results obtained and suggests a framework for implementing sound R+D+i management systems in other SMEs. Section 7 concludes the paper, summarizes the contributions and proposes further research continuations. Some appendices at the end provide extensive reference material for those readers interested in knowing more about the technical and research aspects of the case study analyzed.
2. Research Objectives
Aerospace companies participate in a complex supply chain where both the companies they provide to and the final users have become much more demanding. This has forced them to cope with increasingly higher manufacturing standards. In order to survive, SMEs from the aerospace sector can develop new technologies to improve their products, services and systems (even for their clients). An obvious way to achieve this is to make informed decisions regarding in which areas more research is needed, as well as how research tasks can be better managed, in other words: To develop an R+D+i management system.
Through a paradigmatic example of a Spanish SME dedicated to providing metrology services in the aerospace sector, this research analyzes how an R+D+i management system can help SMEs to survive and prosper in the I4.0 context. Spain is one of the countries where the innovation-related framework and standards are more advanced. Spain also encompasses a significant number of SMEs working in the aerospace industry, as well as one of the two major aircraft builders (Airbus). This makes of this case study a good example depicting how an SME can remain competitive within an increasingly complex supply chain environment.
Thus, the first objective of this study will be to carry out a holistic analysis of the design, development and implementation of an R+D+i management system. The second objective will be to document how the decision-making process takes place regarding how an SME can approach and manage R+D+i. In the case of Spain, a company is considered an ‘innovative SME’, if a seal is awarded to that company as official recognition. Besides demonstrating its innovation capacity, it is possible for that company to access special subsidies, tenders, tax incentives and other advantages.
From the case study analyzed, it will become clear that the company develops intensive R+D+i activities on a daily basis. Still, this company will be faced with a set of voluntary alternatives that can provide it with a greater strategic and competitive value. However, these alternatives must be carefully selected so that they are compatible with the management systems already in place.
3. Background
3.1. R+D+i management
R+D+i management involves planning, directing, controlling and coordinating the development and implementation of R+D+i capabilities in order to shape and accomplish the strategic and operational objectives of organizations [27]. According to the Frascati manual [28], R+D+i management includes the management of basic research, applied research, and experimental development; Cetindamar, Phaal and Probert [29] also describe the challenges on the rise in the fields of technology management and innovation.
Particularly, in the case of innovation management, many interpretations can be found for the concept of innovation depending on the purpose and context. The Oslo Manual [30], for example, considers four general innovation types: Product, process, marketing and organizational; Schiederig, Tietze and Herstatt [31] talk about green and ecological innovation; Zeschky, Winterhalter and Gassmann [32] refer to frugal and reverse innovation; Horwitch and Stohr [33] describe social innovation; whereas Tidd and Bessant [34] propose design-driven innovation, to cite just a few.
R+D+i, in any of its conceptions though, has a positive effect on the performance of organizations [35]. In fact, innovation is one of the key factors for companies long-term success [36]. The development of technological innovations [37] facilitates the introduction of improvements in the organizational management context, as well as quicker knowledge and learning and exchange [30]. In this setting then, companies with the ability to innovate face and resolve challenges and conflicts quicker than non-innovative ones [38].
To make R+D+i successful in the long run, companies must adopt suitable management practices [39] that help them mobilize the necessary resources and company capacities [40]. To make this happen, R+D+i management systems are used as instruments that promote and systematize creativity in research and development through technology. In turn, these systems allow companies to be more innovative and encourage the application of their innovations as new products, services, processes, organizational designs or business models [41]. Overall, any of these can eventually increase the company value (to the company itself and its stakeholders) and improve its results [37].
Furthermore, effective R+D+i management involves practices and routines that can be codified by a management standard [42]. This management standard creates a formalized framework that provides guidance for:
- A better understanding of the context of the organization:
- ○
- Economic, political and social environments can play decisive roles in the success of innovation [43], but requires the analysis of external factors.
- Establishing the leadership and commitment of senior management:
- ○
- Leadership promotes R+D+i by allocating more resources for innovation [44], but also by communicating a clearer vision and showing commitment to clients [45], as well as fostering the employees’ creativity [46].
- Planning the development of R+D+i:
- ○
- Adequate results in the process of developing new products are needed [47], for what is necessary that innovation is in harmony with the current organizational structure of companies and are aligned with their objectives.
- Developing the process of R+D+i management:
- ○
- The system may include operational processes for managing ideas, developing R+D+i projects, protecting and exploiting results, and diffusing market [48].
However, as highlighted earlier, the literature on the implementation of R+D+i management systems in real contexts is rather limited. The situation is worse when it comes to the description of which tasks should be undertaken by companies for the adequate management of technology, strategy, research, development and innovation [29]. Clearly, the development of interdisciplinary skills is required by the company staff who want to achieve the integration of services, products and systems [29]. Indeed, R+D+i managers frequently work on creating, improving and/or developing, exploiting and, sometimes, transferring a series of products, services and/or processes, [49], but these tasks are rarely reported [50].
When it comes to R+D+i standards, quite surprisingly, the situation is rather the opposite. Nowadays, there exists a substantial regulatory body in most European countries. Table 1 presents an excerpt of the first standards.

Table 1.
First standards about research, development and/or innovation into the European Union.
A quick inspection of Table 1 reveals that Spain has been at the forefront of innovation regulation well before other European countries. Particularly, the Spanish UNE 166.002 standard [51] provides a guide for those companies that intend to develop more effective organizational and technological innovations [48]. Furthermore, the European Committee for Standardization (CEN) is developing the 16555 family of standards at a European level (largely based on the Spanish standards). More recently, the International Organization for Standardization (ISO) has also published the 50501 standard at an international level [52] which largely based on the European standards and, in turn, in the Spanish ones too. A simplified timeline of the most relevant Spanish and International is shown in Figure 1.
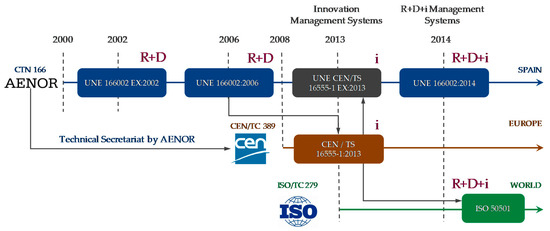
Figure 1.
Evolution of the Spanish, European and international of R+D+i standards.
As a result, despite the apparently extensive R+D+I regulatory framework, current literature has not currently tried to identify which are the best practices/actions to take (drivers) throughout the stages of managerial innovation [53], nor provided practical information about how to manage business for optimizing the R+D+i outcomes [54]. There is also a lack of research within companies, when teams are not prepared to implement R+D+I systems either because resources are insufficient, not complementary, and/or cannot work collaboratively [55]. In the case of SMEs, this deficit extends to the management of R+D+i by their staff in order to exploit innovative ideas [56]. This is especially relevant because of the difficulties in finding, selecting and retaining specialized, entrepreneurial and managerial workers [57]. The case study developed in this paper will address some of these research gaps.
3.2. R+D+i management in the Industry 4.0
I4.0 is expected to significantly transform industrial value creation, encompassing high-grade digitization of business processes, smart manufacturing and intercompany connectivity [13]. Its principles can also be applied to transforming the nature of products and services provided by organizations [58].
I4.0 faces the challenge of transforming (even reinventing) the business culture of organizations, influencing the competence and talent of their personnel, and orienting themselves towards new sustainable, competitive and ever-changing business models [59]. This paradigm shift in design, production and methods of operation is also changing the way people and businesses interact with each other [60]. I4.0 mostly involves a quantum leap on three principles: Digitization of production, automation, and linking manufacturing sites in a comprehensive supply chain [61]. Maturity models help organizations to embed these three principles into their culture [62]. New business opportunities that promote the transformation of production processes usually find, mainly in SMEs, some resistance to change [48]. Moreover, many SMEs just do not even know where to begin with when trying to visualize how they want to manage innovation [62].
Nevertheless, SMEs are major contributors to the industry of most countries [63]. In the case of the Spanish economy, SMEs represent 99.9% of companies, 65.9% of employees and provide 60.4% in terms of added value [64,65]. In other countries like Germany, we can find similar figures (99.6, 59.4 and 54.8, respectively [66]. Similarly, most SME faces similar challenges: Lack of financial resources; low productivity; low level of standardization; and lack of understanding of integration [18].
Thanks to I4.0, though, SMEs can improve their competitive position and individualize their products and services to suit clients’ demands [14]. Even if the majority of SME still lack the expertise for implementing I4.0 [67], new doors for cooperation and value creation can be opened to innovate with partnering companies and institutions [68]. However, with generally lower automation levels than large companies [15], SMEs tend to rely heavily on some key manufacturing employees, working together to generate value creation innovations [69]. In this context, SMEs need a higher amount of employee training [13], including those skills required for fixing machines in the case of failures [70]. This paper will also discuss these aspects through the case study.
3.3. Supply Chain Management and the Aerospace Sector
The Supply chain is currently the center of operational activities of manufacturing companies [71] and a decisive factor when a company is trying to gain some competitive advantage [72,73]. Bär, Herbert-Hansen and Khalid [2] reviewed the benefits of I4.0 in the supply chain, finding that the most important were: Stakeholders integration, product customization, process transparency, production flexibility, resource efficiency, real-time data, automation, customer data retrieval, and increasing client satisfaction. In order to fully benefit from I4.0 then, companies need to learn and share production-related data with suppliers and clients within the supply chain [74].
On the other hand, the aerospace sector is a highly competitive industry, where the priority is to ensure safety and airworthiness. Due to their operating conditions, their results are restricted to very high-quality and reliable standards [75]. However, despite being a highly regulated sector, it is still possible to adopt innovative business models that allow operating in lean, agile, resilient manufacturing supply chains [76,77]. In this context, the development of aerospace technologies is very fast, and has stood out at the vanguard of many other industrial sectors. A common thread among the majority of these technologies is that they have boasted higher levels of automation, as well as greater production speed and accuracy [78]. Still, the intensive use of automation, data exchange and advanced manufacturing technologies are requiring better coordination of operations, especially when dealing with new measuring technologies supporting digital manufacturing. Consequently, new opportunities based on innovative measuring technologies and procedures for metrological quality assurance and control are also emerging [79]. In this sense, the case study analyzed later will describe the case of an SME developing metrological solutions to other aerospace industry clients.
Furthermore, original equipment manufacturers (OEMs) are working these days collaboratively with many smaller suppliers [80], exchanging knowledge, technological innovations and benefiting reciprocally [81]. Historically, OEMs had acted as focal points of supply chains, carrying out the majority of manufacturing and assembly processes themselves. These days, a great proportion and variety of work are being carried out by specialist organizations, dispersing the supply chain. In this context, OEMs are transferring risks to their suppliers, but also losing some degree of operational control [82].
Hence, the maturity of the aerospace supply chain management has always been a paradigm of efficiency, accuracy, responsiveness and agility [83,84]. This has allowed OEMs and their suppliers to face together complex challenges, fostering interdependence. However, I4.0 challenges need industrial companies capable of operating in the whole value-chain in an agile and responsive manner [85]. These companies also need (technical and managerial) structures that allow them to cooperate with each other and adapt rapidly across whole lifecycle processes, from innovation to production [86]. The case study in this paper will describe these challenges and interactions.
4. Research Method
As discussed earlier, although there is significant research on I4.0 in the context of SMEs, most of it has focused on business flexibility and productivity, as well as on delivery time and cost reduction [87]. Very few studies have covered other essential issues for SMEs, like quality improvement [88] or R+D+i management [56]. Therefore, qualitative research seems especially suited for the first exploratory research on how SMEs can design, implement and benefit from R+D+i management systems.
This study has opted for a case study as there is hardly any previous research on the topic and insufficient empirical observations to turn it into a quantitative study. This is probably to be expected as, due to confidentiality and competitive reasons, companies do not tend to share the information that would be required for a more extensive analysis. Indeed, when only limited theoretical knowledge exists, an inductive research strategy leading to emerging theory from a case study can constitute a good starting point [89].
Building theory from a case study is a research strategy that involves using the case to create theoretical constructs, propositions and/or midrange theory empirical evidence [90]. The theoretical sampling of single cases is straightforward. Cases are chosen because they are unusually revelatory, extremely exemplary, or because they represent unique opportunities for gaining research insights [91]. If the case study is rich, with empirical descriptions of a particular instance that is based on a variety of data sources [91], then an accurate, interesting, and testable theory can also be developed [89]. Additionally, while experiments isolate the phenomena from their context, case studies emphasize the rich and real-world context in which they occur [92], sometimes, including the points of view of all people and entities involved [93]. For the interested reader, Eisenhardt and Graebner [94] provided the keys to build a solid case study. In the context of our study, we will strive to answer the following research questions:
- Do R+D+i activities help SMEs to work along the value chain?
- Does the systematic management of R+D+i activities optimize the resources of SMEs?
- What standards can be followed to design an R+D+i management system in an SME?
- What criteria must be considered to develop an R+D+i management system in an SME?
- How can an SME implement a successful R+D+i management system?
- How can an R+D+i management system be tested after its implementation in an SME?
5. Case Study
InnoMet (the real company name has been changed to keep it anonymous) was a company created in 2006 within a university context as a technology-based company (TBC). InnoMet provides services related to metrology and its initial aim was to transfer research results from a university metrology laboratory to the industry. The forté of InnoMet is providing calibration support and management to companies within the aerospace and naval sectors. Nowadays, InnoMet has become a leading company in Spain providing advanced metrology services, but also industrial quality engineering and IT solutions. With a current staff of 35 employees to date, the company has worked with more than 100 clients, calibrated more than 30,000 instruments and handled over 50,000 calibrations. The quality of services offered by InnoMet is endorsed in Spain by the following accreditations and certifications:
UNE-EN ISO/IEC 17025:2017 Accreditation: Conformity assessment of testing and calibration laboratories, in:
- ○
- Dimensional metrology.
- ○
- Force and torque metrology.
- ○
- Pressure and vacuum metrology.
UNE-EN ISO 9001:2015 Certification on Quality management systems, in:
- ○
- Advisory, consultancy and integrated metrology management services.
- ○
- Design, development and implementation of IT solutions.
UNE-EN 9100:2018 Certification on Aerospace quality management systems, in:
- ○
- Calibration of equipment.
- ○
- Technical advice in metrology.
- ○
- Verification of CNC machines.
Aerospace and naval OEMs homologation for industrial and IT verifications.
Most services offered by InnoMet are carried out through routine, essentially repetitive operations. However, this company detected new business opportunities that increasingly involved carrying out more and more singular activities. Although these new business areas did not seem critical initially, they have brought substantial changes regarding the way InnoMet operates and makes money. InnoMet can offer nowadays state-of-the-art metrological processes through transferring the latest developments on research metrology. They have also consolidated their metrology innovations in emerging industrial processes, which has involved strengthening and broadening InnoMet’s links with current and new clients.
5.1. SWOT Analysis
As a first step, InnoMet analyzed itself and its competitors in order to better understand its clients’ needs and expectations, especially those in the aerospace and naval sectors. These clients constitute InnoMet’s major work source. Thus, InnoMet resorted to a SWOT (Strengths, Weaknesses, Opportunities and Threats) analysis, which is a well-known instrument from operations research to develop organizational strategies [95] that has been applied in many fields (e.g., [96,97,98,99]).
From a thorough scientific literature review and several focus group workshops involving central stakeholders, the SWOT analysis was built. Among the central stakeholders, InnoMet’s OEM’s supplier was included, as well as the company’s experts committee. This committee is made up of the company directors, managers and advisory board, who are mostly a group of researchers from academia. The SWOT analysis captured key aspects of the company’s environment and strategic capabilities, and identified internal and external critical success factors, which are summarized in Table 2.
Table 2.
SWOT (Strengths, Weaknesses, Opportunities and Threats) Analysis.
Once the SWOT analysis was carried out, the Experts Committee realized that the company’s best path to follow was to become a TBC company that intensively developed R+D+i-based metrology services. For this, the company needed to obtain a seal that serves as an official recognition of innovative SMEs. The analysis of alternative solutions that InnoMet considered to obtain this official recognition by the Spanish accreditation bodies is discussed in the next section.
5.2. Alternatives Analysis
InnoMet concluded that the innovative SME seal was a strategic requirement because it would help them differentiate from its rivals and gain some competitive advantages. In addition, it would allow them to explore new national markets, while enjoying tax deductions and pension bonuses.
To obtain the ‘Innovative SME Seal’ regulated by the Spanish order ECC/1087/2015 [100], a company is required to carry out intensive R+D+i activities. Besides establishing the seal awarding criteria, this order attempts to promote proposals that foster business growth of Spanish SMEs. However, just doing research or apply new ways of doing things in production processes or services is not enough to be considered an innovative SME. A series of additional, but an alternative, formal requirements set out in the Royal Decree 475/2014 [101] must also be met. As a result, a Spanish SME may be considered as innovative or R+D+i intensive if it has carried out activities in the field of research, technological development or technological innovation in recent years. However, the SME will only be considered to be officially innovative if it either:
Demonstrates the company’s innovative character by submitting a (positive):
- Binding reasoned report (BRR) by the Corporate Income Tax Law 27/2014 [102], or proves the company’s innovation capacity by being awarded one of these official certifications recognized by the MINECO:
- AENOR EA0047 specification [103], or
- AENOR UNE 166002 R+D+i Management System standard [51].
Hence, if the SME meets one of these criteria, the company will eventually be awarded the ‘innovative seal’ by the Spanish Ministry of Economy and Business (MINECO). Companies that receive this seal have the following advantages [104]:
Compatibility between tax deductions and bonuses in the company pension contributions for the staff dedicated exclusively to R+D+i tasks.
Access to specific soft financing lines from the Spanish Official Credit Institute (ICO).
Access to public procurement of innovation (CPI), an administrative action to promote innovation, aimed at boosting the development of new innovative markets from the demand side, through the instrument of public procurement.
Abbreviated tendering procedures with the public administration.
Direct aid channeled through the European Union Framework Programmes’ agents.
It is evident, that all these preferential conditions could be harnessed by InnoMet to gain significant competitive advantages. As a result, InnoMet considered that being awarded this innovative SME seal was the most advisable step to take. What remained was deciding which of alternatives (BRR, AENOR EA0047, or AENOR UNE 166002 R+D+i) was the most suitable for them.
5.2.1. Binding Reasoned Report (BRR)
The Spanish Royal Decree 1432/2003 [105] requires that applicants submit a technical report to the MINECO. This report classifies the SME’s research activities and identifies their expenses and investments in R+D+i. The facts contained in this report have to be checked and certified by an external entity accredited by the Spanish National Accreditation Body (ENAC) [106,107].
The process basically consists of three stages. In the first stage, companies prepare a report of their R+D+i projects once they are completed. All relevant technical and economic documentation must be compiled following a clear structure based on some ENAC requirements. In a second stage, a certification is requested from an R+D+i projects certification body. Then, in a third and final stage, companies must present their certified reports to the MINECO in order to get their BRR.
For the interested reader, Appendix A includes two figures that show the schematic process for applying for and issuing a BRR (Figure A1) and the evolution of issued BRRs vs. the number of applicants in Spain from 2005 to 2017 (Figure A2).
5.2.2. AENOR EA0047 Specification
The EA0047 specification by AENOR [103] describes the set of objective criteria and assessments that define when a consolidated SME can be considered ‘innovative’. The European Innovation Scoreboard (EIS) [108] was originally used as a reference for the preparation of the EA0047.
The EA0047 specification consists of 27 indicators that allow companies to identify their strengths and weaknesses, and improve their management performance by means of a self-assessment instrument. In order to obtain the certificate of conformity, an SME needs to achieve a minimum score of 400 points. Besides comparing its relative performance, the SME applying can receive immediate feedback by observing in which assessment items the company is not performing adequately. A top-performing company might reach (theoretically) a score of up to 1,000 points.
The 27 indicators of the EA0047 are grouped in three blocks: Human and economic financial resources; innovation processes; and results, including generation of employment in R+D+i. The first block (resources) is focused on understanding the organizations’ commitment to innovation. It measures the number of personnel dedicated to R+D+i, the percentage of expenditures in R+D+i and the sources of public and private financing. The second block (processes) focuses on technological vigilance and collaboration with third parties. The third block (results) focuses on providing a clear vision of the benefits that organizations obtain from their R+D+i activities (e.g., enable protection models, job creation, and other positive economic outcomes).
The structure of the EA0047 specification systematizes: The relationship of the SME with its suppliers; the monitoring of market developments; customer feedback; the relationship with training organizations or technological services; the analytical accounting of different innovation activities; and the SME’s innovative capacities communication policy.
For the interested reader, Figure A3 in Appendix A reproduces the latest EA0047 ranking for Spanish innovative SMEs. Table A5 in Appendix B summarizes InnoMet’s self-assessment results. Our company got 500 points, then it could have been certified by this standard and consolidated among the 12% most innovative companies in Spain.
5.2.3. AENOR UNE 166002 R+D+i Management System Standard
The UNE 166002 standard by AENOR [51] includes the organizational structure, activity planning, responsibilities, practices, procedures, processes and resources to develop, implement, carry out, review and keep the organization’s R+D+i policy up to date. This certification of an R+D+i management system allows companies to:
- Systematize innovation activities.
- Establish objectives and goals that help to control research resources.
- Plan, organize and control R+D+i units.
- Provide added value and facilitate technology transfer.
- Improve the business image and its competitiveness.
- Carry out the necessary technological surveillance that allows to anticipate market changes and identify new opportunities for improvement.
- Integrate the management of innovation with other management systems.
- Establish the interaction of innovation with other functional areas.
- Achieve own patented technology.
- Increase shareholders’ satisfaction by demonstrating benefits from innovative activities.
- Demonstrate the transparency of innovation activities to Public Administration.
- Keep abreast of the progress of new technologies worldwide.
- Carry out analysis, continuous improvement, and result in the measurement of the company’s research, development and innovation activities.
Therefore, the UNE 166002 standard could potentially contribute to the optimization of the organizations’ research, the development of technological innovation processes, facilitate the recognition of emerging/new technologies, and provide the basis for strengthening R+D+i activities. Requirements from this standard are complementary to the requirements of other business management systems too, such as quality management, environmental management, safety management and ethical and social management.
Taking into account the particularities of innovation activities within organizations, the UNE 166002 standard proposes a methodology for the continuous improvement of any SME’s innovation process. This methodology resembles Deming’s classical Plan-Do-Check-Act (PDCA) cycle as represented in Figure 2.
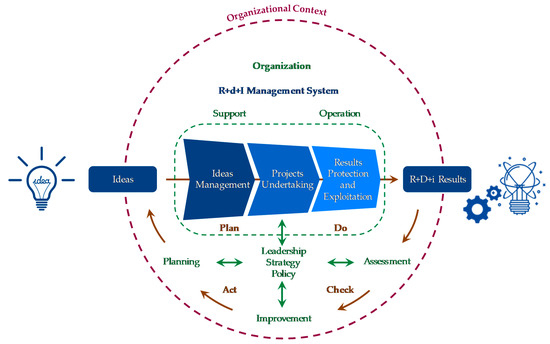
Figure 2.
Diagram of R+D+i processes (R+D+i cycle).
For the interested reader, Figure A4 in Appendix A represents a flowchart of the certification process for a Spanish SME. Figure A5 and Figure A6 show a comparison of companies certified in Spain by the major management standards (ISO 9001, 14001, 22000, 27001 and 50001 versus UNE 166002).
5.3. Alternatives Selection with the AHP Method
Having presented the three possible alternatives to obtain an innovative seal awarded by the MINECO, it only remained to analyze which was the most suitable option for InnoMet. To make an informed decision, our SME decided to resort to a multi-criteria decision tool, in this case, AHP. The Analytical Hierarchy Process (AHP) method is a very popular discrete multi-criteria decision tool [109,110]. In AHP, the problem to be solved is modelled from a set of alternatives and a series of decision criteria that can sometimes be conflicting.
AHP is applied through the construction of hierarchical structures, in which the first hierarchical level consists of the problem goal, the next hierarchical levels encompass the decision criteria and sub-criteria and, finally, the last level contains the alternatives. For allocating weights to the decision criteria and sub-criteria, paired comparisons are made (criterion vs. criterion) by knowledgeable members of a panel. These numerical comparisons are generally expressed in a 1-to-9 scale and lead to dominance matrices. The steps for applying AHP are summarized in Figure 3.
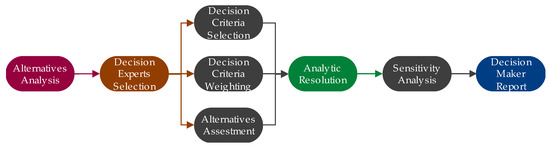
Figure 3.
Decision-making process.
Thus, the decision problem components in this case were:
- Goal: Innovative SME seal regulated by the MINECO.
- Alternatives: A. Binding reasoned report (BRR).B. EA 0047 (Innovative SME requirements) conformity certification.C. UNE 166002 (R+D+i Management system) certification.
- Decision criteria: InnoMet came up with the criteria shown in Table 3:
Table 3. Criteria for R+D+i management system selection.
The AHP model of the decision problem is identified in Figure 4. The first step was to weight the decision criteria. Then, decision criteria binary comparisons and paired assessment matrices were completed by the Experts Committee of InnoMet. More precisely, a specific questionnaire was designed to capture the judgements of all experts. The criteria weights were voted after a debate and a relative consensus had been reached. In this case, the experts resorted to ratio scales that derived verbal statements (comparisons) which were eventually converted into priorities through integers from 1 to 9 (being: 8–9 extremely important, 6–7 very strongly more important, 4–5 strongly more important, 2–3 moderately more important, 1 equally important).
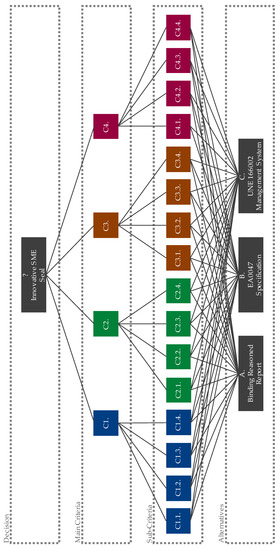
Figure 4.
Modelling the decision-making problem.
The multi-criteria decision-making software SuperDecisions [111] was used for the weighting of both the first and second level criteria, and also for the final ranking of alternatives. A summary of the weight results from all the pairwise decision criteria, sub-criteria and alternatives are represented in Table 4. Details of the pairwise comparison can be found in Table A1, Table A2 and Table A3 in Appendix B.
Table 4.
Criteria weights.
According to the results of the first level criteria weights compiled in Table 4, the organizational strategy (C1) was considered the most important factor (with just over 60% of the total criteria weight). The second most important criterion was the technical (C3) group (slightly over 25%). Within the organizational strategy group (C1), the most important sub-criteria were the Alignment with strategy (C1.1) and the Promotion of R+D+i capacity (C1.4). Just these two sub-criteria represented nearly 50% of the total problem decision weight (as 0.60206 × (0.45310+0.34500) = 0.4805).
As a result, as shown in Table 4, the best alternative for InnoMet’s R+D+i management system was deemed to be obtaining the certification by the UNE 166002 standard (with a preference ratio of 69%). The second-best ranked option was to obtain the conformity certificate based on the EA0047 specification (22%); and the third (worst) alternative was the BRR (9%).
However, once judgments had been entered, it was also necessary to check whether they were consistent. The admissible inconsistency coefficient was calculated and resulted in a value below 10% (which is considered quite low in AHP). The SuperDecisions software also calculated the weights for every pairwise comparison in order to minimize local inconsistencies of the model. Table A4 in Appendix B shows the details of these calculations.
Finally, a sensitivity analysis was performed. This analysis consists of a study of how changes in the decision criteria weights could have affected the decision outcome. Results of this analysis are summarized in Table 5. Nevertheless, being the alternative C so overwhelmingly superior, only if criterion C2 had weighted more than 70%, alternative C would have no longer been the top ranked. As this scenario seemed to largely misrepresent the expert panel’s priorities, it was finally concluded that alternative C really seemed the most suitable option for InnoMet.
Table 5.
Sensitivity analysis.
5.4. Document Management System
Thanks to the previous multi-criteria decision-making stage, a specific R+D+i management system was eventually chosen by InnoMet. Next, it was necessary to create and/or modify the structures of the organization. To do so, it was necessary to update the company’s document management system.
InnoMet then established, documented, implemented and prepared to maintain an R+D+i management system based on the UNE 166002 standard by AENOR seeking to continuously improve its research effectiveness. To this end, the organization chart, the company processes and other information were reviewed and updated.
5.4.1. Organization Chart
InnoMet had to ensure that the resources and necessary information would always be available to support the operation and monitoring of R+D+i activities. In the updated organization chart (that can be found in Figure A7 in Appendix B) there was evidence of this commitment from InnoMet’s senior management team. In addition, InnoMet created two new roles in the organization chart:
- R+D+i Management Unit: For the general management of the R+D+i.
- R+D+i Unit(s): For specific R+D+i projects.
As can be seen in Figure A7, a new division was created, whose director was at the same level than other division directors like operations, quality and administration. Within this new division, three functional areas were created for the undertaking: R+D+i projects, calibration of CNC machine tools, and verification of industrial processes. The staff (division director, department manager and area coordinators) were full-time employees fully dedicated to R+D+i activities.
5.4.2. Processes Map
Based on the certification demands, requirements and recommendations included in the R+D+i management system, InnoMet adopted and optimized a series of Management, Operational and Support processes. Greater detail of these can be found in Figure A8 in Appendix B. Namely,
Management processes:
To the existing processes related to Change management (incidences and corrective actions), Risk management (risks, opportunities and preventive actions) and System management (audits and improvement actions), InnoMet added:
- ○
- Results management (protection and exploitation):These processes established the guidelines that ensured the mechanisms of protection, technology transfer and exploitation of results, starting with the definition of a valuation system for the company’s intangible assets.
Operational processes:
To the existing processes of Stakeholder management (offers, contracts and clients), Supply chain management (subcontracting and suppliers), Integrated metrology management, Software design and development, and Equipment CNC Machine tools calibration, InnoMet added:
- ○
- Ideas management:It covered the stages of generation, collection, evaluation and selection of ideas. More precisely, these processes included how to capture the purposes sought by those ideas, the sources from which they can be generated, the expected frequency of generation, the methods and criteria for their analysis and prioritization, and eventually the means for their protection (intellectual property).
- ○
- R+D+i projects development:These processes described how to document a new metrology methodology consisting of start-up, planning, development, control, closure and operation phases, without requiring an exhaustive project portfolio for prioritization or compatibility.
Support processes:
To the existing processes of Documented Information (documents and records), Competence management (industrial safety, procedural qualification) and Configuration management (facilities, equipment and systems), InnoMet added:
- ○
- Technology surveillance and competitive intelligenceThese processes allowed anticipating (proposing changes for expectations), taking advantage of opportunities (exploiting identified advantages), reducing risks (reducing threats or overcoming barriers to access new technologies and/or markets), as well as opening new lines of improvement (overcoming gaps and minimizing identified weaknesses), accessing innovation (proposing new ideas and/or R+D+i projects), and foster cooperation (identifying potential collaborators).
5.4.3. Other Documented Information
In addition to the organizational chart and the revised and extended processes map, InnoMet also modified its mission, vision and values. New R+D+i policy and objectives were included in the company strategy, and a comprehensive manual for the R+D+i management system was created. Besides, a series of new performance indicators (see Table A6 in Appendix B) was created. These indicators will be reviewed annually.
5.5. Pilot R+D+i Project
Once the R+D+I management system was up and running, an R+D+i pilot project was chosen to evaluate the successful implementation of the whole management system. The pilot project was, of course, handled with InnoMet’s new management system and represented a project for its main client in the aerospace sector. Project details are included in Appendix C.
For this project, a set of objectives were proposed, experimental procedures described, and its results released. This and other later R+D+i projects have allowed InnoMet to take the lead against its competitors, and be positioned at the forefront in the evaluation of aeronautical process qualifications. Particularly, the major traits and contributions of this pilot project were:
- It supplied a technological solution to a specific need of a major client (OEM).
- It replaced (or complemented) older, less reliable and generally more expensive verification methods.
- It mitigated process risk and variability.
- It developed alternative drilling and riveting processes that could be used in future aeronautical applications.
- It decreased the time for automatic drilling and riveting processes verification.
- It allows implementing non-destructive inspection procedures.
- It reduced measurement uncertainty.
Once the system was successfully tested, other successful projects followed. Among them, the more relevant were:
- Volumetric positioning errors of flushed systems for ultrasonic inspection of carbon fiber parts.
- In-situ calibration of three-dimensional laser tracker measurement systems.
- Verification of gaps and steps in aeronautical assembly panels.
- Geolocation of in-situ measurement instruments for metrological management.
- Web applications for the metrological management of instruments for OEMs.
- Evaluation of wear effects on the machining of aluminum alloys.
- Metrological model for the characterization of microgeometric errors in additive manufacturing processes.
6. Discussion
In this research, a case study of a Spanish innovative SME (InnoMet) providing metrology and industrial quality services in the aerospace sector has been analyzed. For the SME, obtaining an innovative seal was a priority objective. This accreditation is official recognition for Spanish SMEs after an intensive research focus. It also brings a series of tax and funding benefits that give these companies some additional competitive advantages that partially compensate their smaller size.
From an external point of view, holding an innovative SME seal has allowed InnoMet to carry out technological surveillance and be able to anticipate its clients’ needs (for example by proposing new metrological methods to them that enhance the quality of their processes). These positive outcomes were partially anticipated by Erkut [41], Zott, Amit and Massa [112], and Taran, Boer and Lindgren [113], who suggested that organizations must design and conduct their own activities while trying to provide value and confidence to their clients. In this vein, InnoMet’s new R+D+I management system standardizes and generates the necessary intermediate processes from generating ideas to materializing protectable and usable results. Developing these intermediate is essential, but it is frequently neglected by SMEs, as George and Bock’s [114] and DaSilva and Trkman’s [115] found.
Furthermore, to achieve all these positive outcomes, InnoMet has streamlined a way of compiling its clients’ needs and expectations while also involving its own suppliers and partners in the thinking process. According to Ng, Ding and Yip [116] and Bouncken and Fredrich [117], both aspects constitute essential elements to drive innovation. Besides, contrary to many other companies, InnoMet has demonstrated total transparent approach towards all its operations (a proof of this is the current case study). Indeed, this was considered an important barrier by Mittal, et al. [20], who reviewed aspects that prevented the successful adoption of SMEs’ smart manufacturing techniques in the I4.0 context. However, InnoMet is confident they can share how they operate as, “by the time the competition reaches them, they expect to be already ahead”. They also apply a strict code of ethics with which its shareholders are greatly satisfied. This totally transparent approach has also brought the attention, not just of new clients, but new potential company investors.
From an internal point of view, and as anticipated by Moeuf et al. [87] and Dassisti, et al. [21], InnoMet’s R+D+i management system has enabled the company to systematize and channel all the company’s R+D+i activities. But thanks to the UNE 166002 high level structure (HLS), this new management system has also allowed perfect integration with other management systems already in place in InnoMet (the ISO 9001, EN 9100, and the ISO 170025). This way, innovation units can grow, be better planned and organized, constantly redefine their processes, and keep key human resources updated (trained) with the latest metrology techniques. Benefits of this high level integration were also partially envisaged by Oesterreich and Teuteberg [118], and Müller, Buliga and Voigt [13].
In summary, InnoMet’s new R+D+i management system has empowered the company and they are being compensated by their clients. These outcomes were found in Chesbrough’s [119] and Massa, Tucci and Afuah’s [120] studies, however, they are rarely found in the context of SMEs.
7. Conclusions
The aerospace sector involves very demanding regulations and high-quality sustainability requirements. However, I4.0 is bringing increasing digitization and automation of the manufacturing processes, as well as the empowerment of the supply chain actors [20]. Nowadays, OEMs offer great opportunities for supplying companies to get involved in the processes of the companies they supply to. This involvement gives access to first-hand knowledge about the clients’ needs and indirectly, their competitors’ (absence of) capacities. Companies in this sector can harness these opportunities and improve the way they operate. For this reason, they must also establish mechanisms that allow them to generate new knowledge and transfer it to their clients, as well as to optimize previous products and services.
With the intention of expanding the knowledge on research management on SMEs (not just research, development and innovation, R+D+i, but technology and strategy management as well), a case study has been analyzed. The case study has described an SME providing metrology services in the aerospace sector. This SME decides to obtain an innovative seal awarded by the Spanish Ministry of Economy and Business. Being awarded this seal, besides allowing the company to better manage all its R+D+i activities, gives it access to a series of preferential advantages (tax deductions, special tenders, additional lines of funding, etc.). All these outcomes can significantly improve the company’s competitiveness and allow that company to keep improving over time.
The major contribution of this study is depicting how a real SME operationalized the implementation of an R+D+i management system, from detecting the need, to implement it, even test it. Almost all the steps and decisions taken by the company can be exported to other industrial contexts. In short, this company took the following steps. After a SWOT analysis was performed by InnoMet’s experts’ committee, and thanks to an internal decision-making process based on AHP, an R+D+i management system based on the UNE 166002 standard was selected. This standard will drive InnoMet’s innovation activities from now on. Particularly, InnoMet’s new R+D+i management system will guide the company in: Identifying new opportunities for diversification facilitating different types of innovation, highlighting resource needs, involving the senior management and promote an innovative culture, strengthening cooperation and, eventually, favoring the creation of new knowledge. It is also expected that this new management system will increase the company’s competitiveness (e.g., by reducing cost, shortening response times and increasing quality). Finally, in order to check the adequacy of the R+D+i management system once it was implemented, a pilot project was closely followed-up. This pilot project involved the design and development of non-destructive metrological methodologies for the assessment of automatic drilling and riveting machines processes. Because of the results of this pilot project, previous measurement methods were indeed simplified; costs, risks and variability were reduced, and new mechanization methods emerged.
This paper contributes to the scientific understanding of how R+D+i work and can be adopted in SMEs. However, the qualitative nature of the paper and its reliance on a single case study may raise some issues regarding the generalizability of results. Hopefully, this limitation is attenuated by the representativeness of the case study analyzed. Still, the present study should encourage future analyses expanding the implementation steps of R+D+i management systems in industrial SMEs. This area has been clearly lacking in recent research, but it is absolutely worth revisiting in the I4.0 context.
Further recommendations for future research include the application of quantitative research methods to verify and quantify the qualitative results and outcomes found in this preliminary analysis. A comparison of SMEs with larger companies would also be of interest to understand which differences and similarities can be found between both types of companies. Furthermore, further analysis of the necessary actions of companies oriented to develop their own supply chain may be of interest. Finally, analyses on the risks of integrating a company’s multiple management systems will also be greatly beneficial to both SMEs and bigger companies operating in the increasingly demanding I4.0 context.
Author Contributions
Conceptualization, A.C.-N., D.G.-J.; methodology, A.C.-N., M.C.G.-C.; software, M.C.G.-C.; validation, A.C.-N., M.C.G.-C., P.B.-P.; formal analysis, D.G.-J., M.O.-M.; investigation, A.C.-N., D.G.-J.; resources, D.G.-J., M.C.G.-C., A.P.-F.; data curation, A.C.-N., D.G.-J.; writing—original draft preparation, A.C.-N., D.G.-J., M.C.G.-C.; writing—review and editing, A.C.-N., A.P.-F., P.B.-P.; visualization, A.C.-N., D.G.-J.; supervision, M.C.G.-C., A.P.-F.; project administration, A.C.-N., D.G.-J.; funding acquisition, A.C.-N., A.P.-F., M.O.-M.
Funding
This research received no external funding.
Acknowledgments
To the INTELPREV Group and the Plan for the Promotion of Research and Transfer of the University of Cádiz. The last author also acknowledges the Spanish Ministry of Science, Innovation and Universities for his Ramon y Cajal contract (RYC-2017-22222) co-funded by the European Social Fund.
Conflicts of Interest
The authors declare no conflict of interest.
Appendix A
Appendix A.1. Binding Reasoned Report (BRR)

Figure A1.
General scheme of the Binding reasoned report (BRR) grant process.
Figure A1.
General scheme of the Binding reasoned report (BRR) grant process.


Figure A2.
Evolution of BRRs (Binding reasoned report) and applicants (SMEs and large companies (LEs)) in Spain 2005-2017.
Figure A2.
Evolution of BRRs (Binding reasoned report) and applicants (SMEs and large companies (LEs)) in Spain 2005-2017.

Appendix A.2. AENOR EA0047 Specification
The Technological Innovation Panel (PITEC) is a database resulting from the common effort of the National Statistics Institute (INE) and the Spanish Foundation for Science and Technology (FECYT), in collaboration with the Foundation for Technological Innovation (COTEC). PITEC includes more than 460 variables of the technological innovation activities of around 12,000 Spanish companies.
Figure A3 simulates the grade of the fulfillment of the criteria included in the EA 0047 specification by those enterprises registered in 2017 into the PITEC. It must be noted that only 25% of the registered companies reached the minimum value (400 points or more) to pass the certification process.

Figure A3.
Simulation using EA 0047 indicators to innovative SMEs included in the PITEC (Technological Innovation Panel) database.
Figure A3.
Simulation using EA 0047 indicators to innovative SMEs included in the PITEC (Technological Innovation Panel) database.

Appendix A.3. AENOR UNE 166002 R+D+i Management
The process of certifying the R+D+i management system according to the standard UNE 166002 requirements is based on the process of external audits based on compliance with the provision of evidence, similar to other certification schemes, as can be tested in Figure A4.

Figure A4.
Flowchart of the certification process.
Figure A4.
Flowchart of the certification process.

Quality and environment are the areas with more companies certified, as shown in Figure A5. It can be noted that the most generalist one (ISO 9001) has been halved since the Spanish real estate bubble crisis. The second one (ISO 14001) has remained stable. On the contrary, the number of companies certified by UNE 166002 standard, as well as other specific standards, like ISO 27001 (information security management), ISO 22000 (food safety management) and ISO 50001 (energy management), has increased steadily over the same period of time, as shown in Figure A6.

Figure A5.
Number of Spanish certifications by ISO 9001 and 14001 from 2003 to 2017.
Figure A5.
Number of Spanish certifications by ISO 9001 and 14001 from 2003 to 2017.


Figure A6.
Number of Spanish certifications by ISO 22000, 27001, 50001 and UNE 166002 from 2003 to 2017.
Figure A6.
Number of Spanish certifications by ISO 22000, 27001, 50001 and UNE 166002 from 2003 to 2017.

Appendix B
Appendix B.1. AHP Matrices
Table A1.
First level node comparisons with respect to the goal.
Table A1.
First level node comparisons with respect to the goal.
| Cluster | Node | > | = | < | Node | ||||||||||||||
|---|---|---|---|---|---|---|---|---|---|---|---|---|---|---|---|---|---|---|---|
| ? | C1. | 9 | 8 | 7 | 6 | 5 | 4 | 3 | 2 | 1 | 2 | 3 | 4 | 5 | 6 | 7 | 8 | 9 | C2. |
| C1. | 9 | 8 | 7 | 6 | 5 | 4 | 3 | 2 | 1 | 2 | 3 | 4 | 5 | 6 | 7 | 8 | 9 | C3. | |
| C1. | 9 | 8 | 7 | 6 | 5 | 4 | 3 | 2 | 1 | 2 | 3 | 4 | 5 | 6 | 7 | 8 | 9 | C4. | |
| C2. | 9 | 8 | 7 | 6 | 5 | 4 | 3 | 2 | 1 | 2 | 3 | 4 | 5 | 6 | 7 | 8 | 9 | C3. | |
| C2. | 9 | 8 | 7 | 6 | 5 | 4 | 3 | 2 | 1 | 2 | 3 | 4 | 5 | 6 | 7 | 8 | 9 | C4. | |
| C3. | 9 | 8 | 7 | 6 | 5 | 4 | 3 | 2 | 1 | 2 | 3 | 4 | 5 | 6 | 7 | 8 | 9 | C4. | |
Table A2.
Second level node comparisons with respect to first level.
Table A2.
Second level node comparisons with respect to first level.
| Cluster | Node | > | = | < | Node | ||||||||||||||
|---|---|---|---|---|---|---|---|---|---|---|---|---|---|---|---|---|---|---|---|
| C1. | C1.1. | 9 | 8 | 7 | 6 | 5 | 4 | 3 | 2 | 1 | 2 | 3 | 4 | 5 | 6 | 7 | 8 | 9 | C1.2. |
| C1.1. | 9 | 8 | 7 | 6 | 5 | 4 | 3 | 2 | 1 | 2 | 3 | 4 | 5 | 6 | 7 | 8 | 9 | C1.3. | |
| C1.1. | 9 | 8 | 7 | 6 | 5 | 4 | 3 | 2 | 1 | 2 | 3 | 4 | 5 | 6 | 7 | 8 | 9 | C1.4. | |
| C1.2. | 9 | 8 | 7 | 6 | 5 | 4 | 3 | 2 | 1 | 2 | 3 | 4 | 5 | 6 | 7 | 8 | 9 | C1.3. | |
| C1.2. | 9 | 8 | 7 | 6 | 5 | 4 | 3 | 2 | 1 | 2 | 3 | 4 | 5 | 6 | 7 | 8 | 9 | C1.4. | |
| C1.3. | 9 | 8 | 7 | 6 | 5 | 4 | 3 | 2 | 1 | 2 | 3 | 4 | 5 | 6 | 7 | 8 | 9 | C1.4. | |
| > | = | < | |||||||||||||||||
| C2. | C2.1. | 9 | 8 | 7 | 6 | 5 | 4 | 3 | 2 | 1 | 2 | 3 | 4 | 5 | 6 | 7 | 8 | 9 | C2.2. |
| C2.1. | 9 | 8 | 7 | 6 | 5 | 4 | 3 | 2 | 1 | 2 | 3 | 4 | 5 | 6 | 7 | 8 | 9 | C2.3. | |
| C2.1. | 9 | 8 | 7 | 6 | 5 | 4 | 3 | 2 | 1 | 2 | 3 | 4 | 5 | 6 | 7 | 8 | 9 | C2.4. | |
| C2.2. | 9 | 8 | 7 | 6 | 5 | 4 | 3 | 2 | 1 | 2 | 3 | 4 | 5 | 6 | 7 | 8 | 9 | C2.3. | |
| C2.2. | 9 | 8 | 7 | 6 | 5 | 4 | 3 | 2 | 1 | 2 | 3 | 4 | 5 | 6 | 7 | 8 | 9 | C2.4. | |
| C2.3. | 9 | 8 | 7 | 6 | 5 | 4 | 3 | 2 | 1 | 2 | 3 | 4 | 5 | 6 | 7 | 8 | 9 | C2.4. | |
| > | = | < | |||||||||||||||||
| C3. | C3.1. | 9 | 8 | 7 | 6 | 5 | 4 | 3 | 2 | 1 | 2 | 3 | 4 | 5 | 6 | 7 | 8 | 9 | C3.2. |
| C3.1. | 9 | 8 | 7 | 6 | 5 | 4 | 3 | 2 | 1 | 2 | 3 | 4 | 5 | 6 | 7 | 8 | 9 | C3.3. | |
| C3.1. | 9 | 8 | 7 | 6 | 5 | 4 | 3 | 2 | 1 | 2 | 3 | 4 | 5 | 6 | 7 | 8 | 9 | C3.4. | |
| C3.2. | 9 | 8 | 7 | 6 | 5 | 4 | 3 | 2 | 1 | 2 | 3 | 4 | 5 | 6 | 7 | 8 | 9 | C3.3. | |
| C3.2. | 9 | 8 | 7 | 6 | 5 | 4 | 3 | 2 | 1 | 2 | 3 | 4 | 5 | 6 | 7 | 8 | 9 | C3.4. | |
| C3.3. | 9 | 8 | 7 | 6 | 5 | 4 | 3 | 2 | 1 | 2 | 3 | 4 | 5 | 6 | 7 | 8 | 9 | C3.4. | |
| > | = | < | |||||||||||||||||
| C4. | C4.1. | 9 | 8 | 7 | 6 | 5 | 4 | 3 | 2 | 1 | 2 | 3 | 4 | 5 | 6 | 7 | 8 | 9 | C4.2. |
| C4.1. | 9 | 8 | 7 | 6 | 5 | 4 | 3 | 2 | 1 | 2 | 3 | 4 | 5 | 6 | 7 | 8 | 9 | C4.3. | |
| C4.1. | 9 | 8 | 7 | 6 | 5 | 4 | 3 | 2 | 1 | 2 | 3 | 4 | 5 | 6 | 7 | 8 | 9 | C4.4. | |
| C4.2. | 9 | 8 | 7 | 6 | 5 | 4 | 3 | 2 | 1 | 2 | 3 | 4 | 5 | 6 | 7 | 8 | 9 | C4.3. | |
| C4.2. | 9 | 8 | 7 | 6 | 5 | 4 | 3 | 2 | 1 | 2 | 3 | 4 | 5 | 6 | 7 | 8 | 9 | C4.4. | |
| C4.3. | 9 | 8 | 7 | 6 | 5 | 4 | 3 | 2 | 1 | 2 | 3 | 4 | 5 | 6 | 7 | 8 | 9 | C4.4. | |
Table A3.
Alternatives node comparisons with respect to second level.
Table A3.
Alternatives node comparisons with respect to second level.
| Cluster | Node | > | = | < | Node | ||||||||||||||
|---|---|---|---|---|---|---|---|---|---|---|---|---|---|---|---|---|---|---|---|
| C1.1. | A. | 9 | 8 | 7 | 6 | 5 | 4 | 3 | 2 | 1 | 2 | 3 | 4 | 5 | 6 | 7 | 8 | 9 | B. |
| A. | 9 | 8 | 7 | 6 | 5 | 4 | 3 | 2 | 1 | 2 | 3 | 4 | 5 | 6 | 7 | 8 | 9 | C. | |
| B. | 9 | 8 | 7 | 6 | 5 | 4 | 3 | 2 | 1 | 2 | 3 | 4 | 5 | 6 | 7 | 8 | 9 | C. | |
| C1.2. | A. | 9 | 8 | 7 | 6 | 5 | 4 | 3 | 2 | 1 | 2 | 3 | 4 | 5 | 6 | 7 | 8 | 9 | B. |
| A. | 9 | 8 | 7 | 6 | 5 | 4 | 3 | 2 | 1 | 2 | 3 | 4 | 5 | 6 | 7 | 8 | 9 | C. | |
| B. | 9 | 8 | 7 | 6 | 5 | 4 | 3 | 2 | 1 | 2 | 3 | 4 | 5 | 6 | 7 | 8 | 9 | C. | |
| C1.3. | A. | 9 | 8 | 7 | 6 | 5 | 4 | 3 | 2 | 1 | 2 | 3 | 4 | 5 | 6 | 7 | 8 | 9 | B. |
| A. | 9 | 8 | 7 | 6 | 5 | 4 | 3 | 2 | 1 | 2 | 3 | 4 | 5 | 6 | 7 | 8 | 9 | C. | |
| B. | 9 | 8 | 7 | 6 | 5 | 4 | 3 | 2 | 1 | 2 | 3 | 4 | 5 | 6 | 7 | 8 | 9 | C. | |
| C1.4. | A. | 9 | 8 | 7 | 6 | 5 | 4 | 3 | 2 | 1 | 2 | 3 | 4 | 5 | 6 | 7 | 8 | 9 | B. |
| A. | 9 | 8 | 7 | 6 | 5 | 4 | 3 | 2 | 1 | 2 | 3 | 4 | 5 | 6 | 7 | 8 | 9 | C. | |
| B. | 9 | 8 | 7 | 6 | 5 | 4 | 3 | 2 | 1 | 2 | 3 | 4 | 5 | 6 | 7 | 8 | 9 | C. | |
| C2.1. | A. | 9 | 8 | 7 | 6 | 5 | 4 | 3 | 2 | 1 | 2 | 3 | 4 | 5 | 6 | 7 | 8 | 9 | B. |
| A. | 9 | 8 | 7 | 6 | 5 | 4 | 3 | 2 | 1 | 2 | 3 | 4 | 5 | 6 | 7 | 8 | 9 | C. | |
| B. | 9 | 8 | 7 | 6 | 5 | 4 | 3 | 2 | 1 | 2 | 3 | 4 | 5 | 6 | 7 | 8 | 9 | C. | |
| C2.2. | A. | 9 | 8 | 7 | 6 | 5 | 4 | 3 | 2 | 1 | 2 | 3 | 4 | 5 | 6 | 7 | 8 | 9 | B. |
| A. | 9 | 8 | 7 | 6 | 5 | 4 | 3 | 2 | 1 | 2 | 3 | 4 | 5 | 6 | 7 | 8 | 9 | C. | |
| B. | 9 | 8 | 7 | 6 | 5 | 4 | 3 | 2 | 1 | 2 | 3 | 4 | 5 | 6 | 7 | 8 | 9 | C. | |
| C2.3. | A. | 9 | 8 | 7 | 6 | 5 | 4 | 3 | 2 | 1 | 2 | 3 | 4 | 5 | 6 | 7 | 8 | 9 | B. |
| A. | 9 | 8 | 7 | 6 | 5 | 4 | 3 | 2 | 1 | 2 | 3 | 4 | 5 | 6 | 7 | 8 | 9 | C. | |
| B. | 9 | 8 | 7 | 6 | 5 | 4 | 3 | 2 | 1 | 2 | 3 | 4 | 5 | 6 | 7 | 8 | 9 | C. | |
| C2.4. | A. | 9 | 8 | 7 | 6 | 5 | 4 | 3 | 2 | 1 | 2 | 3 | 4 | 5 | 6 | 7 | 8 | 9 | B. |
| A. | 9 | 8 | 7 | 6 | 5 | 4 | 3 | 2 | 1 | 2 | 3 | 4 | 5 | 6 | 7 | 8 | 9 | C. | |
| B. | 9 | 8 | 7 | 6 | 5 | 4 | 3 | 2 | 1 | 2 | 3 | 4 | 5 | 6 | 7 | 8 | 9 | C. | |
| C3.1. | A. | 9 | 8 | 7 | 6 | 5 | 4 | 3 | 2 | 1 | 2 | 3 | 4 | 5 | 6 | 7 | 8 | 9 | B. |
| A. | 9 | 8 | 7 | 6 | 5 | 4 | 3 | 2 | 1 | 2 | 3 | 4 | 5 | 6 | 7 | 8 | 9 | C. | |
| B. | 9 | 8 | 7 | 6 | 5 | 4 | 3 | 2 | 1 | 2 | 3 | 4 | 5 | 6 | 7 | 8 | 9 | C. | |
| C3.2. | A. | 9 | 8 | 7 | 6 | 5 | 4 | 3 | 2 | 1 | 2 | 3 | 4 | 5 | 6 | 7 | 8 | 9 | B. |
| A. | 9 | 8 | 7 | 6 | 5 | 4 | 3 | 2 | 1 | 2 | 3 | 4 | 5 | 6 | 7 | 8 | 9 | C. | |
| B. | 9 | 8 | 7 | 6 | 5 | 4 | 3 | 2 | 1 | 2 | 3 | 4 | 5 | 6 | 7 | 8 | 9 | C. | |
| C3.3. | A. | 9 | 8 | 7 | 6 | 5 | 4 | 3 | 2 | 1 | 2 | 3 | 4 | 5 | 6 | 7 | 8 | 9 | B. |
| A. | 9 | 8 | 7 | 6 | 5 | 4 | 3 | 2 | 1 | 2 | 3 | 4 | 5 | 6 | 7 | 8 | 9 | C. | |
| B. | 9 | 8 | 7 | 6 | 5 | 4 | 3 | 2 | 1 | 2 | 3 | 4 | 5 | 6 | 7 | 8 | 9 | C. | |
| C3.4. | A. | 9 | 8 | 7 | 6 | 5 | 4 | 3 | 2 | 1 | 2 | 3 | 4 | 5 | 6 | 7 | 8 | 9 | B. |
| A. | 9 | 8 | 7 | 6 | 5 | 4 | 3 | 2 | 1 | 2 | 3 | 4 | 5 | 6 | 7 | 8 | 9 | C. | |
| B. | 9 | 8 | 7 | 6 | 5 | 4 | 3 | 2 | 1 | 2 | 3 | 4 | 5 | 6 | 7 | 8 | 9 | C. | |
| C4.1. | A. | 9 | 8 | 7 | 6 | 5 | 4 | 3 | 2 | 1 | 2 | 3 | 4 | 5 | 6 | 7 | 8 | 9 | B. |
| A. | 9 | 8 | 7 | 6 | 5 | 4 | 3 | 2 | 1 | 2 | 3 | 4 | 5 | 6 | 7 | 8 | 9 | C. | |
| B. | 9 | 8 | 7 | 6 | 5 | 4 | 3 | 2 | 1 | 2 | 3 | 4 | 5 | 6 | 7 | 8 | 9 | C. | |
| C4.2. | A. | 9 | 8 | 7 | 6 | 5 | 4 | 3 | 2 | 1 | 2 | 3 | 4 | 5 | 6 | 7 | 8 | 9 | B. |
| A. | 9 | 8 | 7 | 6 | 5 | 4 | 3 | 2 | 1 | 2 | 3 | 4 | 5 | 6 | 7 | 8 | 9 | C. | |
| B. | 9 | 8 | 7 | 6 | 5 | 4 | 3 | 2 | 1 | 2 | 3 | 4 | 5 | 6 | 7 | 8 | 9 | C. | |
| C4.3. | A. | 9 | 8 | 7 | 6 | 5 | 4 | 3 | 2 | 1 | 2 | 3 | 4 | 5 | 6 | 7 | 8 | 9 | B. |
| A. | 9 | 8 | 7 | 6 | 5 | 4 | 3 | 2 | 1 | 2 | 3 | 4 | 5 | 6 | 7 | 8 | 9 | C. | |
| B. | 9 | 8 | 7 | 6 | 5 | 4 | 3 | 2 | 1 | 2 | 3 | 4 | 5 | 6 | 7 | 8 | 9 | C. | |
| C4.4. | A. | 9 | 8 | 7 | 6 | 5 | 4 | 3 | 2 | 1 | 2 | 3 | 4 | 5 | 6 | 7 | 8 | 9 | B. |
| A. | 9 | 8 | 7 | 6 | 5 | 4 | 3 | 2 | 1 | 2 | 3 | 4 | 5 | 6 | 7 | 8 | 9 | C. | |
| B. | 9 | 8 | 7 | 6 | 5 | 4 | 3 | 2 | 1 | 2 | 3 | 4 | 5 | 6 | 7 | 8 | 9 | C. | |
Table A4.
Inconsistency report.
Table A4.
Inconsistency report.
| Rank | Row | Column | Current Value | Best Value | Old Inconsistency | New Inconsistency | % Improvement |
|---|---|---|---|---|---|---|---|
| 1 | C3 | C4 | 5.000000 | 1.599312 | 0.099511 | 0.035723 | 64.10% |
| 2 | C1 | C3 | 4.000000 | 1.338818 | 0.099511 | 0.045572 | 54.20% |
| 3 | C2 | C4 | 3.000000 | 1.199659 | 0.099511 | 0.055951 | 43.77% |
| 4 | C1 | C2 | 8.000000 | 9.265439 | 0.099511 | 0.063982 | 35.70% |
| 5 | C1 | C4 | 6.000000 | 7.173657 | 0.099511 | 0.097511 | 02.01% |
| 6 | C2 | C3 | 5.000000 | 5.692548 | 0.099511 | 0.099155 | 00.36% |
Appendix B.2. Self-assessment (EA0047)
Table A5.
Self-assessment of the degree of innovation of InnoMet according to the EA0047 specification.
Table A5.
Self-assessment of the degree of innovation of InnoMet according to the EA0047 specification.
| Limit Score | Epigraph | InnoMet Score |
|---|---|---|
| 400 | Applied resources | 235 |
| 195 | Human resources | 135 |
| 120 | Staff dedicated to R+D+i activities | 60 |
| 65 | Graduate staff dedicated to R+D+i activities | 65 |
| 10 | Compensation for voluntary dedication to R+D+i activities | 10 |
| 205 | Economic-financial Resources | 100 |
| 20 | International public funding of R+D+i | 0 |
| 15 | National public funding of R+D+i | 15 |
| 5 | Public research grants | 0 |
| 15 | Private funding | 15 |
| 100 | Investment in R+D+i expenses | 20 |
| 50 | R+D related to R+D+i expenses | 50 |
| 200 | Innovation process | 150 |
| 120 | Ways to innovate | 100 |
| 60 | R+D+i projects with Research Organizations | 40 |
| 60 | Collaborative R+D+i execution | 60 |
| 80 | Innovation Organization | 50 |
| 10 | Relationship with suppliers to increase innovative capacity | 0 |
| 10 | Knowledge of novelties to increase innovative capacity | 10 |
| 10 | Client feedback to increase innovative capacity | 10 |
| 30 | Analytical accounting to identify R+D+i activities | 30 |
| 10 | Training institutions to increase innovative capacity | 0 |
| 10 | Communication policy to disseminate R+D+i results | 0 |
| 400 | Results and valorization | 115 |
| 60 | Records | 0 |
| 20 | International patents and utility models | 0 |
| 20 | National patents and utility models | 0 |
| 10 | International and/or national industrial designs | 0 |
| 10 | International and/or national trademarks | 0 |
| 80 | Process results | 50 |
| Introduction of innovative products and services on market | 40 | |
| Introduction of innovative marketing techniques on market | 0 | |
| Advertising of innovation | 10 | |
| 50 | R+D+i employment | 20 |
| 50 | Social Security contribution by R+D+i staff | 20 |
| 210 | Economic return | 45 |
| 30 | Incomes from patent licenses | 0 |
| 120 | Sales of new products or services | 30 |
| 60 | Exports of new products or services | 15 |
| 1000 | Total EA0047 | 500 |
Appendix B.3. Documents Management System

Figure A7.
Modifications to the InnoMet organization chart.
Figure A7.
Modifications to the InnoMet organization chart.


Figure A8.
Modifications to the InnoMet processes map.
Figure A8.
Modifications to the InnoMet processes map.

Table A6.
Performance indicators implemented by InnoMet.
Table A6.
Performance indicators implemented by InnoMet.
| R+D+i projects | |
| No. of research and development projects | No. of product innovation projects |
| No. of people in R+D+i projects | No. of external collaborations |
| No. of R+D+i projects discontinued | No. of R+D+I projects in development |
| No. of R+D+i projects completed | Achievement of milestones reached |
| Time and cost deviation of projects (%) | Targets deviation (%) |
| Phase of technology surveillance and competitive intelligence | |
| No. of consultations | No. of studies carried out |
| No. of sources consulted | No. of subcontracted services |
| No. of low-level reports | No. of mid-level reports |
| No. of high-level reports | No. of valorization reports |
| No. of trade fair attendees | No. of scientific congresses attendees |
| Phase of capturing ideas, valorization and evaluation | |
| No. of ideas captured | No. of ideas received |
| No. of ideas validated | No. of ideas rejected |
| No. of ideas in suspense | No. of ideas by type of service |
| No. of ideas by professional category | No. of potential customer ideas |
| No. of employees raising ideas | No. of market studies |
| Phase of protection, transfer and market introduction | |
| No. of R+D+i projects with funding | No. of R+D+i projects with financing |
| No. of protection acts initiated | No. of successfully completed events |
| No. of contracts signed | No. of contracts satisfactorily completed |
| No. of patents applied | No. of patents exploited |
| No. of utility models granted | No. of utility models exploited |
| No. of marks granted | No. of brands granted |
| No. of industrial designs applied | No. of software recorded |
| No. of intellectual property licenses | No. of know-how license agreements |
| No. of projects disseminated | No. of innovations introduced |
| Invoicing of R+D+i projects | Sales from R+D+i of previous years |
| Incomes from R+D+i projects | Savings from process innovations |
| Incomes from patents | Revenues from operating brands |
| Incomes from operating profit models | Revenues from industrial designs |
| Incomes from intellectual properties | Revenues from software registration |
| Impact of R+D+i projects | Revenues from know-how licenses |
Appendix C
The pilot project (success case) which is addressed after the implementation of the R+D+i management system is developed in this appendix.
Appendix C.1. Project Objectives
Regardless of materials that conform to aeronautical structures, the mechanical jointing method (riveting) is still the most used to assemble aircraft sections. The assembly panels that configure these sections are composed of several plates of equal or different materials, such as aluminum alloys, titanium or carbon fiber, which are connected through joints using rivets in their drilled holes.
The proper functioning of aeronautical structures in terms of stresses, vibrations and fatigue depends fundamentally on the good fit between rivets and holes. A poor fit between them significantly reduces the service life of pieces, increasing the chances of catastrophic structural failure. Any aeronautical structure involves hundreds of thousands of rivets. In this context, it is necessary to verify both the hole parameters and the rivet ones, with very strict tolerances. From this repetitive and technically demanding process comes the automation of drilling and automatic riveting operations in mechanical joining processes.
Drilling and riveting process, from the point of view of the aeronautical sector, is considered a special process, which needs to be technically validated and qualified in a phase prior to its acceptance and implementation to ensure its capacity. A special process may be defined as one whose results cannot be fully verified by product inspection and testing or when deficiencies can only be revealed after the product is used. The autonomous technical qualification of an automatic drilling and riveting process is determined by the materials, facilities and equipment, personnel, tools life, assembly and verification of test plates. Traditionally, the evaluation of the parameters that characterize the quality of riveted joints (holes and rivets installed) is conditioned by, among other factors:
- The complexity of measurement by traditional and direct methods.
- Measurement elements that do not comply with the tolerance/uncertainty relationship.
- Impossibility of evaluation, due to the size of the elements that integrate the union.
- High investment in time and resources for the evaluation.
- Lack of flexibility in procedures.
- Use of destructive methods.
The objective of this research and development (R+D) project is the development of a non-destructive metrological model for the technical qualification of special processes in machines dedicated to the automatic drilling and riveting of strategic materials in the aerospace industry. The purpose is to give technical validity for the design of a methodology to characterize complex dimensional and macro/microgeometric parameters, evaluated using polymer replications. The development of this project arises from the observation of a need detected in an internal procedure of an external client (aerospace OEM).
As mentioned above, part of the technical qualification process is the elaboration of test plates that represent common working conditions, using procedures, cutting tools, rivets and staff technical qualification. Generally, the design and execution of drilling and riveting test plates are based on the establishment, among others, of the following variables:
- Cutting parameters (speed, feed and depth of cut).
- Hole diameters and countersinks.
- Stack types and thicknesses.
- Material types.
- Cutting/drilling system types.
- Cutter materials and geometries.
- Lubrication and cooling systems.
- Clamping systems.
In Figure A9, several examples of automatic drilling test plates (with and without rivets installed in different materials) are shown.

Figure A9.
Test plates for drilling and riveting process qualification.
Figure A9.
Test plates for drilling and riveting process qualification.

In Table A7, the parameters usually required for an aeronautical drilling and riveting process are gathered, starting from the execution of test plates according to indicated technological variables and distinguishing between drills (without installed rivets) and riveted joints (with them).
Table A7.
Set of parameters usually evaluated for drilling and riveting process technical qualification.
Table A7.
Set of parameters usually evaluated for drilling and riveting process technical qualification.
| 1 | Drilled hole (with no installed fastener/rivet) | |
| 1.1 | Dimensional | |
| Hole diameter | Radius or chamfer surface-hole | |
| Countersink diameter | Radius or chamfer countersink-hole | |
| Countersink height | Burr height (entrance or exit) | |
| Countersink angle | ||
| 1.2 | Macrogeometry | |
| Hole/countersink coaxiality | Surface/hole perpendicularity | |
| Surface/countersink perpendicularity | Hole/countersink coaxiality | |
| Hole/countersink concentricity | ||
| 1.3 | Microgeometry | |
| Hole roughness | Countersink roughness | |
| 2. | Fastener/rivet installation | |
| Fastener length | Test samples thickness | |
| Rivet clearance | Driven rivet button diameter | |
| Rivet flushness | Driven rivet button height | |
| Presence of debris or chip | Overheating, contamination/damage | |
| Sealant thickness | ||
Appendix C.2. Experimental Procedure
Appendix C.2.1. Description of the Polymer used for the Evaluation of Dimensional Characteristics
The main property sought in the product that allows the reproduction of dimensions, geometries and surfaces that compose a drilled hole, is the possibility to faithfully reproduce it, in order to be evaluated. This fact implies a very low reproducibility error, with a final rigid consistency that makes it possible to measure with and without contact measurement systems, high hardness, with the slight percentage of elasticity and elongation break, that favour the operations of demoulding and that allows to be sectioned or cut without difficulties.
After an evaluation of commercial alternatives available that satisfy the requirements aforementioned, the material selected for impressions or replicas is a polymer composed by silicon using high-technology by vulcanizing addition, containing, vinyl, acid sylicic, aggregate material and colouring agent. With the aim to demonstrate the main capacities for reproducing geometry and surfaces, different replicas of pieces and elements are shown in Figure A10.

Figure A10.
Representative capabilities of impressions obtained by the polymer.
Figure A10.
Representative capabilities of impressions obtained by the polymer.

Main technical and quality control information are collected below:
- Final consistency: Semi-rigid
- Hardness: 80 Shore A
- Curing time (at 20 ºC): 6 min
- Elongation to failure: 8%
- Vertical and horizontal impression
- No heat and smell polymerization
- Shape-retention memory
- Reaction without oxygen or heat
- Dimensional stability
- No shrinkage during polymerization
- No residues on the surfaces
- Use on every kind of material
- Non-toxic and non-polluting
- High resistance to inorganic chemical agents
- Biocompatible and clean
- Impression unaffected by acids or bases
Appendix C.2.2. Technical Validation of Indirect Measurement of Dimensional and Geometrical Parameters through the use of Replicas
The objective of the technical validation is to determine the suitability in the use of polymer replicas for the measurement of dimensional and geometric parameters. A set of parameters selected simulate the parameters used in the evaluation of drilled test plates to qualify automatic drilling and riveting processes. A comparative methodology has been designed based in quantifying the dimensions by direct measurement of gauges and test pieces (Figure A11 left), and the indirect measurement obtained from the negatives (replicas or impressions) of the same gauges (Figure A11 right). From this comparative method it is possible to quantify the reproducibility errors caused by the use of this kind of replicas.
The technical validation scope is defined by:
- Hole diameters (d) from 4 mm to 15 mm and lengths (l) up to 15 mm.
- Angles (α) from 0º to 180º.
- Burr height (b) less than 1 mm
- Surface finish (s) in terms of roughness average (Ra) from 0.4 µm to 12.7 µm.

Figure A11.
Left: Gauges and test pieces. Right: Polymer impressions of gauges and test pieces.
Figure A11.
Left: Gauges and test pieces. Right: Polymer impressions of gauges and test pieces.

In order to isolate the component, due to the reproducibility of replicas, the same conditions have been maintained during the measurement of dimensional gauges/test pieces and replicas. To ensure the measurement process is repeatable and reproducible, these factors have been taken into account:
- The measurement process has been performed in a dimensional laboratory accredited under the standard ISO 17025:2017.
- The same measurement process has been used both gauges and replicas.
- Environmental conditions have been controlled and monitored.
- The same measurement system has been used.
Materials used to perform replicas of gauges and test pieces have been:
- Cleaning products.
- Polymer product, dispensing gun, injectors and nozzle tip.
- Auxiliary metal bushes retainers.
- Non-greasy plasticine.
Appendix C.2.3. Evaluation of Diameters
For the simulation of drilled holes diameter measurements, a set of five ring gauges with different nominal diameters ranging from 4 mm to 15 mm are used. Figure A12 shows every ring gauge and their replicas impressions. The values of diameters certified according to their calibration certificates were: 4,00076 ± 0,00059 mm, 5,50141 ± 0,00064 mm, 7,00055 ± 0,00067 mm, 9,99995 ±0,00064 mm, 15,00138 ± 0,00066 mm.

Figure A12.
Left: Ring gauges and their replicas. Center: Measurement of inner diameter in a ring gauge. Right: Replica diameter measurement.
Figure A12.
Left: Ring gauges and their replicas. Center: Measurement of inner diameter in a ring gauge. Right: Replica diameter measurement.

Measurements of ring gauges and replicas, have been carried out through a coordinate measurement machine (CMM) model Tesa Visio 300 manual, with optical vision system assisted by CAD-based measurement software, as shown in Figure A12. This measurement system is based in a non-contact measurement system by a high-resolution colour CCD camera and episcope coaxial illumination. From diameter values obtained and compared between different ring gauges and their replicas, the maximum reproducibility error of 0.005 mm is obtained.
Appendix C.2.4. Evaluation of Angles
In order to evaluate the reproducibility error in angular magnitude, a 90º angle gauge block and a thread gauge M25x1-Sh7 with 60º nominal flank angle are used. Angles measurement are conducted through a coordinate measurement machine (CMM) model Tesa Visio 300 manual with episcope coaxial illumination. Figure A13 shows the angle gauge block and their replica impressions, as well as a measurement setup. From the angle values obtained and compared with their replicas, the maximum reproducibility error of 0.227º is obtained.

Figure A13.
Left: Angle gauge blocks and their replicas. Center: Angle gauge block measurement. Right: Detail of angular measurement on thread gauge.
Figure A13.
Left: Angle gauge blocks and their replicas. Center: Angle gauge block measurement. Right: Detail of angular measurement on thread gauge.

Appendix C.2.5. Burr Height
An amplification roughness standard A1 type is used to simulate burr heights evaluation. This standard is characterized by a calibrated wide slot with a flat bottom and constant height certified of 8.98 ± 0.28 µm. Slot height measurement is carried out through a contact roughness device Mahr Perthometer Concept PGK120 with stylus MF250 with 90º angle and 2 µm radius tip (Figure A14). From height values obtained and compared with its replica, the maximum reproducibility error of 0.22 µm. is obtained.

Figure A14.
Left: A1 roughness standard and its replica impression. Right: Replica measurement using a roughness device.
Figure A14.
Left: A1 roughness standard and its replica impression. Right: Replica measurement using a roughness device.

Appendix C.2.6. Evaluation of Roughness
For the evaluation of microgeometry, C2 type roughness standard has been employed, which are characterization by periodical profiles patterns in the form of isosceles triangles repeated along its surface. Four roughness standards are used with certificate values in terms of roughness average (Ra): 1.48 ± 0.06 µm, 3.08 ± 0.11 µm, 6.42 ± 0.22 µm, and 12.73 ± 0.44 µm. In Figure A15, details of roughness standards and their replicas impressions obtained by polymer are shown. Furthermore, is shown the measurement process carried out by a contact roughness device Mahr Perthometer Concept PGK120 with stylus MF250 with 90º angle and 2 µm radius tip. All measures have been undertaken in accordance with roughness internationally standards and procedures. From the values obtained and compared between among different roughness standards and their replicas, the maximum reproducibility error of 0.07 µm is obtained.

Figure A15.
Left: C2 type roughness standards and their impressions. Right: Replica measurement using a contact roughness device.
Figure A15.
Left: C2 type roughness standards and their impressions. Right: Replica measurement using a contact roughness device.

Appendix C.3. Methodology for Obtaining Replicas in Test Plates to Qualify Automatic Drilling and Riveting Processes
From the results obtained in the experimental procedure (and with reproducibility errors according to specifications defined by the exigencies of automatic drilling and riveting aerospace processes), a methodology for evaluating drilled test plate involved in qualify procedures is designed and developed. The different stages of the process are briefly collected below, as summarizes Figure A16.
Stage 1. Test plate cleaning after drilling: It is desirable to carry out cleaning soaking a little some fabric in a solution of ether and alcohol, passing it through the inner surface of drills, in order to prevent any kind of impurity, contamination or chip that could be transferred to the replicas.
Stage 2. Rear face test plate sealing. It consists in placing an adhesive sealing tape on the opposite surface of the reference of the test plate (drill outlet), so that the material can be contained inside the hole and there is no excessive loss of it.
Stage 3. Set up of auxiliary retainers. It is important that metal bushes used as retainers are well fixed to the surface and they are positioned concentrically to holes, in order to avoid eccentricity problems that may cause measurement difficulties. For this purpose, non-greasy plasticine is used.
Stage 4. Replica performance. A nozzle tip and mixing injector are placed in the cartridge into the dispensing gun. The injection of the mixture into the hole must be done slowly, making small circular movements with the aim to fit the whole surface and filling metal bushes approximately 5–6 mm above the test plate surface. It is important to perform this step correctly, due to the probably of the formation of defects, such as a lack of product, bubbles or internal cavities induced by the bad deposition of the polymer. Once the hole filling has been completed, the curing and solidification process takes place depending on the size of the hole and ambient temperature, approximately 6–7 min.
Stage 5. Replica demoulding. Once the replica is curing and solidified, the adhesive tape, non-greasy plasticine and auxiliary metal bushes retainers are removed. The extraction of the replica is done by exerting a slight side-to-side movement while exerting a traction force in the axial direction (hole direction). After that, the replicas are identified and stored for further evaluations.

Figure A16.
Methodology for obtaining the replicas.
Figure A16.
Methodology for obtaining the replicas.

Appendix C.4. Project Results
The development of this project implies a significant advance in the characterization, measurement and evaluation of riveted joints and is conceptually delimited as R+D, according to the definitions and delimitations (positive and negative) in Law 27/2014 [102]. This project is considered an entirely R+D activity because of the novelty, previous studies carried out, which has led to a unique and singular methodology in the sector. Besides, it has incorporated substantial improvements in these industrial processes if compared to previous situations. More in detail:
- Polymer research:Activities carried out in this milestone are considered Research, because they are original studies to acquire new knowledge about the different market polymers and their characteristics for their choice in order to suit the need to obtain the pattern.
- Polymer test/error:Activities carried out in this milestone are considered Development, because they are tests undertaken with the polymers previously studied to verify they meet the necessary characteristics for the execution of the replica, which will later be validated in the parameters that need to be measured in holes of riveted joints.
- Monitoring, control and validation of the metrological method:Activities carried out in this milestone are considered Development, because they are the necessary works of measuring on the drill replica, comparing them with the corresponding calibrated standard for each one of the parameters to measure and verifying admitted tolerance ranges are fulfilled.
- Qualification and certification of the metrological method:Activities carried out in this milestone are considered Development, because they are the necessary works of certifying the metrological method evolved.
References
- Vlados, C.M.; Deniozos, N.; Chatzinikolaou, D.; Demertzis, M. Perceiving competitiveness under the restructuring process of globalization. Int. J. Bus. Manag. 2018, 13, 135. [Google Scholar] [CrossRef][Green Version]
- Bär, K.; Herbert-Hansen, Z.N.L.; Khalid, W. Considering Industry 4.0 aspects in the supply chain for an SME. Prod. Eng. 2018, 12, 747–758. [Google Scholar] [CrossRef]
- Kagermann, H. Change through digitization: Value creation in the age of Industry 4.0. In Management of Permanent Change; Albach, H., Meffert, H., Pinkwart, A., Ralf, R., Eds.; Springer Gabler: Wiesbaden, Germany, 2015; pp. 1–240. ISBN 978-3658050146. [Google Scholar]
- Maslarić, M.; Nikoličić, S.; Mirčetić, D. Logistics response to the Industry 4.0: The physical internet. Open Eng. 2016, 6, 511–517. [Google Scholar] [CrossRef]
- Love, J.H.; Roper, S. SME innovation, exporting and growth: A review of existing evidence. Int. Small Bus. J. Res. Entrep. 2015, 33, 28–48. [Google Scholar] [CrossRef]
- Scuotto, V.; Santoro, G.; Bresciani, S.; Del Giudice, M. Shifting intra- and inter-organizational innovation processes towards digital business: An empirical analysis of SMEs. Creat. Innov. Manag. 2017, 26, 247–255. [Google Scholar] [CrossRef]
- Erol, S.; Jäger, A.; Hold, P.; Ott, K.; Sihn, W. Tangible Industry 4.0: A Scenario-Based Approach to Learning for the Future of Production. Procedia CIRP 2016, 54, 13–18. [Google Scholar] [CrossRef]
- Chesbrough, H. Business model innovation: Opportunities and barriers. Long Range Plann. 2010, 43, 354–363. [Google Scholar] [CrossRef]
- Saebi, T.; Lien, L.; Foss, N.J. What drives business model adaptation? The impact of opportunities, threats and strategic orientation. Long Range Plann. 2017, 50, 567–581. [Google Scholar] [CrossRef]
- Santoro, G.; Ferraris, A.; Giacosa, E.; Giovando, G. How SMEs Engage in Open Innovation: a Survey. J. Knowl. Econ. 2018, 9, 561–574. [Google Scholar] [CrossRef]
- Faller, C.; Feldmúller, D. Industry 4.0 learning factory for regional SMEs. Procedia CIRP 2015, 32, 88–91. [Google Scholar] [CrossRef]
- Geissbauer, R.; Vedsø, J.; Schrauf, S.A. Strategist’s Guide to Industry 4.0. Global businesses are about to integrate their operations into a seamless digital whole, and thereby change the world. Strateg. Bus. 2016. [Google Scholar]
- Müller, J.M.; Buliga, O.; Voigt, K.I. Fortune favors the prepared: How SMEs approach business model innovations in Industry 4.0. Technol. Forecast. Soc. Change 2018, 132, 2–17. [Google Scholar] [CrossRef]
- Müller, J.M.; Voigt, K.I. Sustainable Industrial Value Creation in SMEs: A Comparison between Industry 4.0 and Made in China 2025. Int. J. Precis. Eng. Manuf. Green Technol. 2018, 5, 659–670. [Google Scholar] [CrossRef]
- Maynard, A.D. Navigating the fourth industrial revolution. Nat. Nanotechnol. 2015, 10, 1005–1006. [Google Scholar] [CrossRef]
- Kiel, D.; Arnold, C.; Müller, J.M. Sustainable industrial value creation: benefits and challenges of Industry 4.0. Int. J. Innov. Manag. 2017, 21, 1740015. [Google Scholar] [CrossRef]
- Voss, C.; Roth, A.V.; Chase, R.B. Experience, service operations strategy, and services as destinations: Foundations and exploratory investigation. Prod. Oper. Manag. 2008, 17, 247–266. [Google Scholar] [CrossRef]
- Müller, J.M. Business model innovation in small- and medium-sized enterprises. J. Manuf. Technol. Manag. 2019. [Google Scholar] [CrossRef]
- Kagermann, H.; Wahlster, W.; Helbig, J. Recommendations for Implementing the Strategic Initiative INDUSTRIE 4.0; Frankfurt, Germany, 2013. [Google Scholar]
- Mittal, S.; Khan, M.A.; Romero, D.; Wuest, T. A critical review of smart manufacturing & Industry 4.0 maturity models: Implications for small and medium-sized enterprises (SMEs). J. Manuf. Syst. 2018, 49, 194–214. [Google Scholar]
- Dassisti, M.; Giovannini, A.; Merla, P.; Chimienti, M.; Panetto, H. An approach to support Industry 4.0 adoption in SMEs using a core-metamodel. Annu. Rev. Control 2018, 1–9. [Google Scholar] [CrossRef]
- Schmidt, R.; Möhring, M.; Härting, R.-C.; Reichstein, C.; Neumaier, P.; Jozinović, P. Industry 4.0 - Potentials for creating smart products: Empirical research results. In Lecture Notes in Business Information Processing; Springer: Cham, Germany, 2015; Volume 208, pp. 16–27. ISBN 978-3319190273. [Google Scholar]
- Martínez-Jurado, P.J.; Moyano-Fuentes, J. Key determinants of lean production adoption: Evidence from the aerospace sector. Prod. Plan. Control 2014, 25, 332–345. [Google Scholar] [CrossRef]
- Bourke, J.; Roper, S. Innovation, quality management and learning: Short-term and longer-term effects. Res. Policy 2017, 46, 1505–1518. [Google Scholar] [CrossRef]
- Ralston, P.M.; Blackhurst, J.; Cantor, D.E.; Crum, M.R. A Structure-conduct-performance perspective of how strategic supply chain integration affects firm performance. J. Supply Chain Manag. 2015, 51, 47–64. [Google Scholar] [CrossRef]
- Macedo Filho, H.F.C.; Almeida, M.F.L. Measuring and evaluating innovation management in small and medium enterprises: proposition of a multicriteria model for selecting indicators and metrics. J. Phys. Conf. Ser. 2018, 1065, 1–4. [Google Scholar] [CrossRef]
- Cetindamar, D.; Phaal, R.; Probert, D. Understanding technology management as a dynamic capability: A framework for technology management activities. Technovation 2009, 29, 237–246. [Google Scholar] [CrossRef]
- Organisation for Economic Co-operation and Development. Frascati Manual. Guidelines for Collecting and Reporting Data on Research and Experimental Development. Measurement of Scientific, Technological and Innovation Activities; The Measurement of Scientific, Technological and Innovation Activities; OECD Publishing: Paris, France, 2015; ISBN 978-9264238800. [Google Scholar]
- Cetindamar, D.; Phaal, R.; Probert, D.R. Technology management as a profession and the challenges ahead. J. Eng. Technol. Manag. 2016, 41, 1–13. [Google Scholar] [CrossRef]
- Organisation for Economic Co-operation and Development. Eurostat Oslo Manual. Guidelines for Collecting and Interpreting Innovation Data; OECD Publishing: Paris, France, 2005; ISBN 978-9264013100. [Google Scholar]
- Schiederig, T.; Tietze, F.; Herstatt, C. Green innovation in technology and innovation management: An exploratory literature review. R D Manag. 2012, 42, 180–192. [Google Scholar] [CrossRef]
- Zeschky, M.B.; Winterhalter, S.; Gassmann, O. From Cost to Frugal and Reverse Innovation: Mapping the Field and Implications for Global Competitiveness. Res. Manag. 2014, 6308, 20–27. [Google Scholar]
- Horwitch, M.; Stohr, E.A. Transforming technology management education: Value creation-learning in the early twenty-first century. J. Eng. Technol. Manag. JET-M 2012, 29, 489–507. [Google Scholar] [CrossRef]
- Tidd, J.; Bessant, J.; Pavitt, K. Managing Innovation. Integrating Technological, Market and Organizational Change, 5th ed.; John Wiley & Sons: Chichester, UK, 2013; ISBN 978-1118360637. [Google Scholar]
- Lome, O.; Heggeseth, A.G.; Moen, Ã. The effect of R&D on performance: Do R&D-intensive firms handle a financial crisis better? J. High Technol. Manag. Res. 2016, 27, 65–77. [Google Scholar]
- Ngo, L.V.; O’Cass, A. Innovation and business success: The mediating role of customer participation. J. Bus. Res. 2013, 66, 1134–1142. [Google Scholar] [CrossRef]
- Camisón, C.; Villar-López, A. Organizational Innovation as an Enabler of Technological Innovation Capabilities and Firm Performance; Elsevier Inc.: Amsterdam, The Netherlands, 2014; Volume 67, ISBN 0148-2963. [Google Scholar]
- Shan, P.; Song, M.; Ju, X. Entrepreneurial orientation and performance: Is innovation speed a missing link? J. Bus. Res. 2016, 69, 683–690. [Google Scholar] [CrossRef]
- Dereli, D.D. Innovation management in global competition and competitive advantage. Procedia - Soc. Behav. Sci. 2015, 195, 1365–1370. [Google Scholar] [CrossRef]
- Villalobos Álvarez, L.A. La Gestión de la Innovación y las Capacidades Tecnológicas: Efectos y Determinantes. Ph.D. Thesis, Universidad de Murcia, Murcia, Spain, 2017. [Google Scholar]
- Erkut, B. The emergence of the ERP software market between product innovation and market shaping. J. Open Innov. Technol. Mark. Complex. 2018, 4, 23. [Google Scholar] [CrossRef]
- Mavroeidis, V.; Tarnawska, K. Toward a new innovation management standard. Incorporation of the knowledge triangle concept and quadruple innovation helix model into innovation management standard. J. Knowl. Econ. 2017, 8, 653–671. [Google Scholar] [CrossRef]
- Aragón-Correa, J.A.; García-Morales, V.J.; Cordón-Pozo, E. Leadership and organizational learning’s role on innovation and performance: Lessons from Spain. Ind. Mark. Manag. 2007, 36, 349–359. [Google Scholar] [CrossRef]
- Kuczmarski, T.D. What is innovation? And why aren’t companies doing more of it? J. Consum. Mark. 2003, 20, 536–541. [Google Scholar] [CrossRef]
- Knox, S. The boardroom agenda: Developing the innovative organisation. Corp. Gov. Int. J. Bus. Soc. 2002, 2, 27–36. [Google Scholar] [CrossRef]
- De Jong, J.P.J.; Den Hartog, D.N. How leaders influence employees’ innovative behaviour. Eur. J. Innov. Manag. 2007, 10, 41–64. [Google Scholar] [CrossRef]
- Cormican, K.; O’Sullivan, D. Auditing best practice for effective product innovation management. Technovation 2004, 24, 819–829. [Google Scholar] [CrossRef]
- Martínez-Costa, M.; Jimenez-Jimenez, D.; Castro-del-Rosario, Y.D.P. The performance implications of the UNE 166.000 standardised innovation management system. Eur. J. Innov. Manag. 2018, 21. [Google Scholar]
- Jin, J.; von Zedtwitz, M. Technological capability development in China’s mobile phone industry. Technovation 2008, 28, 327–334. [Google Scholar] [CrossRef]
- Cetindamar, D.; Phaal, R.; Probert, D. Technology Management: Activities and Tools, 2nd ed.; Palgrave Macmillan: London, UK, 2016; ISBN 978-1137431868. [Google Scholar]
- AENOR. UNE 166002:2014. R + D + i Management: R + D + i Management System Requirements; AENOR: Madrid, Spain, 2010. [Google Scholar]
- Mir, M.; Casadesús, M.; Petnji, L.H. The impact of standardized innovation management systems on innovation capability and business performance: An empirical study. J. Eng. Technol. Manag. 2016, 41, 26–44. [Google Scholar] [CrossRef]
- Khosravi, P.; Newton, C.; Rezvani, A. Management innovation: A systematic review and meta-analysis of past decades of research. Eur. Manag. J. 2019. [Google Scholar] [CrossRef]
- Shams, S.M.R.; Vrontis, D.; Weber, Y.; Tsoukatos, E. An integrated cross-functional model of strategic innovation management in business. In Business Models for Strategic Innovation; Routledge: Abingdon, UK; New York, NY, USA, 2018; pp. 176–187. [Google Scholar]
- Savino, T.; Messeni Petruzzelli, A.; Albino, V. Search and recombination process to innovate: A review of the empirical evidence and a research agenda. Int. J. Manag. Rev. 2017, 19, 54–75. [Google Scholar] [CrossRef]
- Muzzi, C.; Albertini, S. Communities and managerial competencies supporting SMEs innovation networking: a longitudinal case study. R&D Manag. 2015, 45, 196–211. [Google Scholar]
- Koo, B.-S.; Lee, C.-Y. The moderating role of competence specialization in the effect of external R&D on innovative performance. R&D Manag. 2018, 1–21. [Google Scholar]
- Porter, M.E.; Heppelmann, J.E. How smart, connected products are transforming competition. Harv. Bus. Rev. 2014, 92, 64–88. [Google Scholar]
- AENOR. UNE 0060. Industry 4.0. Management System for Digitization. Requirements; AENOR: Madrid, Spain, 2018. [Google Scholar]
- Hanus, D.; Revel, P.; Marulo, F.; Bauer, P. Aviation and the 4th industrial revolution: The prominent role of networks of excellence. Aerotec. Missili Spaz. 2018, 96, 86–89. [Google Scholar] [CrossRef]
- Schlechtendahl, J.; Keinert, M.; Kretschmer, F.; Lechler, A.; Verl, A. Making existing production systems Industry 4.0-ready: Holistic approach to the integration of existing production systems in Industry 4.0 environments. Prod. Eng. 2014, 9, 143–148. [Google Scholar] [CrossRef]
- Ganzarain, J.; Errasti, N. Three stage maturity model in SME’s towards industry 4.0. J. Ind. Eng. Manag. 2016, 9, 1119–1128. [Google Scholar] [CrossRef]
- Li, W.; Liu, K.; Belitski, M.; Ghobadian, A.; O’Regan, N. E-Leadership through strategic alignment: An empirical study of small- and medium-sized enterprises in the digital Age. J. Inf. Technol. 2016, 31, 185–206. [Google Scholar] [CrossRef]
- Spanish Ministry of Industry, Trade and Tourism. Estadísticas PYME. Evolución e Indicadores; Ministry of Industry, Trade and Tourism: Madrid, Spain, 2019.
- Spanish Ministry of Industry, Trade and Tourism. Cifras PyME. Marzo 2019; Spanish Ministry of Industry, Trade and Tourism: Madrid, Spain, 2019.
- German Federal Ministry of Economic Affairs and Energy. German Mittelstand: Motor der deutschen Wirtschaft; German Federal Ministry of Economic Affairs and Energy: Berlin, Germany, 2014.
- Kowalkowski, C.; Witell, L.; Gustafsson, A. Any way goes: Identifying value constellations for service infusion in SMEs. Ind. Mark. Manag. 2013, 42, 18–30. [Google Scholar] [CrossRef]
- He, W.; Xu, L. A state-of-the-art survey of cloud manufacturing. Int. J. Comput. Integr. Manuf. 2015, 28, 239–250. [Google Scholar] [CrossRef]
- Hirsch-Kreinsen, H. Digitization of industrial work: development paths and prospects. J. Labour Mark. Res. 2016, 49, 1–14. [Google Scholar] [CrossRef]
- Federmeccanica. Industria 4.0 in Italia: l’indagine di Federmeccanica; Federmeccanica: Rome, Italy, 2016. [Google Scholar]
- Schrauf, S.; Berttram, P. Industry 4.0: How Digitization Makes the Supply Chain More Efficient, Agile, and Customer-Focused; Strategy&: Düsseldorf, Germany, 2016. [Google Scholar]
- Williamson, E.A.; Harrison, D.K.; Jordan, M. Information systems development within supply chain management. Int. J. Inf. Manage. 2004, 24, 375–385. [Google Scholar] [CrossRef]
- Li, S.; Ragu-Nathan, B.; Ragu-Nathan, T.S.; Subba Rao, S. The impact of supply chain management practices on competitive advantage and organizational performance. Omega 2006, 34, 107–124. [Google Scholar] [CrossRef]
- Schuh, G.; Potente, T.; Wesch-Potente, C.; Weber, A.R.; Prote, J.P. Collaboration mechanisms to increase productivity in the context of industrie 4.0. Procedia CIRP 2014, 19, 51–56. [Google Scholar] [CrossRef]
- Garrido-Vega, P.; Sacristán-Díaz, M.; Magaña-Ramírez, L.M. Six Sigma in SMES with low production volumes. A successful experience in aeronautics. Universia Bus. Rev. 2016, 13, 52–71. [Google Scholar]
- Harun, K.; Cheng, K. An integrated modeling method for assessment of quality systems applied to aerospace manufacturing supply chains. J. Intell. Manuf. 2012, 23, 1365–1378. [Google Scholar] [CrossRef]
- Ruiz-Benitez, R.; López, C.; Real, J.C. Environmental benefits of lean, green and resilient supply chain management: The case of the aerospace sector. J. Clean. Prod. 2017, 167, 850–862. [Google Scholar] [CrossRef]
- Lele, A. Industry 4.0. In Disruptive Technologies for the Militaries and Security. Smart Innovation, Systems and Technologies; Springer: Singapore, 2019; pp. 205–215. ISBN 978-9811333835. [Google Scholar]
- Rocha, L.; Savio, E.; Marxer, M.; Ferreira, F. Education and training in coordinate metrology for industry towards digital manufacturing. J. Phys. Conf. Ser. 2018, 1044, 3–8. [Google Scholar] [CrossRef]
- Green, S.D.; Fernie, S.; Weller, S. Making sense of supply chain management: a comparative study of aerospace and construction. Constr. Manag. Econ. 2005, 23, 579–593. [Google Scholar] [CrossRef]
- Michaels, L.M.J. The making of a lean aerospace supply chain. Supply Chain Manag. An Int. J. 1999, 4, 135–145. [Google Scholar] [CrossRef]
- Bales, R.R.; Maull, R.S.; Radnor, Z. The development of supply chain management within the aerospace manufacturing sector. Supply Chain Manag. An Int. J. 2004, 9, 250–255. [Google Scholar] [CrossRef]
- Hader, M.; Wahler, J.; Schwandt, A. Key success factors in aerospace supply chain management. Supply Chain Manag. J. 2011, III, 13–17. [Google Scholar]
- Koblen, I.; Nižníková, L. Selected aspects of the supply chain management in the aerospace industry. INCAS Bull. 2013, 5, 135–149. [Google Scholar]
- Bharadwaj, A.; El Sawy, O.A.; Pavlou, P.A.; Venkatraman, N. Digital business strategy: Toward a next generation of insights. MIS Q. 2016, 37, 471–482. [Google Scholar] [CrossRef]
- Walters, D.; Rainbird, M. Strategic Operations Management: A Value Chain Approach; Macmillan Education: London, UK, 2006; ISBN 978-0230206779. [Google Scholar]
- Moeuf, A.; Pellerin, R.; Lamouri, S.; Tamayo-Giraldo, S.; Barbaray, R. The industrial management of SMEs in the era of Industry 4.0. Int. J. Prod. Res. 2018, 56, 1118–1136. [Google Scholar] [CrossRef]
- Segura Velandia, D.M.; Kaur, N.; Whittow, W.G.; Conway, P.P.; West, A.A. Towards industrial internet of things: Crankshaft monitoring, traceability and tracking using RFID. Robot. Comput. Integr. Manuf. 2016, 41, 66–77. [Google Scholar] [CrossRef]
- Siggelkow, N. Persuasion with case studies. Acad. Manag. J. 2007, 50, 20–24. [Google Scholar] [CrossRef]
- Eisenhardt, K.M. Building theories from case study research. Acad. Manag. Rev. 1989, 14, 532. [Google Scholar] [CrossRef]
- Yin, R.K. Case Study Research: Design and Methods, 3rd ed.; SAGE: Thousand Oaks, CA, USA, 2003; ISBN 0-7619-2552-X. [Google Scholar]
- Benbasat, I.; Goldstein, D.K.; Mead, M. The case research strategy in studies of information systems. MIS Quaterly 1987, 11, 369–386. [Google Scholar] [CrossRef]
- Vargas, J.G.; Arandia, O.E.; Cordova, A.C. A review of research methods in strategic management; what have been done, and what is still missing. J. Knowl. Manag. Econ. Inf. Technol. 2016, 6, 1–42. [Google Scholar]
- Eisenhardt, K.M.; Graebner, M.E. Theory building from cases: Opportunities and challenges. Acad. Manag. J. 2007, 50, 25–32. [Google Scholar] [CrossRef]
- Kotler, P.; Berger, R.; Bickhoff, N. The Quintessence of Strategic Management; Quintessence Series; Springer: Berlin/Heidelberg, Germany, 2016; ISBN 978-3-662-48489-0. [Google Scholar]
- Valentin, E.K. Swot Analysis from a Resource-Based View. J. Mark. Theory Pract. 2001, 9, 54–69. [Google Scholar] [CrossRef]
- Rizzo, A.S.; Kim, G.J. A SWOT Analysis of the Field of Virtual Reality Rehabilitation and Therapy. Presence Teleoperators Virtual Environ. 2005, 14, 119–146. [Google Scholar] [CrossRef]
- Helms, M.M.; Nixon, J. Exploring SWOT Analysis—Where are We Now?: A Review of Academic Research from the Last Decade. J. Strategy Manag. 2010, 3, 215–251. [Google Scholar] [CrossRef]
- Reißmann, D.; Thrän, D.; Bezama, A. Techno-economic and environmental suitability criteria of hydrothermal processes for treating biogenic residues: A SWOT analysis approach. J. Clean. Prod. 2018, 200, 293–304. [Google Scholar] [CrossRef]
- Spanish Ministry of Economy and Competitiveness Order ECC/1087/2015 to regulate the obtaining of the Innovative SMEs Seal and create and regulate its registration. Off. State Gaz. Gov. Spain 2015, 139, 49248–49255.
- Spanish Ministry of the Presidency Royal Decree 475/2014 on the bonuses in the Social Security contribution by research personnel assigned exclusively to R+D+i activities. Off. State Gaz. Gov. Spain 2014, 144, 45061–45067.
- Government of Spain Law 27/2014 on Corporate Income Tax. Off. State Gaz. Gov. Spain 2014, 288, 96939–97097.
- AENOR. EA 0047:2015 Specification. Requirements of an Innovative SME; AENOR: Madrid, Spain, 2015. [Google Scholar]
- Campo Martínez, L.M. El Proceso de Imaginación Estratégica en las Organizaciones: El caso de la PYME Innovadora. Ph.D. Thesis, Autonomous University of Madrid, Madrid, Spain, 2017. [Google Scholar]
- Spanish Ministry of the Presidency Royal Decree 1432/2003 on the fulfilment of scientific and technological requirements by reasoned reports for the application and interpretation of tax deductions for technological research and development and innovation activities. Off. State Gaz. Gov. Spain 2003, 286, 42617–42634.
- ENAC. CEA-ENAC-02. Specific Accreditation Criteria. Certification Entities for R+D+i Projects and R+D+i Activities of Research Staff; ENAC: Madrid, Spain, 2016. [Google Scholar]
- ENAC. RDE-01. Certification Entities for R+D+i Projects, R+D+i Activities of Research Staff and Innovative SMEs; ENAC: Madrid, Spain, 2018. [Google Scholar]
- Hollanders, H.; Es-Sadki, N.; Garcia Porras, B.; Nicklas, M.; Jerzyniak, T. Innovation Union Scoreboard 2014; European Commission: Brussels, Belgium, 2014. [Google Scholar]
- Saaty, T.L. Making and validating complex decisions with the AHP/ANP. J. Syst. Sci. Syst. Eng. 2005, 14, 1–36. [Google Scholar] [CrossRef]
- Saaty, T.L. Decision making with the analytic hierarchy process. Int. J. Serv. Sci. 2008, 1, 83. [Google Scholar] [CrossRef]
- Creative Decisions Foundation SuperDecisions CDF. Available online: https://www.superdecisions.com/ (accessed on 1 March 2019).
- Zott, C.; Amit, R.; Massa, L. The business model: Recent developments and future research. J. Manage. 2011, 37, 1019–1042. [Google Scholar]
- Taran, Y.; Boer, H.; Lindgren, P. A business model innovation typology. Decis. Sci. 2015, 46, 301–331. [Google Scholar] [CrossRef]
- George, G.; Bock, A.J. The Business Model in Practice and its Implications for Entrepreneurship Research. Entrep. Theory Pract. 2011, 35, 83–111. [Google Scholar] [CrossRef]
- DaSilva, C.M.; Trkman, P. Business Model: What It Is and What It Is Not. Long Range Plann. 2014, 47, 379–389. [Google Scholar] [CrossRef]
- Ng, I.C.L.; Ding, D.X.; Yip, N. Outcome-based contracts as new business model: The role of partnership and value-driven relational assets. Ind. Mark. Manag. 2013, 42, 730–743. [Google Scholar] [CrossRef]
- Bouncken, R.B.; Fredrich, V. Good fences make good neighbors? Directions and safeguards in alliances on business model innovation. J. Bus. Res. 2016, 69, 5196–5202. [Google Scholar] [CrossRef]
- Oesterreich, T.D.; Teuteberg, F. Understanding the implications of digitisation and automation in the context of Industry 4.0: A triangulation approach and elements of a research agenda for the construction industry. Comput. Ind. 2016, 83, 121–139. [Google Scholar] [CrossRef]
- Chesbrough, H. The role of the business model in capturing value from innovation: evidence from Xerox Corporation’s technology spin-off companies. Ind. Corp. Chang. 2002, 11, 529–555. [Google Scholar] [CrossRef]
- Massa, L.; Tucci, C.L.; Afuah, A. A critical assessment of business model research. Acad. Manag. Ann. 2017, 11, 73–104. [Google Scholar] [CrossRef]


© 2019 by the authors. Licensee MDPI, Basel, Switzerland. This article is an open access article distributed under the terms and conditions of the Creative Commons Attribution (CC BY) license (http://creativecommons.org/licenses/by/4.0/).