Abstract
The Microbiome Regression-based Kernel Association Test (MiRKAT) is widely used in testing for the association between microbiome compositions and an outcome of interest. The MiRKAT statistic is derived as a variance-component score test in a kernel machine regression-based generalized linear mixed model. In this brief report, we show that the MiRKAT statistic is proportional to the (coefficient of determination) statistic in a similarity matrix regression, which characterizes the fraction of variability in outcome similarity, explained by microbiome similarity (up to a constant).
1. Introduction
Recent research has highlighted the vital role of the human microbiome in many diseases and health conditions, including (but not limited to) obesity [1], diabetes [2], cancer [3], inflammatory disorders [4], and bacterial vaginosis [5]. Advances in next-generation sequencing technologies and high-throughput functional profiling technologies, including metagenomics, metatranscriptomics, metaproteomics, and metabolomics, have made them powerful tools for surveying in related research areas [6,7]. The field of microbiome studies, however, has not yet reached the maturity attained in other established molecular-epidemiological fields, such as cancer biomarker discovery and genome-wide association studies, to make the leap from “-omics” surveys to rational microbiome-based therapeutics. One of the primary limitations to leveraging this large body of big microbiome and metagenomics data is the computational and statistical challenges: high-dimensionality, count and compositional data structure, sparsity (zero-inflation), over-dispersion, phylogenetic relatedness, among others. To combat these challenges, specialized computational tools and quantitative approaches, to aid in understanding the role of the microbiota in maintaining homeostasis in their animal host, as well as in the initiation and propagation of disease, are desired.
A common mode of analysis in microbiome studies is diversity-based community-level analysis, wherein overall microbiome composition is studied in relation to outcomes of interest, such as host transcriptome [4], host genetics [8], and other clinical or environmental covariates [9]. Targeting overall microbiome community composition provides a holistic view towards facilitating identification of large-scale differences, accommodating correlation among taxa, and harnessing phylogenetic relationships. Besides being biologically meaningful, the community-level analysis is often statistically more powerful than individual taxon-level analysis, through reduced multiple testing burden and the ability to aggregate modest individual effects [10]. Motivated by these advantages, many novel statistical methods and computational tools have been proposed for efficiently testing for associations between outcomes and microbial community composition, using either alpha-diversity [11] or beta-diversity [10,12,13,14,15,16,17,18,19].
Among the existing quantitative analyses of association between microbial communities and their host, a powerful and popular method is the MiRKAT-type strategy, which regresses the outcome on microbiome compositions by way of the kernel machine regression framework [10,15,16]. A major advantage of MiRKAT over other microbiome community-level association analyses is that the kernel machine regression framework allows for flexible microbial effect (e.g., nonlinear effects and interactions) on the outcome. The performance of MiRKAT, as an overall association test, has been well studied in the literature. In this report, we study the interpretation of MiRKAT results by investigating the MiRKAT statistic and show that the MiRKAT statistic corresponds to the ratio of explained variation (by microbiome similarities) and total variation (in outcome similarities).
2. Materials and Methods
We first introduce some notation. Let the triplet be independent observations, where denotes the outcome of interest (e.g., body mass index), denotes the covariate vector including the intercept (e.g., age, gender, and antibiotic use), and is the composition vector of a microbiome community with p taxa. MiRKAT relates the outcome to microbiome features through the generalized partial linear model , where is the link function (e.g., identity function for a continuous outcome and logit function for a binary outcome) and is a centered smooth function in a reproducing kernel Hilbert space spanned by a kernel function . By using a nonparametric function , the model allows for flexible relationship (e.g., nonlinear effects and interactions) between the outcome and the microbiome compositions . The general function is specified by the kernel as for some coefficients [10]. In fact, for the purpose of testing , it is sufficient to specify the kernel matrix with , rather than explicitly defining the kernel function [10]. Within the context of microbiome studies, we typically define such a kernel matrix from a -diversity using , where is a matrix of pair-wise -diversities between individual microbial communities. For example, could be a matrix of Bray-Curtis dissimilarity [20] of the UniFrac-family distances [9].
The MiRKAT for hypothesis is derived from a variance component score test in a generalized linear mixed model (GLMM) and the specific MiRKAT statistic was proposed as [10]
where are the estimates of under the null GLMM of no microbiome effect on outcome, and with being a similarity metric measuring the similarity level between microbiome profiles and . Examples of such similarity/dissimilarity metrics include the UniFrac-family and the Bray-Curtis dissimilarity [10]. The original MiRKAT was proposed for either a continuous outcome or a binary outcome. Under a continuous outcome model, the dispersion parameter equals , the null estimates are of residual variance, and under a binary outcome model [10]. The testing strategy of MiRKAT has further been extended to accommodate more complicated outcome types (e.g., survival times and multiple correlated outcomes) [15,16,19] and complex study designs (e.g., longitudinal microbiome studies) [21,22], which all share the same spirit by deriving the test statistic as a variance component score test in a certain mixed effect model [10,15,16,22]. As a result, all of these aforementioned MiRKAT-type test statistics have a comparable form to Q in Equation (1). For ease of presentation, we will illustrate the connection between a MiRKAT statistic and an (coefficient of determination) statistic, using a continuous outcome as an example.
To build the connection between the MiRKAT statistic (1) and statistic, we rearrange the non-kernel part and kernel part in the numerator of Q. Let be the cross product of the residuals, where , to describe the covariates -adjusted outcome similarity between and . An alternative way to study the association between outcome and microbiome is by the similarity matrix regression [23]
where are some mean-zero normal-distribution error terms. Since the outcome similarity is calculated from the null model residuals, which have been -adjusted (note that the intercept term is included in ), and (thus ) is assumed to be a centered smooth function, both and are centered and, thus, we do not include an intercept term in the similarity matrix regression model (2). It has been pointed out that is equivalent to testing a corresponding variance component being zero in a random effect model [23], which is the null hypothesis in MiRKAT. Besides the correspondence between the null hypothesis of MiRKAT and similarity matrix regression, in this short report, we will further demonstrate the correspondence between the MiRKAT statistic and the statistic (coefficient of determination) of similarity matrix regression.
Define the concatenation of matrix as , where stands for vectorization. The same notation applies to the microbiome similarities and error terms . Then, the matrix regression (2) can be reformulated in a vector format
Under a simple linear regression model (3), it is easy to verify that
The correlation on the right hand side of Equation (4) can be estimated as its empirical sample correlation, , further calculated as
where q is the dimension of and the second equality holds because .
On the other hand, according to the law of total variance, , where and represent the explained and unexplained fraction of variance in the outcome similarities by microbiome similarites, respectively. In other words, the first term in Equation (4) is the fraction of explained variation of outcome similarity by microbiome similarity or, equivalently, the statistic (coefficient of determination) of similarity matrix regression (3). Putting all of this together, we have
That is, given the microbiome similarity (such that is a constant), the coefficient of determination statistics is proportional to the squared MiRKAT statistic .
3. Results
We conducted a numerical study to verify the analytical result in Equation (6). We simulated the microbiome data (of taxa) from an estimated Dirichlet-multinomial distribution, following the same strategy used in MiRKAT [10], and considered a sample size of in this simulation. After the microbiome data was generated, we simulated two covariates, and , where was a Bernoulli variable with success probability 0.5, and was simulated from the normal distribution whose mean depended on the microbiome composition. Then, the outcome was simulated according to the following model
where , and we randomly selected 50 of the to be nonzero, generated from the uniform distribution between and 1. After the were generated, we next calculated both the outcome similarity and microbiome similarity . For the outcome similarity, the linear cross product of residuals (as described previously in this report) was used throughout the simulations. Four different microbiome similarity metrics were considered in this simulation, including weighted UniFrac, unweighted UniFrac, generalized UniFrac (parameter set to 0.5, as used in MiRKAT), and the Bray-Curtis. Each microbiome similarity metric was constructed, based on the corresponding -diversity (as described in Zhao et al. [10]). We calculated both the MiRKAT statistic Q and the statistic of the similarity matrix regression (3) using 1000 replicates. Finally, was compared to , according to Equation (6). The result is reported in Figure 1, and it was confirmed that .
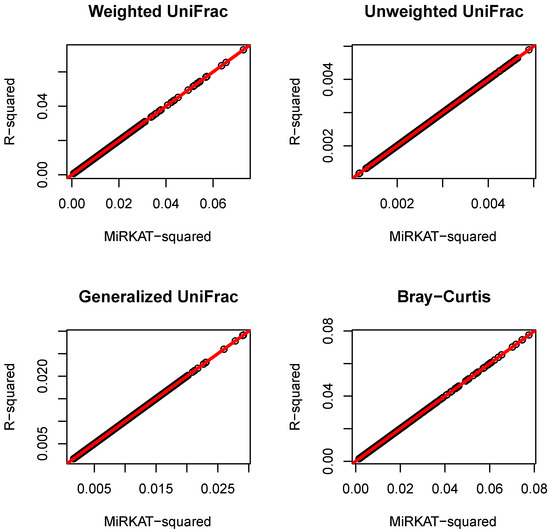
Figure 1.
Comparison of MiRKAT statistic and statistic of similarity matrix regression. The red line represents the regression line, which is identical to the 45-degree line .
4. Discussion and Conclusions
In summary, we found a connection between two statistics which seem to be quite different. One is the MiRKAT-type statistic, which is usually derived as a score test statistic for a variance component in a GLMM. The other is an -type statistic, the proportion of explained variation in similarity matrix regression. Despite the popularity of the MiRKAT test itself, it is striking to detect the correspondence between the MiRKAT statistic and the proportion of variance in outcome that was explained by microbiome (in the similarity level). A high of a certain microbiome similarity may imply an underlying microbiome-trait association pattern (e.g., a high unweighted UniFrac may imply that the trait is more influenced by the presence/absense of OTUs rather than their abundances). As a result, the correspondence between MiRKAT and can enhance the interpretability of the MiRKAT test, in the sense that a quantitative value is, in general, more straightforward and informative than the more qualitative MiRKAT p-value (significant or not). Moreover, this correspondence may also suggest the potential for development of a powerful similarity-learning procedure, by maximizing the proportion of explained variance (or, equivalently, minimizing the proportion of unexplained variance).
Funding
This research received no external funding.
Acknowledgments
The author would like to thank Michael C. Wu for discussion that brought the topic to my attention and the Editor and two reviewers for their helpful comments to improve this paper.
Conflicts of Interest
The author declares no conflict of interest.
Abbreviations
The following abbreviations are used in this manuscript:
| MiRKAT | Microbiome Regression-based Kernel Association Test |
| GLMM | Generalized Linear Mixed Model |
References
- Turnbaugh, P.J.; Hamady, M.; Yatsunenko, T.; Cantarel, B.L.; Duncan, A.; Ley, R.E.; Sogin, M.L.; Jones, W.J.; Roe, B.A.; Affourtit, J.P.; et al. A core gut microbiome in obese and lean twins. Nature 2009, 457, 480–484. [Google Scholar] [CrossRef]
- Qin, J.; Li, Y.; Cai, Z.; Li, S.; Zhu, J.; Zhang, F.; Liang, S.; Zhang, W.; Guan, Y.; Shen, D.; et al. A metagenome-wide association study of gut microbiota in type 2 diabetes. Nature 2012, 490, 55–60. [Google Scholar] [CrossRef]
- Louis, P.; Hold, G.L.; Flint, H.J. The gut microbiota, bacterial metabolites and colorectal cancer. Nat. Rev. Microbiol. 2014, 12, 661–672. [Google Scholar] [CrossRef]
- Morgan, X.C.; Kabakchiev, B.; Waldron, L.; Tyler, A.D.; Tickle, T.L.; Milgrom, R.; Stempak, J.M.; Gevers, D.; Xavier, R.J.; Silverberg, M.S.; et al. Associations between host gene expression, the mucosal microbiome, and clinical outcome in the pelvic pouch of patients with inflammatory bowel disease. Genome Biol. 2015, 16, 67. [Google Scholar] [CrossRef] [PubMed]
- Mitchell, C.M.; Srinivasan, S.; Zhan, X.; Wu, M.C.; Reed, S.D.; Guthrie, K.A.; LaCroix, A.Z.; Fiedler, T.; Munch, M.; Liu, C.; et al. Vaginal microbiota and genitourinary menopausal symptoms: A cross-sectional analysis. Menopause 2017, 24, 1160–1166. [Google Scholar] [CrossRef] [PubMed]
- Turnbaugh, P.J.; Ley, R.E.; Hamady, M.; Fraser-Liggett, C.M.; Knight, R.; Gordon, J.I. The human microbiome project. Nature 2007, 449, 804. [Google Scholar] [CrossRef] [PubMed]
- Cho, I.; Blaser, M.J. The human microbiome: at the interface of health and disease. Nat. Rev. Genet. 2012, 13, 260–270. [Google Scholar] [CrossRef] [PubMed]
- Blekhman, R.; Goodrich, J.K.; Huang, K.; Sun, Q.; Bukowski, R.; Bell, J.T.; Spector, T.D.; Keinan, A.; Ley, R.E.; Gevers, D.; et al. Host genetic variation impacts microbiome composition across human body sites. Genome Biol. 2015, 16, 191. [Google Scholar] [CrossRef]
- Chen, J.; Bittinger, K.; Charlson, E.S.; Hoffmann, C.; Lewis, J.; Wu, G.D.; Collman, R.G.; Bushman, F.D.; Li, H. Associating microbiome composition with environmental covariates using generalized UniFrac distances. Bioinformatics 2012, 28, 2106–2113. [Google Scholar] [CrossRef]
- Zhao, N.; Chen, J.; Carroll, I.M.; Ringel-Kulka, T.; Epstein, M.P.; Zhou, H.; Zhou, J.J.; Ringel, Y.; Li, H.; Wu, M.C. Testing in microbiome-profiling studies with MiRKAT, the microbiome regression-based kernel association test. Am. J. Hum. Genet. 2015, 96, 797–807. [Google Scholar] [CrossRef]
- Koh, H. An adaptive microbiome α-diversity-based association analysis method. Sci. Rep. 2018, 8, 1–12. [Google Scholar] [CrossRef] [PubMed]
- Wu, C.; Chen, J.; Kim, J.; Pan, W. An adaptive association test for microbiome data. Genome Med. 2016, 8, 56. [Google Scholar] [CrossRef] [PubMed]
- Tang, Z.Z.; Chen, G.; Alekseyenko, A.V. PERMANOVA-S: Association test for microbial community composition that accommodates confounders and multiple distances. Bioinformatics 2016, 32, 2618–2625. [Google Scholar] [CrossRef]
- Tang, Z.Z.; Chen, G.; Alekseyenko, A.V.; Li, H. A general framework for association analysis of microbial communities on a taxonomic tree. Bioinformatics 2017, 33, 1278–1285. [Google Scholar] [CrossRef] [PubMed]
- Plantinga, A.; Zhan, X.; Zhao, N.; Chen, J.; Jenq, R.R.; Wu, M.C. MiRKAT-S: A community-level test of association between the microbiota and survival times. Microbiome 2017, 5, 17. [Google Scholar] [CrossRef] [PubMed]
- Zhan, X.; Tong, X.; Zhao, N.; Maity, A.; Wu, M.C.; Chen, J. A small-sample multivariate kernel machine test for microbiome association studies. Genet. Epidemiol. 2017, 41, 210–220. [Google Scholar] [CrossRef] [PubMed]
- Zhan, X.; Plantinga, A.; Zhao, N.; Wu, M.C. A fast small-sample kernel independence test for microbiome community-level association analysis. Biometrics 2017, 73, 1453–1463. [Google Scholar] [CrossRef] [PubMed]
- Koh, H.; Blaser, M.J.; Li, H. A powerful microbiome-based association test and a microbial taxa discovery framework for comprehensive association mapping. Microbiome 2017, 5, 45. [Google Scholar] [CrossRef]
- Koh, H.; Livanos, A.E.; Blaser, M.J.; Li, H. A highly adaptive microbiome-based association test for survival traits. BMC Genom. 2018, 19, 210. [Google Scholar] [CrossRef]
- Bray, J.R.; Curtis, J.T. An ordination of the upland forest communities of southern Wisconsin. Ecol. Monogr. 1957, 27, 325–349. [Google Scholar] [CrossRef]
- Zhang, Y.; Han, S.W.; Cox, L.M.; Li, H. A multivariate distance-based analytic framework for microbial interdependence association test in longitudinal study. Genet. Epidemiol. 2017, 41, 769–778. [Google Scholar] [CrossRef] [PubMed]
- Zhan, X.; Xue, L.; Zheng, H.; Plantinga, A.; Wu, M.C.; Schaid, D.J.; Zhao, N.; Chen, J. A small-sample kernel association test for correlated data with application to microbiome association studies. Genet. Epidemiol. 2018, 42, 772–782. [Google Scholar] [CrossRef] [PubMed]
- Tzeng, J.Y.; Zhang, D.; Chang, S.M.; Thomas, D.C.; Davidian, M. Gene-Trait Similarity Regression for Multimarker-Based Association Analysis. Biometrics 2009, 65, 822–832. [Google Scholar] [CrossRef] [PubMed]
© 2019 by the author. Licensee MDPI, Basel, Switzerland. This article is an open access article distributed under the terms and conditions of the Creative Commons Attribution (CC BY) license (http://creativecommons.org/licenses/by/4.0/).