Article

Thermal Analysis of Vacuum Resistance Furnace

1
Department of Mechanical Engineering, International Islamic University, Islamabad 44000, Pakistan
2
School of Aeronautics, Northwestern Polytechnical University, Xi’an 710072, China
3
Department of Electrical Engineering, International Islamic University, Islamabad 44000, Pakistan
*
Author to whom correspondence should be addressed.
Processes 2019, 7(12), 907; https://doi.org/10.3390/pr7120907
Submission received: 27 September 2019 / Revised: 22 November 2019 / Accepted: 23 November 2019 / Published: 3 December 2019
(This article belongs to the Special Issue Thermal Safety of Chemical Processes)

Abstract

:
The current paper describes the effect of insulation thickness in a vacuum resistance furnace. An existing furnace was optimized for insulation thickness using analytical and numerical studies. Furnace heating efficiency was improved up to 64% by controlling the heat flow at the insulation face. The numerical results were validated experimentally and vice versa. The numerical results predicted a decrease in heat flow of 70%, while the experimentally achieved value was 64%. The percentage difference in numerical and experimental results was calculated to be 1.5–5% maximum in temperature value. The effect of mesh finesse was evaluated for thermal analysis and it was concluded that a very little difference of 5 °C occurs when element size is reduced 5 times. The study using numerical methods will help in designing better and upgraded furnaces with greater energy savings. Also, the application of numerical methods is proposed as an effective design and performance prediction tool during manufacturing and operational activities of vacuum furnaces, respectively.

1. Introduction

Investigation of thermal insulation behavior is a vital area of research in vacuum furnaces. Experimentation studies can be performed for the understanding of this analysis; however, the capital cost, use of precise instrumentation, and time consumed during such experimental work are high. On the other hand, numerical methods can be used to competent extent for evaluation and better understanding of thermal analysis in vacuum furnaces. Computational techniques have very limitedly been used for vacuum furnaces. Steady state and transient thermal analysis are two effective numerical techniques which have been used by numerous scholars to investigate and enhance the performance of furnaces which work in open atmosphere.
Electrically powered vacuum furnaces are commonly employed in various divisions of science and industry [1] for heat treatment [2], including automotive, structural, and aerospace. These furnaces have varying sizes and capacities and operate for extended periods of time, depending on the process requirement. When such a furnace is held at some specific temperature, it is always desired that minimum heat escapes the working chamber, otherwise fuel consumption will increase to compensate for the heat loss. Hence, it is an area of interest to all engineers to find methods that can reduce the energy usage, or alternatively optimize the furnace for efficient usage of energy [3].
Optimum consumption of energy resources and enhancing energy efficiency in industrial setup would lessen the energy fears in the world [4]. Three components are of primary nature in furnaces, including a heating element, a mechanism like thermal shielding to prevent heat losses, and an interface for sample mounting [5].
Haohua et al. [2] studied that a perfect design with optimal performance of heat treatment furnace requires a small range temperature difference in all points within the work zone. Hence, to increase the overall production efficiency and capacity of a vacuum furnace, the working zone must be optimized with respect to temperature uniformity. They performed optimization of the working zone of a vacuum furnace using ANSYS. Radiation modeling was used, and the furnace chamber size was optimized, along with temperature distribution. The efficiency was improved on the basis of chamber size modification and not the insulation material.
Rezazadeh et al. [6] used a hybrid insulation system in a vacuum furnace, consisting of a refractory material and a metallic shield at the outer part. The authors proposed a study for optimization in high vacuum furnaces by changing dimensional configuration of refractory lining. The same radiation and conductance model has been used for numerical analysis. The authors predicted that 25% reduction in heat transfer can be achieved using the novel insulation system. The authors controlled the heat loss with a choice of material and not configuration, but proposed the same for future study in a high temperature furnace, like the one being used in current study. Heat transfer in heat treatment furnaces was analyzed numerically and experimentally. Mohite et al. [7] studied that the type of refractory and its geometric configuration in furnaces must be optimized to increase effectiveness due to reduced heat loss. The authors performed numerical analysis to show that proper selection of refractory material and its thickness can reduce the heat loss by up to 64%. The results of the authors for open furnaces, like induction and vacuum, is missing in the numerical study. Hadała et al. [8] performed experiments and theoretical calculations to evaluate boundary conditions at the furnace wall and heat loss from furnace insulation. The results showed that heat loss is a function of furnace insulation. An insulation, consisting of two mineral fiber slabs, gave the best results. To model boundary conditions, convection and radiation modes of heat transfer were employed at the outer and inner furnace wall. The furnace used for experimentation was an annealing furnace for forging industry. Kantor [9] studied the heat transfer in vacuum through a heat shield by the coupled conduction–radiation method. Radiation heat transfer was modeled using the surface-to-surface model. The use of multilayer insulation systems was also studied to enhance efficiency of a cooling water jacket of a vacuum vessel of reactor. Paramonov [10] carried out a technical and economic optimization study for the multilayer furnace lining. The lining layers consisted of different materials with varying thicknesses. Various multilayer combinations of lining were investigated and optimized for given applications. The study was performed on a simple heating furnace. Khodabandeh et al. [11] performed an investigation of an electric arc furnace numerically, and on the basis of radiative heat transfer, an estimation was made about temperature distribution. The numerical results were found to be in good correlation with the experiment. The Ansys Fluent software is a helpful tool for computing heat flows in systems containing graphite thermal insulation. The authors observed that the use of a composite thermal insulation (graphite pate + graphite felt) reduces the heating time by 5–8% and saves about 15% electric power. The furnace used in their work was a chamber furnace, and a combination of insulating material was used to enhance the efficiency of the furnace. Hooks et al. [12] studied that in vacuum, insulation in the form of multilayers is a very promising choice. The heat transfer modes are conduction, convection, and radiation, and in the presence of vacuum, radiative heat transfer dominates the other two mechanisms of heat transfer. Li et al. [13] studied and concluded that insulator and heater are among the most vital components of a vacuum furnace, and operating and manufacturing costs, along with energy efficiency, are directly affected by their selection. Scharler and Obernberger [14] proposed that for optimization and design of biomass-based furnaces, simulations can be employed as an effective tool. This numerical tool can be used as a counterpart, or even a replacement, tool to experimental investigations. The best method to minimize heat loss of a thermal system is the use of proper thermal insulation, and therefore, a number of scholars have interestingly studied the problems involving thermal insulations, including building enclosure structures [15,16] and pipeline systems [17]. Several companies have manufactured different graphite insulation configurations that help to save electricity and assure uniform temperature distribution in the heating chamber. A novel system of insulation can be developed using different combinations of materials, which results in a more beneficial system as compared to traditional ones. If the heat loss from a hot chamber of an equipment is at low level during operational activities, its graphite insulation system is regarded as well-designed [18]. Although the cost of designing is only 5% of the total furnace cost, 90% of the service life is dependent on the designing stage. Thus, to improve the designing of vacuum furnaces, importance must be attributed to support analysis techniques by the manufacturers at the design stage regarding heat transfer methods in furnaces [19].
The above-mentioned research shows that many valuable contributions have been made in the studies of efficiency improvement of furnaces, the thermal behavior of refractory materials, and the phenomenon of heat transfer. In most of the cases, furnaces working in open atmosphere with conduction and convective heat modes have been studied. The current paper is an attempt to extend the thermal analysis for the study of vacuum furnaces operating at high temperatures, and also involving radiative heat mode. These furnaces have complex heat transfer phenomena. The validation of numerical tools using experimentation was also performed. The results obtained propose an enhanced use of numerical methods at the design and manufacturing stage and during process life. It will consequently replace the hit and trial analytical design methods and enhance process safety, respectively. The newly adopted numerical methods will also save plenty of capital cost in future furnaces. In the current study, the furnace heat loss was reduced by increasing the insulation thickness. The paper experimentally validates the numerical study, hence predicting future use of numerical tools for process study in a very short span of time. Heat loss through insulation was also reduced from 21 to 7 kW by increasing the thickness of insulation to an optimal value. Consequently, reduction in energy consumption with increased efficiency was achieved.

2. Existing Furnace Description

2.1. Geometry and Experimental Setup

Experimentation for evaluation of temperature distribution was performed on a vacuum resistance furnace capable of reaching a temperature of 1500 °C and a vacuum of 10−4 Pa. The hot zone of the furnace was made of Molybdenum and the insulation system was made of graphite blanket. The support structure of the furnace was made of stainless steel with the outer vessel also made of stainless steel. The capacity of hot zone of furnace was 0.3867 m3 (the dimensions of the existing furnace are reported in Table 1). The furnace underwent about 5000 operational hours of a heating and cooling cycle. Figure 1 is a three-dimensional view of the geometric configuration of the furnace.
The temperature sensors were Type B Pt-30% Re with a measurement range of 0–1700 °C. This type of thermocouple is recommended for use in the vacuum environment and where the environment is not oxidizing. The sensors were installed at three different locations of the hot zone. These measured the temperature inside the hot zone (middle) and outside the insulation package at two points throughout the depth of the chamber. The experimental tests were performed by heating the furnace up to 1000 °C and holding for 3 h at the same temperature to attain the steady state temperature.

2.1.1. Analytical Analysis

To perform analytical study and heat transfer calculations for the existing furnace, temperature distribution was required to be evaluated at the inner and outer sides of the cylindrical composite wall system. The temperature distribution was measured with the help of temperature sensors and geometrical details were used as available in design drawings of the furnace. Material properties were also chosen from the available literature. The temperatures measured by experimentation are given below as:
  • Inside working zone: 1000 °C (T1)
  • Outside insulation package: 718 °C (T2)

2.1.2. Heat Loss Calculations

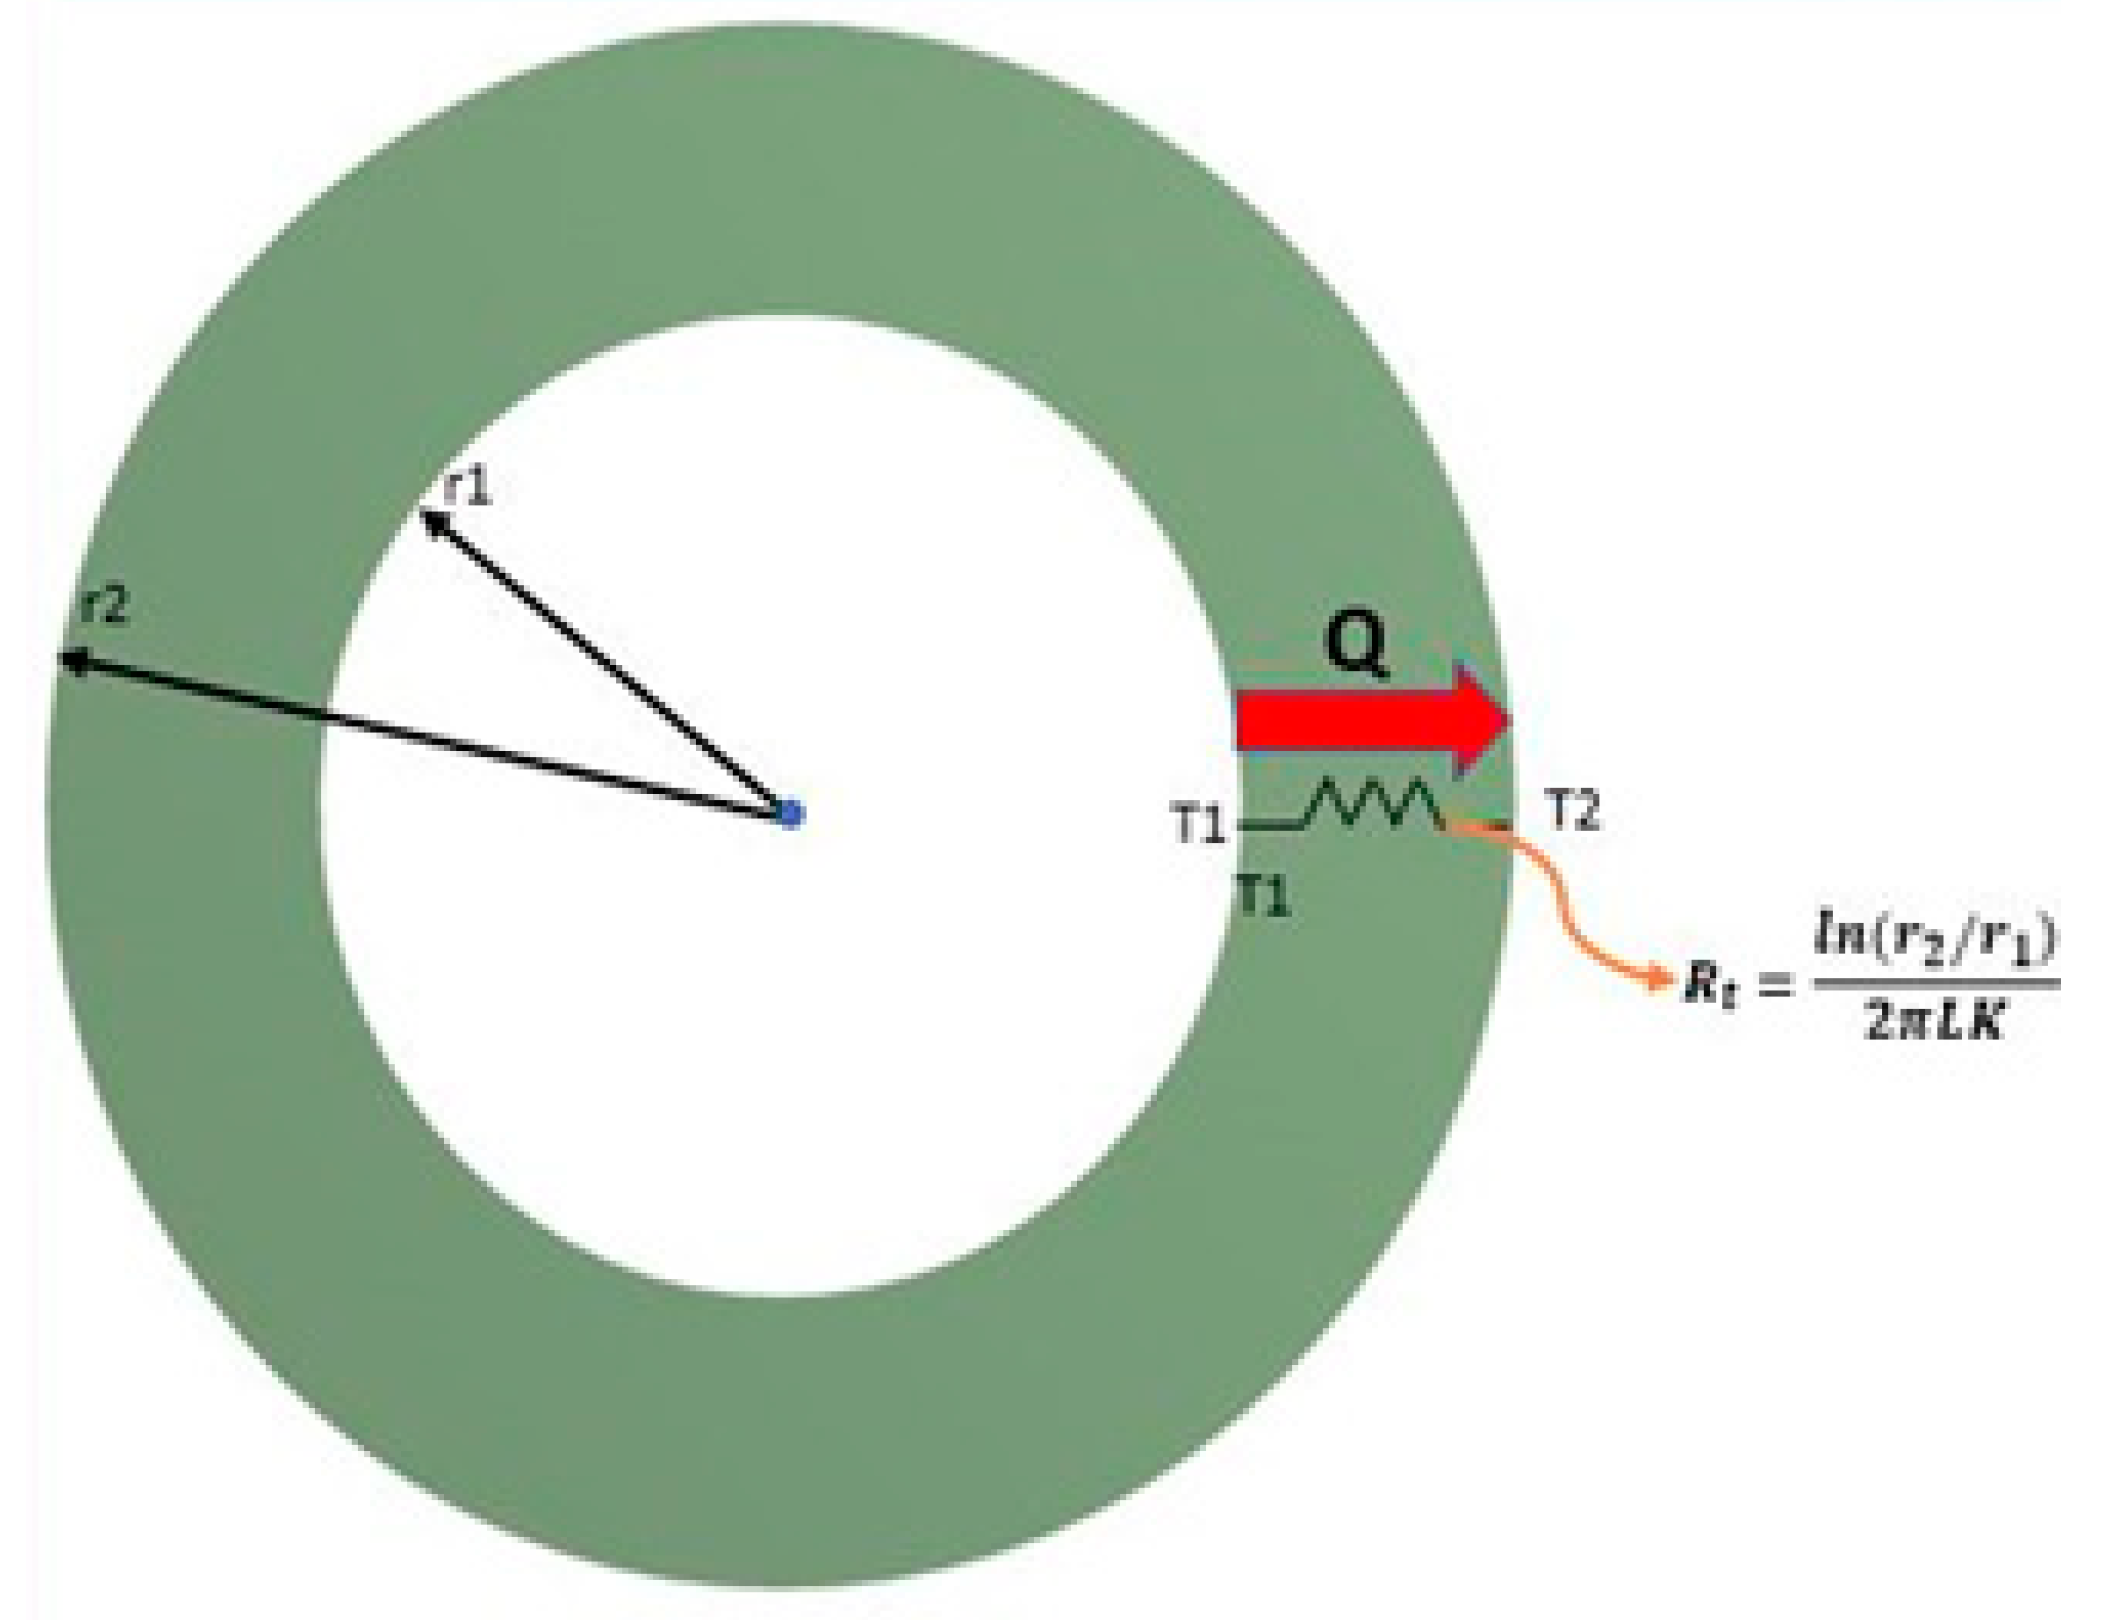
All of the multiple-walled systems operate on the phenomenon of thermal contact resistance. When two different conducting surfaces are placed in contact, a thermal contact resistance to flow of heat is always present at the interface. Because of this resistance, a sharp decrease in temperature is always observed at the interface in the direction of heat flows. Figure 2 shows the multiwalled cylindrical configuration. Such systems resemble furnace configurations where the furnace hot zone is made up of multiple layers of heat shields and insulations. Figure 3 shows the heat flow pattern through a cylinder with analogous thermal resistance. This thermal resistance adds up to give cumulative resistance for systems as shown in Figure 3.
It is assumed that the contact at the interface is perfect, owing to the smoothness of the surfaces. Also, since the Kapitza resistance depends on the interface temperature difference, which is minimal in the evaluated case. Therefore, this temperature difference would not contribute towards the Kapitza resistance. At steady state, the heat flow Q at any radial location r will be the same. The governing heat flow equation is:
Q = 2 π L K   T 1 T 2 ln ( r 2 / r 1 )
This equation can be rearranged as:
Q =   T 1 T 2 ln ( r 2 / r 1 ) 2 π L K
R t = ln ( r 2 / r 1 ) 2 π L K
Q =   T 1 T 2 R t
where:
  • K is thermal conductivity, W/(m. K)
  • Q is heat flow (in the present study, it is the heat flow from inside the working zone towards the outer shell), Watts
  • T1 is temperature at r1
  • T2 is temperature at r2
  • L is the length of the cylinder
  • Rt is the total thermal contact resistance of the insulation system
In the real furnace design, the front and back door are protected by metallic heat shields and thicker insulation, causing minimal heat loss. The evaluated furnace has three metallic heat shields with vacuum/gap between them. Therefore, it is assumed that the heat loss through the base and door of the furnace will be minimal. In the modeling, radiation boundary conditions on the furnace base and door will best suit this configuration. Also, in case of steady state heat transfer through cylindrical objects like a furnace shell/pipe, heat transfer is in the normal direction to the wall surface and no significant heat transfer occurs in other directions. Table 1 presents the details of thermal resistance calculations for the existing furnace containing 15 mm insulation package.
From the table above, the total resistance of all constructional systems is calculated by adding the individual resistance, and it is found that Rtotal,15mm = 1.33 × 10⁻². From the table it can be seen that the value of resistance for insulation alone is 1.32 × 10⁻², which is 99% of the total resistance value. Hence the major factor controlling the heat flow is the insulation material. The values of the measured temperature T1 = 1000 °C and T2 = 718 °C, together with R_total, are inserted into Equation (4) to estimate the heat flow and the experimental heat flux. The latter is estimated by dividing the total heat flow Q by the internal surface area of the furnace (whose radius is 315 mm).
Q (W) = 21,193
Q″(W/m2) = 8650

2.1.3. Modeling Analysis

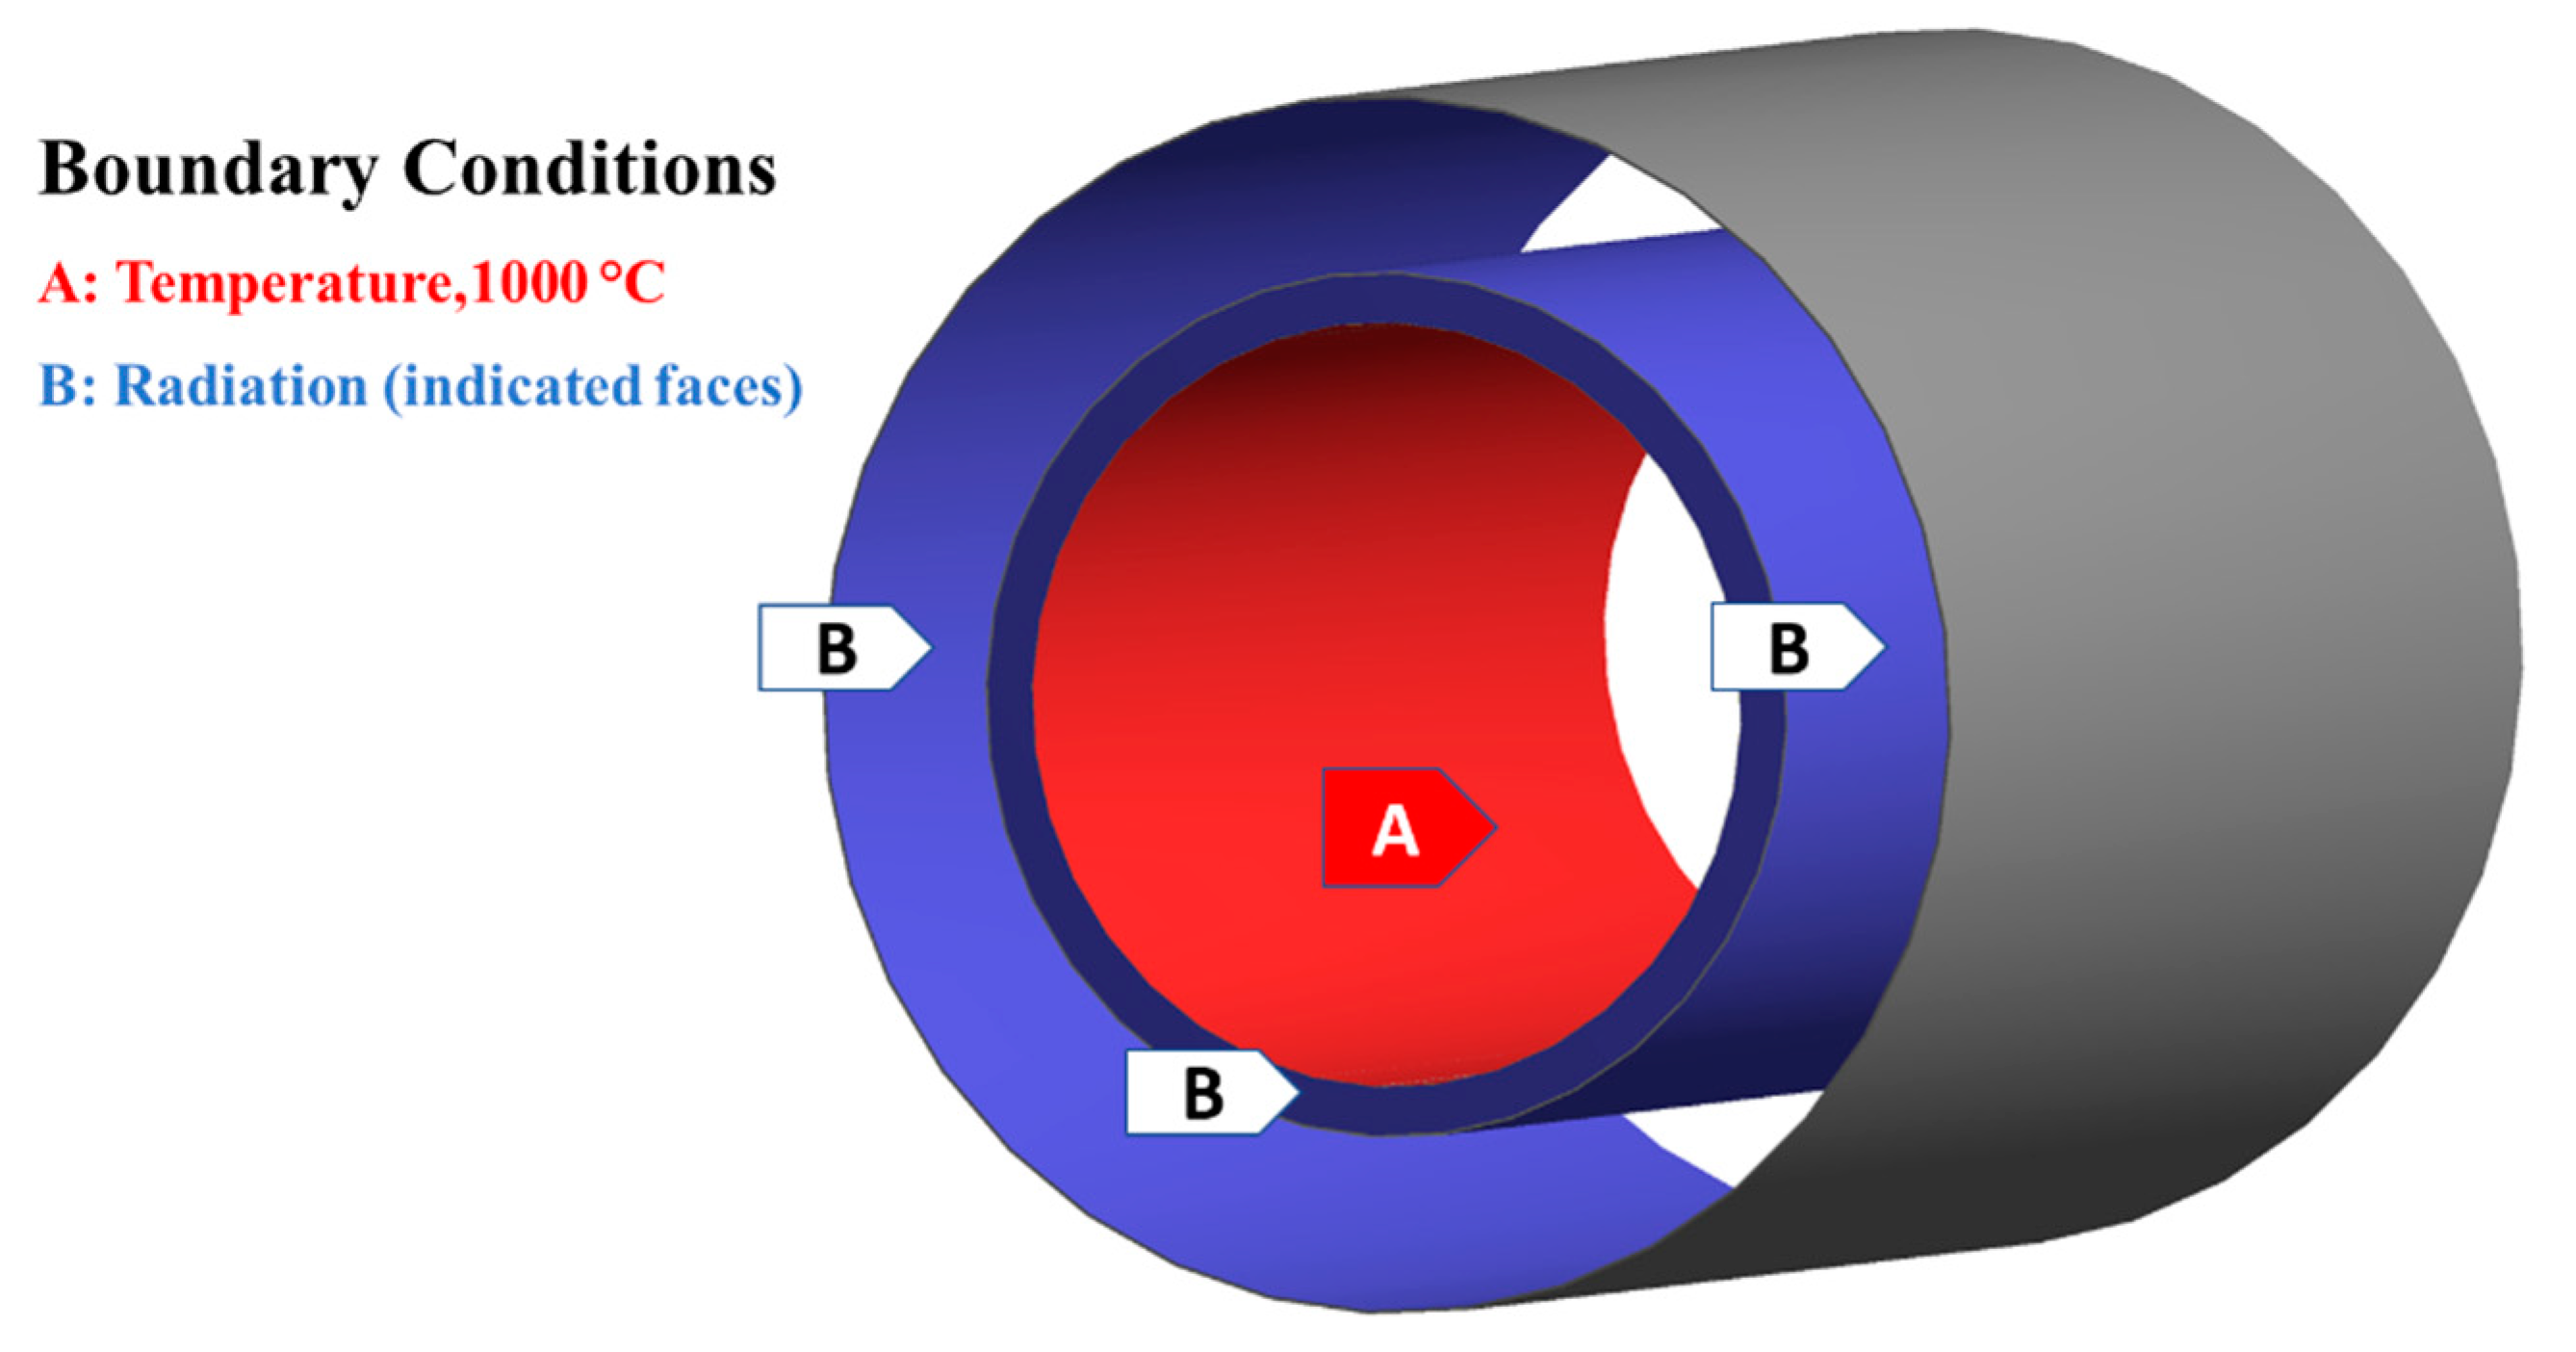
Modeling of the heat transfer problem for the existing furnace geometry was performed in ANSYS 15.0, which can be used as a powerful tool to simulate the heat transfer problems. Specific boundary conditions were as shown in Figure 4, and material properties were applied to the structural components of the furnace. Some assumptions were applied to simplify the computational study, e.g., the heat flow at the base and door, which is the z-axis, were neglected since the insulation and heat shields were much thicker in this region, and hence, the heat loss was minimal. The modeling of heat transfer was performed for steady state heat flow only. The transient heat flow analysis was not performed, since such analysis is important when there are wide changes in temperature over a very small period of time. In the current study, the furnace temperature did not change over a long period of time, hence steady state heat analysis was performed. The material data were added to ANSYS and then linked to the model. We performed meshing using coarse, medium, and fine configuration of element size, and it was found that medium and fine meshing gives approximately accurate results. Hence, we chose the medium mesh density of 0.1 m to reduce the computational time and cost. The ambient temperature was chosen as 22 °C in the initial analysis setting, and other boundary conditions used are shown in Figure 4. The internal temperature of the furnace was selected as per actual process temperature, i.e., 1000 °C. The convection factor was assumed to be minimal inside the furnace due to the vacuum present, and radiation was modeled using the surface-to-surface method. This method is specifically used when there is no participating medium present in a thermal system. The emissivity values used are tabulated in Table 2. The outer steel shell was kept at 22 °C and radiation boundary condition was applied at its internal surface.
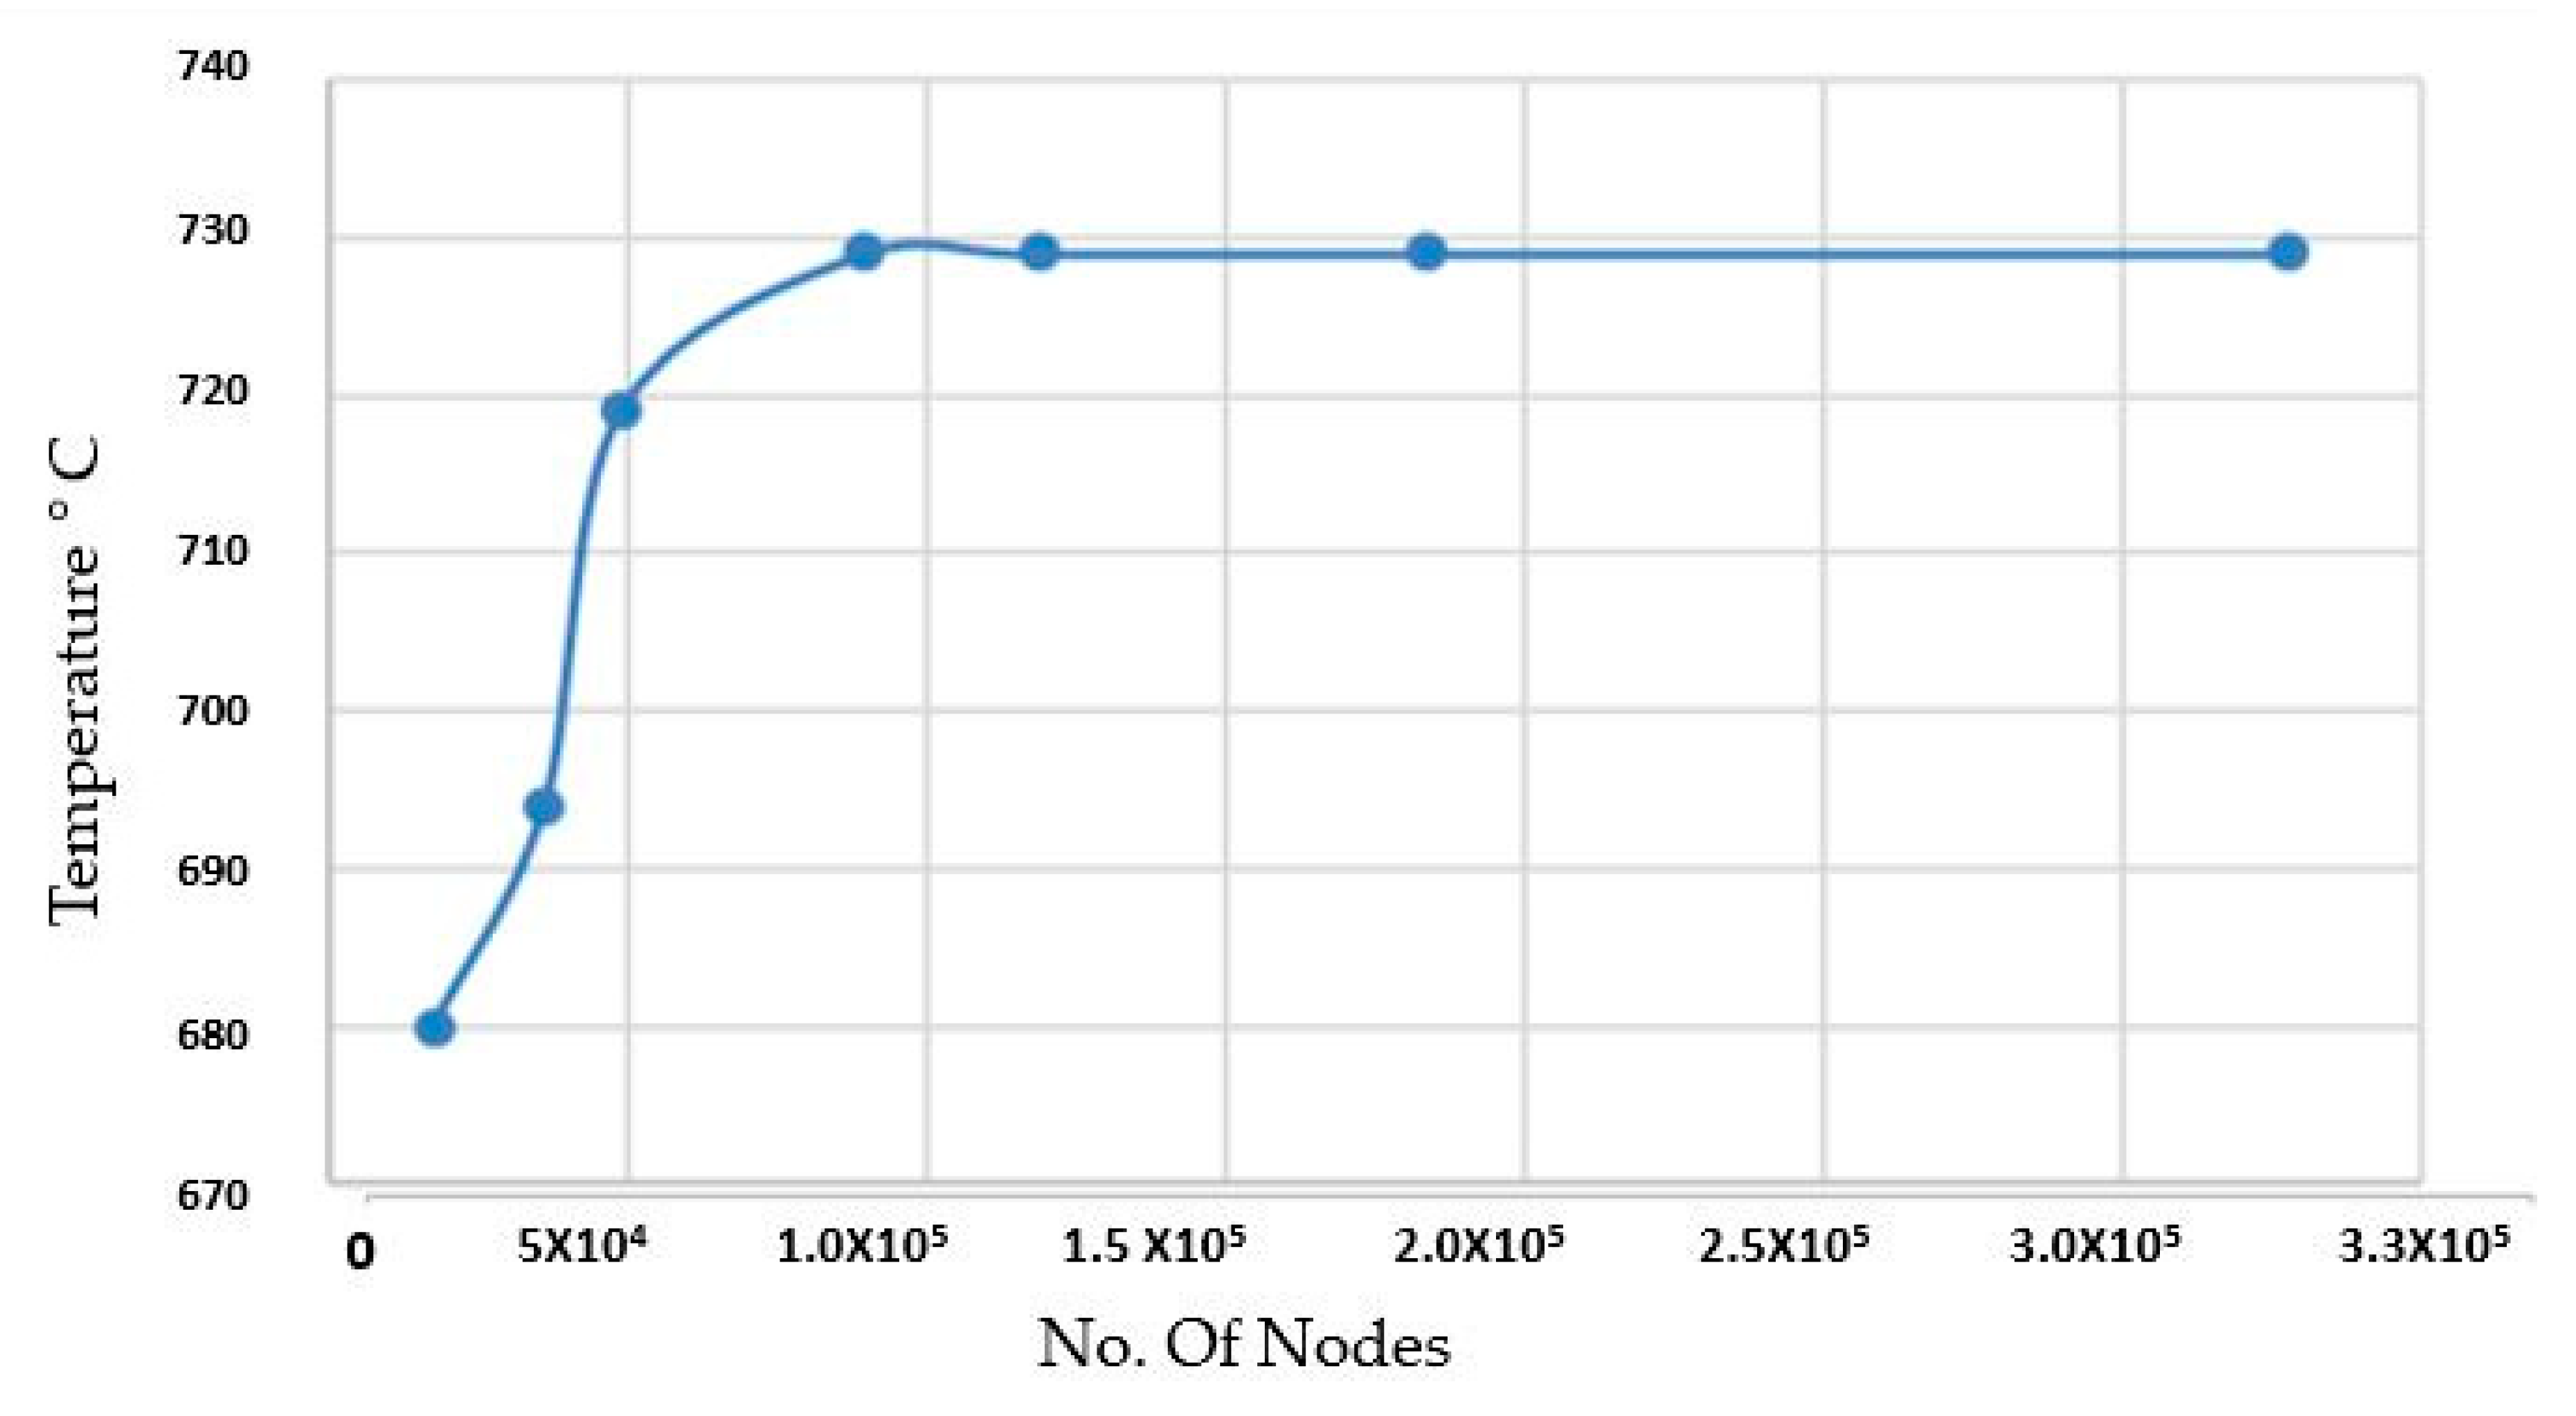
Regarding the mesh sensitivity study, the ANSYS steady state thermal solver describes that, unless we want to couple the heat transfer with structural analysis, no consideration for mesh size exists for steady state heat transfer. The mesh sensitivity was performed, and results have been incorporated in Appendix A (Supplementary Materials).
Material data were used from the literature and built in the data bank of ANSYS. The major properties of interest for thermal heat transfer are density, thermal conductivity, and emissivity values. These properties are listed in Table 2. The table includes details of the materials that were used in the construction of the furnace.
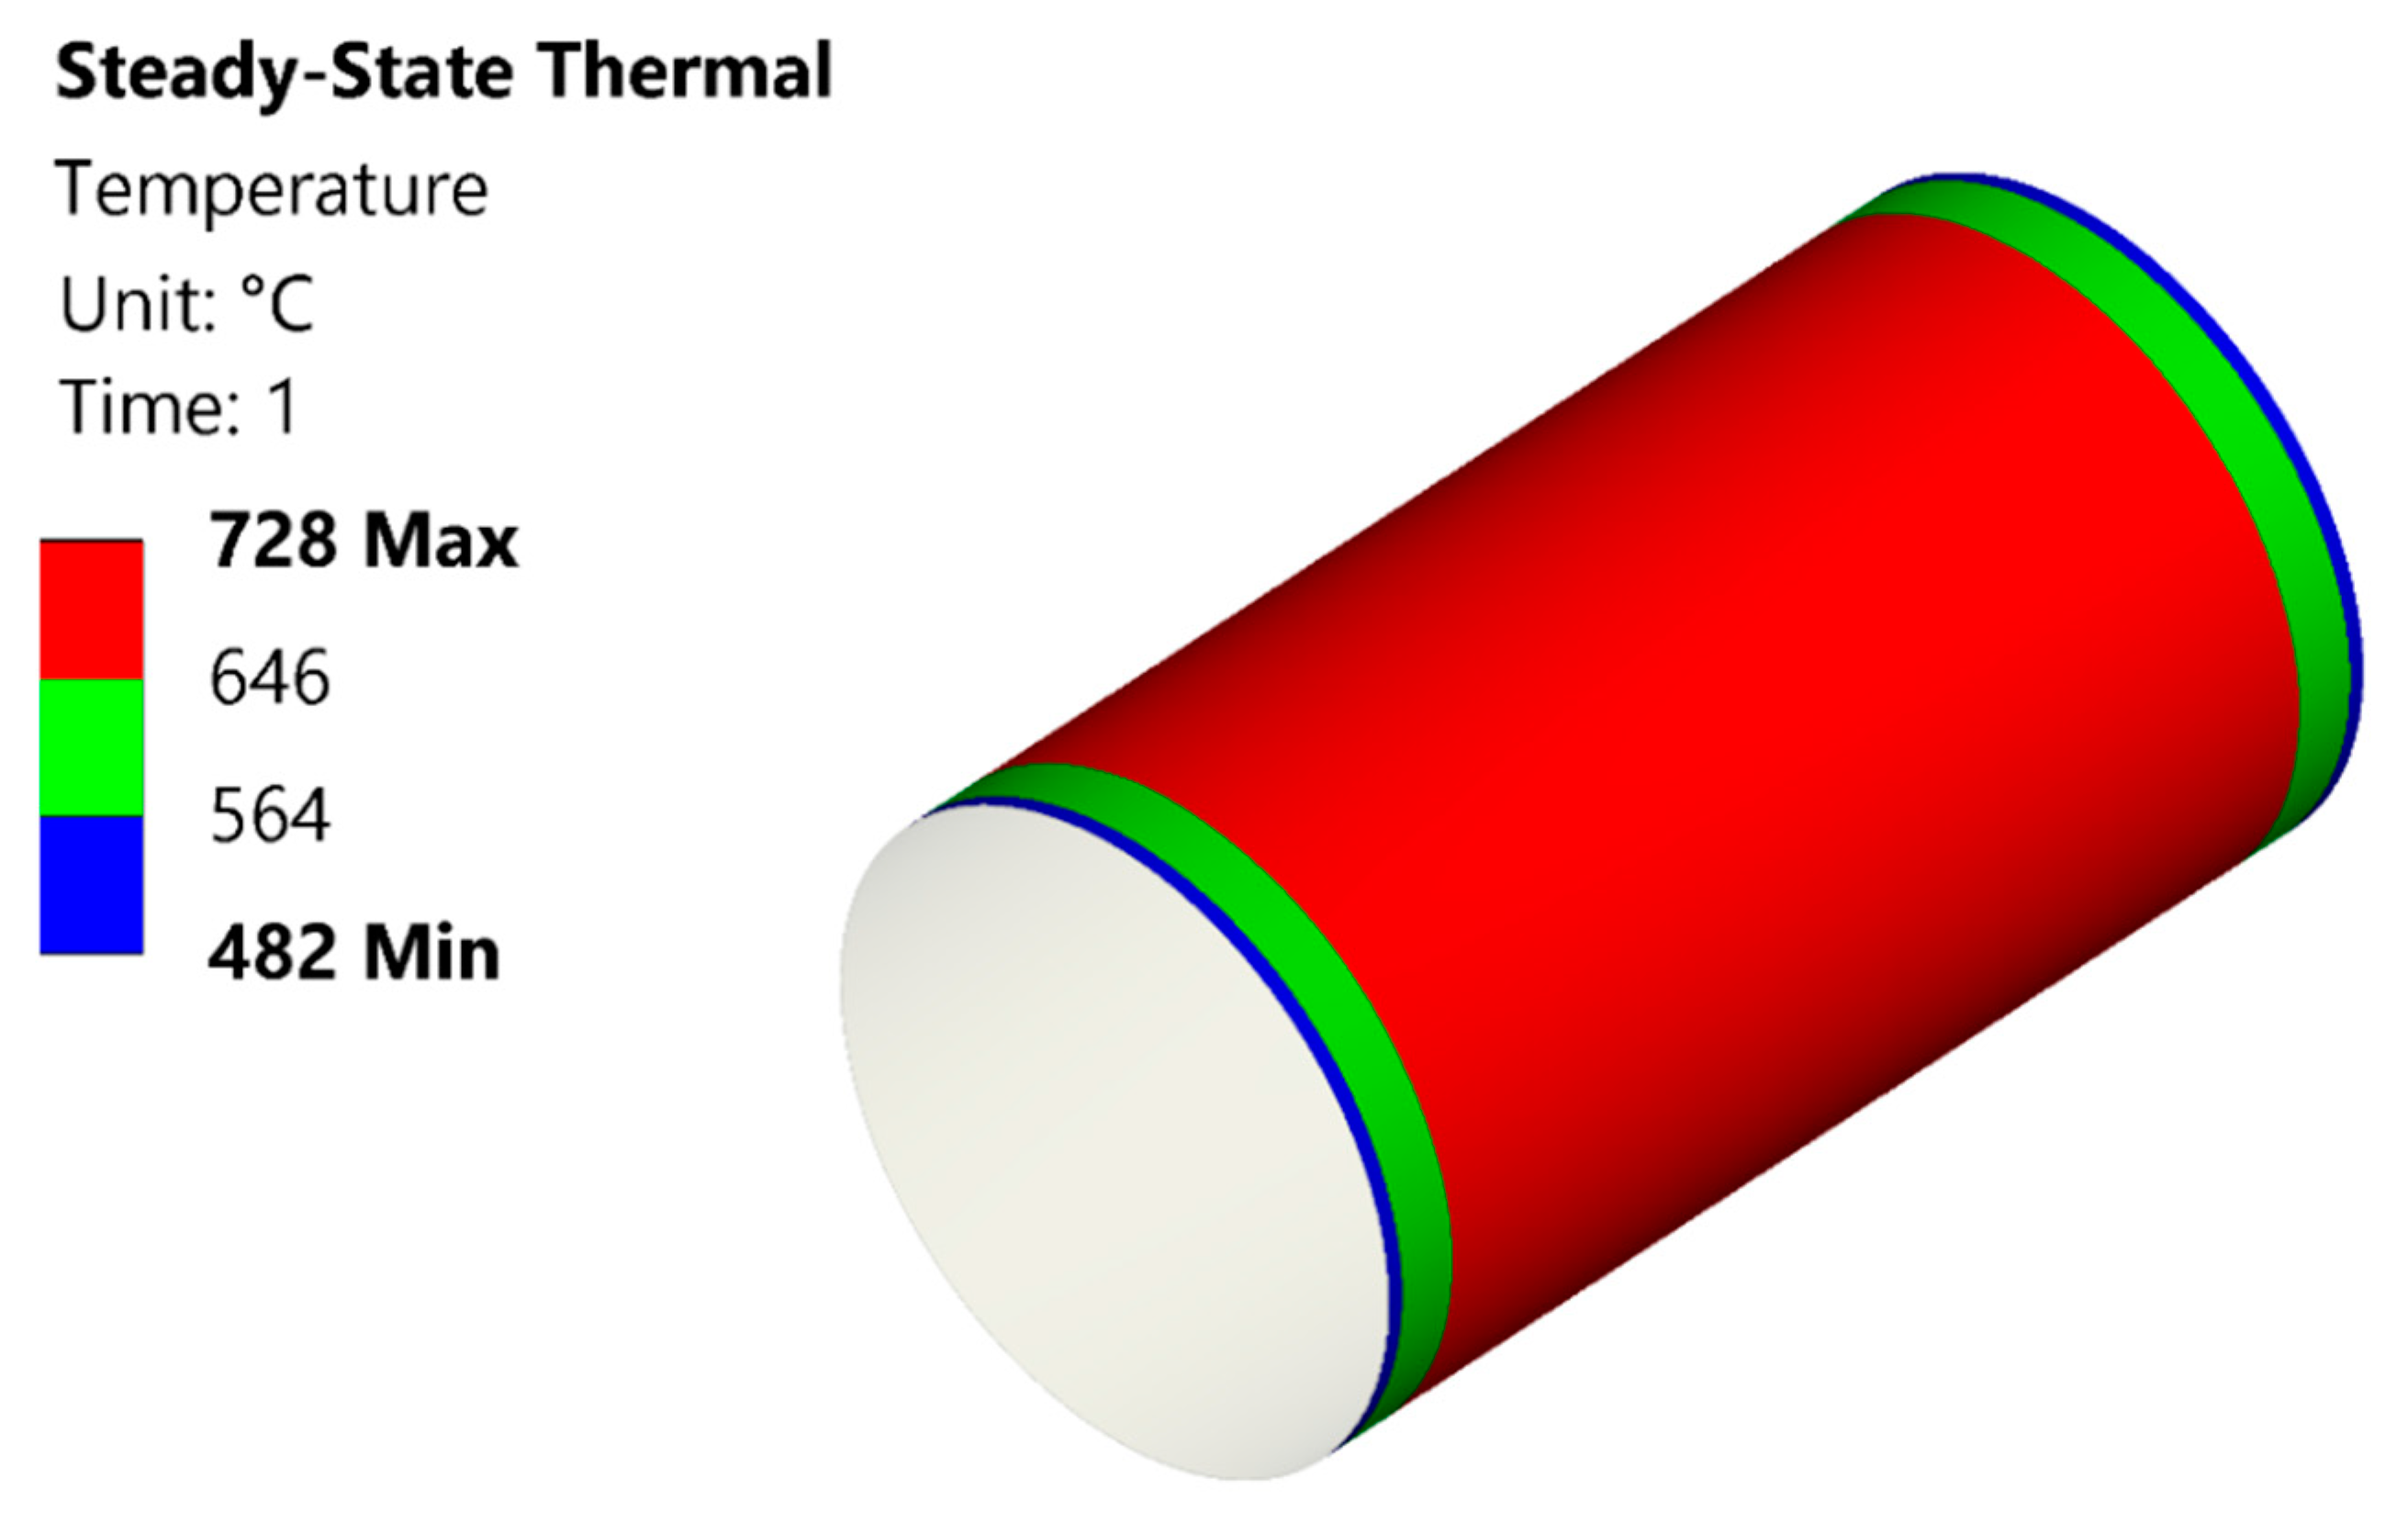
The numerical modeling of the existing furnace was performed using the modeling methodology as explained in Section 2.1.3. The temperature and heat flux values obtained are presented in Figure 5 and Figure 6.
Figure 5 shows the analysis results of 15 mm insulation thickness. The temperature achieved for steady state conditions is 728 °C, which is the maximum temperature obtained on the outer surface. This value of temperature was obtained against the thermal conductivity of 0.50 W/m K, although the thermal conductivity of graphite felt is reported as 0.20–0.27 W/(m.K) in the literature. The altered value of thermal conductivity may be attributed to the deterioration of the material’s physical structure due to repeated heating and cooling cycles. The changed value of thermal conductivity is found in the range of 0.45–0.55 W/(m.K), with respect to temperature values obtained in a series of experiments.
Figure 6 shows the heat flux distribution achieved numerically for the existing furnace. The value obtained in the working zone region is 9120 W/m2. The temperature distribution has only been shown for the outer insulation face because the internal heat shield does not contribute towards heat loss control because of higher thermal conductivity values. The thermal resistance of the inner molybdenum sheet is very low, as calculated in Table 1, hence overall heat flow is not controlled by these shields. The temperature difference between the inner work zone and outer face of molybdenum sheet is about 0.5–1 °C. The regions of green and red in Figure 5 and Figure 6 correspond to the front door and back door of the furnace, respectively. The temperature and heat flux values vary in these regions. The combined radiation conditions, corresponding to different emissivity of materials, are acting on these faces, hence a difference of temperature and heat flux value is observed as compared to the central region. We may assume here that far from the furnace base and door, the temperature and the heat flux are almost independent on the position along the vertical coordinate z. The thermocouples have been placed far from the furnace base and door and this justifies the fact that the z coordinate has been ignored in Equations (1)–(4).

3. Modified Furnace Description

After the verification of the experimental results of the existing furnace (15 mm insulation configuration) numerically, this furnace was configured with a fresh felt of 40 mm thickness to obtain the modified furnace. The selection of insulation thickness for the modified furnace was based on the numerical modeling carried out for a range of thickness values. The thermal conductivity value of the fresh felt was considered to be 0.27 W/(m.K), being the new felt and very first heating cycle of the furnace. The numerical study was performed on the modified furnace with identical boundary conditions as used in the analysis of the existing furnace.

3.1. Numerical Study

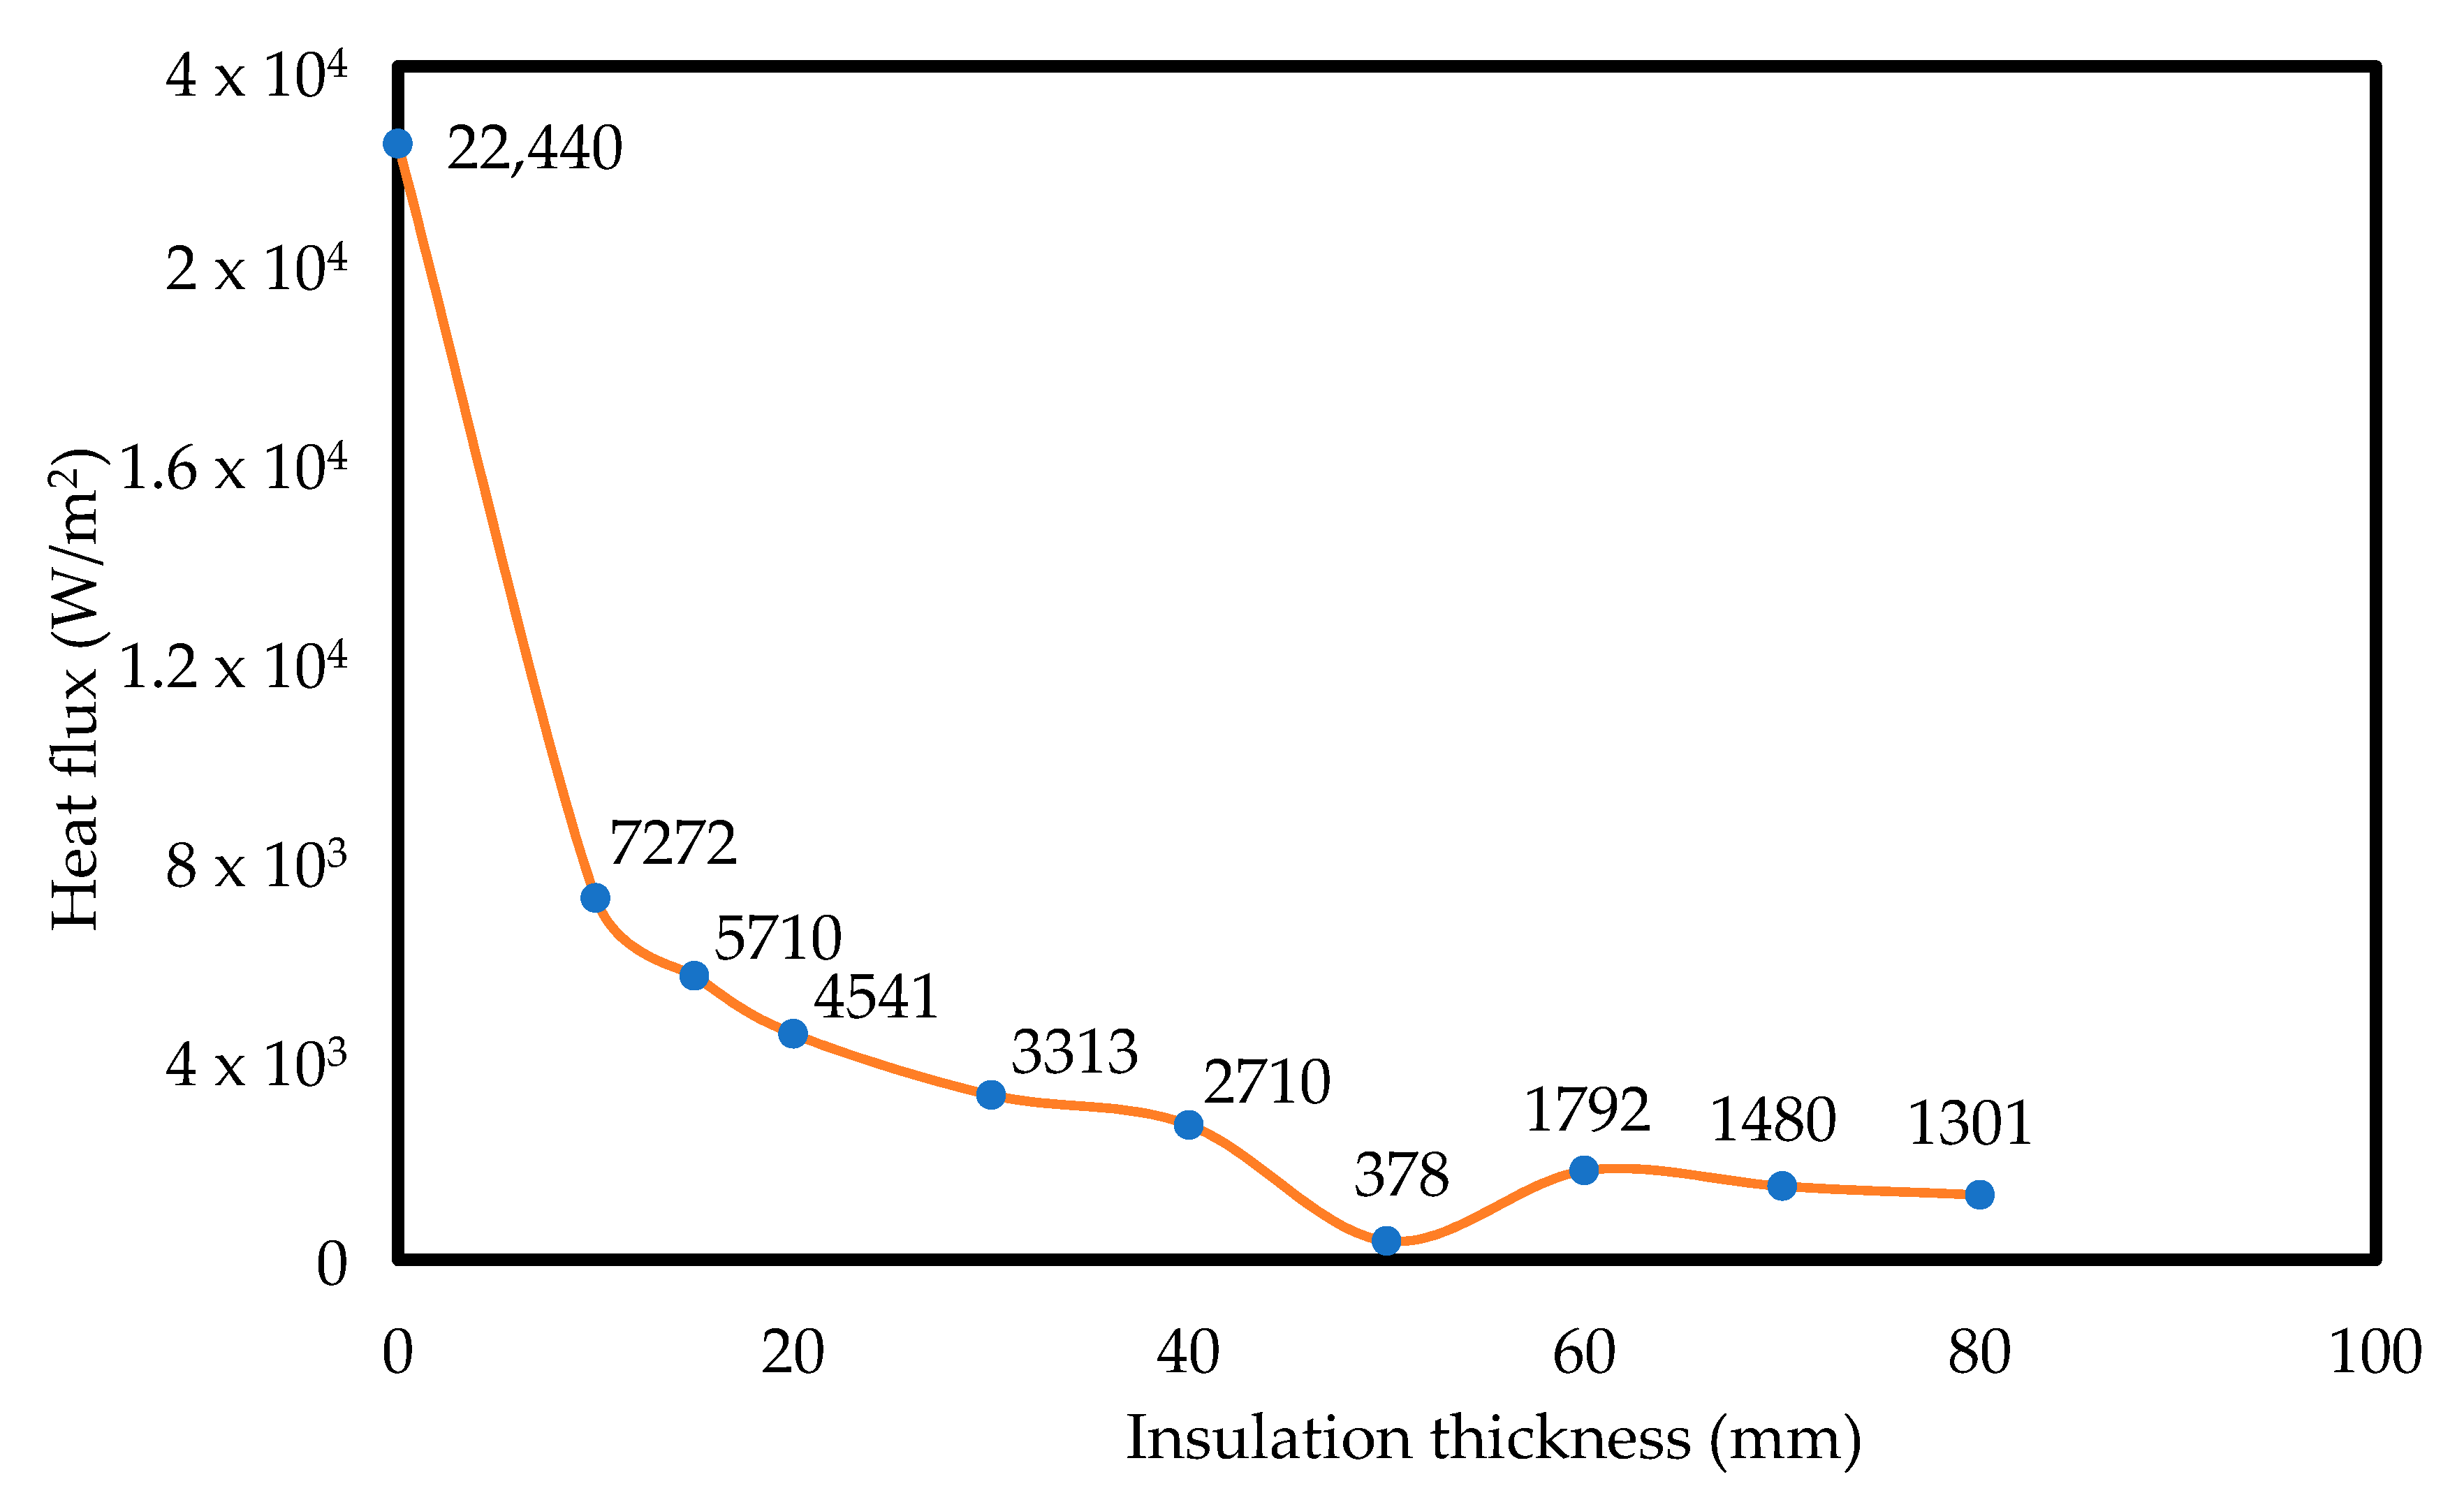
Numerical analysis for the modified furnace was carried out to assess the behavior of the newly installed insulation. Different thickness combinations were evaluated to find the critical value. The results of the analysis are summarized in Table 3 and shown graphically in Figure 7 and Figure 8. Table 3 shows the temperature distribution and corresponding heat flux up to 80 mm insulation thickness. Figure 7 graphically shows that temperature decrease with increasing thickness of insulation. A considerable decrease in temperature value is observed up to 50 mm thickness. Beyond this point, very little decrease occurs for each extra 10 mm layer of graphite blanket. Table 3 and Figure 7 and Figure 8 also represent the study of the furnace without any insulation and with 15 mm new insulation. The results show that there exists a difference in the temperature and heat flux values as compared to the existing furnace results. This difference is attributed to the physical condition of the used and new insulation, as explained earlier in Section 2.1.3.
The graph in Figure 8 illustrates the concept of critical insulation thickness. The heat flux decreases up to 50 mm thickness of insulation. After increasing thickness beyond this point, the heat flux increases again, which may be attributed to the dominance of the radiation phenomenon. It may also be noted that beyond 50 mm insulation thickness, there is much less decrease in temperature, and hence, adding more insulation material will only increase the cost but not efficiency of the furnace. On the basis of the numerical results, the thickness was increased from 15 to 40 mm maximum, due to geometrical constraints of furnace shell. Fresh graphite blanket was applied to the modified furnace as insulation material.

3.2. Experimental Study

Using the analytical approach of Section 2.1.2, heat transfer calculations were performed for the modified furnace. The values of Q and Q″ obtained were 7633 W and 3115 W/m2, respectively.
The experimentally obtained values of temperature for the modified furnace were:
  • Inside hot zone: 1000 °C
  • Outside insulation: 468 °C

4. Validation of Experimental Results

For validation of the experimental results and to evaluate the behavior of the newly installed insulation package, analysis was carried out. The results are presented in Figure 9 and Figure 10.
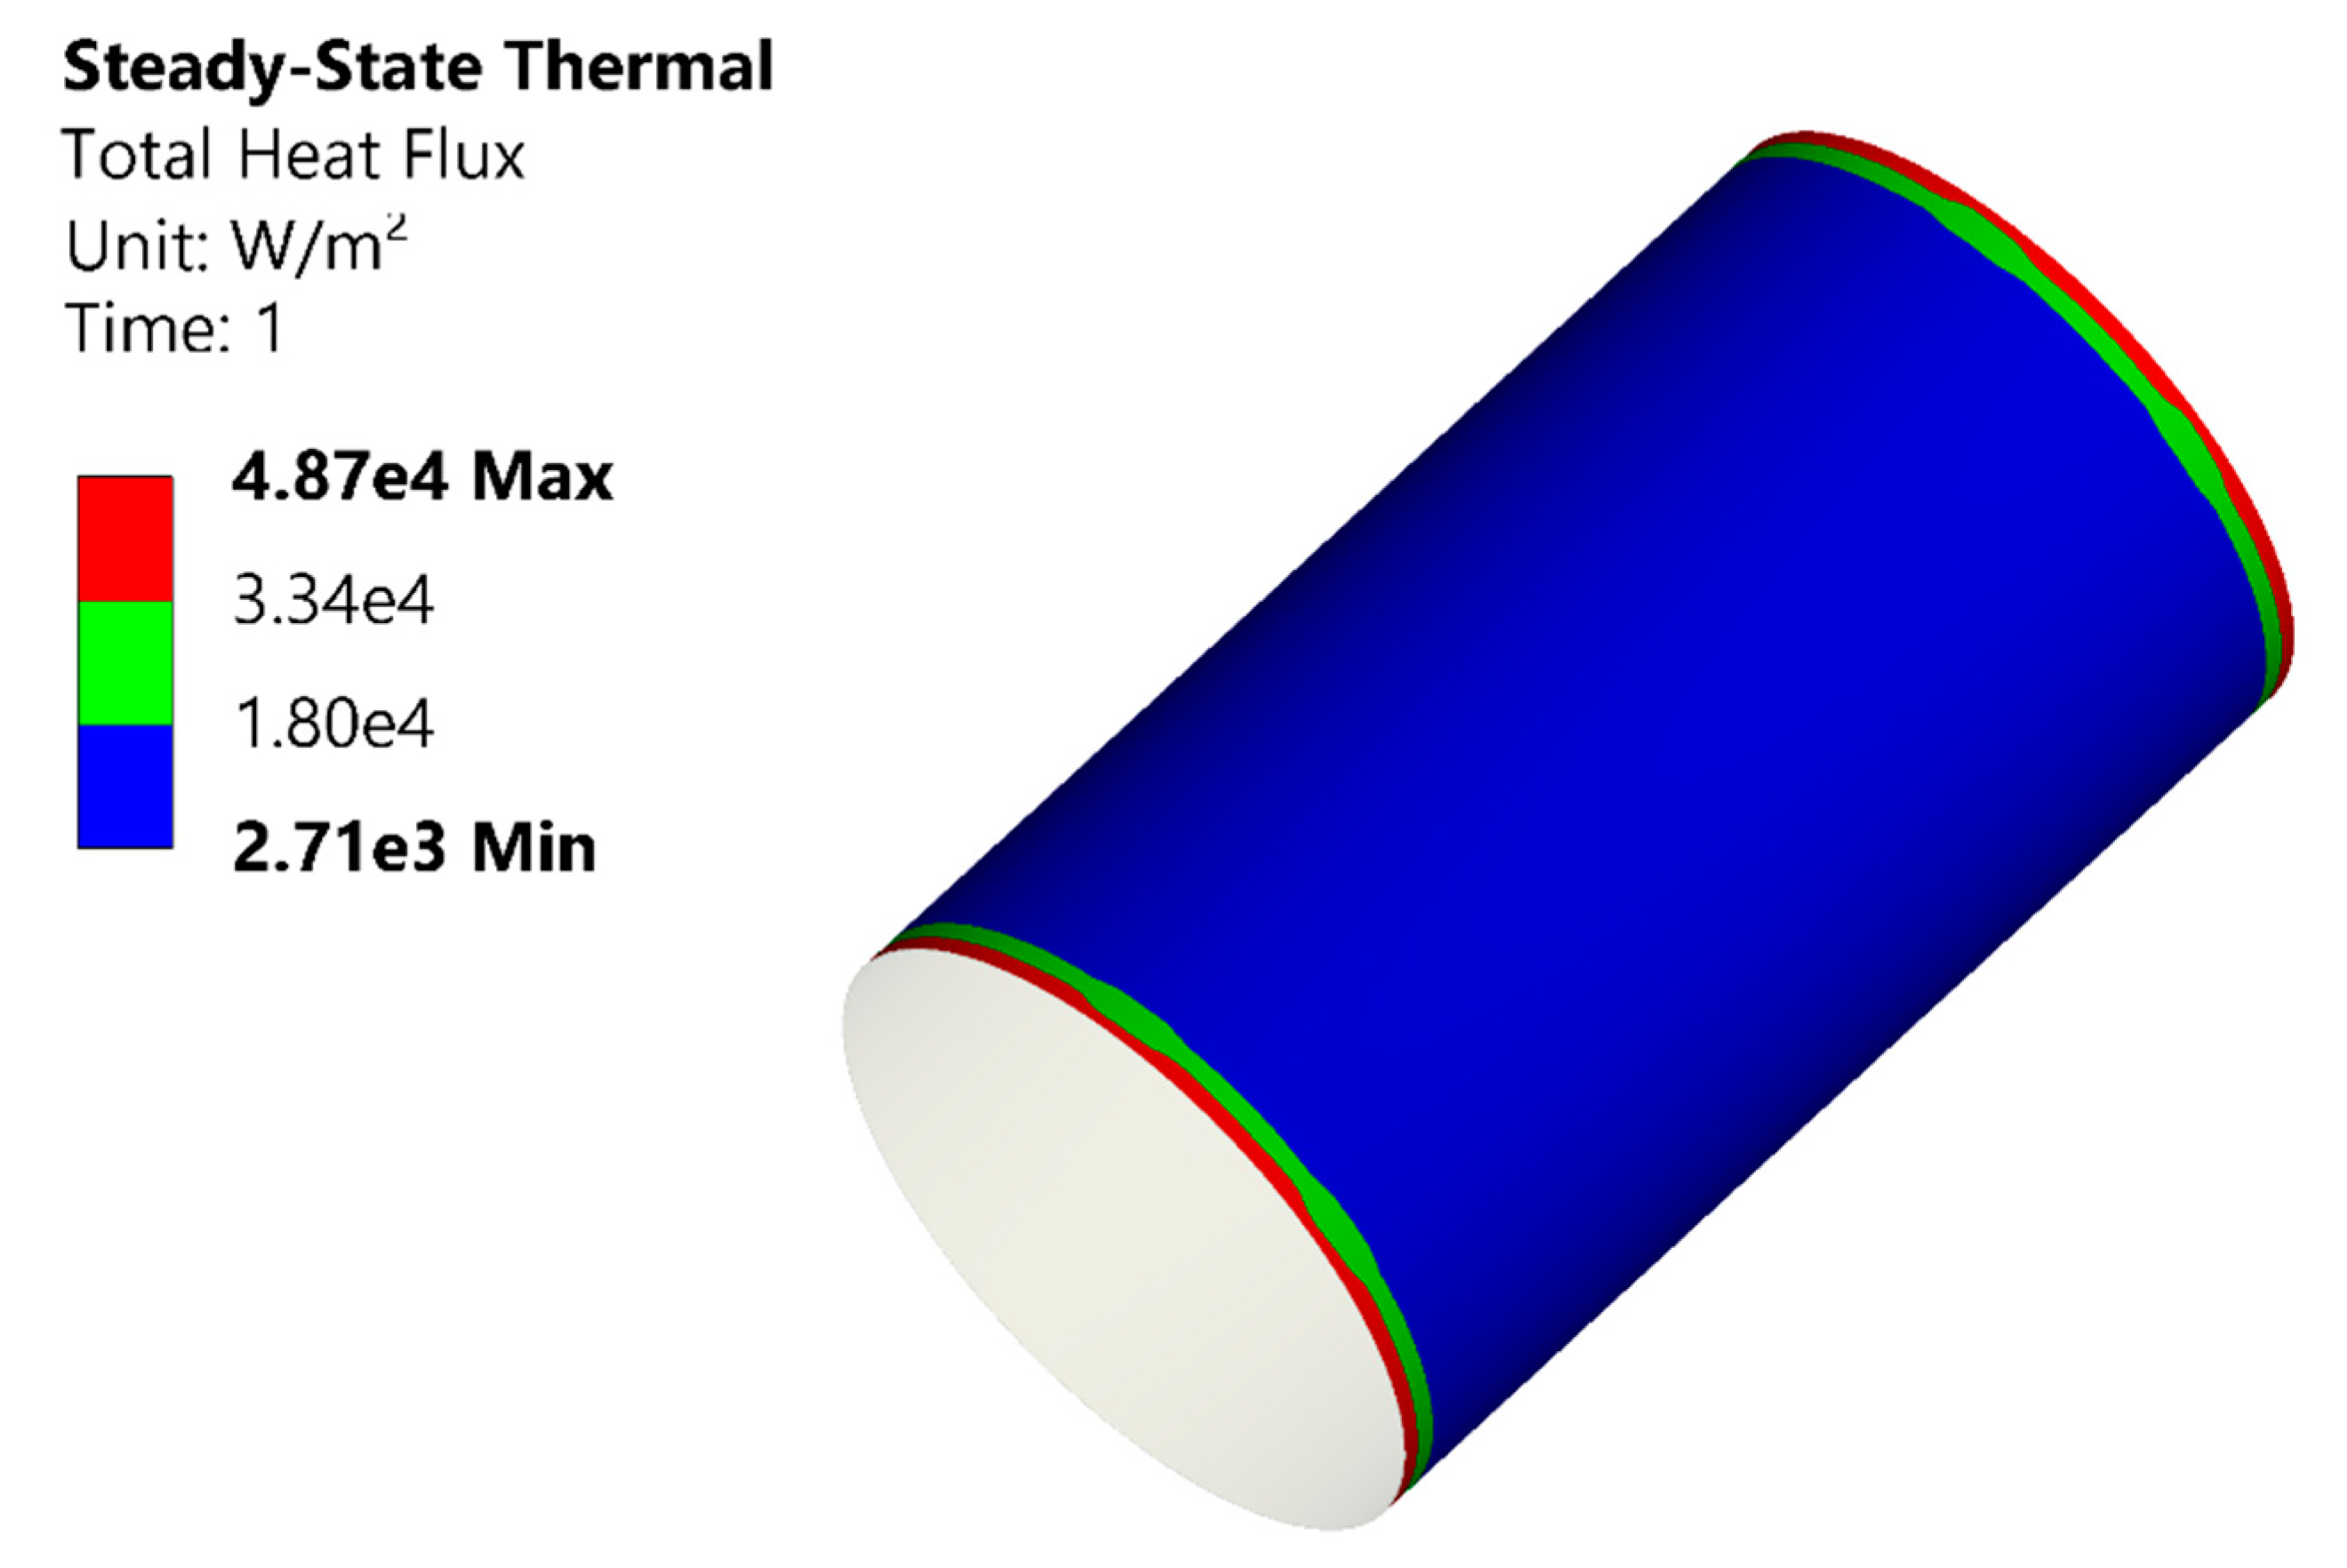
Figure 9 shows the temperature values in the region where the thermocouples were installed. The values of temperature and heat flux obtained in the thermocouple region are 492 °C and 2710 W/m2, respectively. The variation in temperature and heat flux profile along the spatial profile is attributed to the various boundary conditions at the different faces.

Verification of Experimental and Numerical Data

Based on analytical calculations and numerical results, Table 4 shows a comparison between experimental data and numerical data. The temperature and heat flux values for the existing furnace with 15 mm insulation package were compared with the modified one, i.e., furnace with 40 mm insulation package.
The comparison shows that the % error in experimental and numerical results is 1.5–5.0% maximum in temperature value. By using a 40 mm insulation package, the heat flux measured experimentally was reduced to 64%. This trend is in good agreement with the numerical prediction, where the heat flux reduction was estimated as 70%. From the results of Table 4, it is well predicted that numerical results have been validated by experimental data and vice versa. It may be established that that numerical simulation modeling of vacuum furnaces is a promising tool for predicting thermal behavior of the insulation and heat shield systems. The numerical analysis of vacuum furnaces has not been reported extensively in the literature. However, from the above-mentioned study and the results, these methods can be employed effectively at the design and manufacturing stage of furnaces to develop new furnaces and upgrade existing furnaces.

5. Conclusions

In this paper, the vacuum resistance furnace was optimized for heat loss using experimental and numerical data. The experimentation was performed to evaluate the boundary conditions and validate the numerical results. The temperature distribution in the furnace was determined by applying thermocouples at various locations. The numerical analysis helped to predict the behavior of the existing furnace for heat loss and proposed a solution for increasing efficiency of the furnace. On the basis of the ANSYS results, insulation thickness was increased to maximum available space inside the structural shell of the furnace. The numerical results predicted that 70% optimization can be achieved with the new insulation thickness. After increasing the thickness, experimental validation of the numerical results was performed, and it was found that 64% optimization was achieved, and the power consumption was reduced from 21 to 7 kW. If the furnace operates for 12 h in a day, it consumes around 252 extra kWh to compensate for the heat losses. The corresponding annual capital operational cost, which includes the cost of insulation also, is about USD 19,896. After increasing the insulation thickness, the losses can be reduced to 7 kWh and the corresponding annual capital operational cost to USD 10,132. Hence, a saving of USD 9764 can be achieved with optimal thickness of insulation. It is mandatory to calculate for the capital saving while modifying the insulation configuration to assess for the net profit. The cost comparison table is inserted at Appendix B. It is also concluded that thermal analysis in vacuum furnaces can be performed with moderate mesh size, since temperature variations of only 5 °C were obtained against 5 times finer mesh. This will help to minimize the computational time and cost. The phenomenon of critical thickness was observed for insulation thickness. It can be concluded that beyond critical thickness of insulation, adding more insulation will have an adverse effect on the heat flow rate. This paper suggests that during service conditions, thermal conductivity of insulation changes due to physical and structural deterioration. This may cause a decrease in efficiency of insulation material and, consequently, the process, even if the initial design of the furnace was well worked out. It can be concluded that the application of numerical methods can contribute a lot towards better control and safety of the process. The hit and trial method may be replaced with numerical simulations and modeling techniques to save time and cost in the designing phase. Numerical study can be effectively employed to study the thermal behavior of furnaces working in vacuum.

Supplementary Materials

The following are available online at https://www.mdpi.com/2227-9717/7/12/907/s1.

Author Contributions

Conceptualization, S.B.; Data curation, M.A.; Formal analysis, M.A.; Funding acquisition, I.U.H. and S.A.M.; Project administration, S.B. and M.B.; Resources, I.U.H. and S.A.M.; Software, M.A.; Supervision, S.B. and S.J.; Writing—Original draft, M.A.; Writing—Review & editing, S.B., I.U.H., S.A.M., M.B. and S.J.

Funding

This research received no external funding.

Acknowledgments

The authors of the paper are thankful to Prime engineering Pvt. Ltd. Lahore, Pakistan, for providing the facility for experimentation on the heat treatment furnace.

Conflicts of Interest

The authors declare no conflicts of interest.

Appendix A

An in-depth analysis of mesh sensitivity was performed for the existing furnace to study the behavior of elemental size and nodal quantity. The results of the analysis are presented graphically in Figure A1. From the figure, it is predicted that beyond certain mesh density, fineness of mesh size has very little effect on the temperature changes during thermal analysis. The temperature values presented in the graph were calculated outside the insulation face. The graph shows that with increasing mesh density, the temperature value increases. For a 5 times increase in finer mesh, the change in temperature is only 5 °C. Therefore, thermal analysis can be carried out with an average fine mesh.
Figure A1. Mesh sensitivity study.
Processes 07 00907 g0a1

Appendix B

Table A1. Table cost comparison study for different insulation thicknesses.
Insulation ThicknessAnnual Capital Cost of Operation
(mm)($)
1519,896
4010,132
Net saving in capital operational cost after increasing the thickness9764
Table Notes: (1) The annual capital cost assumes 12 h of furnace operation per day. (2) Capital cost is the sum of electricity and insulation cost. (3) Cost of electricity is 0.2 $/Kwh. (4) Cost of insulation is 1000 $/sheet of 10 mm thickness.

References

  1. Aliferov, A.; Sinicin, V.; Vasil’eva, E. Heat transfer through combined thermal insulation of cylindrical vacuum resistive furnace. J. Phys. Conf. Ser. 2018, 1105, 012149. [Google Scholar] [CrossRef]
  2. Haohua, X.; Tao, X.; Jian, T.; Lulu, F.; Tianshuang, X.; Tatsuo, Y. Research on the Temperature Uniformity of Vacuum Furnace and Size Optimization of Working Zone. In Proceedings of the 2015 8th International Conference on Intelligent Computation Technology and Automation (ICICTA), Nanchang, China, 14–15 June 2015; IEEE: Piscataway, NJ, USA; pp. 789–792. [Google Scholar]
  3. Mehta, N.C.; Shukla, D.D. Computational Investigation for Life Cycle of Alumina based Induction Furnace Wall. Int. J. Civ. Mech. Energy Sci. 2017, 3, 42–52. [Google Scholar] [CrossRef]
  4. Zhang, Q.; Zhao, X.; Lu, H.; Ni, T.; Li, Y. Waste energy recovery and energy efficiency improvement in China’s iron and steel industry. Appl. Energy 2017, 191, 502–520. [Google Scholar] [CrossRef]
  5. Niedziela, J.L.; Mills, R.; Loguillo, M.J.; Skorpenske, H.D.; Armitage, D.; Smith, H.L.; Lin, J.Y.; Lucas, M.S.; Stone, M.B.; Abernathy, D.L. Design and operating characteristic of a vacuum furnace for time-of-flight inelastic neutron scattering measurements. Rev. Sci. Instrum. 2017, 88, 105116. [Google Scholar] [CrossRef] [PubMed]
  6. Rezazadeh, N.; Hosseinzadeh, H.; Wu, B. The study of heat transfers in heat treatment furnaces in steel industry. IOP Conf. Ser. Environ. Sci. 2018, 163, 012108. [Google Scholar] [CrossRef]
  7. Mohite, N.T.; Benni, R.G.; Desai, A.A.; Patil, A.V. Optimization of Wall Thickness for Minimum Heat Losses for Induction Furnace. Int. J. Eng. Res. Technol. 2017, 10, 453–461. [Google Scholar]
  8. Hadała, B.; Malinowski, Z.; Rywotycki, M. Energy losses from the furnace chamber walls during heating and heat treatment of heavy forgings. Energy 2017, 139, 298–314. [Google Scholar] [CrossRef]
  9. Kantor, R. Modelling of a coupled radiation-conduction heat transfer through a heat shield in vacuum thermal isolation applications. Procedia Eng. 2016, 157, 271–278. [Google Scholar] [CrossRef] [Green Version]
  10. Paramonov, A.M. Heating furnaces efficiency improvement. Procedia Eng. 2015, 113, 181–185. [Google Scholar] [CrossRef] [Green Version]
  11. Khodabandeh, E.; Ghaderi, M.; Afzalabadi, A.; Rouboa, A.; Salarifard, A. Parametric study of heat transfer in an electric arc furnace and cooling system. Appl. Therm. Eng. 2017, 123, 1190–1200. [Google Scholar] [CrossRef]
  12. Hooks, J.; Demko, J.; Fesmire, J.; Matsumoto, T. Investigations of Heat Transfer in Vacuum between Room Temperature and 80 K. IOP Conf. Ser. Mater. Sci. Eng. 2017. [Google Scholar] [CrossRef] [Green Version]
  13. Li, Z.-Z.; Li, Y.; Shen, Y.-D.; Lee, J.-W. Performance prediction of large scale vacuum furnace using thermal analysis. In Proceedings of the 2010 Second International Conference on Information Technology and Computer Science, Kiev, Ukraine, 24–25 July 2010; IEEE: Piscataway, NJ, USA; pp. 215–217. [Google Scholar]
  14. Scharler, R.; Obernberger, I. Numerical modelling of biomass grate furnaces. In Proceedings of the European Conference on Industrial Furnaces and Boilers (INFUB), Porto, Portugal, 18–21 April 2000. [Google Scholar]
  15. Kontoleon, K.; Theodosiou, T.G.; Tsikaloudaki, K.G. The influence of concrete density and conductivity on walls’ thermal inertia parameters under a variety of masonry and insulation placements. Appl. Energy 2013, 112, 325–337. [Google Scholar] [CrossRef]
  16. Zaki, G.M.; Al-Turki, A.M. Optimization of multilayer thermal insulation for pipelines. Heat Transf. Eng. 2000, 21, 63–70. [Google Scholar]
  17. Sahin, A.Z.; Kalyon, M. The critical radius of insulation in thermal radiation environment. Heat Mass Transf. 2004, 40, 377–382. [Google Scholar] [CrossRef]
  18. Sawicki, J.; Gutkowski, A.; Kaczmarek, I.; Paweta, S.; Rylski, A.; Treatment, H. Modeling of Thermal Phenomena and Economic Aspect of Configuring Furnace Graphite Insulation. Metal Sci. Heat Treat. 2015, 56, 685–689. [Google Scholar] [CrossRef]
  19. Kim, M.J.; Jung, H.G.; Lee, J.W.; Lee, C.J.; Byun, Y.H. Optimal design of an energy efficient vacuum furnace using thermal analysis database. Key Eng. Mater. 2005, 277–279, 732–740. [Google Scholar] [CrossRef]
  20. Chahine, K.; Ballico, M.; Reizes, J.; Madadnia, J. Thermal Conductivity of Graphite Felt at High. Temperatures. In Proceedings of the Australasian Heat & Mass Transfer Conference, Curtin University of Technology, Perth, Australia, 26–29 July 2005. [Google Scholar]
  21. Carboncompositesinc. Available online: http://carboncompositesinc.com/ (accessed on 26 October 2019).
  22. Emissivity of Various Surfaces. Available online: http://www-eng.lbl.gov/~dw/projects/DW4229_LHC_detector_analysis/calculations/emissivity2.pdf (accessed on 26 October 2019).
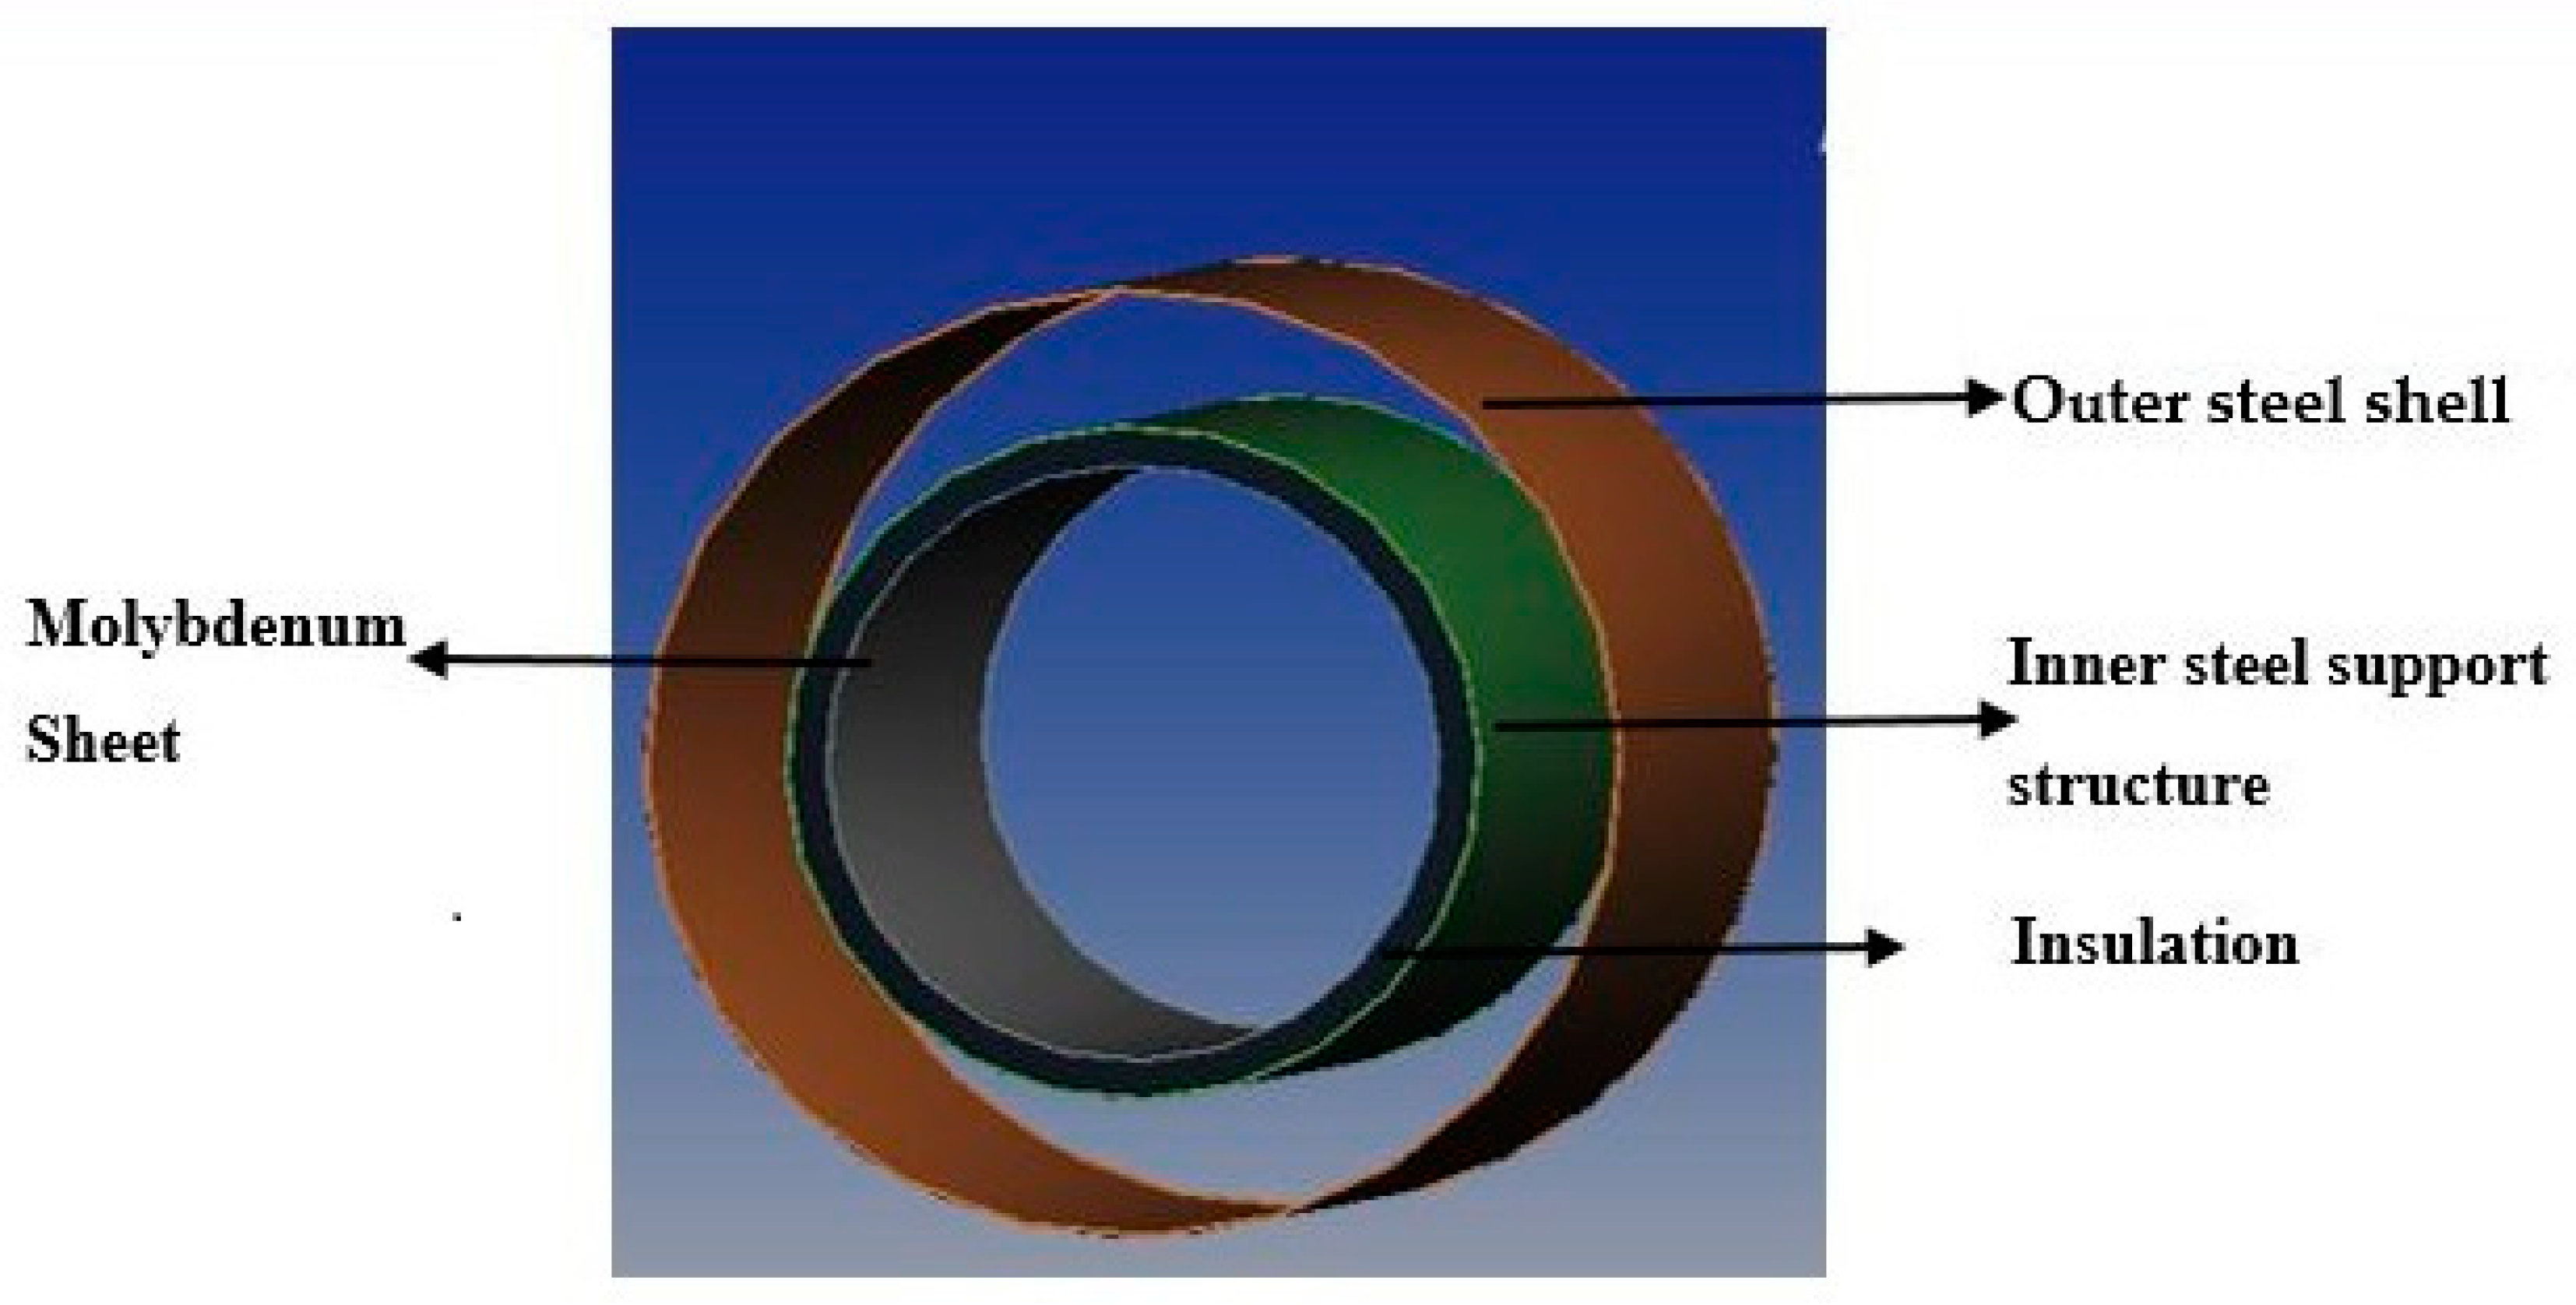
Figure 1. Geometric configuration of the existing furnace (without the front and back door).
Processes 07 00907 g001
Figure 2. Multiwalled cylindrical system.
Processes 07 00907 g002
Figure 3. Scheme of the heat flow and analogous resistance circuit.
Processes 07 00907 g003
Figure 4. Boundary conditions for numerical study.
Processes 07 00907 g004
Figure 5. Temperature (°C) distribution for the existing furnace.
Processes 07 00907 g005
Figure 6. Heat flux (W/m2) distribution for the existing furnace.
Processes 07 00907 g006
Figure 7. Temperature variation against insulation thickness.
Processes 07 00907 g007
Figure 8. Heat flux variation against insulation thickness.
Processes 07 00907 g008
Figure 9. Temperature (°C) distribution for the modified furnace.
Processes 07 00907 g009
Figure 10. Heat flux (W/m2) distribution for the modified furnace.
Processes 07 00907 g010
Table 1. Thermal resistance calculation details for the existing furnace.
Insulation: 15 mm Thickness
MaterialK (W/(m.K))L (mm)r1 (mm)Thickness (mm)r2 (mm)Rindividual K/W
Molybdenum13012403150.5315.51.57 × 10−6
Graphite felt0.45–0.55 **1240315.515330.51.32 × 10−2
Stainless steel13.81240330.52332.55.61 × 10−5
** The experimental value of thermal conductivity of the used felt as predicted from temperate value by conducting a series of experiments at different temperature regimes and time spans.
Table 2. Material data for numerical simulation [20,21,22].
PropertyMaterial Description
MolybdenumGraphite FeltStainless Steel
Thermal Conductivity (W/(m.K))110–1300.45–0.5513.8
Emissivity0.820.96–0.990.66
Density (g/cm3)10.281.88
Table 3. Temperature distribution for various thicknesses of new insulation obtained from numerical simulations.
Sr. NoInsulation Thickness (mm)Temperature °CΔT, °CQ″, W/m2
10993722,440
2106573427272
3156133875710
4205694314541
5305214793313
6404925082710
750474525378
8604605401792
9704535461480
10804505491301
Table 4. Comparison table for numerical and experimental results.
Furnace ConfigurationTemperature °CQ″ W/m2
ExperimentalNumericalExperimentalNumerical
Existing Furnace71872886509120
Modified Furnace46849231152710