Multivariate Analysis of Plasma Metabolites in Children with Autism Spectrum Disorder and Gastrointestinal Symptoms Before and After Microbiota Transfer Therapy

 , ,
, , 
Abstract
1. Introduction
2. Materials and Methods
2.1. Study Population and MTT Treatment
2.2. Metabolite Measurements
2.3. Statistical Methods
3. Results
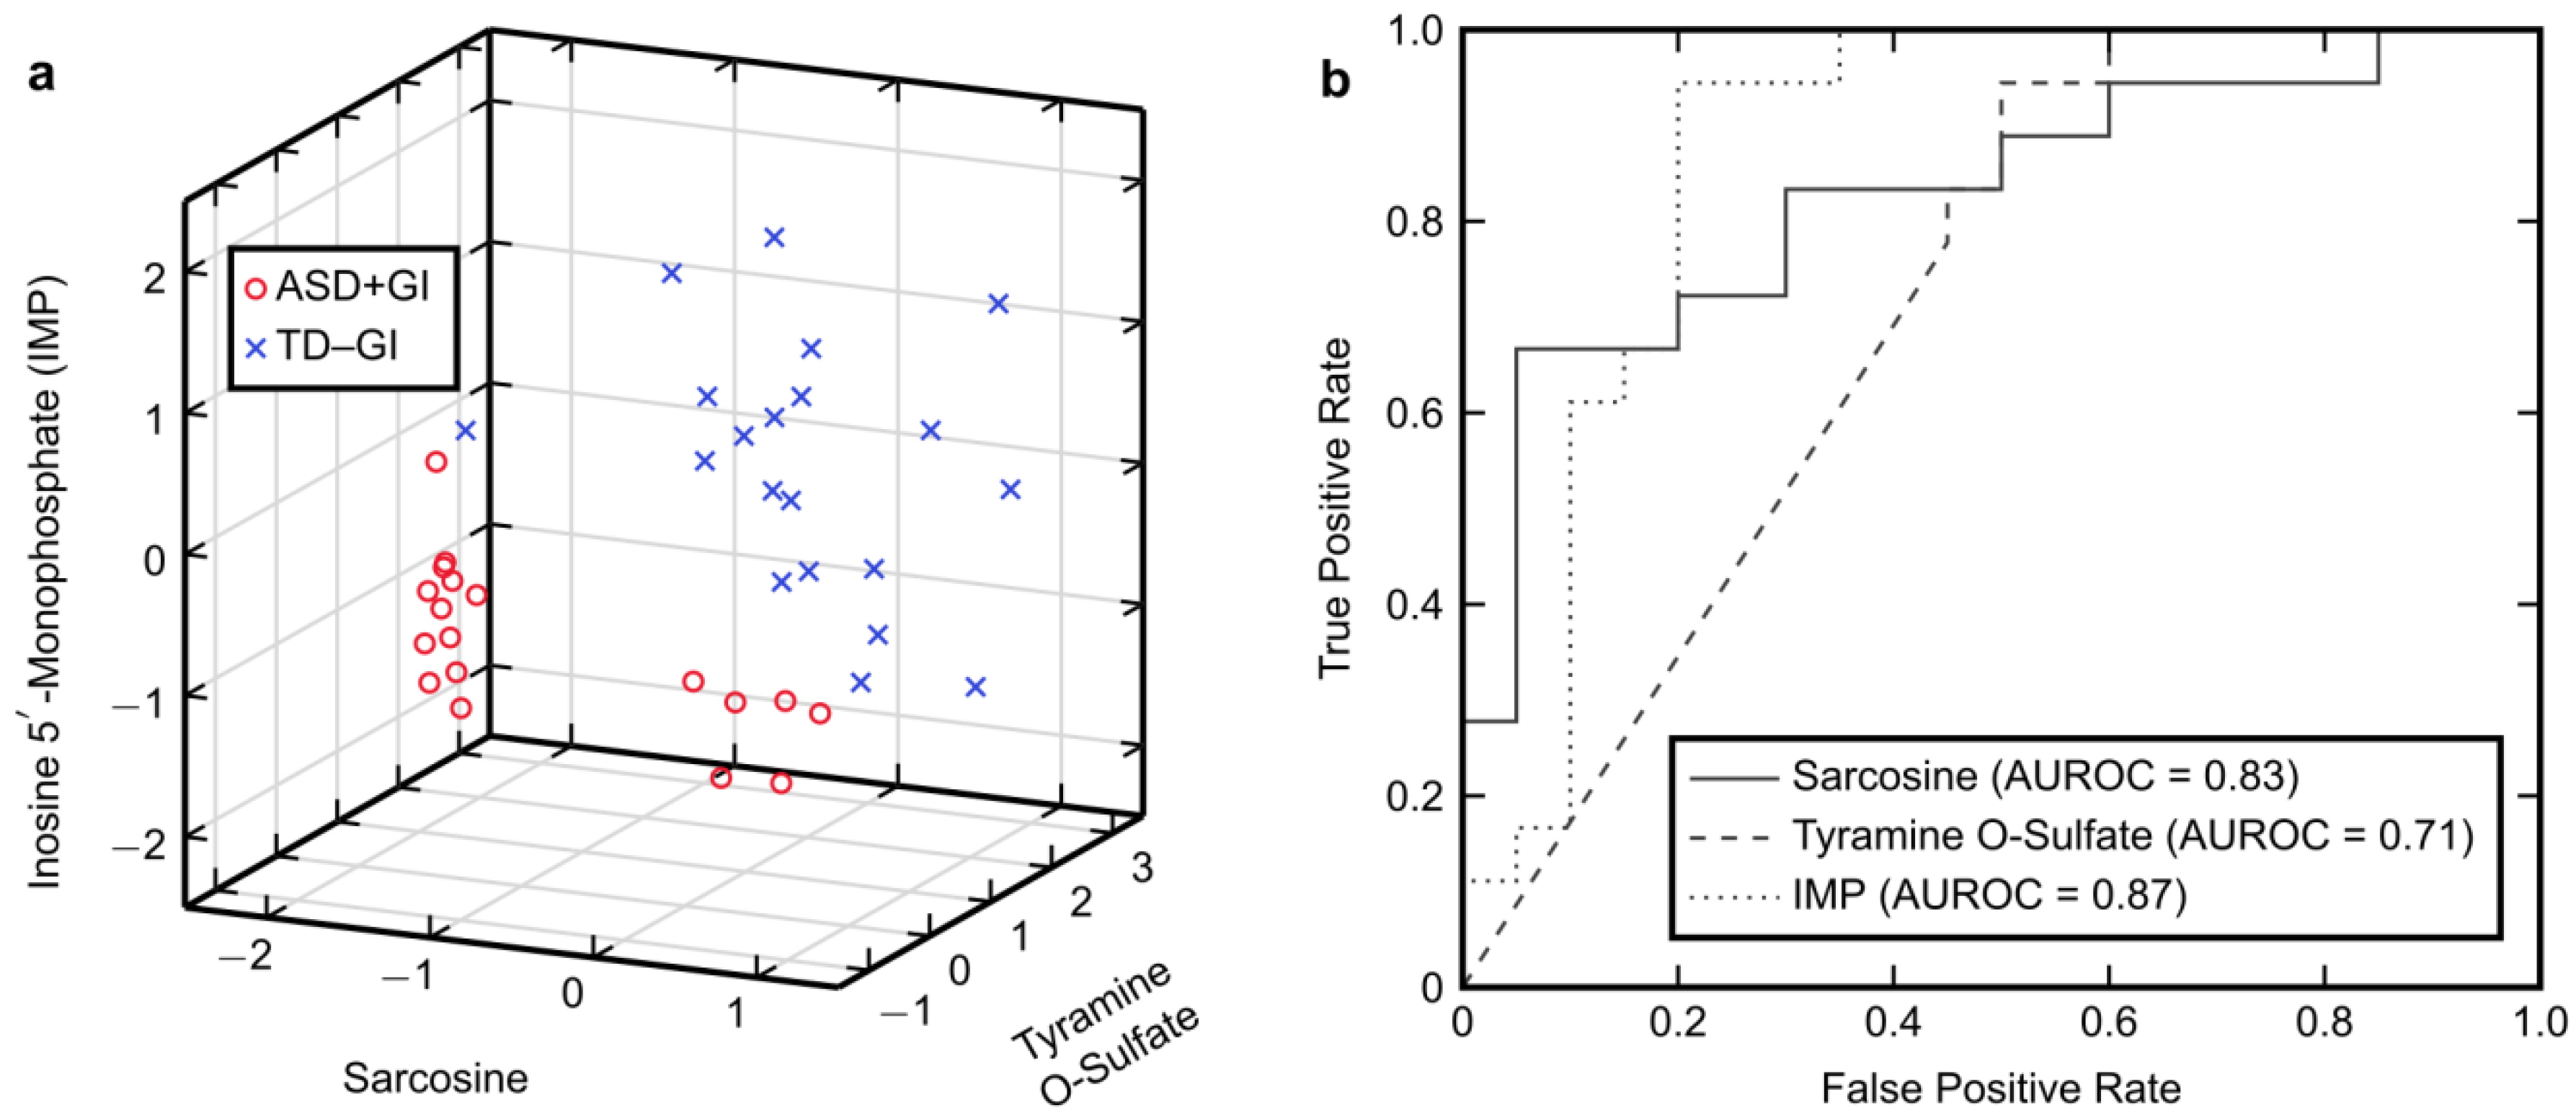
3.1. Univariate Analysis
3.2. Classification with FDA
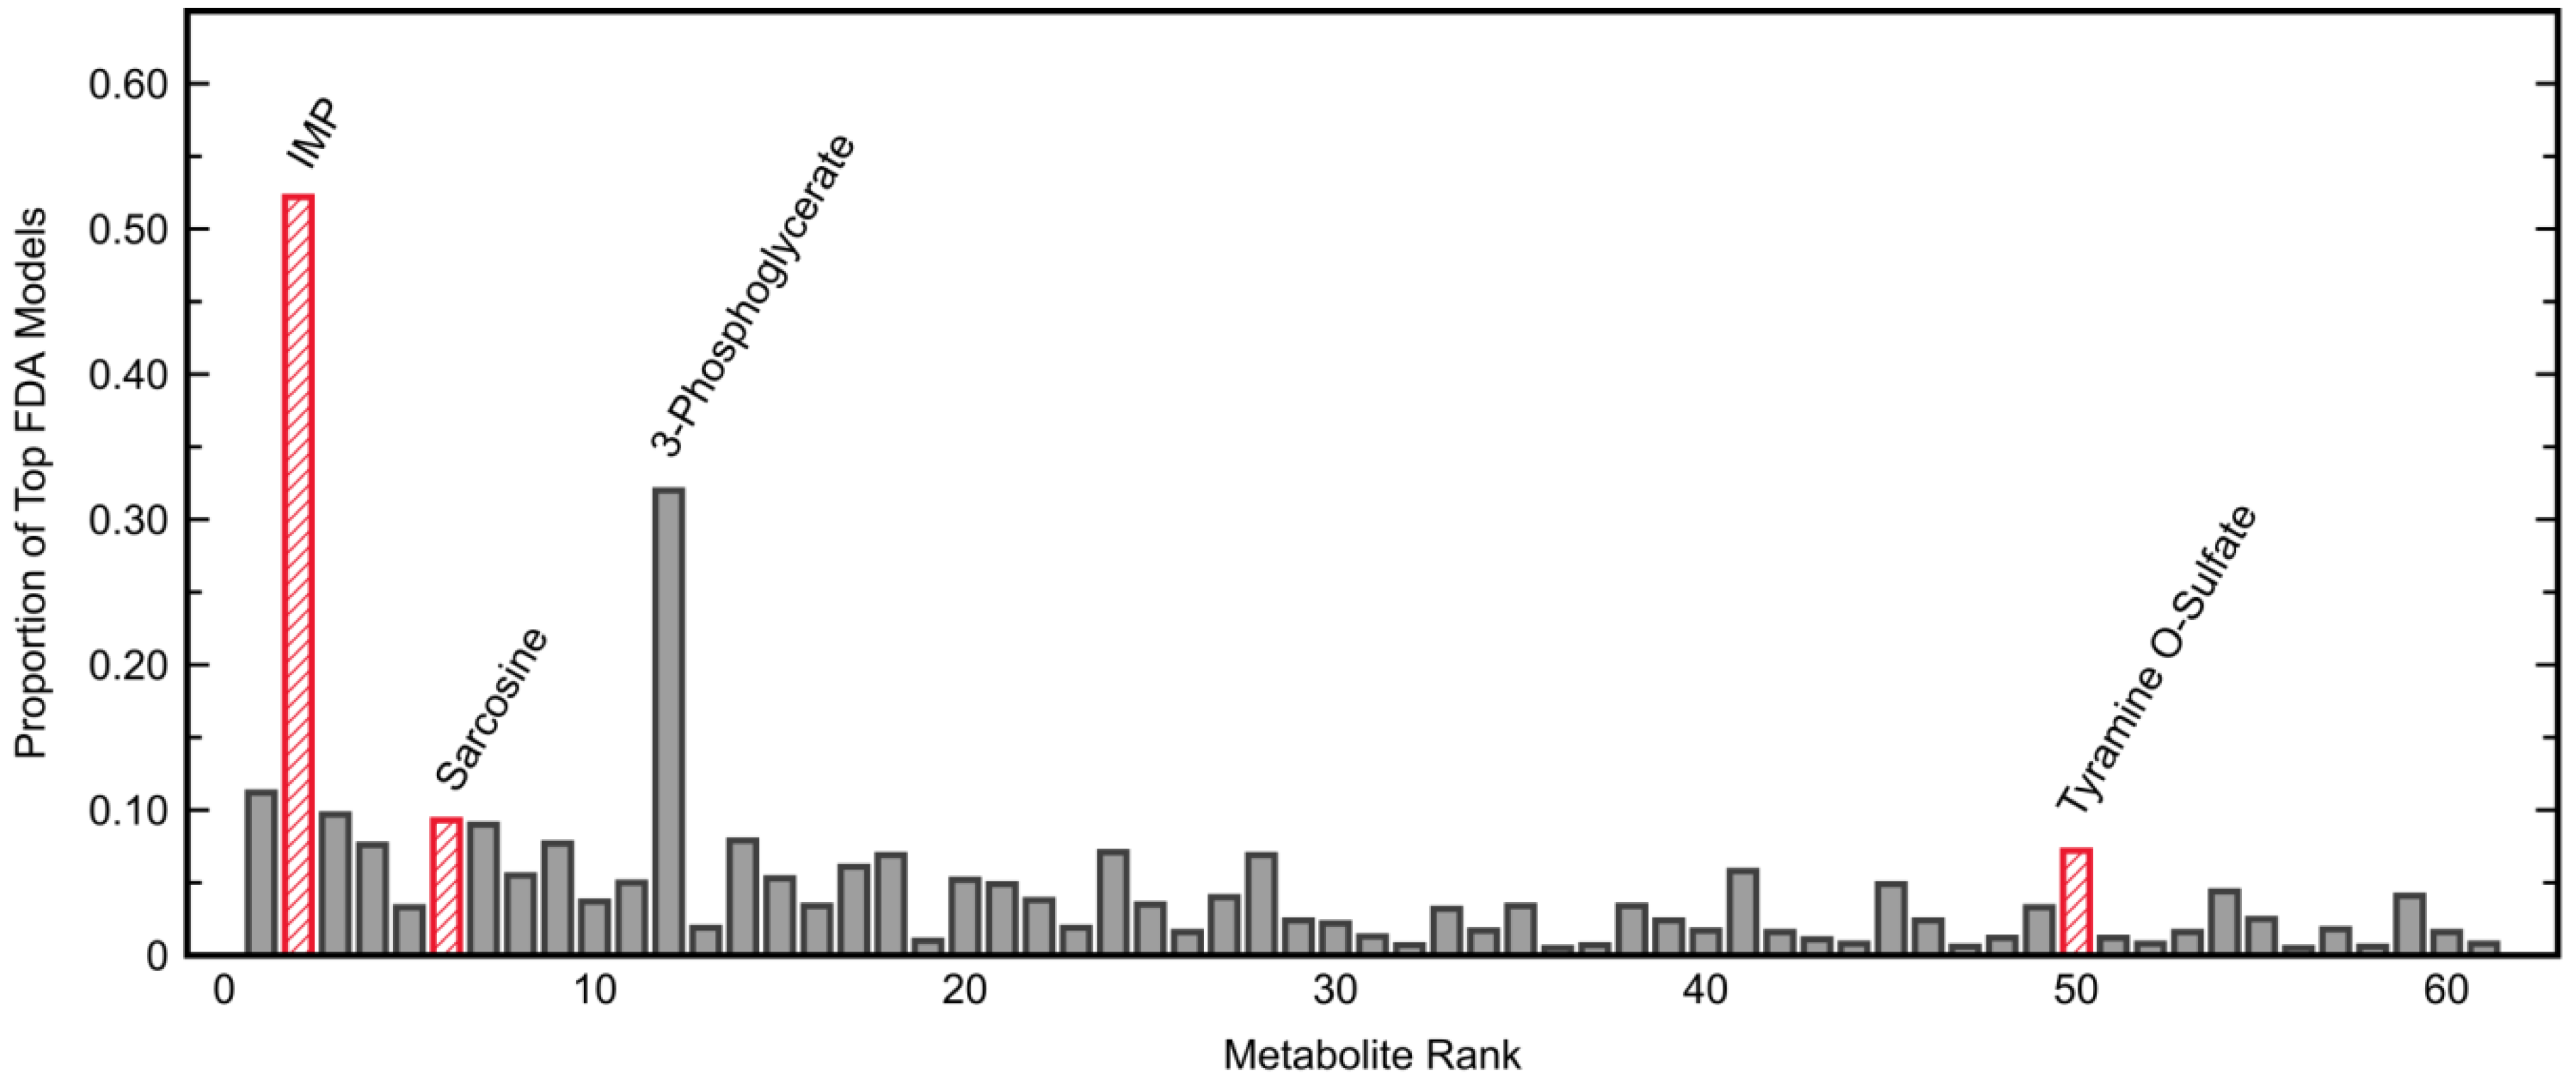
3.2.1. Model Development and Selection
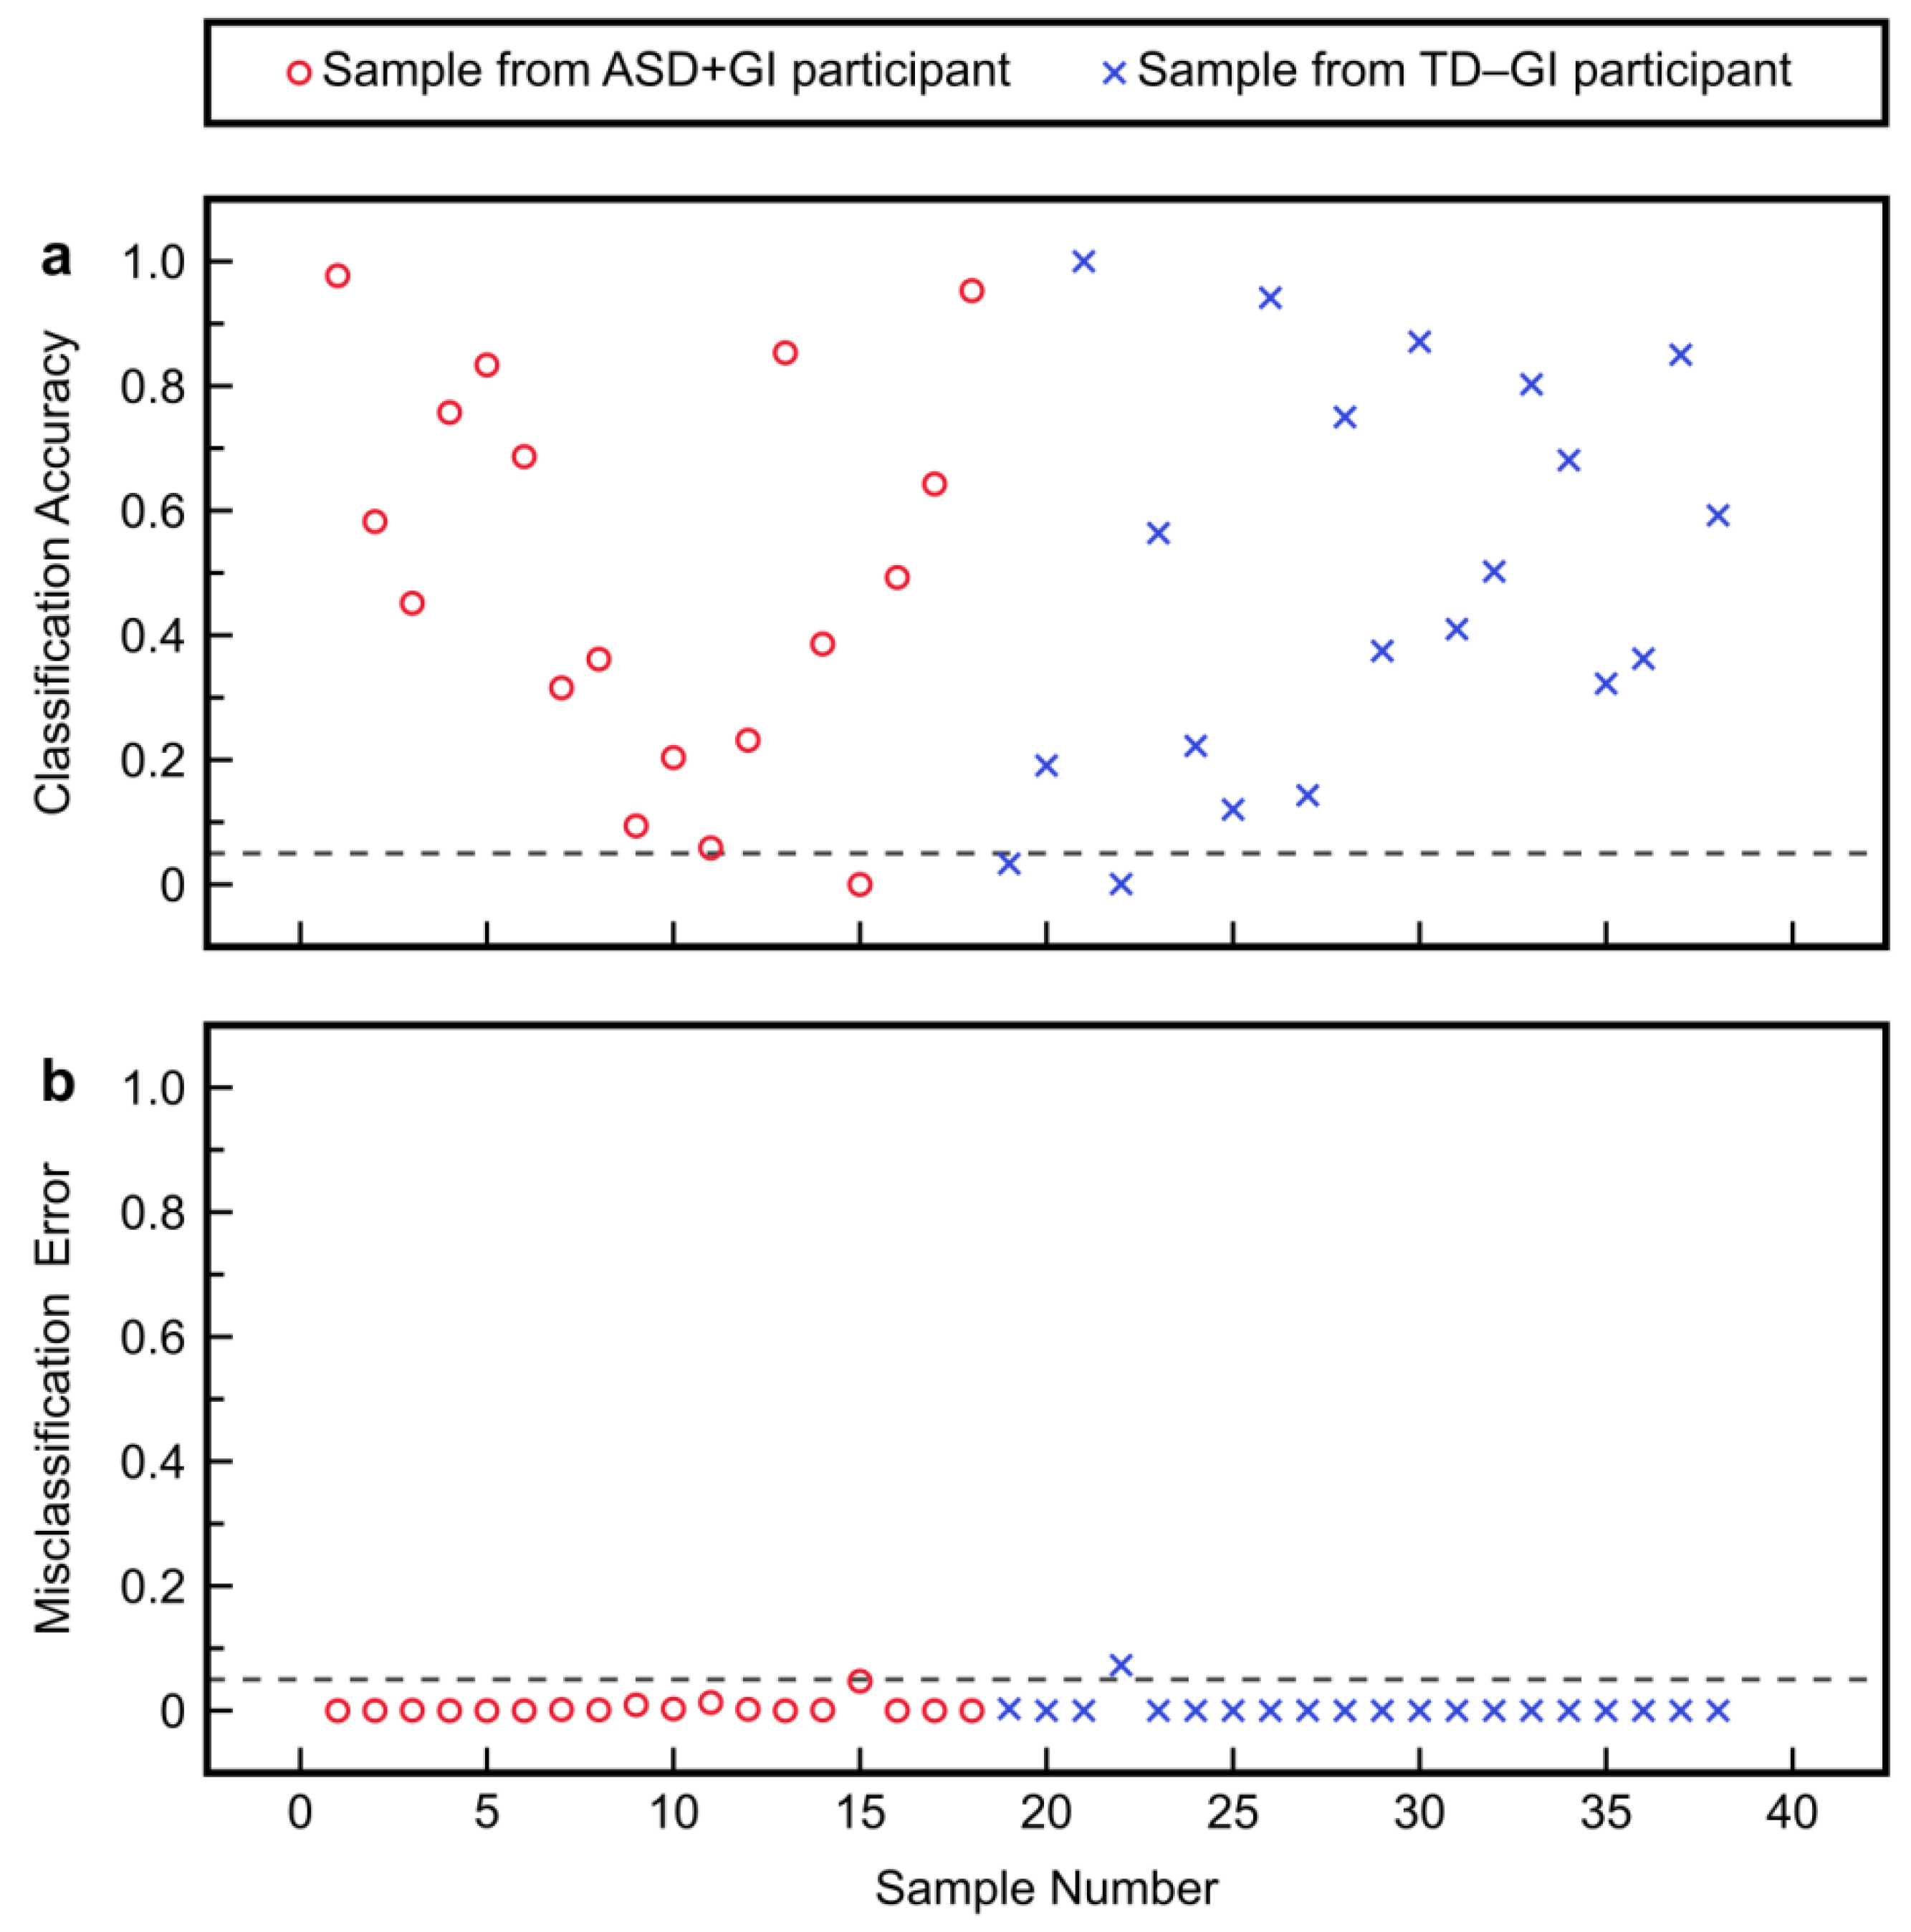
3.2.2. Model Fitting and Cross-Validation
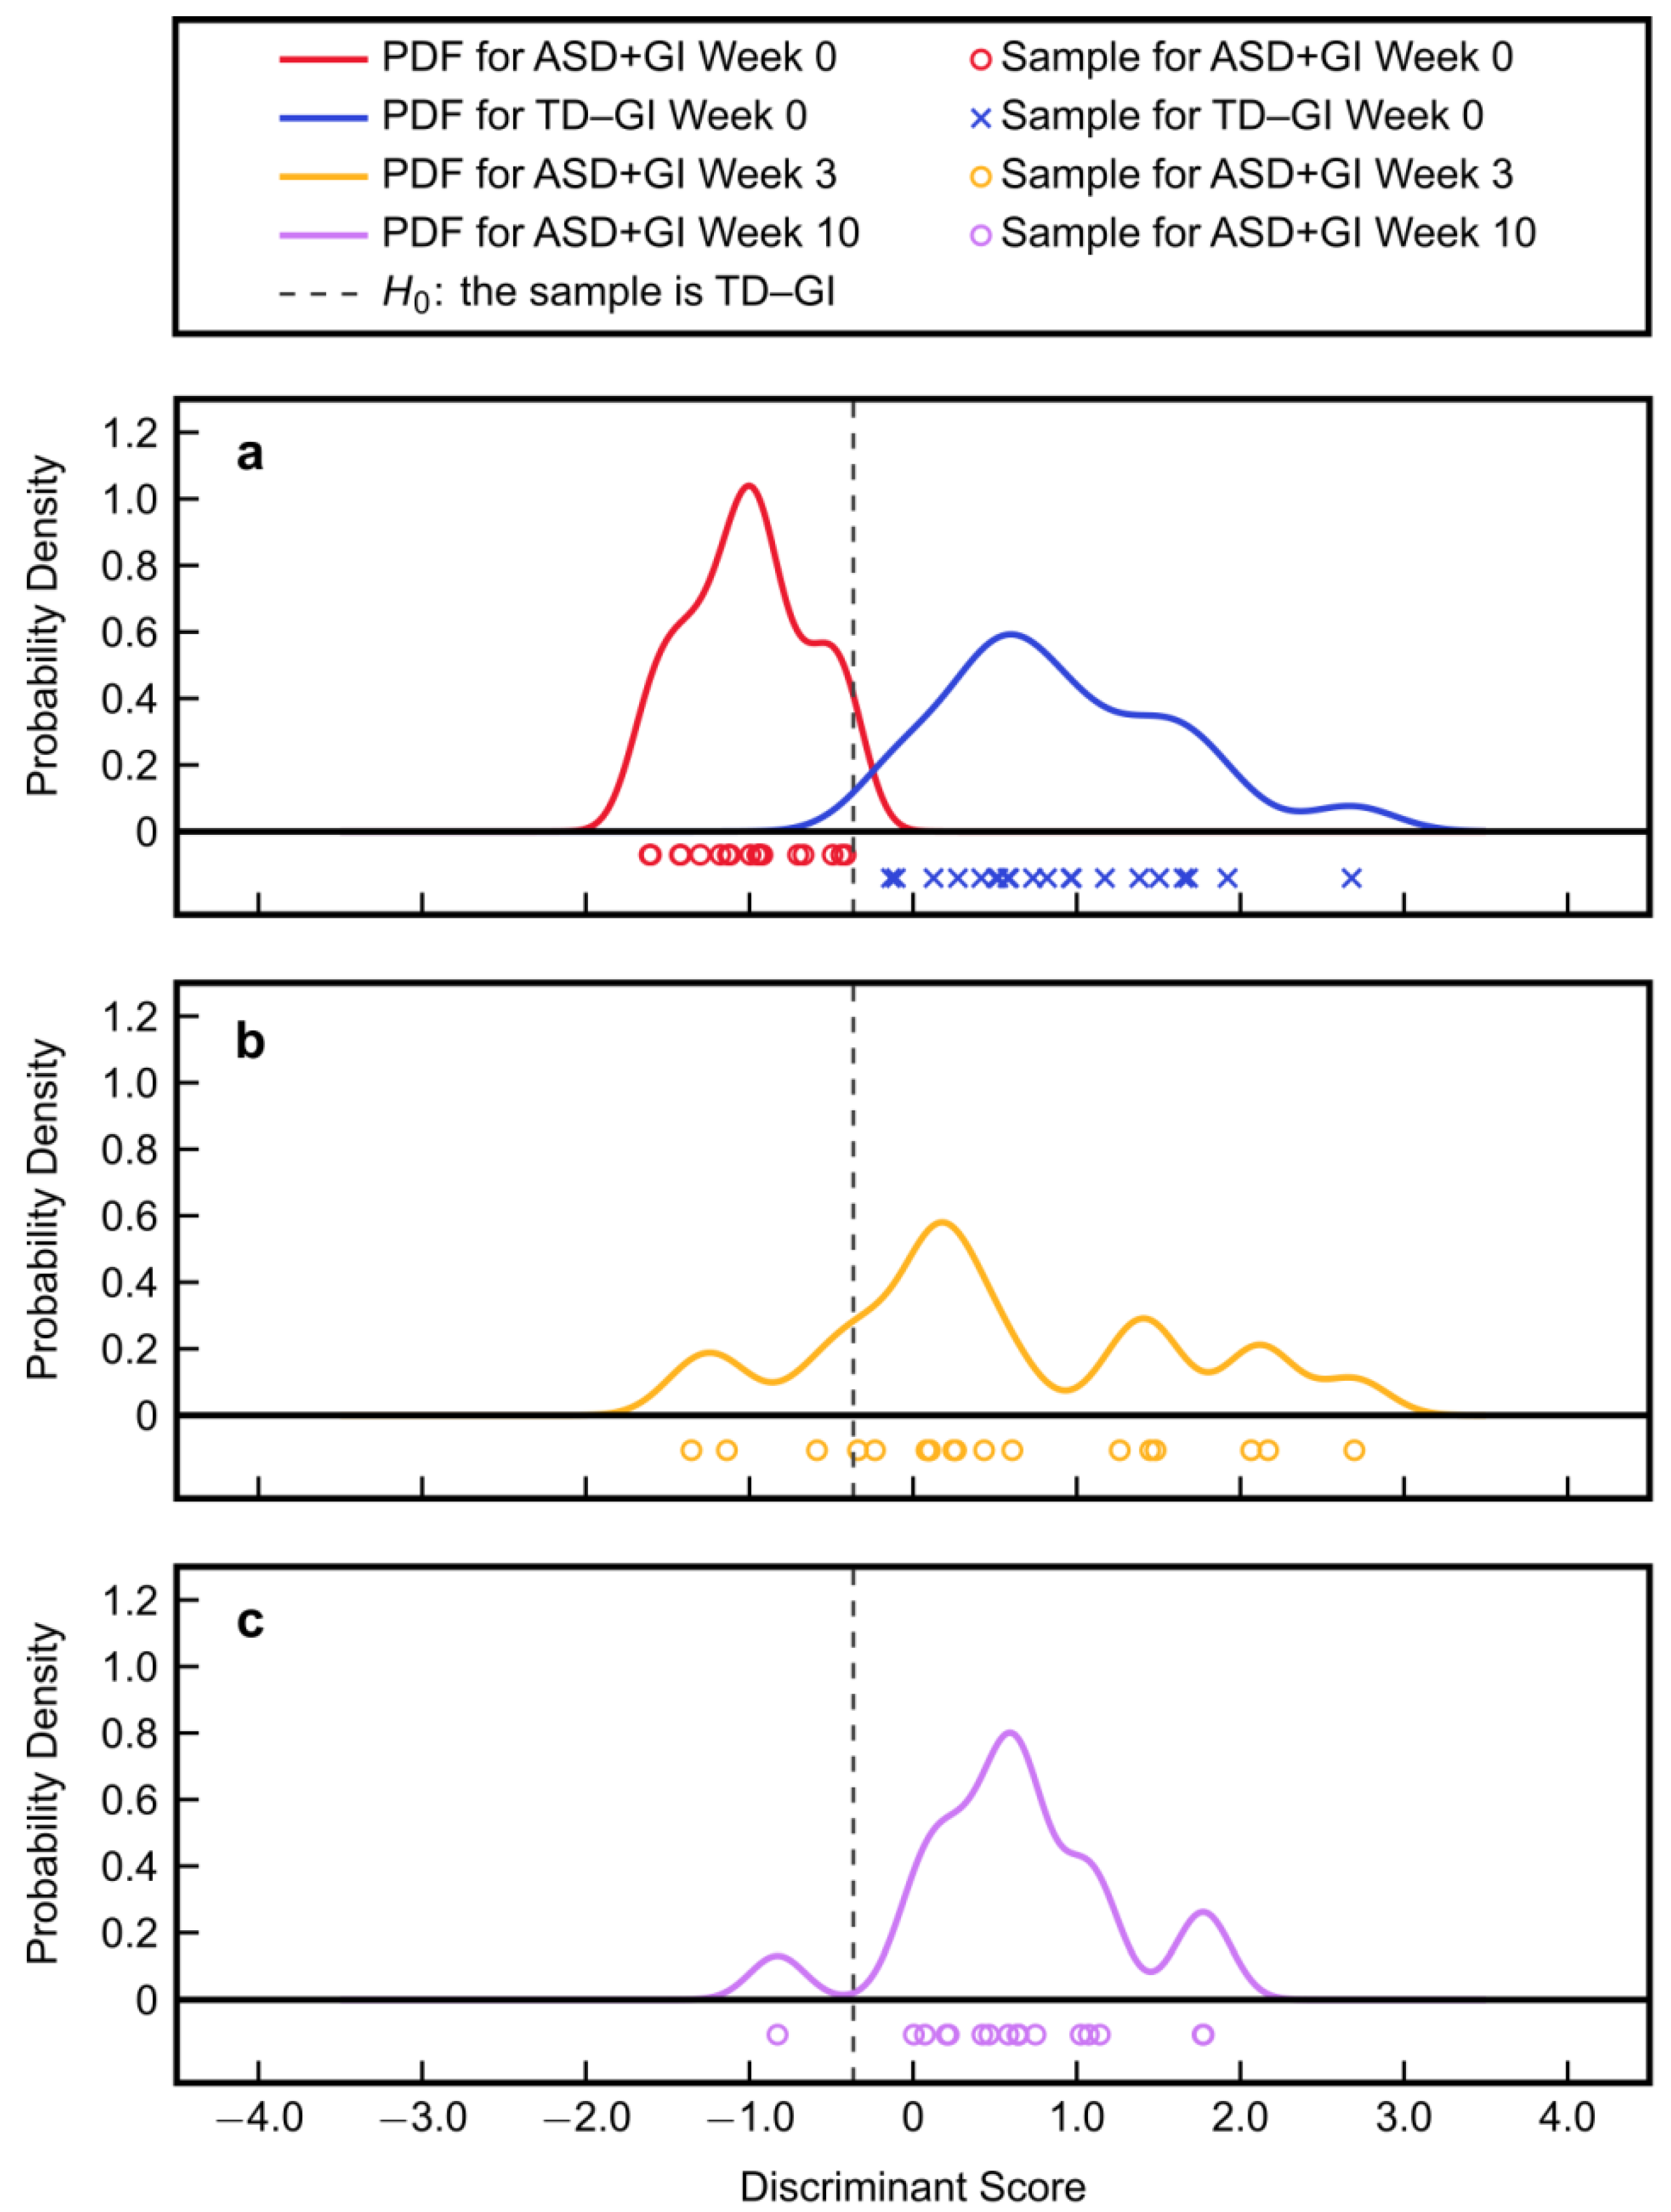
3.2.3. Model Application to MTT Time Points
4. Discussion
5. Conclusions
Author Contributions
Funding
Acknowledgments
Conflicts of Interest
References
- Baio, J.; Wiggins, L.; Christensen, D.L.; Maenner, M.J.; Daniels, J.; Warren, Z.; Kurzius-Spencer, M.; Zahorodny, W.; Robinson Rosenberg, C.; White, T.; et al. Prevalence of autism spectrum disorder among children aged 8 years-Autism and Developmental Disabilities Monitoring Network, 11 sites, United States, 2014. MMWR Surveill. Summ. 2018, 67, 1–23. [Google Scholar] [CrossRef] [PubMed]
- American Psychiatric Association. Diagnostic and Statistical Manual of Mental Disorders: DSM-V, 5th ed.; American Psychiatric Publishing: Washington, DC, USA, 2013; ISBN 978-0-89042-555-8. [Google Scholar]
- Gaugler, T.; Klei, L.; Sanders, S.J.; Bodea, C.A.; Goldberg, A.P.; Lee, A.B.; Mahajan, M.; Manaa, D.; Pawitan, Y.; Reichert, J.; et al. Most genetic risk for autism resides with common variation. Nat. Genet. 2014, 46, 881–885. [Google Scholar] [CrossRef] [PubMed]
- Mandy, W.; Lai, M.-C. Annual Research Review: The role of the environment in the developmental psychopathology of autism spectrum condition. J. Child Psychol. Psychiatry 2016, 57, 271–292. [Google Scholar] [CrossRef] [PubMed]
- Fein, D.; Barton, M.; Dumont-Mathieu, T. Optimizing outcome in autism spectrum disorders. Policy Insights Behav. Brain Sci. 2017, 4, 71–78. [Google Scholar] [CrossRef]
- Zwaigenbaum, L.; Bryson, S.E.; Brian, J.; Smith, I.M.; Roberts, W.; Szatmari, P.; Roncadin, C.; Garon, N.; Vaillancourt, T. Stability of diagnostic assessment for autism spectrum disorder between 18 and 36 months in a high-risk cohort. Autism Res. 2016, 9, 790–800. [Google Scholar] [CrossRef] [PubMed]
- McPartland, J.C. Considerations in biomarker development for neurodevelopmental disorders. Curr. Opin. Neurol. 2016, 29, 118–122. [Google Scholar] [CrossRef]
- Pierce, K.; Courchesne, E.; Bacon, E. To screen or not to screen universally for autism is not the question: Why the task force got it wrong. J. Pediatr. 2016, 176, 182–194. [Google Scholar] [CrossRef]
- Orinstein, A.J.; Helt, M.; Troyb, E.; Tyson, K.E.; Barton, M.L.; Eigsti, I.-M.; Naigles, L.; Fein, D.A. Intervention history of children and adolescents with high-functioning autism and optimal outcomes. J. Dev. Behav. Pediatr. 2014, 35, 247–256. [Google Scholar] [CrossRef]
- French, L.; Kennedy, E.M.M. Annual Research Review: Early intervention for infants and young children with, or at-risk of, autism spectrum disorder: A systematic review. J. Child Psychol. Psychiatry 2018, 59, 444–456. [Google Scholar] [CrossRef]
- Ryberg, K.H. Evidence for the implementation of the Early Start Denver Model for young children with autism spectrum disorder. J. Am. Psychiatr. Nurses Assoc. 2015, 21, 327–337. [Google Scholar] [CrossRef]
- Vargason, T.; Kruger, U.; Roth, E.; Delhey, L.M.; Tippett, M.; Rose, S.; Bennuri, S.C.; Slattery, J.C.; Melnyk, S.; James, S.J.; et al. Comparison of three clinical trial treatments for autism spectrum disorder through multivariate analysis of changes in metabolic profiles and adaptive behavior. Front. Cell. Neurosci. 2018, 12, 503. [Google Scholar] [CrossRef] [PubMed]
- Yang, D.; Pelphrey, K.A.; Sukhodolsky, D.G.; Crowley, M.J.; Dayan, E.; Dvornek, N.C.; Venkataraman, A.; Duncan, J.; Staib, L.; Ventola, P. Brain responses to biological motion predict treatment outcome in young children with autism. Transl. Psychiatry 2016, 6, e948. [Google Scholar] [CrossRef] [PubMed]
- Fletcher-Watson, S.; Hampton, S. The potential of eye-tracking as a sensitive measure of behavioural change in response to intervention. Sci. Rep. 2018, 8, 14715. [Google Scholar] [CrossRef] [PubMed]
- Murias, M.; Major, S.; Davlantis, K.; Franz, L.; Harris, A.; Rardin, B.; Sabatos-DeVito, M.; Dawson, G. Validation of eye-tracking measures of social attention as a potential biomarker for autism clinical trials. Autism Res. 2018, 11, 166–174. [Google Scholar] [CrossRef] [PubMed]
- Soke, G.N.; Maenner, M.J.; Christensen, D.; Kurzius-Spencer, M.; Schieve, L.A. Prevalence of co-occurring medical and behavioral conditions/symptoms among 4- and 8-year-old children with autism spectrum disorder in selected areas of the United States in 2010. J. Autism Dev. Disord. 2018, 48, 2663–2676. [Google Scholar] [CrossRef]
- Holingue, C.; Newill, C.; Lee, L.-C.; Pasricha, P.J.; Daniele Fallin, M. Gastrointestinal symptoms in autism spectrum disorder: A review of the literature on ascertainment and prevalence. Autism Res. 2018, 11, 24–36. [Google Scholar] [CrossRef]
- Vargason, T.; McGuinness, D.L.; Hahn, J. Gastrointestinal symptoms and oral antibiotic use in children with autism spectrum disorder: Retrospective analysis of a privately insured U.S. population. J. Autism Dev. Disord. 2019, 49, 647–659. [Google Scholar] [CrossRef]
- Adams, J.B.; Johansen, L.J.; Powell, L.D.; Quig, D.; Rubin, R.A. Gastrointestinal flora and gastrointestinal status in children with autism–comparisons to typical children and correlation with autism severity. BMC Gastroenterol. 2011, 11, 22. [Google Scholar] [CrossRef]
- Krajmalnik-Brown, R.; Lozupone, C.; Kang, D.-W.; Adams, J.B. Gut bacteria in children with autism spectrum disorders: Challenges and promise of studying how a complex community influences a complex disease. Microb. Ecol. Health Dis. 2015, 26, 26914. [Google Scholar] [CrossRef]
- Vuong, H.E.; Hsiao, E.Y. Emerging roles for the gut microbiome in autism spectrum disorder. Biol. Psychiatry 2017, 81, 411–423. [Google Scholar] [CrossRef]
- Frye, R.E.; Slattery, J.; MacFabe, D.F.; Allen-Vercoe, E.; Parker, W.; Rodakis, J.; Adams, J.B.; Krajmalnik-Brown, R.; Bolte, E.; Kahler, S.; et al. Approaches to studying and manipulating the enteric microbiome to improve autism symptoms. Microb. Ecol. Health Dis. 2015, 26, 26878. [Google Scholar] [CrossRef] [PubMed]
- Li, Q.; Zhou, J.-M. The microbiota–gut–brain axis and its potential therapeutic role in autism spectrum disorder. Neuroscience 2016, 324, 131–139. [Google Scholar] [CrossRef] [PubMed]
- Kang, D.-W.; Adams, J.B.; Gregory, A.C.; Borody, T.; Chittick, L.; Fasano, A.; Khoruts, A.; Geis, E.; Maldonado, J.; McDonough-Means, S.; et al. Microbiota Transfer Therapy alters gut ecosystem and improves gastrointestinal and autism symptoms: An open-label study. Microbiome 2017, 5, 10. [Google Scholar] [CrossRef] [PubMed]
- Hamilton, M.J.; Weingarden, A.R.; Sadowsky, M.J.; Khoruts, A. Standardized frozen preparation for transplantation of fecal microbiota for recurrent Clostridium difficile Infection. Am. J. Gastroenterol. 2012, 107, 761–767. [Google Scholar] [CrossRef]
- Revicki, D.A.; Wood, M.; Wiklund, I.; Crawley, J. Reliability and validity of the Gastrointestinal Symptom Rating Scale in patients with gastroesophageal reflux disease. Qual. Life Res. 1998, 7, 75–83. [Google Scholar] [CrossRef]
- Long, T.; Hicks, M.; Yu, H.-C.; Biggs, W.H.; Kirkness, E.F.; Menni, C.; Zierer, J.; Small, K.S.; Mangino, M.; Messier, H.; et al. Whole-genome sequencing identifies common-to-rare variants associated with human blood metabolites. Nat. Genet. 2017, 49, 568–578. [Google Scholar] [CrossRef]
- Fisher, R.A. The use of multiple measurements in taxonomic problems. Ann. Eugen. 1936, 7, 179–188. [Google Scholar] [CrossRef]
- Adams, J.B.; Howsmon, D.P.; Kruger, U.; Geis, E.; Gehn, E.; Fimbres, V.; Pollard, E.; Mitchell, J.; Ingram, J.; Hellmers, R.; et al. Significant association of urinary toxic metals and autism-related symptoms—A nonlinear statistical analysis with cross validation. PLoS ONE 2017, 12, e0169526. [Google Scholar] [CrossRef]
- Howsmon, D.P.; Vargason, T.; Rubin, R.A.; Delhey, L.; Tippett, M.; Rose, S.; Bennuri, S.C.; Slattery, J.C.; Melnyk, S.; James, S.J.; et al. Multivariate techniques enable a biochemical classification of children with autism spectrum disorder versus typically-developing peers: A comparison and validation study. Bioeng. Transl. Med. 2018, 3, 156–165. [Google Scholar] [CrossRef]
- Hicks, S.D.; Rajan, A.T.; Wagner, K.E.; Barns, S.; Carpenter, R.L.; Middleton, F.A. Validation of a salivary RNA test for childhood autism spectrum disorder. Front. Genet. 2018, 9, 534. [Google Scholar] [CrossRef]
- Banjanovic, E.S.; Osborne, J.W. Confidence intervals for effect sizes: Applying bootstrap resampling. Pract. Assess. Res. Eval. 2016, 21, 5. [Google Scholar]
- Kang, D.-W.; Krajmalnik-Brown, R.; Adams, J.B. Distinct fecal and plasma metabolites in children with autism spectrum disorder and their modulation after Microbiota Transfer Therapy. In preparation.
- Vargason, T.; Howsmon, D.P.; McGuinness, D.L.; Hahn, J. On the use of multivariate methods for analysis of data from biological networks. Processes 2017, 5, 36. [Google Scholar] [CrossRef] [PubMed]
- Sharon, G.; Cruz, N.J.; Kang, D.-W.; Gandal, M.J.; Wang, B.; Kim, Y.-M.; Zink, E.M.; Casey, C.P.; Taylor, B.C.; Lane, C.J.; et al. Human gut microbiota from autism spectrum disorder promote behavioral symptoms in mice. Cell 2019, 177, 1600–1618.e17. [Google Scholar] [CrossRef] [PubMed]
- Howsmon, D.P.; Kruger, U.; Melnyk, S.; James, S.J.; Hahn, J. Classification and adaptive behavior prediction of children with autism spectrum disorder based upon multivariate data analysis of markers of oxidative stress and DNA methylation. PLoS Comput. Biol. 2017, 13, e1005385. [Google Scholar] [CrossRef]
- Anwar, A.; Abruzzo, P.M.; Pasha, S.; Rajpoot, K.; Bolotta, A.; Ghezzo, A.; Marini, M.; Posar, A.; Visconti, P.; Thornalley, P.J.; et al. Advanced glycation endproducts, dityrosine and arginine transporter dysfunction in autism-a source of biomarkers for clinical diagnosis. Mol. Autism 2018, 9, 3. [Google Scholar] [CrossRef]
- Barone, R.; Alaimo, S.; Messina, M.; Pulvirenti, A.; Bastin, J.; Group, M.-A.; Ferro, A.; Frye, R.E.; Rizzo, R. A subset of patients with autism spectrum disorders show a distinctive metabolic profile by dried blood spot analyses. Front. Psychiatry 2018, 9, 636. [Google Scholar] [CrossRef]
- Mizejewski, G.J.; Lindau-Shepard, B.; Pass, K.A. Newborn screening for autism: In search of candidate biomarkers. Biomark. Med. 2013, 7, 247–260. [Google Scholar] [CrossRef]
- Momeni, N.; Bergquist, J.; Brudin, L.; Behnia, F.; Sivberg, B.; Joghataei, M.T.; Persson, B.L. A novel blood-based biomarker for detection of autism spectrum disorders. Transl. Psychiatry 2012, 2, e91. [Google Scholar] [CrossRef]
- Rangel-Huerta, O.D.; Gomez-Fernández, A.; de la Torre-Aguilar, M.J.; Gil, A.; Perez-Navero, J.L.; Flores-Rojas, K.; Martín-Borreguero, P.; Gil-Campos, M. Metabolic profiling in children with autism spectrum disorder with and without mental regression: Preliminary results from a cross-sectional case–control study. Metabolomics 2019, 15, 99. [Google Scholar] [CrossRef]
- Smith, A.M.; King, J.J.; West, P.R.; Ludwig, M.A.; Donley, E.L.R.; Burrier, R.E.; Amaral, D.G. Amino acid dysregulation metabotypes: Potential biomarkers for diagnosis and individualized treatment for subtypes of autism spectrum disorder. Biol. Psychiatry 2019, 85, 345–354. [Google Scholar] [CrossRef]
- Wang, H.; Liang, S.; Wang, M.; Gao, J.; Sun, C.; Wang, J.; Xia, W.; Wu, S.; Sumner, S.J.; Zhang, F.; et al. Potential serum biomarkers from a metabolomics study of autism. J. Psychiatry Neurosci. 2016, 41, 27–37. [Google Scholar] [CrossRef] [PubMed]
- West, P.R.; Amaral, D.G.; Bais, P.; Smith, A.M.; Egnash, L.A.; Ross, M.E.; Palmer, J.A.; Fontaine, B.R.; Conard, K.R.; Corbett, B.A.; et al. Metabolomics as a tool for discovery of biomarkers of autism spectrum disorder in the blood plasma of children. PLoS ONE 2014, 9, e112445. [Google Scholar] [CrossRef] [PubMed]
- Wiest, M.M.; German, J.B.; Harvey, D.J.; Watkins, S.M.; Hertz-Picciotto, I. Plasma fatty acid profiles in autism: A case-control study. Prostaglandins Leukot. Essent. Fat. Acids 2009, 80, 221–227. [Google Scholar] [CrossRef] [PubMed]
- Zou, M.; Sun, C.; Liang, S.; Sun, Y.; Li, D.; Li, L.; Fan, L.; Wu, L.; Xia, W. Fisher discriminant analysis for classification of autism spectrum disorders based on folate-related metabolism markers. J. Nutr. Biochem. 2019, 64, 25–31. [Google Scholar] [CrossRef] [PubMed]
- Ming, X.; Stein, T.P.; Barnes, V.; Rhodes, N.; Guo, L. Metabolic perturbance in autism spectrum disorders: A metabolomics study. J. Proteome Res. 2012, 11, 5856–5862. [Google Scholar] [CrossRef] [PubMed]
- Abu-Akel, A.; Bousman, C.; Skafidas, E.; Pantelis, C. Mind the prevalence rate: Overestimating the clinical utility of psychiatric diagnostic classifiers. Psychol. Med. 2018, 48, 1–3. [Google Scholar] [CrossRef] [PubMed]
- Ousley, O.; Cermak, T. Autism spectrum disorder: Defining dimensions and subgroups. Curr. Dev. Disord. Rep. 2014, 1, 20–28. [Google Scholar] [CrossRef]
- Sacco, R.; Lenti, C.; Saccani, M.; Curatolo, P.; Manzi, B.; Bravaccio, C.; Persico, A.M. Cluster analysis of autistic patients based on principal pathogenetic components. Autism Res. 2012, 5, 137–147. [Google Scholar] [CrossRef]


| Metabolite Rank | Metabolite | AUROC |
|---|---|---|
| 1 | nicotinamide riboside | 0.89 |
| 2 | inosine 5′-monophosphate (IMP) | 0.87 |
| 3 | iminodiacetate (IDA) | 0.85 |
| 4 | methylsuccinate | 0.85 |
| 5 | galactonate | 0.84 |
| 6 | sarcosine | 0.83 |
| 7 | caprylate (8:0) | 0.82 |
| 8 | leucylglycine | 0.82 |
| 9 | heptanoate (7:0) | 0.82 |
| 10 | valylglycine | 0.81 |
| 11 | 1-palmitoyl-GPI * (16:0) * | 0.79 |
| 12 | 3-phosphoglycerate | 0.79 |
| 13 | N6-acetyllysine | 0.78 |
| 14 | 1-stearoyl-GPS (18:0) * | 0.78 |
| 15 | caproate (6:0) | 0.77 |
| 16 | 1-arachidonoyl-GPI * (20:4) * | 0.77 |
| 17 | 1-(1-enyl-oleoyl)-GPE (P-18:1) * | 0.77 |
| 18 | azelate (nonanedioate; C9) | 0.76 |
| 19 | 2-aminophenol sulfate | 0.76 |
| 20 | glycerophosphoethanolamine | 0.76 |
| 21 | 1-methylimidazoleacetate | 0.76 |
| 22 | 2-methylserine | 0.76 |
| 23 | 10-undecenoate (11:1n1) | 0.76 |
| 24 | biliverdin | 0.76 |
| 25 | indolepropionate | 0.76 |
| 26 | citrate | 0.75 |
| 27 | 1-oleoyl-GPS (18:1) | 0.75 |
| 28 | bilirubin | 0.74 |
| 29 | tiglyl carnitine (C5) | 0.74 |
| 30 | picolinate | 0.74 |
| 31 | 5,6-dihydrothymine | 0.74 |
| 32 | 21-hydroxypregnenolone disulfate | 0.74 |
| 33 | 1-stearoyl-GPI (18:0) | 0.74 |
| 34 | propionylglycine (C3) | 0.73 |
| 35 | 2-hydroxystearate | 0.73 |
| 36 | cysteinylglycine | 0.73 |
| 37 | 3-methoxycatechol sulfate (1) | 0.73 |
| 38 | creatine | 0.72 |
| 39 | maltotetraose | 0.72 |
| 40 | 9,10-DiHOME | 0.72 |
| 41 | sphingomyelin (d18:2/23:0, d18:1/23:1, d17:1/24:1) * | 0.72 |
| 42 | cys-gly, oxidized | 0.72 |
| 43 | gamma-glutamylhistidine | 0.72 |
| 44 | S-1-pyrroline-5-carboxylate | 0.72 |
| 45 | fructose | 0.72 |
| 46 | 1-arachidonylglycerol (20:4) | 0.72 |
| 47 | hippurate | 0.72 |
| 48 | cinnamoylglycine | 0.72 |
| 49 | glutamate | 0.71 |
| 50 | tyramine O-sulfate | 0.71 |
| 51 | maleate | 0.71 |
| 52 | glycerophosphorylcholine (GPC) | 0.71 |
| 53 | sphingomyelin (d18:1/14:0, d16:1/16:0) * | 0.71 |
| 54 | arachidonate (20:4n6) | 0.71 |
| 55 | 1-linoleoyl-2-arachidonoyl-GPC (18:2/20:4n6) * | 0.71 |
| 56 | N6-methyladenosine | 0.70 |
| 57 | tartarate | 0.70 |
| 58 | laurate (12:0) | 0.70 |
| 59 | 2-oxindole-3-acetate | 0.70 |
| 60 | cytidine | 0.70 |
| 61 | hydantoin-5-propionic acid | 0.70 |
| Number of Metabolites | Metabolite Combination | Fitted AUROC | Cross-Validated Results | ||
|---|---|---|---|---|---|
| β | TPR | TNR | |||
| 2 | tyramine O-sulfateinosine 5′-monophosphate | 0.97 | 0.01 | 1.00 | 0.70 |
| 0.05 | 0.94 | 0.80 | |||
| 0.10 | 0.94 | 0.90 | |||
| 0.20 | 0.83 | 0.95 | |||
| 3 | sarcosinetyramine O-sulfateinosine 5′-monophosphate | 1.00 | 0.01 | 1.00 | 0.95 |
| 0.05 | 0.94 | 1.00 | |||
| 0.10 | 0.94 | 1.00 | |||
| 0.20 | 0.83 | 1.00 | |||
| 4 | sarcosine | 1.00 | 0.01 | 1.00 | 0.95 |
| tyramine O-sulfate | 0.05 | 1.00 | 1.00 | ||
| arachidonate (20:4n6) | 0.10 | 0.89 | 1.00 | ||
| inosine 5′-monophosphate | 0.20 | 0.83 | 1.00 | ||
| 5 | sarcosine | 1.00 | 0.01 | 1.00 | 1.00 |
| tyramine O-sulfate | 0.05 | 0.94 | 1.00 | ||
| 1-arachidonoyl-GPI * (20:4) * | 0.10 | 0.89 | 1.00 | ||
| sphingomyelin (d18:2/23:0, d18:1/23:1, d17:1/24:1) * | 0.20 | 0.78 | 1.00 | ||
| inosine 5′-monophosphate | |||||
| Metabolite | Correlation Coefficient | p-Value |
|---|---|---|
| sarcosine | ||
| iminodiacetate (IDA) | 0.96 | <0.001 |
| azelate (nonanedioate; C9) | −0.92 | <0.001 |
| 2-methylserine | 0.91 | <0.001 |
| caproate (6:0) | −0.89 | <0.001 |
| heptanoate (7:0) | −0.88 | <0.001 |
| caprylate (8:0) | −0.86 | <0.001 |
| methylsuccinate | 0.81 | <0.001 |
| nicotinamide riboside | 0.69 | <0.001 |
| N6-acetyllysine | −0.61 | <0.001 |
| N6-methyladenosine | −0.59 | <0.001 |
| tyramine O-sulfate | ||
| valylglycine | 0.54 | <0.001 |
| 1-(1-enyl-oleoyl)-GPE (P-18:1) * | −0.45 | 0.005 |
| 2-oxindole-3-acetate | 0.44 | 0.006 |
| leucylglycine | 0.43 | 0.007 |
| glutamate | −0.37 | 0.023 |
| fructose | −0.36 | 0.026 |
| 2-methylserine | 0.32 | 0.050 |
| caprylate (8:0) | −0.32 | 0.052 |
| 1-stearoyl-GPS (18:0) * | −0.31 | 0.062 |
| azelate (nonanedioate; C9) | −0.30 | 0.070 |
| inosine 5′-monophosphate | ||
| 3-phosphoglycerate | 0.81 | <0.001 |
| indolepropionate | 0.49 | 0.002 |
| nicotinamide riboside | 0.46 | 0.004 |
| leucylglycine | 0.44 | 0.005 |
| 10-undecenoate (11:1n1) | 0.43 | 0.007 |
| 1-linoleoyl-2-arachidonoyl-GPC (18:2/20:4n6) * | 0.41 | 0.010 |
| galactonate | 0.41 | 0.012 |
| 21-hydroxypregnenolone disulfate | −0.38 | 0.017 |
| S-1-pyrroline-5-carboxylate | 0.37 | 0.022 |
| sphingomyelin (d18:1/14:0, d16:1/16:0) * | 0.37 | 0.023 |
| PM3 metabolites | ||
| sarcosine × tyramine O-sulfate | 0.27 | 0.095 |
| sarcosine × inosine 5′-monophosphate | 0.24 | 0.146 |
| tyramine O-sulfate × inosine 5′-monophosphate | −0.00 | 0.985 |
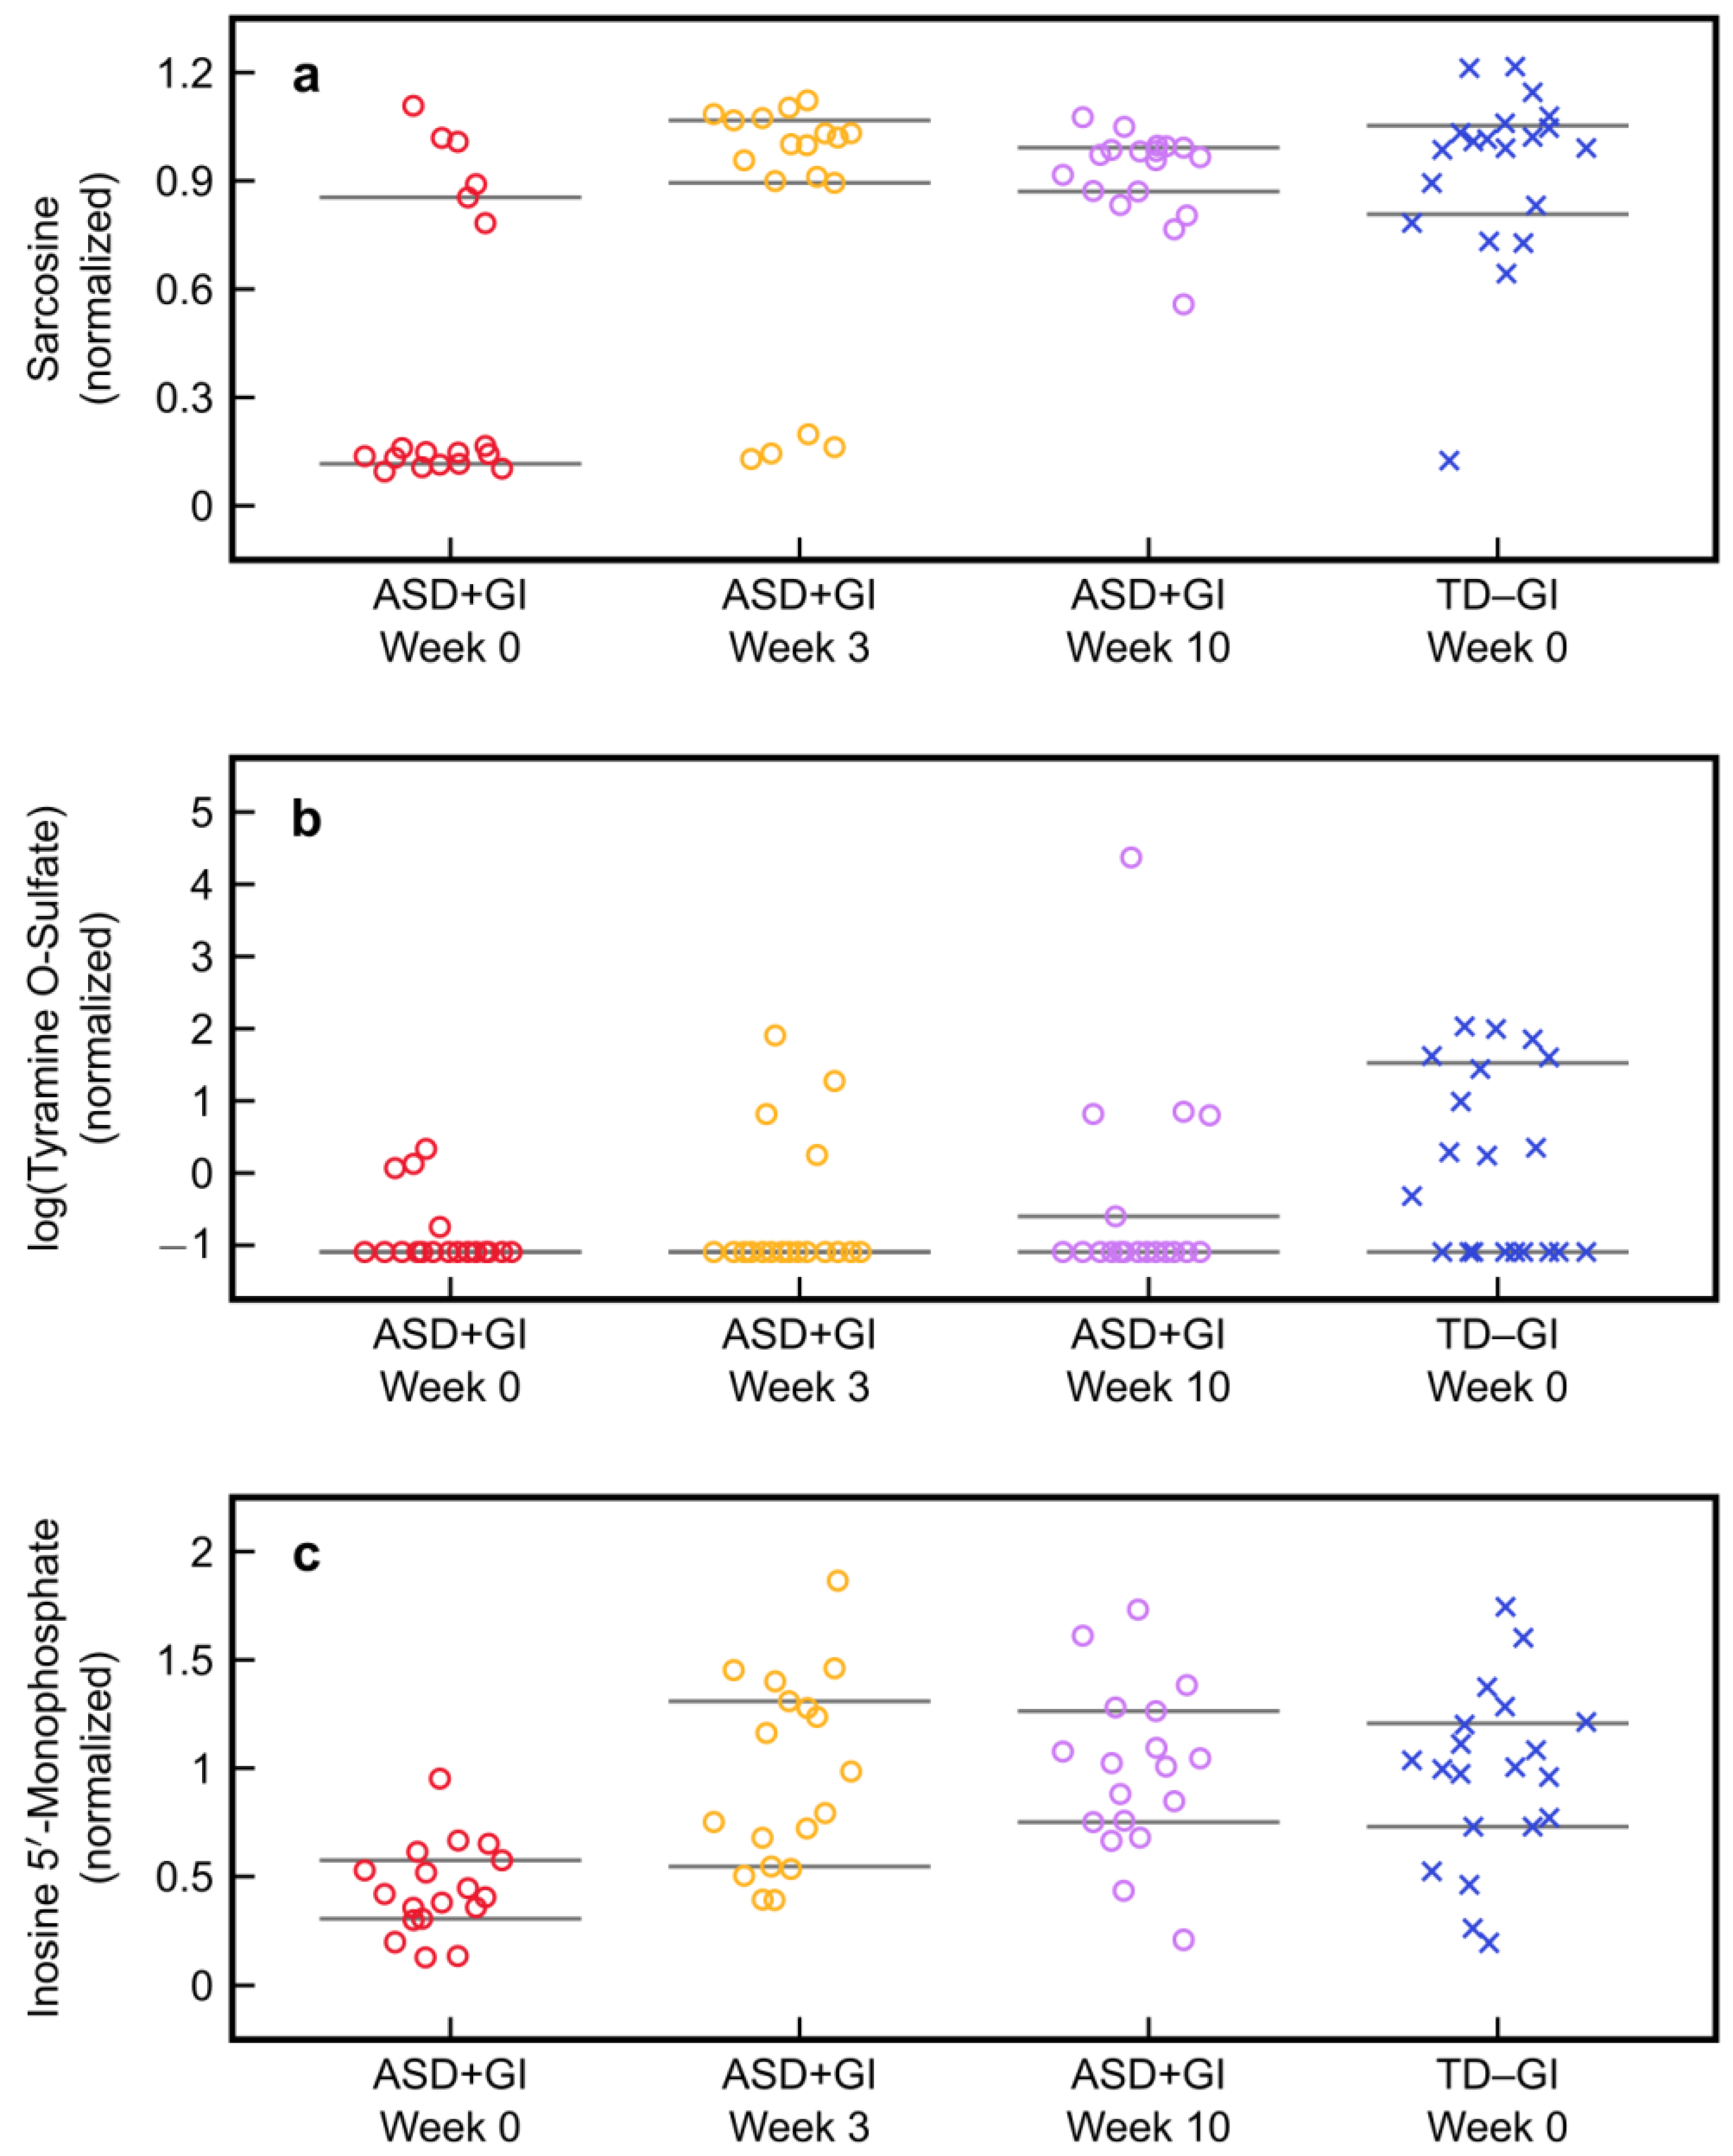
| Statistic | ASD + GI | ASD + GI | ASD + GI | TD − GI |
|---|---|---|---|---|
| Week 0 | Week 3 | Week 10 | Week 0 | |
| Sarcosine | 0.15 | 1 | 0.97 | 1 |
| (25th/75th percentile) | (0.12, 0.85) | (0.89, 1.07) | (0.87, 0.99) | (0.81, 1.05) |
| Tyramine O-sulfate | 0.34 | 0.34 | 0.34 | 1 |
| (25th/75th percentile) | (0.34, 0.34) | (0.34, 0.34) | (0.34, 0.55) | (0.34, 4.59) |
| Inosine 5′-monophosphate | 0.41 | 0.89 | 1.02 | 1 |
| (25th/75th percentile) | (0.30, 0.57) | (0.55, 1.31) | (0.75, 1.26) | (0.73, 1.21) |
| Median discriminant score | −0.97 | 0.25 | 0.64 | 0.78 |
| (25th/75th percentile) | (−1.30, −0.70) | (−0.23, 1.45) | (0.22, 1.07) | (0.46, 1.44) |
| Type II error | 5% | 80% | 94% | — |
| Effect size | — | 1.4 | 1.85 | — |
| (95% confidence interval) | (0.79, 2.05) | (1.45, 2.06) |
© 2019 by the authors. Licensee MDPI, Basel, Switzerland. This article is an open access article distributed under the terms and conditions of the Creative Commons Attribution (CC BY) license (http://creativecommons.org/licenses/by/4.0/).
Share and Cite
Adams, J.B.; Vargason, T.; Kang, D.-W.; Krajmalnik-Brown, R.; Hahn, J. Multivariate Analysis of Plasma Metabolites in Children with Autism Spectrum Disorder and Gastrointestinal Symptoms Before and After Microbiota Transfer Therapy. Processes 2019, 7, 806. https://doi.org/10.3390/pr7110806
Adams JB, Vargason T, Kang D-W, Krajmalnik-Brown R, Hahn J. Multivariate Analysis of Plasma Metabolites in Children with Autism Spectrum Disorder and Gastrointestinal Symptoms Before and After Microbiota Transfer Therapy. Processes. 2019; 7(11):806. https://doi.org/10.3390/pr7110806
Chicago/Turabian StyleAdams, James B., Troy Vargason, Dae-Wook Kang, Rosa Krajmalnik-Brown, and Juergen Hahn. 2019. "Multivariate Analysis of Plasma Metabolites in Children with Autism Spectrum Disorder and Gastrointestinal Symptoms Before and After Microbiota Transfer Therapy" Processes 7, no. 11: 806. https://doi.org/10.3390/pr7110806
APA StyleAdams, J. B., Vargason, T., Kang, D.-W., Krajmalnik-Brown, R., & Hahn, J. (2019). Multivariate Analysis of Plasma Metabolites in Children with Autism Spectrum Disorder and Gastrointestinal Symptoms Before and After Microbiota Transfer Therapy. Processes, 7(11), 806. https://doi.org/10.3390/pr7110806