1. Introduction
As the competition among supply chains becomes fiercer and more customers voiced their concerns regarding the firms’ operations, many people emphasize the importance of companies’ social responsibilities. Companies have to manage economic, environmental, and social issues while making profits [
1,
2]. They must pursue long-term business achievement rather than short-term financial performances; thus, sustainability should also be deliberated when assessing their operational performances. Sustainability subjects have been discussed usually in an environmental context, but in this study we use the terms corporate sustainability or financial sustainability referring to a firm’s ability to maintain its long-term operations.
In management, both in academics and practice, measuring the performance of processes has always been a major task, as it is necessary for monitoring whether companies operate successfully. If the measure of process performances is appropriate, we may be able to compare a firm’s present performance with its past or evaluate its competitiveness in the industry, eventually leading to strategic methods for improvement.
In general, some financial measures (e.g., sales, operating profit, and market value) or the measures commonly known as competitive priorities (e.g., cost, quality, delivery, and flexibility) have been used. Questions arise whether or not these are appropriate measures. What, then, can be an objective and publicly available index to properly measure the performance of manufacturing processes indicative of corporate sustainability?
Traditionally, manufacturing-related performance indicators provided information on productivity and included throughput, cost, and quality [
3]. Henao et al. [
4] reviewed 29 papers regarding lean manufacturing and categorized performances into four: Operational, environmental, social, and sustainable performances. Several indicators have also been proposed for sustainability performance measurement [
5]. In particular, OECD (Organization for Economic Cooperation and Development) has provided a so-called toolkit to assess the operations of sustainable manufacturing processes, and these indicators include water intensity, energy intensity, and renewable proportion of energy, among others [
6]. Sustainable operations tend to focus on environmental criteria in some existing literatures including [
7] those that evaluate the environmental sustainability performance based on energy and materials metrics.
Although environmental issues are critical in discussing sustainable manufacturing operations, obtaining objective information about the firms’ environmental performances and quantifying related indices are challenging tasks. Therefore, in this study, we used a performance indicator to evaluate the sustainable manufacturing processes besides environmental elements. Considering that the manufacturing processes produce items, we aimed to analyze an inventory-related measure, that is, inventory turnover ratios that can be obtained from public financial statements, because inventory is one of the most important factors in the manufacturing industry.
Relevant studies have proposed indicators including inventory-related variables. Among the 260 articles from 1969 to 2000 on manufacturing strategies, 14 articles focused on performance measurement [
8]. For example, Sakakibara et al. [
9] presented inventory turnover, cycle time, lead time, and on-time delivery rate as four quantitative variables measuring manufacturing performance. Meanwhile, Okudan and Akman [
10] computed, through analytic hierarchy process methodology, the weights of manufacturing performance in terms of cost, quality, delivery, and flexibility; moreover, they asserted that cost and quality gain higher weights than the others. Inventory was considered part of costs. Using data envelopment analysis, Leachman et al. [
11] suggested a composite performance index consisting of manufacturing expenditures as inputs and vehicle production volume and vehicle field performance as outputs. In their regression analysis, inventory turnover ratios were positively related to manufacturing performance significantly at 10% level.
Inventory has actually been a frequently used measure of manufacturing processes. For example, Danese and Bortolotti [
12] used the unit cost of manufacturing and inventory turnover to measure the efficiency of supply chain integration. Meanwhile, Han et al. [
13] used inventory supply and financial performance as dependent variables in their econometric models to examine the effect of emerging market penetration. Moreover, Klingenberg et al. [
14] considered some financial ratios that included inventory in the calculation to study the impact of just-in-time practices, namely, inventory to current assets, inventory turnover, and comparison between current ratio and quick ratio.
In this research, we analyzed inventory turnover as a performance measure of the manufacturing industry. First of all, inventory turnover is critical in the manufacturing industry because it can tell how fast the products are moving out of the factory. Higher inventory turnover indicates less cash being tied up in slow-moving products that are not being sold. In addition, inventory turnover measures are objective and publicly available from companies’ financial statements. It is also a signal of how efficiently products are moving along the manufacturing supply chain. Determining the speed of sales can be a useful benchmark for evaluating firms’ competitiveness. Inventory turnover has been used as one of the performance measures of operations in past studies [
15,
16,
17,
18,
19].
Inventory turnover is generally known to be an effective indicator of operational efficiency; however, Gaur et al. [
18] suggested the use of a new empirical measure—adjusted inventory turnover—for performance comparison across years or across firms, by controlling some variables affecting inventory turnover ratios of companies. They observed that gross margin, capital intensity, and sales surprise were the factors influencing the firms’ inventory turnover ratios in the retail industry. In subsequent work, Gaur and Kesavan [
19] found that company size and sales growth rate also affected inventory turnover ratios of retail companies. Moreover, Han et al. [
13] considered gross margin, capital intensity, firm size, debt cost, and demand uncertainty as control variables for inventory supply in the manufacturing industry.
Using financial data of Korean manufacturing companies from 2010 to 2018, first, we explored control variables of inventory turnover for each manufacturing segment. Then we investigated its relationship with other performance measures to verify the universal use of inventory turnover. Finally, the inventory turnover and adjusted inventory turnover measures were compared between the top and bottom companies, classified according to Altman’s Z scores.
The remainder of this paper is structured as follows.
Section 2 describes the data used in this study.
Section 3 presents the extensive analysis of inventory turnover as a performance measure of the manufacturing industry.
Section 4 discusses the main findings of this research and provides concluding remarks.
3. Analysis of Inventory Turnover Measures
In this section, we analyzed the inventory turnover ratios as a performance measure of the manufacturing industry. Using the data of manufacturing segments from TS2000, we first conducted a regression analysis to determine the factors affecting inventory turnover ratios. While controlling these variables, we investigated the correlations between inventory turnover measures and other financial ratios. Finally, we compared the adjusted inventory turnover measures between the top and bottom companies in terms of financial sustainability.
3.1. Regression Analysis
We analyzed an econometric model with three independent variables, namely, gross margin, capital intensity, and debt cost, and a dependent variable, namely, inventory turnover. The three variables were chosen after conducting numerous regression implementations with several combinations of variable candidates. The independent variables for our model are defined as follows:
Similar to Gaur et al. [
18] who recognized the log-linear relationship between control variables and inventory turnover, we also found that log-linear regression better suited our model than the linear regression. The following model was used for the analysis:
where IT stands for inventory turnover with subscripts for firm
i, segment
s, and time (year)
t.
The regression results are summarized in
Table 3. In aggregate, all three measures—gross margin, capital intensity, and debt cost—affected inventory turnover ratios in the manufacturing industry. However, differences existed among segments.
Aggregate-level results were consistent with existing literatures [
13,
18,
19]. Inventory turnover ratios in the manufacturing industry were negatively correlated with gross margin and debt cost, but positively correlated with capital intensity.
Following Gaur et al. [
18], to control the impact of control variables on inventory turnover ratios, we may use the adjusted measures. For example, adjusted inventory turnover for the food and beverage manufacturing segment can be computed as
We can avoid under- or over-estimating inventory turnover ratios by using adjusted inventory turnover (AIT) measures when we evaluate the inventory performance across firms or years.
3.2. Relationship with Other Performance Indices
The database TS2000 provided some financial ratios as performance indicators. By conducting numerous regression analysis, we searched for the relationship between inventory turnover and other performance indices provided by the database, in which the financial ratios were categorized by growth, profitability, stability, activity, productivity, and value of companies.
We chose one or two measures for each category of financial ratios as in
Table 4. These measures were selected because they showed relatively more significant (but not significant in absolute terms) correlations with inventory turnover among candidates for each category. A correlation analysis between each measure and the adjusted inventory turnover that controls the variables was conducted based on the results in
Section 3.1.
Sales growth rate show how much sales have increased and is an indicator of a firm’s growth. Cash flow per share is the sum of net profit and depreciation divided by the total number of shares. It measures the profitability of a company along with the measure of operating profit per share. Meanwhile, cash ratio is the ratio of cash deposit to current liabilities, and debt ratio is the ratio of total liabilities to gross capital. Both ratios are indicators of a firm’s stability. A higher cash ratio or a lower debt ratio indicates better financial stability of a company.
Table 5 shows the results of the correlation analysis for the aforementioned measures. We observed that the results vary by each segment and that the correlation between adjusted inventory turnover and these ratios was mostly not significant. Although, for some segments, the low-level correlation existed. For example, the textile and clothing segment showed positive correlation between inventory turnover and operating profit per share, probably because short shelf life of clothing directly affects profitability.
Turnover ratio of total liabilities and net worth is computed as sales divided by gross capital. It indicates how efficiently a company operates with its capital, which is called an activity ratio. Moreover, labor cost per worker and productivity of capital are the indicators of a firm’s productivity. In particular, the productivity of capital is measured by the ratio of gross value-added to total assets. For the measures regarding the value of a company, EV (enterprise value) and EBITDA (earnings before interest, taxes, depreciation, and amortization) are used.
Table 6 shows the results of the correlation analysis with the measures. For most manufacturing segments, inventory turnover was positively correlated with the turnover ratio of total liabilities and net worth. Besides the activity ratio, the results varied by segments and did not show significant relationships with inventory turnover in most cases. For a few significant results, the correlations were weak.
3.3. Comparison between the Top and Bottom Companies
We compared inventory turnover performances between the top and bottom companies in each manufacturing segment. The top and bottom companies were determined by Altman’s Z score approach that was first introduced in [
21]. For every company, Z scores were computed according to the following formula.
Altman’s Z score is known to predict bankruptcy of companies usually within 2 years [
21]. The score may not represent an absolute measure of firms’ performance, but it can serve as a good indicator for corporate sustainability. It has been used in business research for ranking companies (e.g., [
22]).
For each manufacturing segment, we chose the top 10% and bottom 10% of companies in terms of average Z scores over the 9 years.
Table 7 provides the average values of IT, AIT, and Z score for top and bottom companies in each segment.
Overall, the AIT seemed more suitable for comparison than IT measures, assuming that top companies showed better inventory performance than bottom companies. Particularly for an oil and chemical manufacturing and nonmetallic mineral manufacturing segments, the bottom 10% companies showed higher IT but lower AIT than the top 10% companies. As these segments show relatively high capital intensity, the measure adjusting for this effect seemed to better explain their inventory performance.
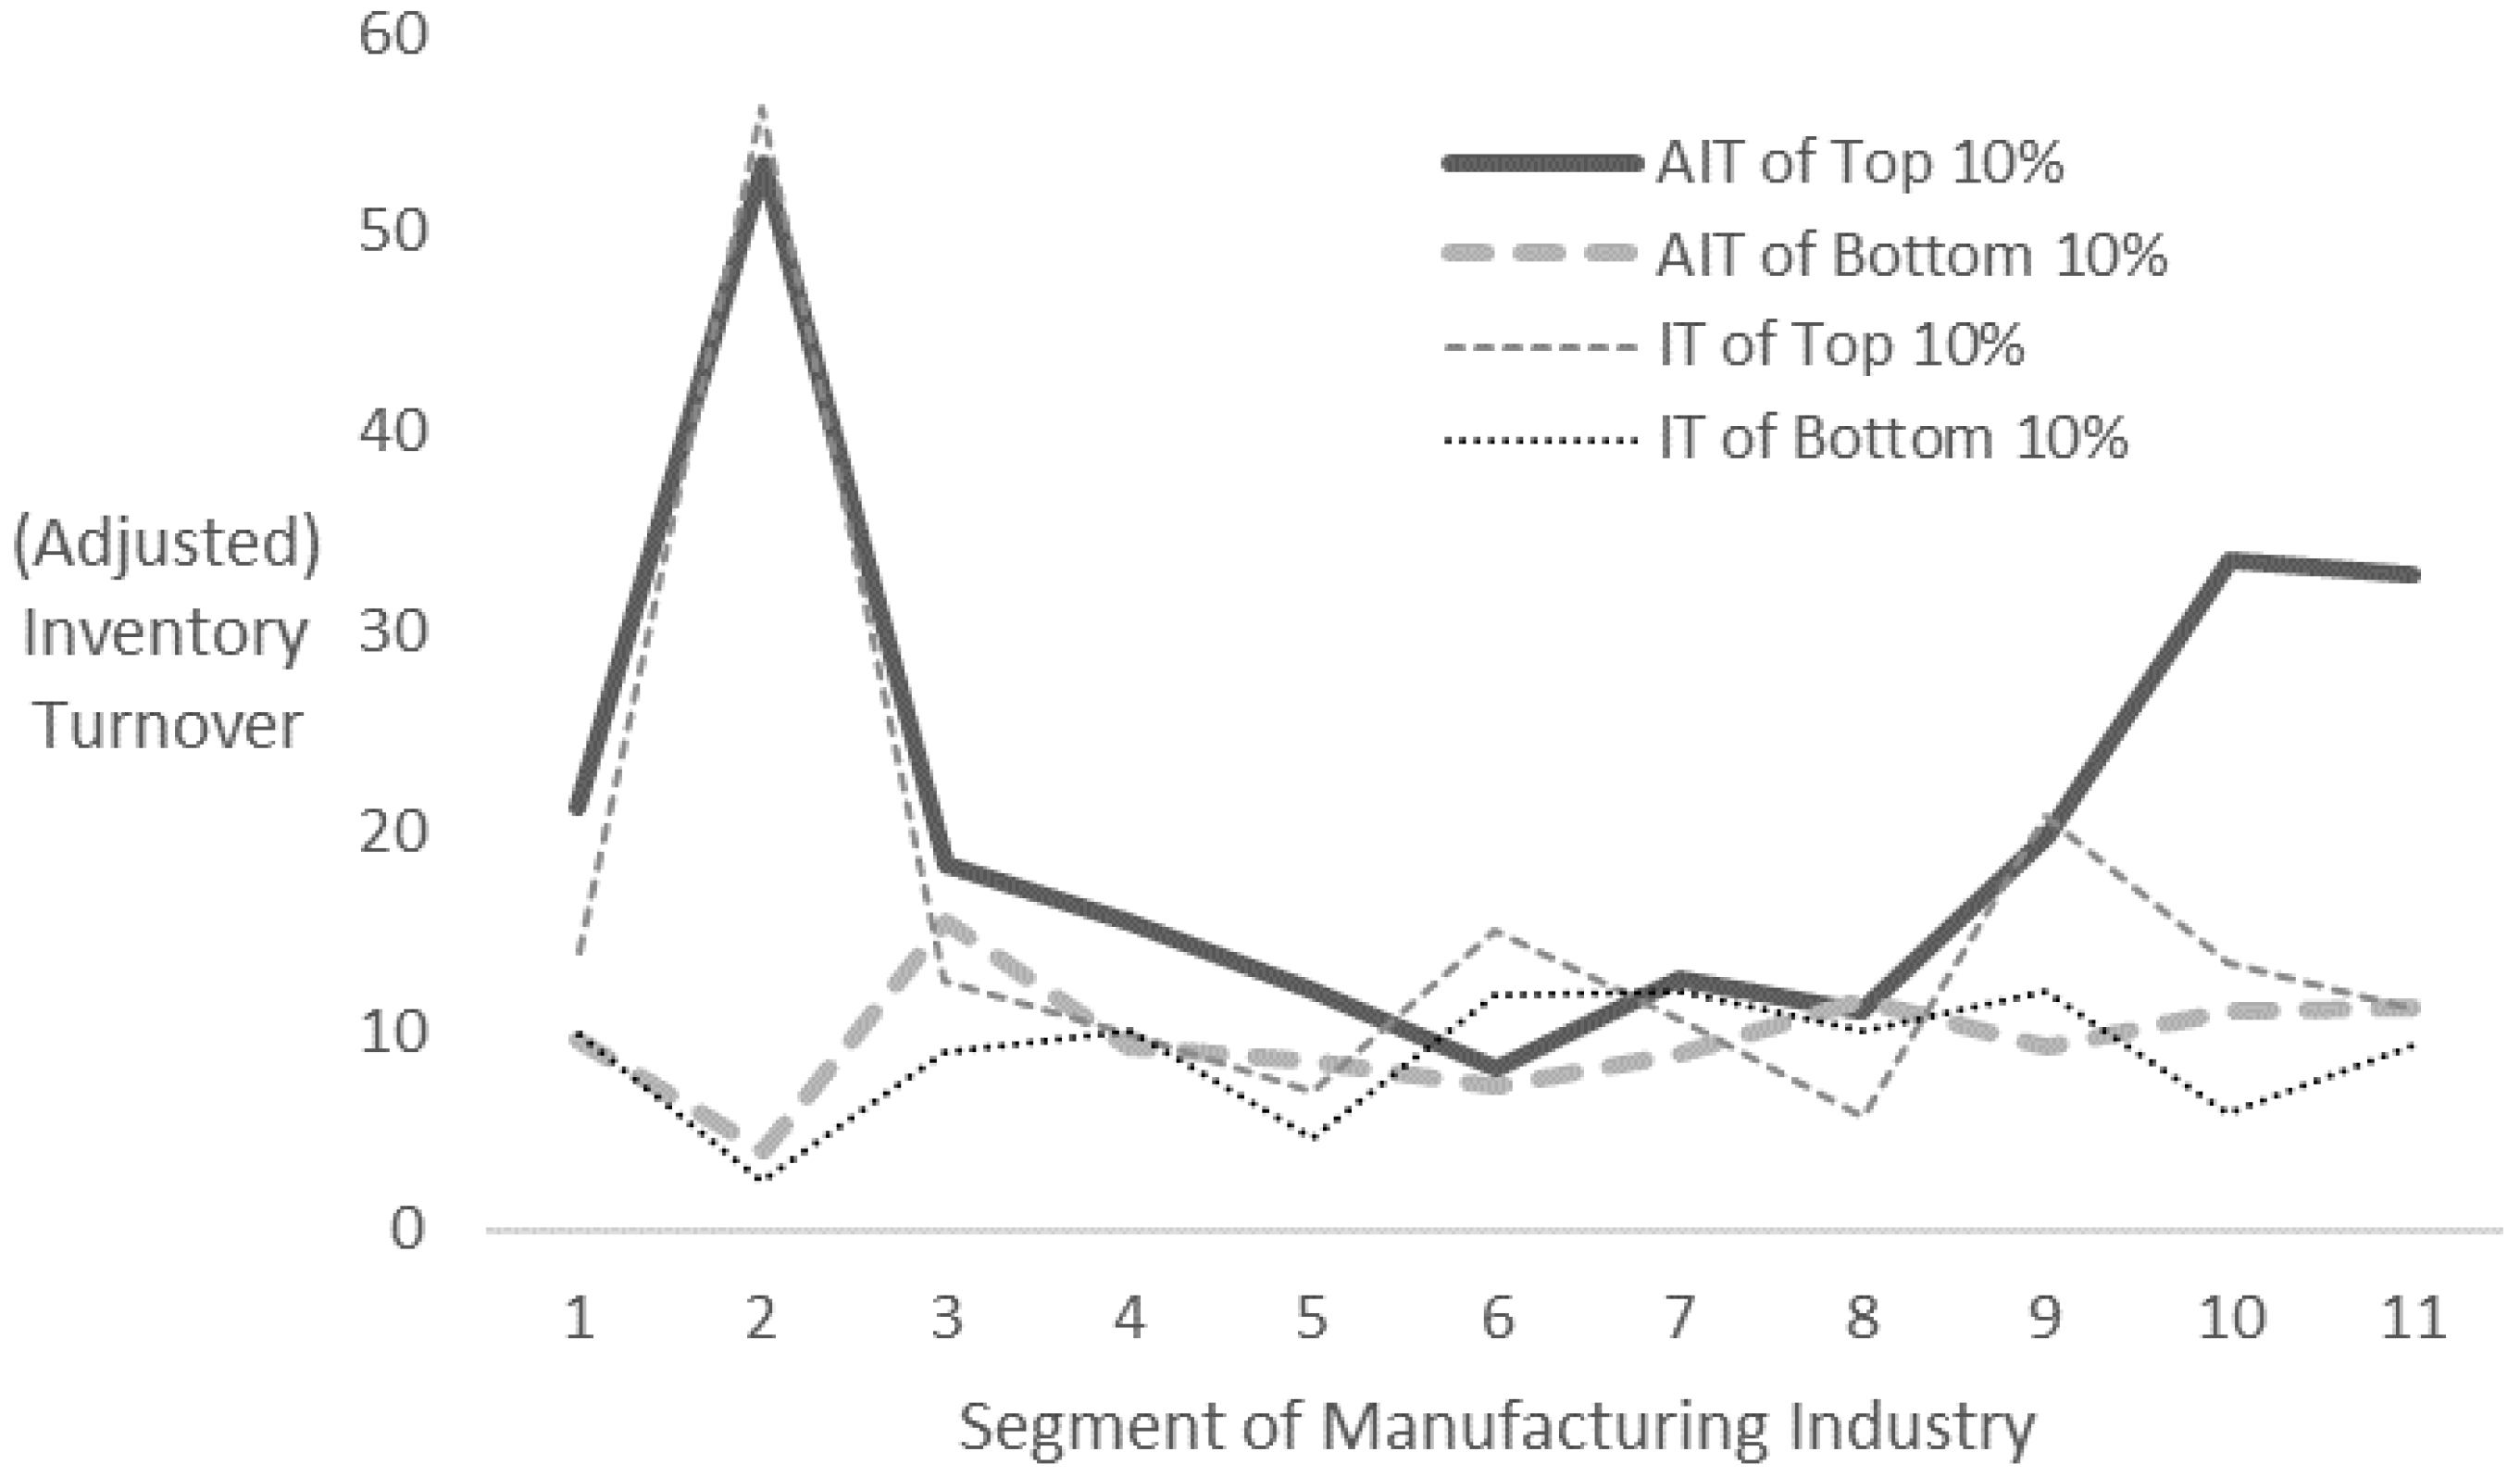
Figure 1 illustrates the AIT and IT of top and bottom companies categorized by Z scores. Clearly, the top 10% companies showed higher AIT than the bottom ones in almost all segments in the manufacturing industry. Controlled inventory performance seemed closely related to financial performances, especially for corporate sustainability.
The performance gap in AIT differed across segments. The segments of the textile and clothing manufacturing, machine and equipment manufacturing, and the vehicle manufacturing displayed relatively higher differences among the top and bottom companies. Textile and clothing products are fashion items that should be sold relatively faster from the shelves; that is, higher inventory turnover ratios are desirable. For machine, equipment, and vehicles, the stocks usually should not stay too long in factories. Moreover, for manufacturing segments in which inventory is more critical than others, the differences in AIT were observed to be greater.
4. Discussion and Conclusions
We analyzed inventory turnover ratios as a performance measure related to inventory, which is important in manufacturing processes. Inventory turnover ratios are objective and publicly available, as well as indicative of operational efficiency. However, in this study, we found that inventory turnover measures alone may not explain other types of a firm’s performance such as growth, profitability, stability, productivity, and value of companies. Controlled measures of inventory turnover in this study did not show significant correlations with these measures of financial ratios. Inventory turnover has a relatively significant relationship with turnover ratio of total liabilities and net worth, but they are both activity ratios. Therefore, we need to define a composite metric to evaluate the performance of the manufacturing industry.
Although inventory turnover ratios alone may be insufficient to assess the performance of the manufacturing industry, they can be good measures for corporate sustainability. Specifically, the top 10% companies ranked by the criteria for financial sustainability showed higher inventory performance than the bottom 10% companies. The inventory performance used for comparison was the AIT ratios by segment, which control the variables affecting inventory turnover ratios such as gross margin, capital intensity, or debt cost. Similar to Gaur et al. [
18] for the retail industry, the inventory turnover in the manufacturing industry also was negatively related to gross margin and positively related to capital intensity in an aggregate level.
Some existing studies including [
18] analyzed inventory turnover ratios as a performance measure, but they were mostly for the retail industry or for verifying the effect of certain operational practices. To our knowledge, this is the first study to analyze the inventory turnover ratios from the public data as a performance measure of the manufacturing industry, especially in terms of financial sustainability. Using the data of Korean manufacturing companies, we found that the results varied by each segment in the manufacturing industry. For example, unlike aggregate-level regression results, inventory turnover in the pharmaceutical manufacturing segment showed a positive correlation with gross margin and with debt cost. The fact that pharmaceutical manufacturing is mostly under governmental regulations might affect the relationship between variables. The finding of this study contributes to the literature in that it suggests considering detailed segments when analyzing the performance of the manufacturing industry. The inventory turnover measures may need to be adjusted separately for each manufacturing segment.
As the characteristics of industry segments affect the inventory performance, the analysis of this study may be limited to Korean data. However, financial data, including inventory turnover ratios, are publicly available for many countries; thus, analyzing the inventory performance in any country will not be difficult as we have demonstrated in this study with the Korean data. Future study may analyze the similarities or differences across countries. In addition, the firm-specific effect may be controlled in a future study. Another limitation is that inventory turnover ratios may be affected by other factors not mentioned in this study, such as high margin on the sale of inventory, returned products to suppliers, inventory accounting, and seasonality of products. These can be considered in prospect research.
To search for a composite measure to evaluate manufacturing processes can be a subject that is worth studying in the future as well. The approach of this study can be a starting point with business insight into performance measures of the manufacturing industry for corporate sustainability.

