Numerical and Experimental Study of a Vortex Structure and Energy Loss in a Novel Self-Priming Pump


Abstract
1. Introduction
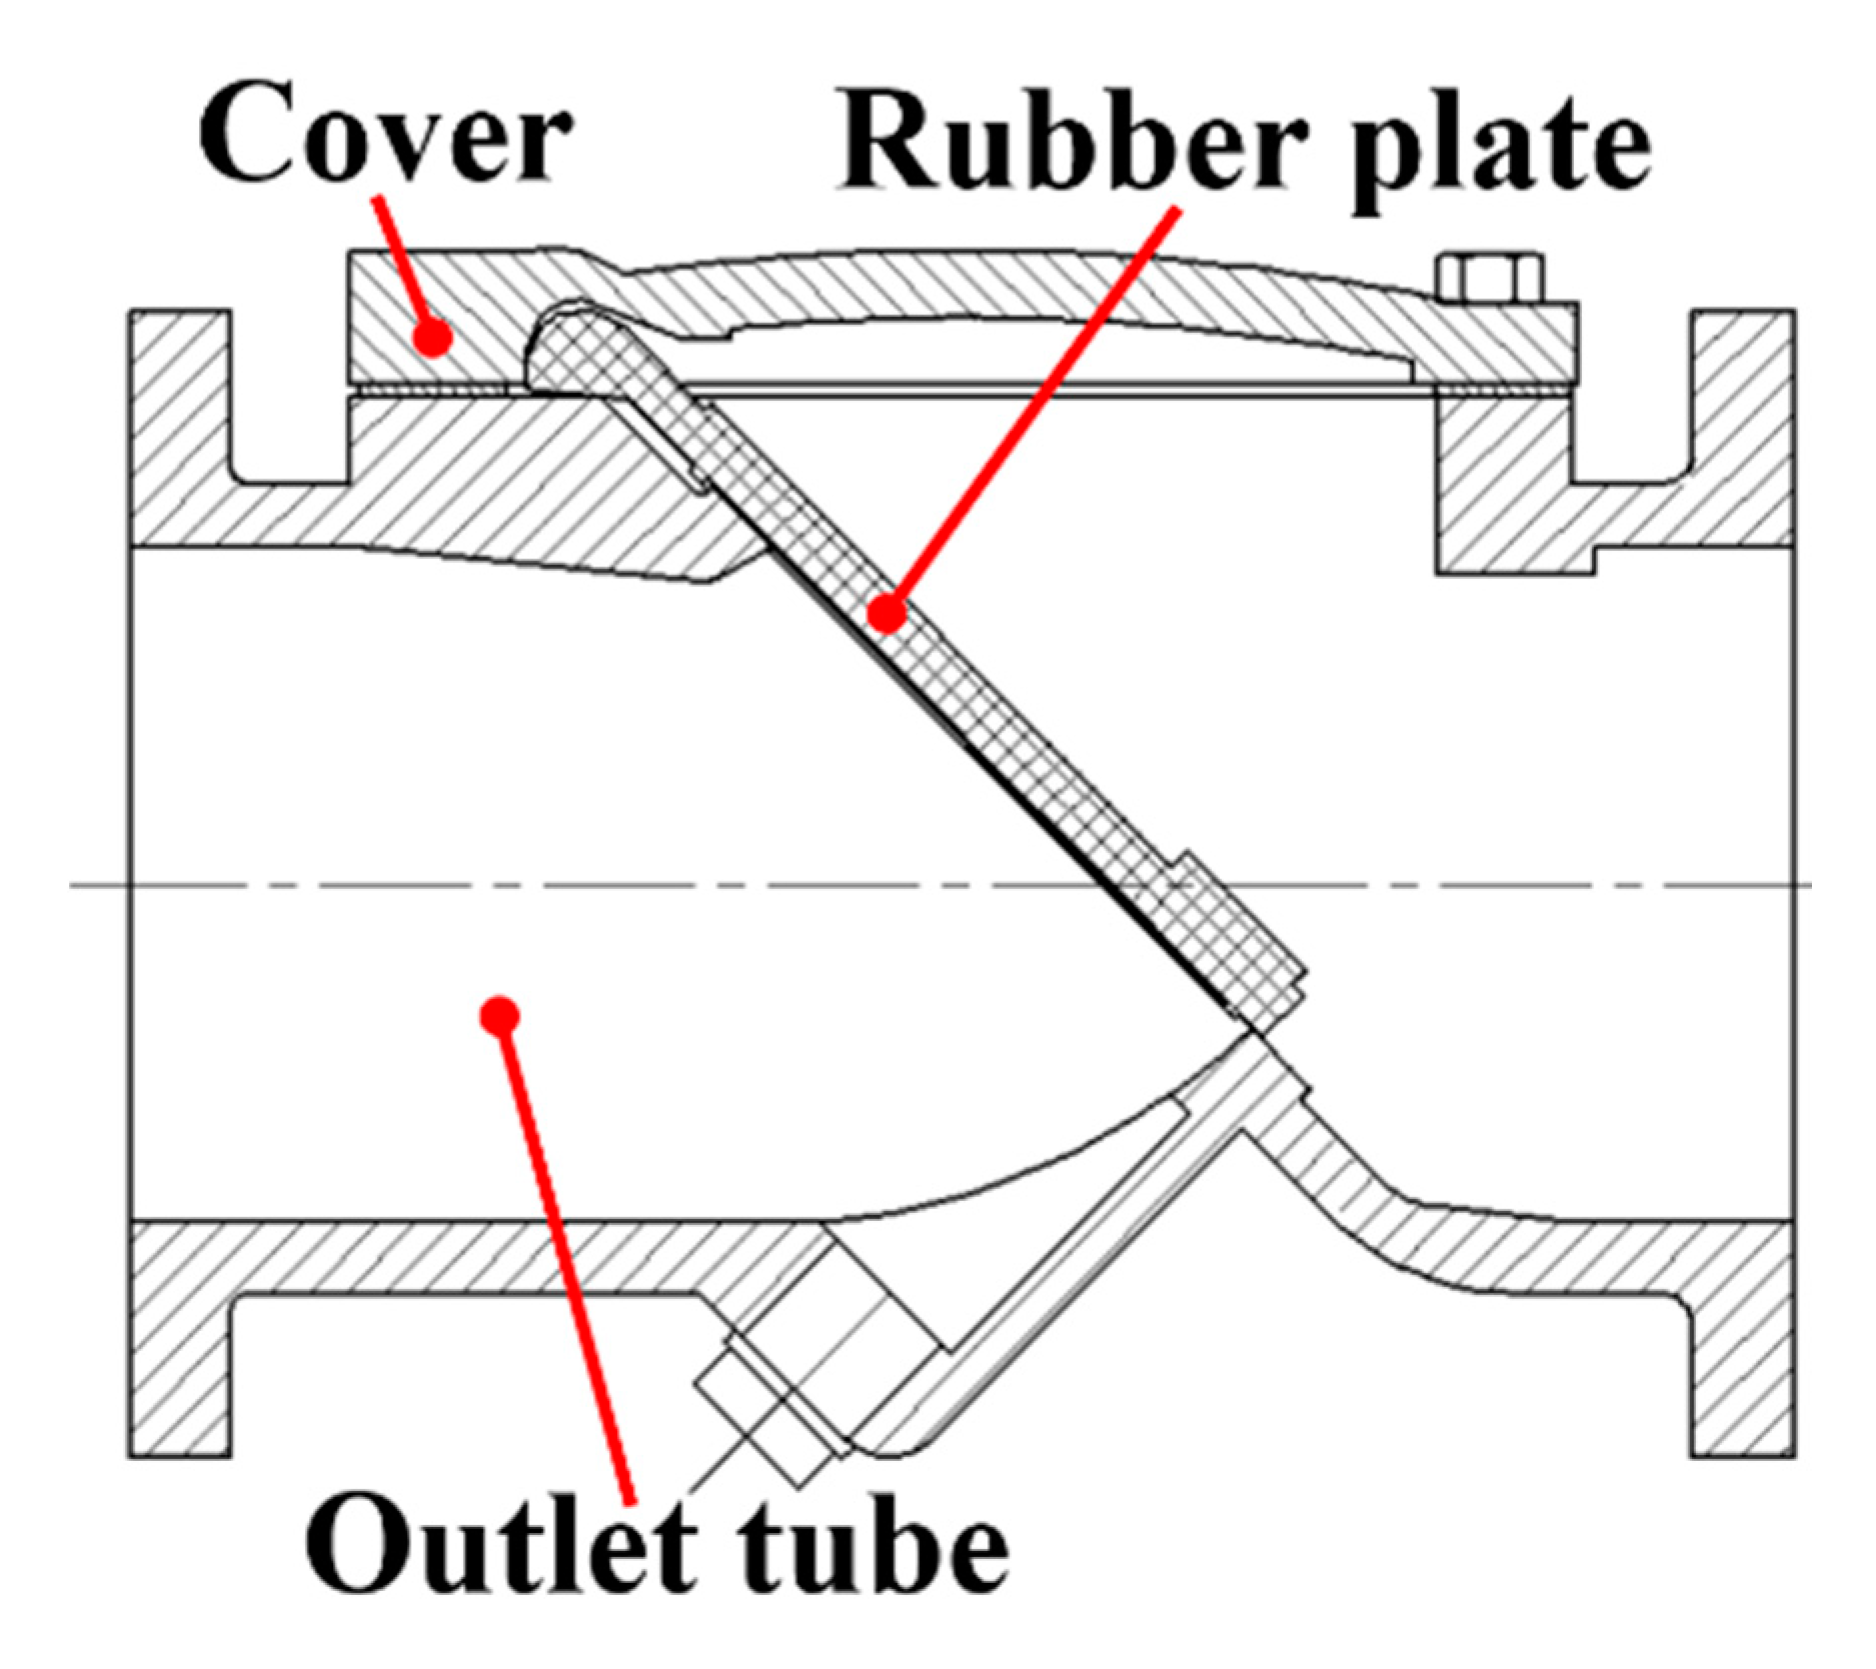
2. Structure of Novel Self-Priming Pump
3. Computational Model and Numerical Method
3.1. Computational Domain
3.2. Grid Generation
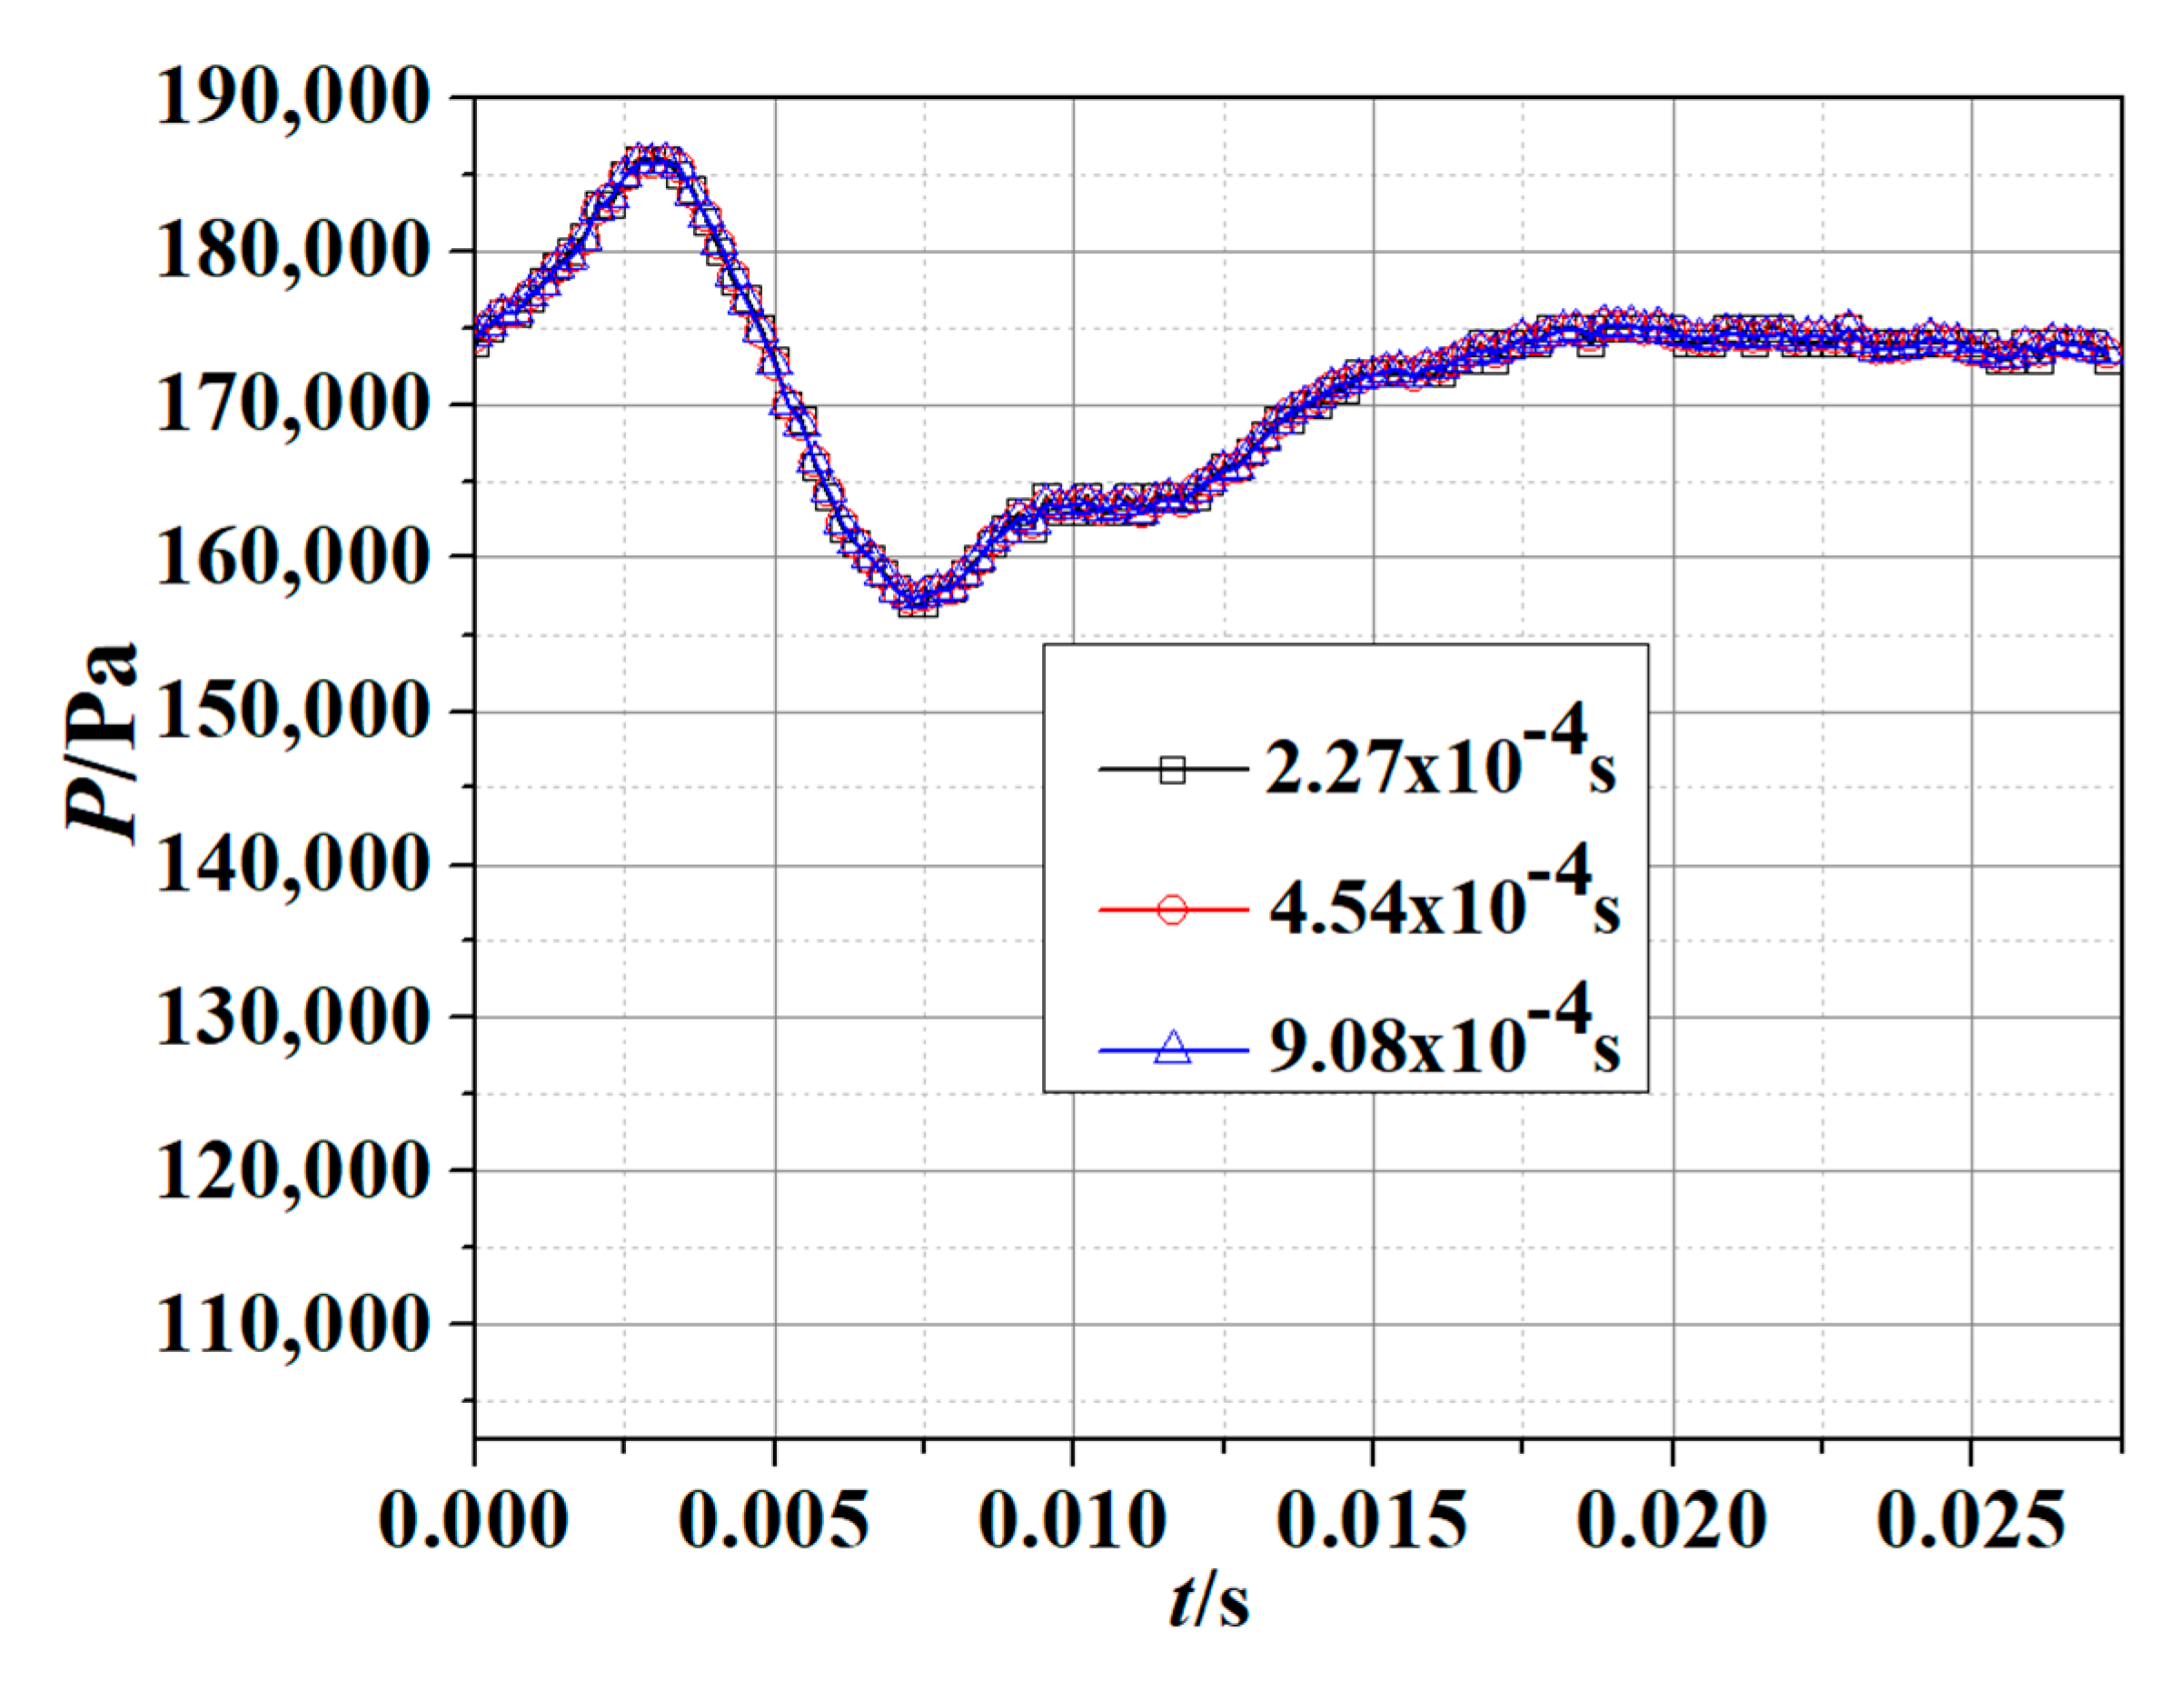
3.3. Calculation Method
4. Results and Discussion
4.1. Analysis of the Vortex Structure
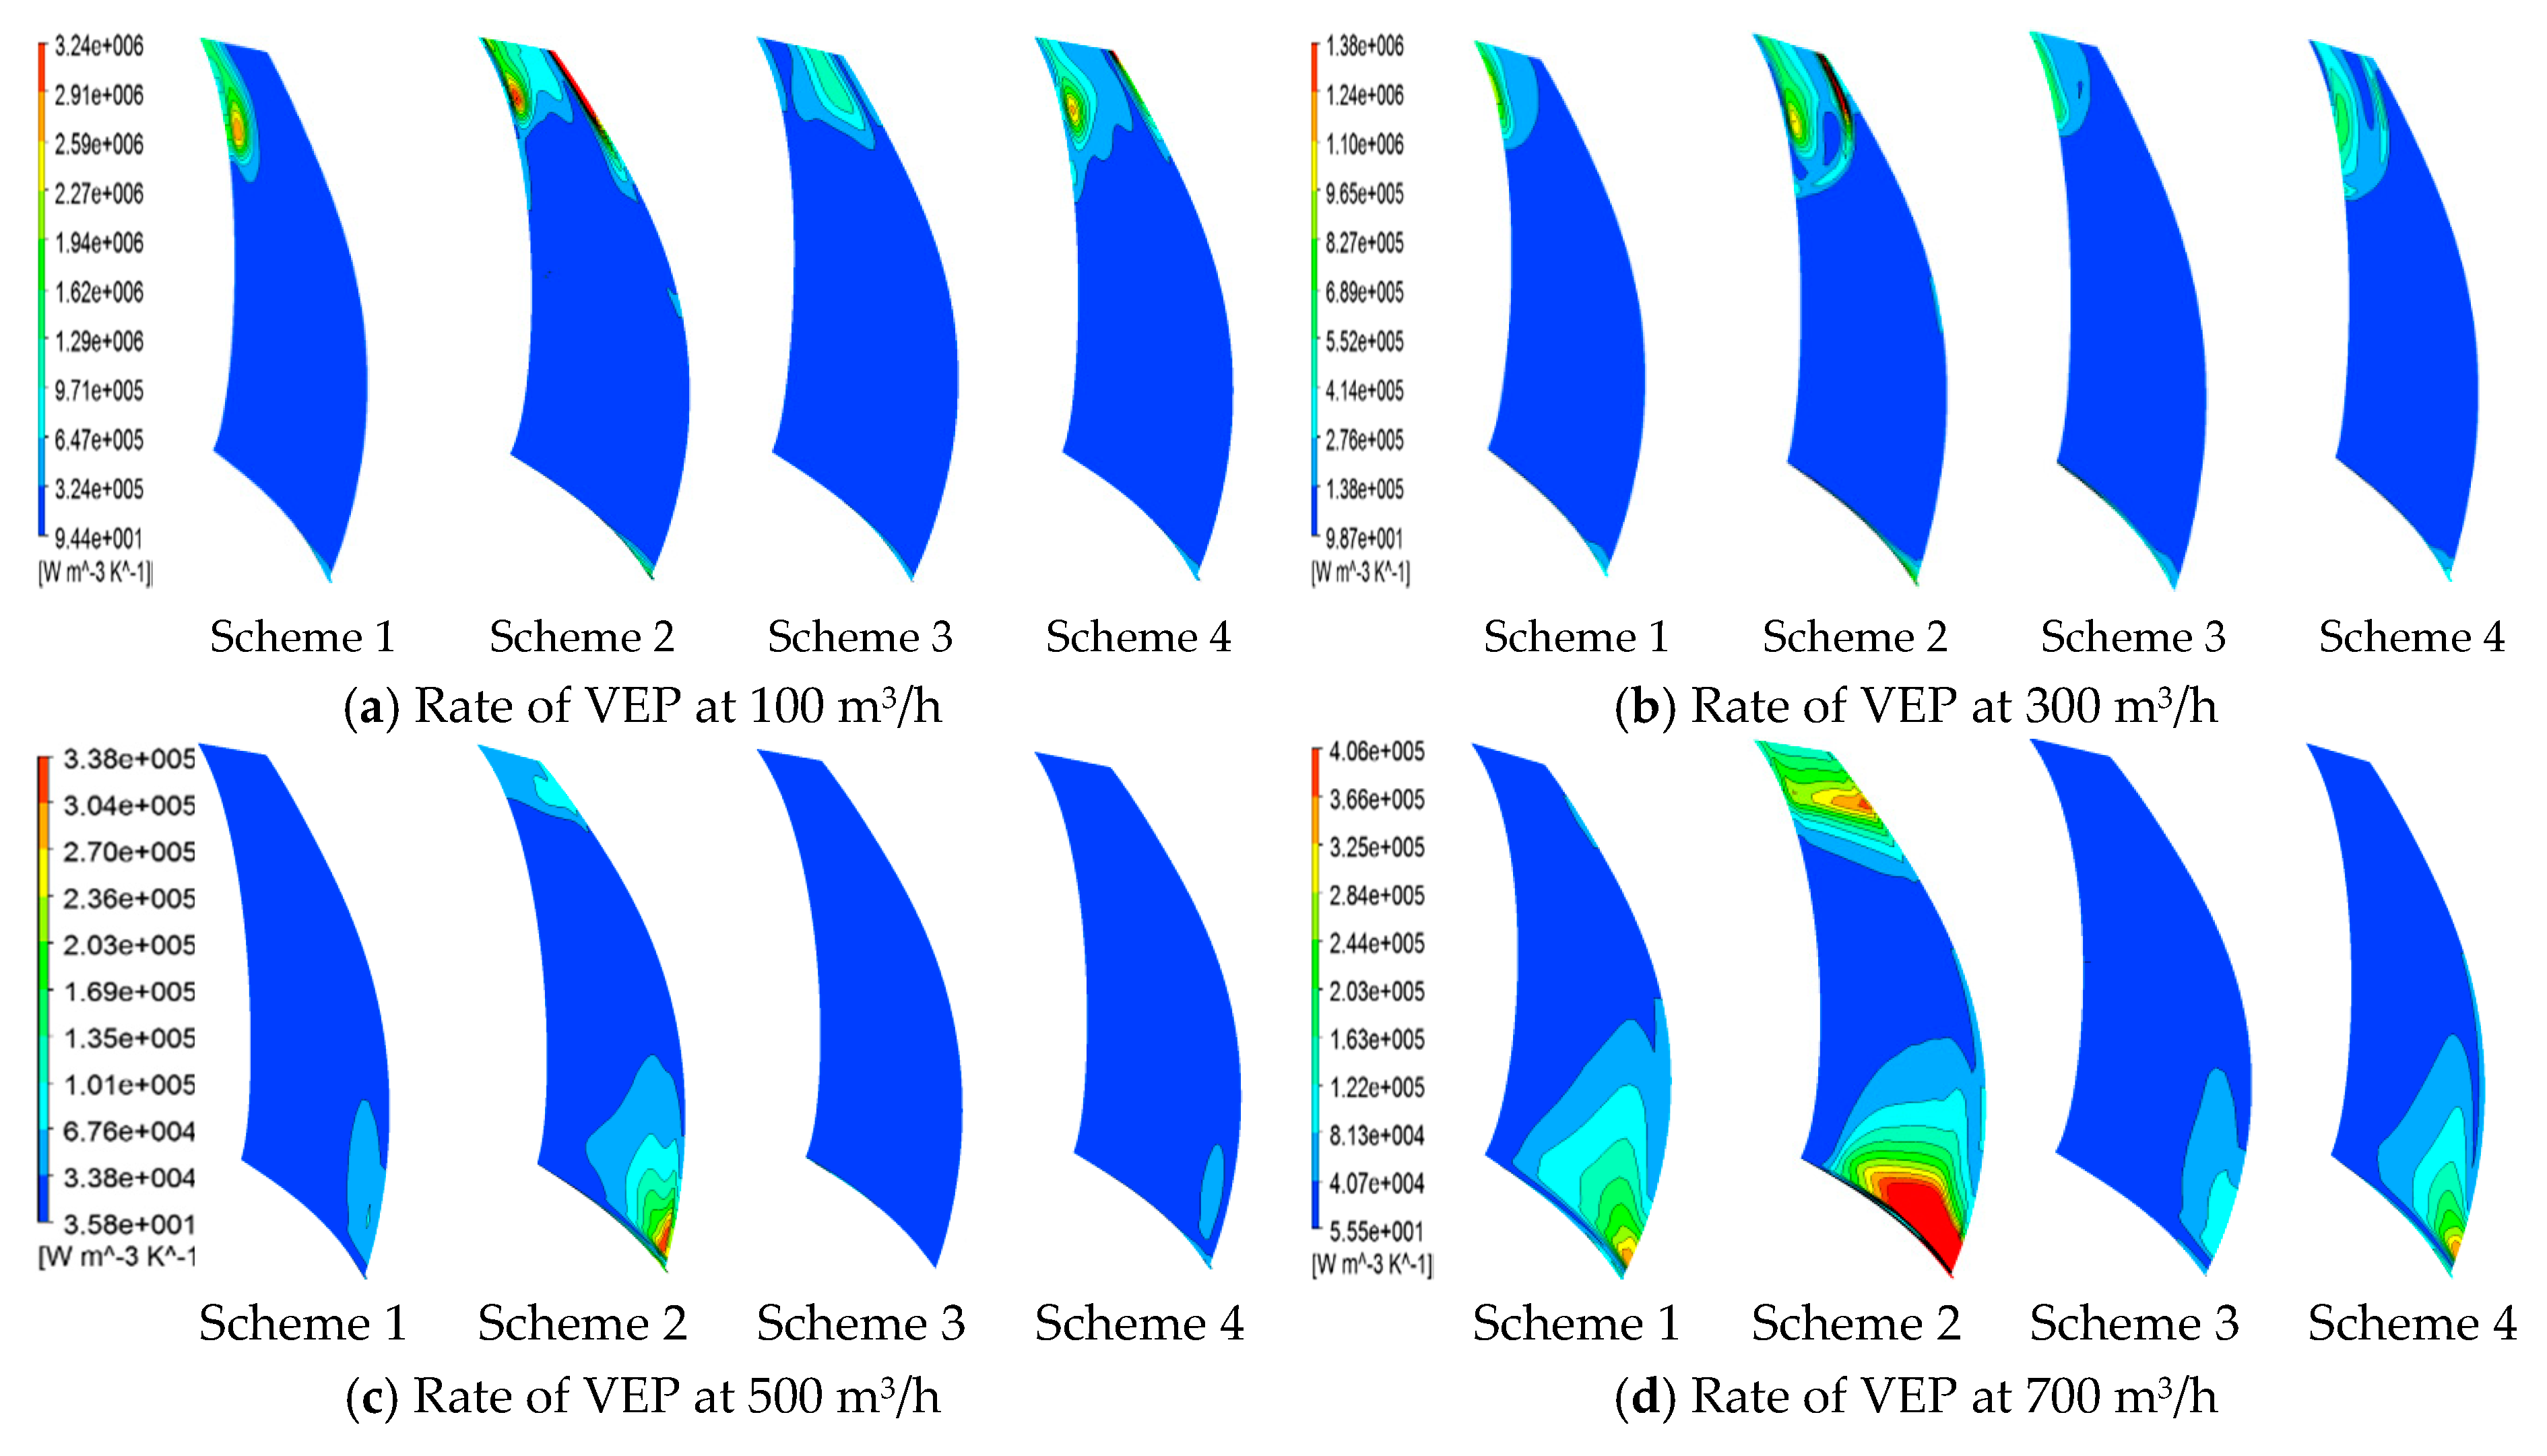
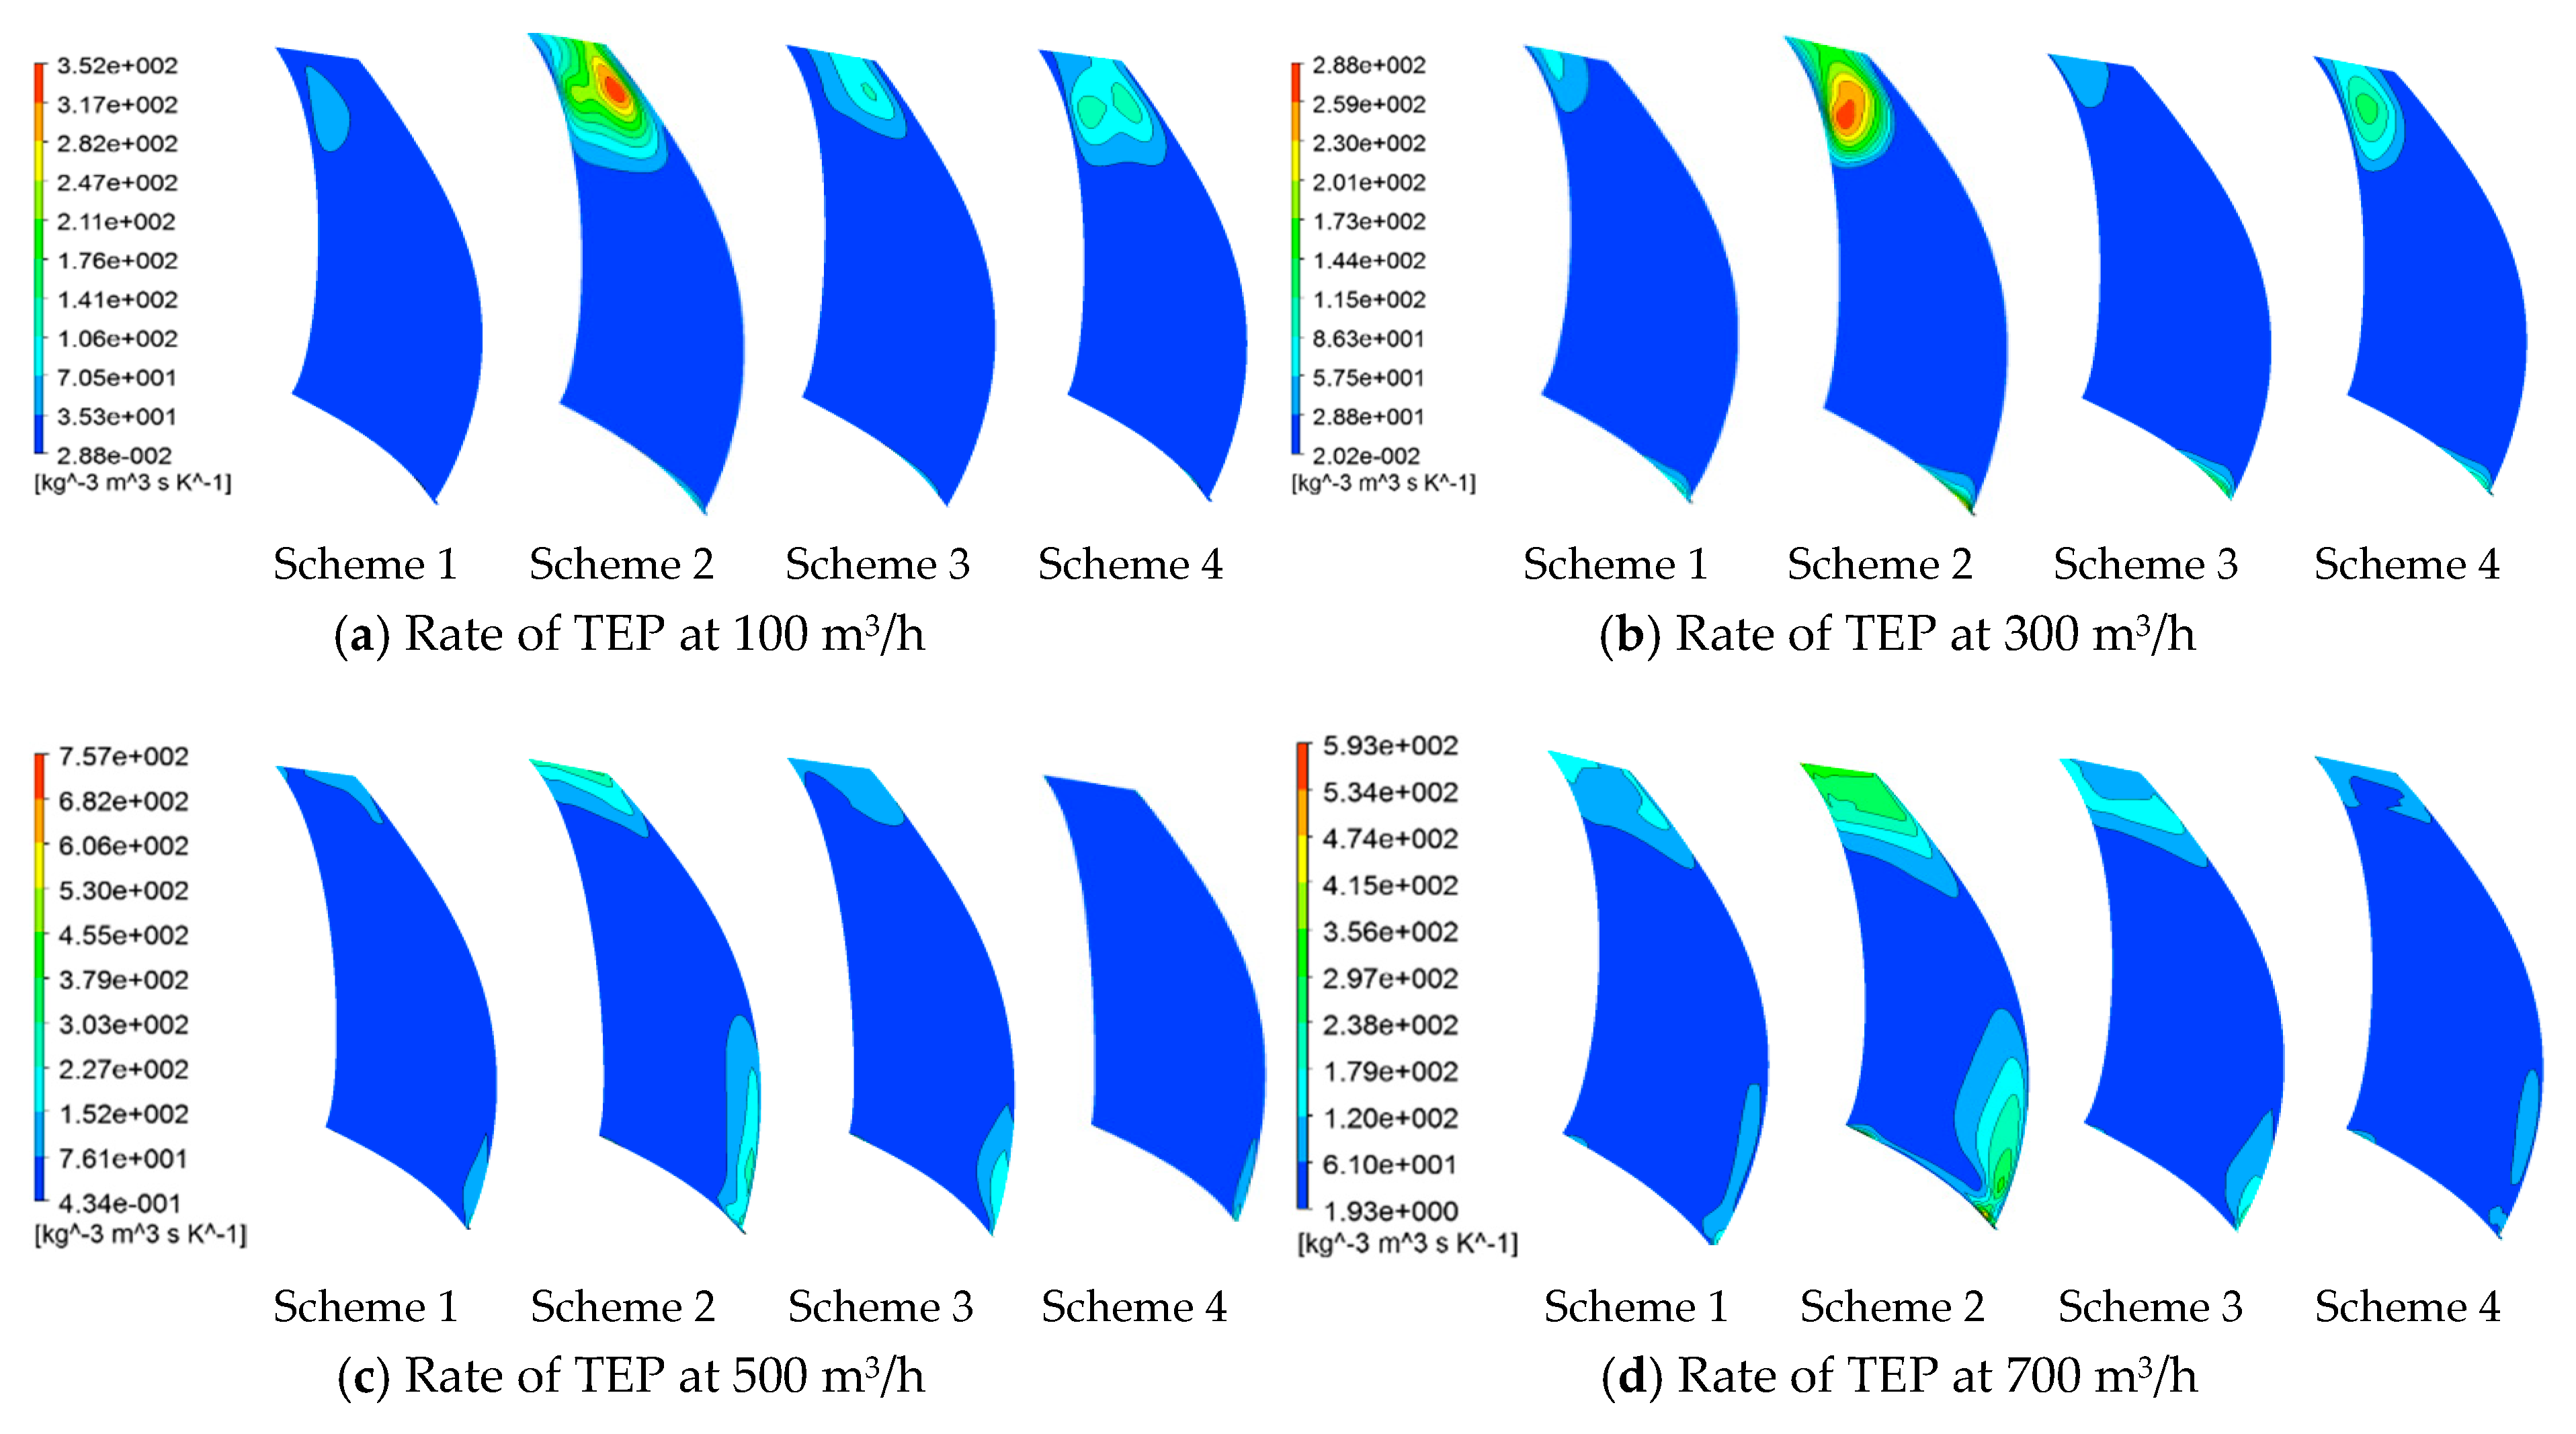
4.2. Energy Characteristic of the Pump
5. Hydraulic Performance of the Pump
6. Experiment Results
7. Conclusions
Author Contributions
Funding
Conflicts of Interest
Nomenclature
| H | head m |
| Qd | design flow condition, m3/h |
| n | rotation speed, r/min |
| ns | specific speed |
| D1 | impeller inlet diameter, mm |
| D2 | impeller outlet diameter, mm |
| Z | blade number |
| φ | blade wrap angles, ° |
| b1 | volute inlet width, mm |
| D4 | volute outlet diameter, mm |
| SST | shear stress transition |
| t | rotation period, s |
| LEV | leading edge vortex |
| TEV | trailing edge vortex |
| GLV | gap leakage vortex |
| PSB | suction surface of the blade |
| VDV | viscidity diffusion variable |
| VSV | vortex stretching variable |
| WEP | wall entropy production |
| VEP | viscidity entropy production |
| TEP | turbulence entropy production |
| ρ | density of water, kg/m3 |
| turbulence dissipation | |
| M | torque, Nm |
| QF | flow condition, m3/h |
| DP | deviation of the pressure transducer |
| DD | measurement deviation of dynamic head |
| DH | deviation of transducer turbine flowmeter |
| DM | measurement deviation of torque |
| DN | deviation of speed transducer |
| DT | measurement deviation of shaft power |
| DS | measurement deviation of experiment system |
References
- Turkyilmazoglu, M. Performance of direct absorption solar collector with nanofluid mixture. Energy Convers. Manag. 2016, 114, 1–10. [Google Scholar] [CrossRef]
- Wang, T.; Kong, F.; Xia, B.; Bai, Y.; Wang, C. The method for determining blade inlet angle of special impeller using in turbine mode of centrifugal pump as turbine. Renew. Energy 2017, 109, 518–528. [Google Scholar] [CrossRef]
- Elyamin, G.R.H.A.; Bassily, M.A.; Khalil, K.Y.; Mohamed, S.G. Effect of impeller blades number on the performance of a centrifugal pump. Alex. Eng. J. 2019, 58, 39–48. [Google Scholar] [CrossRef]
- Shao, C.; Zhou, J.; Cheng, W. Effect of viscosity on the external characteristics and flow field of a molten salt pump in the view of energy loss. Heat Mass Transf. 2019, 55, 711–722. [Google Scholar] [CrossRef]
- Nejad, J.; Riasi, A.; Nourbakhsh, A. Efficiency improvement of regenerative pump using blade profile modification: Experimental study. Proc. Inst. Mech. Eng. Part E J. Process Mech. Eng. 2019, 233, 448–455. [Google Scholar] [CrossRef]
- Han, X.; Kang, Y.; Li, D.; Zhao, W. Impeller optimized design of the centrifugal pump: A numerical and experimental investigation. Energies 2018, 11, 1444. [Google Scholar] [CrossRef]
- Jeon, S.Y.; Yoon, J.Y.; Jang, C.M. Optimal design of a novel ‘S-shape’ impeller blade for a microbubble pump. Energies 2019, 12, 179. [Google Scholar] [CrossRef]
- Nejad, J.; Riasi, A.; Nourbakhsh, A. Parametric study and performance improvement of regenerative flow pump considering the modification in blade and casing geometry. Int. J. Numer. Methods Heat Fluid Flow 2017, 27, 1887–1906. [Google Scholar] [CrossRef]
- Wang, C.; Hu, B.; Zhu, Y.; Wang, X.; Luo, C.; Cheng, L. Numerical study on the gas-water two-phase flow in the self-priming process of self-priming centrifugal pump. Processes 2019, 7, 330. [Google Scholar] [CrossRef]
- Wang, C.; He, X.; Zhang, D.; Hu, B.; Shi, W. Numerical and experimental study of the self-priming process of a multistage self-priming centrifugal pump. Int. J. Energy Res. 2019, 1–19. [Google Scholar] [CrossRef]
- Wang, C.; He, X.; Shi, W.; Wang, X.; Wang, X.; Qiu, N. Numerical study on pressure fluctuation of a multistage centrifugal pump based on whole flow field. AIP Adv. 2019, 9, 035118. [Google Scholar] [CrossRef]
- Wang, C.; Zhang, Y.; Hou, H.; Zhang, J.; Xu, C. Entropy production diagnostic analysis of energy consumption for cavitation flow in a two-stage LNG cryogenic submerged pump. Int. J. Heat Mass Transf. 2019, 129, 342–356. [Google Scholar] [CrossRef]
- Hou, H.; Zhang, Y.; Zhou, X.; Zuo, Z.; Chen, H. Optimal hydraulic design of an ultra-low specific speed centrifugal pump based on the local entropy production theory. Proc. Inst. Mech. Eng. Part A J. Power Energy 2019, 233, 715–726. [Google Scholar] [CrossRef]
- Gu, Y.; Pei, J.; Yuan, S.; Wang, W.; Zhang, F.; Wang, P.; Appiah, D.; Liu, Y. Clocking effect of vaned diffuser on hydraulic performance of high-power pump by using the numerical flow loss visualization method. Energy 2019, 170, 986–997. [Google Scholar] [CrossRef]
- Li, D.; Wang, H.; Qin, Y.; Han, L.; Wei, X.; Qin, D. Entropy production analysis of hysteresis characteristic of a pump-turbine model. Energy Convers. Manag. 2017, 149, 175–191. [Google Scholar] [CrossRef]
- Chang, H.; Li, W.; Shi, W.; Liu, J. Effect of blade profile with different thickness distribution on the pressure characteristics of novel self-priming pump. J. Braz. Soc. Mech. Sci. Eng. 2018, 40, 518. [Google Scholar] [CrossRef]
- Bai, L.; Zhou, L.; Han, C.; Zhu, Y.; Shi, W. Numerical study of pressure fluctuation and unsteady flow in a centrifugal pump. Processes 2019, 7, 354. [Google Scholar] [CrossRef]
- Bai, L.; Zhou, L.; Jiang, X.; Pang, Q.; Ye, D. Vibration in a multistage centrifugal pump under varied conditions. Shock Vib. 2019, 2057031. [Google Scholar] [CrossRef]
- Alfonsi, G.; Primavera, L. Temporal evolution of vortical structures in the wall region of turbulent channel flow. Flow Turbul. Combust. 2009, 83, 61–79. [Google Scholar] [CrossRef]
- Ji, B.; Luo, X.; Arndt, R.E.A.; Wu, Y. Numerical simulation of three-dimensional cavitation shedding dynamics with special emphasis on cavitation–vortex interaction. Ocean Eng. 2014, 87, 64–77. [Google Scholar] [CrossRef]
- Liu, Y.; Tan, L. Tip clearance on pressure fluctuation intensity and vortex characteristic of a mixed flow pump as turbine at pump mode. Renew. Energy 2018, 129, 606–615. [Google Scholar] [CrossRef]
- Wu, J.Z.; Ma, H.Y.; Zhou, M.D. Vorticity and Vortex Dynamic; Springer Science & Business Media: Berlin/Heidelberg, Germany, 2007. [Google Scholar]
- Hucan, H.; Zhang, Y.; Li, Z. A numerical research on energy loss evaluation in a centrifugal pump system based on local entropy production method. Therm. Sci. 2017, 21, 1287–1299. [Google Scholar]
- Chang, H.; Shi, W.; Li, W.; Liu, J. Energy loss analysis of novel self-priming pump based on the entropy production theory. J. Therm. Sci. 2019, 28, 306–318. [Google Scholar] [CrossRef]


| Parameter | Symbol | Value |
|---|---|---|
| Head | H | 45 m |
| Design flow condition | Qd | 500 m3/h |
| Rotation speed | n | 2200 r/min |
| Specific speed | ns | 172 |
| Impeller inlet diameter | D1 | 200 mm |
| Impeller outlet diameter | D2 | 280 mm |
| Blade numbers | Z | 6 |
| Blade wrap angles | φ | 120° |
| Volute inlet width | b1 | 80 mm |
| Volute outlet diameter | D4 | 200 mm |
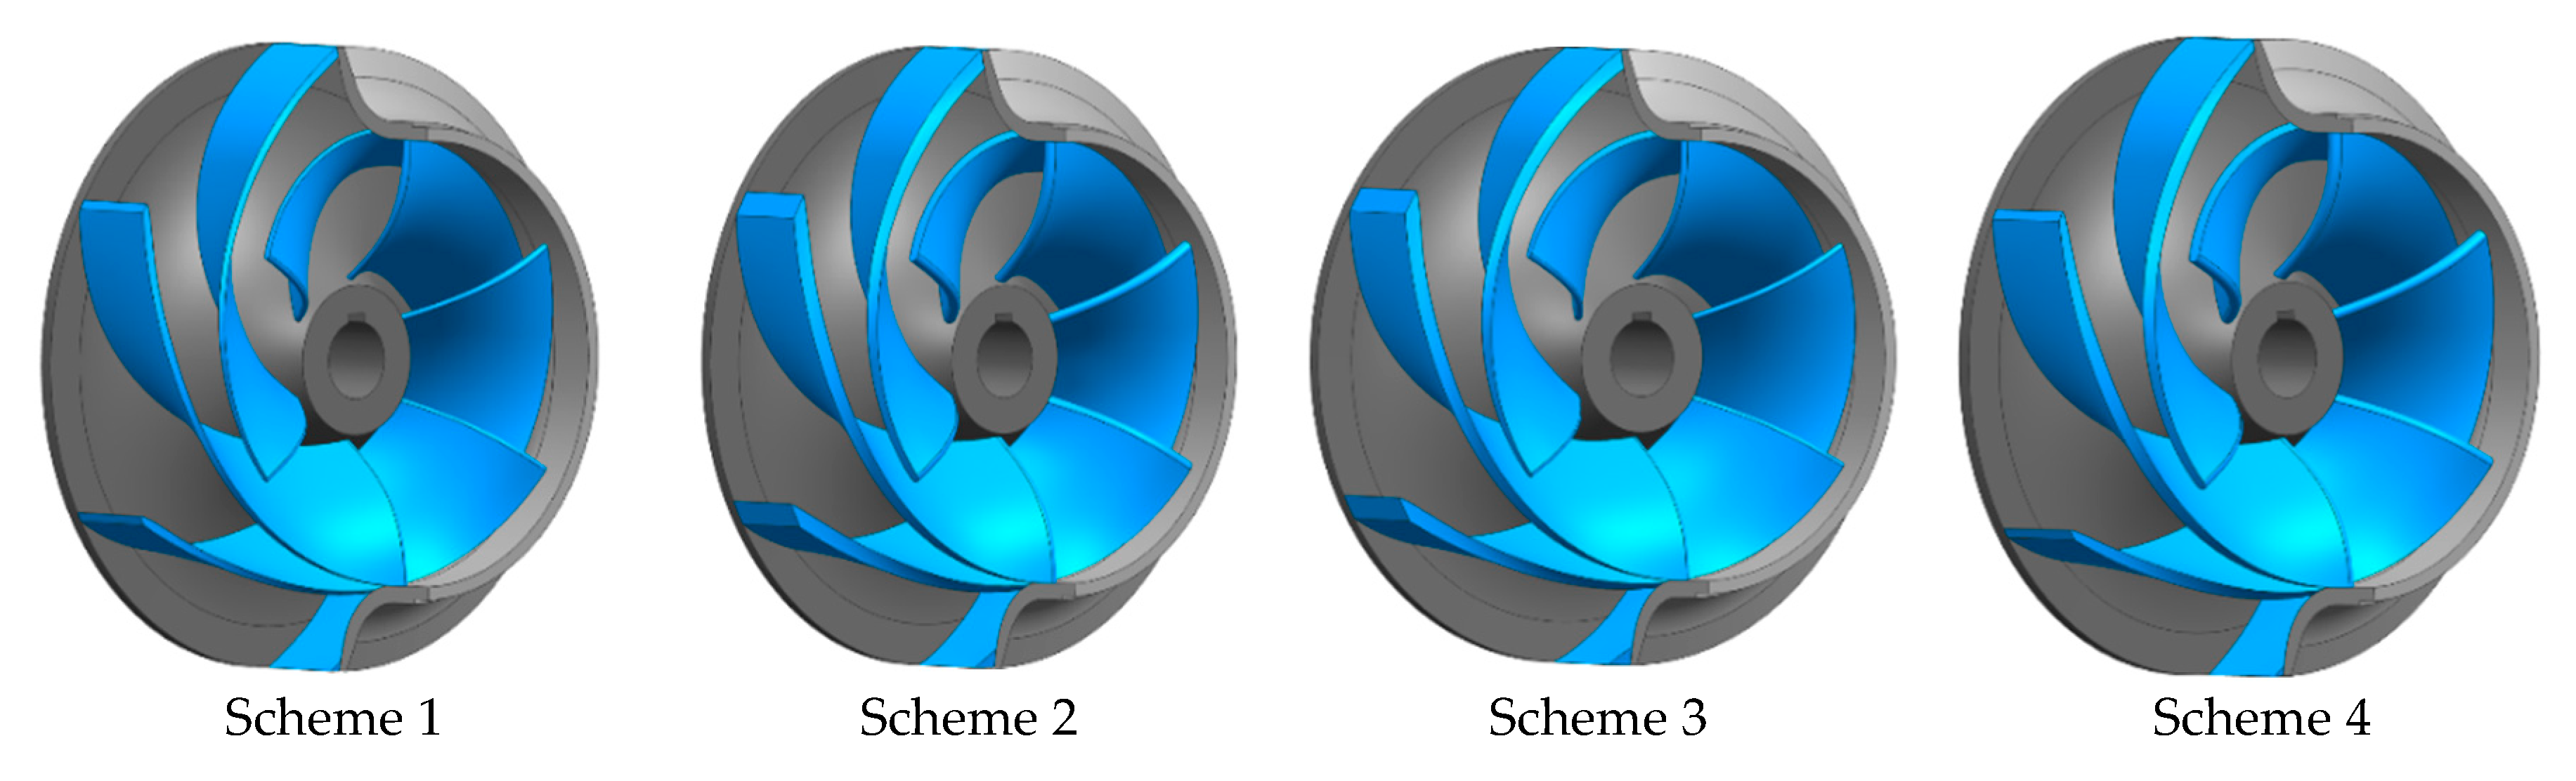
| Scheme | Thickness of Leading Edge (mm) | Thickness of Middle Part (mm) | Thickness of Trailing Edge (mm) |
|---|---|---|---|
| 1 | 3 | 3 | 3 |
| 2 | 6 | 6 | 6 |
| 3 | 3 | 6 | 6 |
| 4 | 6 | 6 | 3 |
| CFD Software | ANSYS CFX 17.1 |
|---|---|
| Turbulence model | SST k–ω |
| Flow medium | Water at 25 °C |
| Inlet boundary condition | Total pressure (1 atm) |
| Outlet boundary condition | Mass flow |
| Wall roughness | 50 μm |
| Steady state | Frozen rotor |
| Transient state | Transient rotor-stator |
| Advection scheme | High resolution |
| RMS residual | 0.00001 |
| Transient calculation time | 0.2 s |
| Time step | 4.54 × 10⁻⁴ s |
| Turbulence intensity | 5% |
© 2019 by the authors. Licensee MDPI, Basel, Switzerland. This article is an open access article distributed under the terms and conditions of the Creative Commons Attribution (CC BY) license (http://creativecommons.org/licenses/by/4.0/).
Share and Cite
Chang, H.; Agarwal, R.K.; Li, W.; Zhou, L.; Shi, W. Numerical and Experimental Study of a Vortex Structure and Energy Loss in a Novel Self-Priming Pump. Processes 2019, 7, 701. https://doi.org/10.3390/pr7100701
Chang H, Agarwal RK, Li W, Zhou L, Shi W. Numerical and Experimental Study of a Vortex Structure and Energy Loss in a Novel Self-Priming Pump. Processes. 2019; 7(10):701. https://doi.org/10.3390/pr7100701
Chicago/Turabian StyleChang, Hao, Ramesh K. Agarwal, Wei Li, Ling Zhou, and Weidong Shi. 2019. "Numerical and Experimental Study of a Vortex Structure and Energy Loss in a Novel Self-Priming Pump" Processes 7, no. 10: 701. https://doi.org/10.3390/pr7100701
APA StyleChang, H., Agarwal, R. K., Li, W., Zhou, L., & Shi, W. (2019). Numerical and Experimental Study of a Vortex Structure and Energy Loss in a Novel Self-Priming Pump. Processes, 7(10), 701. https://doi.org/10.3390/pr7100701